deterministic and probabilistic design of pressure vessels · o hemispherical head . ... dimensions...
TRANSCRIPT

Mr. Prashant Adalinge Student of Master of Engineering Mechanical Design
B.M.I.T Solapur
Maharashtra India
Mr. Abhay Gaur
Assistant Professor.
M.E in Mechanical Design Engineering
BMIT Solapur Maharashtra
India
Abstract—The pressure vessel is one of the large number
of plant components for which stress analyses must be
performed. A pressure vessel experiences stresses because of
pressure inside pressure vessel. Analytically, pressure vessels
are designed using ASME codes known as deterministic
approach. These conventional (or deterministic) analysis
techniques involve the use of safety factors as a way of
accounting for variation in analysis input parameters. This
often results in overly conservative designs. In some
situations, accounting for this variability within analysis can
be critical, or at least more cost-effective, than over-designing
products with expensive materials or manufacturing
processes. Recently, reliability and structural safety have been
given highest priority in plant products as there is direct
threat to human life. Hence, it is required to design critical
components such as pressure vessels for wide range of input
variations in geometry, material, loads and other operating
parameters without oversizing these critical components.
Design based on this approach gives information in advance
about impact of input variations and risk associated. Because
of the stochastic nature of many of the uncertainties,
probabilistic approach as opposed to a deterministic approach
is better suited. Probabilistic designs are widely adopted in
civil structural design, aircraft, and aerospace design. In this
work, the probabilistic design of pressure vessel is carried out
to know the effect of uncertainties. Probabilistic designing is
performed by using FEM package (ANSYS). Probabilistic
design uses Gaussian distribution for various input
(geometric, material and load) parameters. 100 samples have
been generated using Monte Carlo simulation technique.
Keywords — Pressure vessel; Probabilisitc design; FEA;
I. INTRODUCTION A pressure vessel is a closed container designed to hold
gases or liquids at a pressure substantially different from the ambient pressure [1]. Pressure vessels are used in a variety of applications in both industry and the private sector. They appear in these sectors as industrial compressed air receivers and domestic hot water storage tanks. Other examples of pressure vessels are diving cylinder, recompression chamber, distillation towers, autoclaves, and many other vessels in mining or oil refineries and petrochemical plants, nuclear reactor vessel, habitat of a space ship, habitat of a submarine, pneumatic reservoir, hydraulic reservoir under pressure, rail vehicle airbrake reservoir, road vehicle airbrake reservoir and storage vessels for liquefied gases such as ammonia, chlorine, propane, butane, and LPG.
The legal definition of pressure vessel varies from country to country, but often involves the maximum safe pressure that the vessel is designed for and the pressure − volume product, particularly of the gaseous part. In the United States, the rules for pressure vessels are contained in the American Society of Mechanical Engineers Boiler and Pressure Vessel Code.
Classification of Pressure vessels: Typically pressure vessels can be classified as mentioned below [2]:
Basis on wall thickness o Thin walled pressure vessels o Thick Walled pressure vessels
Basis on Heads [3] o Hemispherical head o Ellipsoidal Head o Torispherical Head o Flat Head o Diffuser Head
Analytically, pressure vessels are designed using
ASME codes [4] known as deterministic approach. These conventional (or deterministic) analysis techniques involve the use of safety factors as a way of accounting for variation in analysis input parameters. This often results in overly conservative designs. However, the validity or conservatism in the results from such analyses depends on the real-life variability or uncertainty of the input values. In some situations, accounting for this variability within analysis can be critical, or at least more cost-effective, than over-designing products with expensive materials or manufacturing processes [5]. Recently, reliability and structural safety have been given highest priority in plant products as there is direct threat to human life. Hence, it is required to design critical components such as pressure vessels for wide range of input variations in geometry, material, loads and other operating parameters without oversizing these critical components [6]. Design based on this approach gives information in advance about impact of input variations and risk associated.
The need to incorporate uncertainties in an engineering design has long been recognized. Because of the stochastic nature of many of the uncertainties, probabilistic approach as opposed to a deterministic approach is better suited. Thus, the probability of structural failure can be limited to a reasonable level maintained by a risk informed program. Today, risk informed technologies and probabilistic design are widely adopted in civil structural design, aircraft, and
Deterministic and Probabilistic Design of
Pressure Vessels
1540
International Journal of Engineering Research & Technology (IJERT)
Vol. 3 Issue 8, August - 2014
IJERT
IJERT
ISSN: 2278-0181
www.ijert.orgIJERTV3IS081051
(This work is licensed under a Creative Commons Attribution 4.0 International License.)

aerospace design. In this work, the probabilistic design of pressure vessel will be carried out to know the effect of uncertainties.
In spite of number of investigations devoted to pressure vessel research and analysis, there still remains to be developed a general approach capable of predicting the effects of variations in geometry, material and loading conditions on the behavior of pressure vessels. As seen from literature review, deterministic design approaches do not take into account uncertainties. Hence, this work proposes use of probabilistic design approach. Probabilistic design is an analysis technique for assessing the effect of uncertainties in input parameters and assumptions in the design. A probabilistic analysis allows determining the extent to which uncertainties in the model affect the results. The objective of the work presented here is design of pressure vessel considering uncertainties in input parameters within framework of FEA tool ANSYS. In view of this, following objectives are set for present study:
To design pressure vessel using ASME codes and validate design using ANSYS. This is traditional deterministic approach for design.
Design pressure vessel by using probabilistic design approach using ANSYS to study effect of input variations (geometric, material, loading and operating) on stress.
To study sensitivity and probability of input variation on stresses of pressure vessel.
II. DETERMINISTIC DESIGN
In deterministic design for one set of input one gets one
design. Deterministic design of pressure vessel uses ASME
codes. Deterministic design of pressure vessel can use
either design by rule or design by analysis using analytical
methods to calculate following stresses [7-9]:
Hoop (circumferential) Stress
Axial (longitudinal) Stress
Thermal stresses, if thermal loading is present.
A. Application of pressure vessels
Present work selects Propane (LPG) tanks which are used for vapor and/or liquid service. These propane storage tanks are built and tested in accordance with the ASME boiler and pressure vessel code section VIII division 1 for unfired pressure vessels. Present work selects propane cylinders used for industrial use built to 250 psi working pressure and they are typically vertical as shown in Fig. 1.
Figure 1: Vertical propane tanks
B. Input Specifications
All input specifications are converted to SI unit.
Henceforth, this work follows SI units for all calculations.
Table 1 shows inputs in both units.
Table 1: Input specifications of propane tank [10]
Design of Shell: Minimum shell thickness is calculated
using Eq. 1 given by ASME codes.
PSE
PRt
6.0
(1)
1.723689326.01160
452.121.72368932
t
(2)
mt 0.005
mmt 5
Parameters BTU SI units
Geometric:
Shell
Inner Diameter (Di) 35.6 in 0.90424 m
Outer Diameter (D0) 36 in 0.91440 m
Length of the vessel (L) 121 in 2.36220 m
Ellipsoidal
Head
Ratio 2:1 2:1
Material –
Steel SA
455
Youngs Elasticity (E) 30x106 psi 206.8x10³ MPa
Density 0.289 lb/in3 7700 Kg/m3
Yield Strength 520 MPa
Allowable Stress 160 MPa
Operating Operating Temp. 200 F 775.3 K
Environmental Temp. 98 F 423.15 K
Operating pressure (P) 250 psi 1.724 MPa
Factor of Safety (FOS) 2.5 2.5
Others Joint Efficiency 1 1
1541
International Journal of Engineering Research & Technology (IJERT)
Vol. 3 Issue 8, August - 2014
IJERT
IJERT
ISSN: 2278-0181
www.ijert.orgIJERTV3IS081051
(This work is licensed under a Creative Commons Attribution 4.0 International License.)

Design of Semi-Ellipsoidal Head: Minimum head
thickness is calculated using Eq. 3 given by ASME codes.
PSE
PDt
2.02
(3)
1.723689326.011602
904.241.72368932
t
(4)
t = 0.00488m
t 4.88 mm (rounded off)
For manufacturing simplicity, it is recommended to use
same thickness for shell as well as head i.e. 5.00 mm. Other dimensions of Semi-Ellipsoidal Head are calculated using ASME code and formulation. Flanged and dished elliptical 2:1 ratio ASME code type heads are used extensively in the construction of tanks for liquefied petroleum gas, air receivers, and other unfired pressure vessels. Present study uses same material as shell for head. Table 2 gives detailed design of ellipsoidal head using ASME codes.
Table 2: Geometrical design of ellipsoidal head
Ellipsoidal Head 2:1
ASME Code Section VIII, Div. 1, Art. UG-32
Di = Do – 2S S=5 mm (5)
r1 = 0.9Di r1 = 0.9 * 0.90424 *1000 = 813.816 mm (6)
r2 = 0.17Di r2 = 0.17 * 0.90424 *1000 = 153.721 mm (7)
h1 = 3s h1 = 3*5 = 15 mm (8)
h2 = 0.25Di h2 = 0.25 * 0.90424 * 1000 = 226.06 mm (9)
h3 = h1 + h2 h3 = 15 + 226.06 = 241.06 mm (10)
Circumferential Stress calculations for cylindrical shell:
After calculating minimum thickness for shell and head,
stresses are back calculated and checked the design for
safety. Circumferential Stress in Shell:
t
PR (11)
5
1000*0.452121.72368932
= 155.86 MPa < allowable limit 160 MPa
Stress calculations for semi ellipsoidal head: Stress in
head may not be same as in shell. Hence, check for stresses
in head is separately required. Stress in head is calculated
by Eq. 12. Meridional stress (Stress in Head):
2
2
2th
PR (12)
226.0652
1000)0.45212(1.72368932 2
σ = 155.86 MPa < allowable limit 160 MPa
In present case stresses in shell and head are same.
III. FINITE ELEMENT ANALYSIS AND ITS
BENCHMARKING USING ANSYS
Before performing probabilistic design, benchamarking
analysis is carried out using baseline inputs within FEA
framework. The FEA is a numerical procedure for
obtaining approximate solutions to many problems
encountered in engineering analysis [11]. During the last
two decades considerable advances have been made in the
applications of FEM techniques to analyze pressure vessel
problems [12-18].
Tabe 3 lists all inputs used in this analysis. In this
section parametric modeling approach, element selection,
meshing strategy and loading options have been
benchmarked and finalized.
Table 3: Parameters used for pressure vessel analysis
Parameter
Type
Parameter Baseline Input
Geometric Inner Radius 452.12 mm
Thickness 5.0 mm
Length 2362.0 mm
Material Youngs Modulus 206000 MPa
Poissions Ratio 0.33
Load Pressure 1.724 MPa
Pressure vessel FE analysis can be performed using
different approaches as mentioned below:
Axi-symmetric approach
Analysis on a quarter section
Analysis by drawing the complete vessel
This work uses axi-symmetry approach which
simplifies the model and also reduces the computational
time. This approach can be used if the geometry is revolved
about a particular axis. In ANSYS axi-symmetry is used
about Y-axis [19]. The pressure vessel under consideration involves the
parametric modeling using ANSYS APDL. The user needs to generate several models with different geometric properties as part of a probabilistic design requirement. Using this concept parametric CAD model can be generated in ANSYS using following set of APDL commands. CAD model is section of shell and head. Geometry is created using ASME code‟s parametric relations.
*SET,ri,452.12
*SET,ro,457.20
*SET,l,2362.0
t=(ro-ri)
r1=0.9*ri*2
r2=0.17*ri*2
1542
International Journal of Engineering Research & Technology (IJERT)
Vol. 3 Issue 8, August - 2014
IJERT
IJERT
ISSN: 2278-0181
www.ijert.orgIJERTV3IS081051
(This work is licensed under a Creative Commons Attribution 4.0 International License.)
h1=3*t
h2=0.25*ri*2
h3=h1+h2
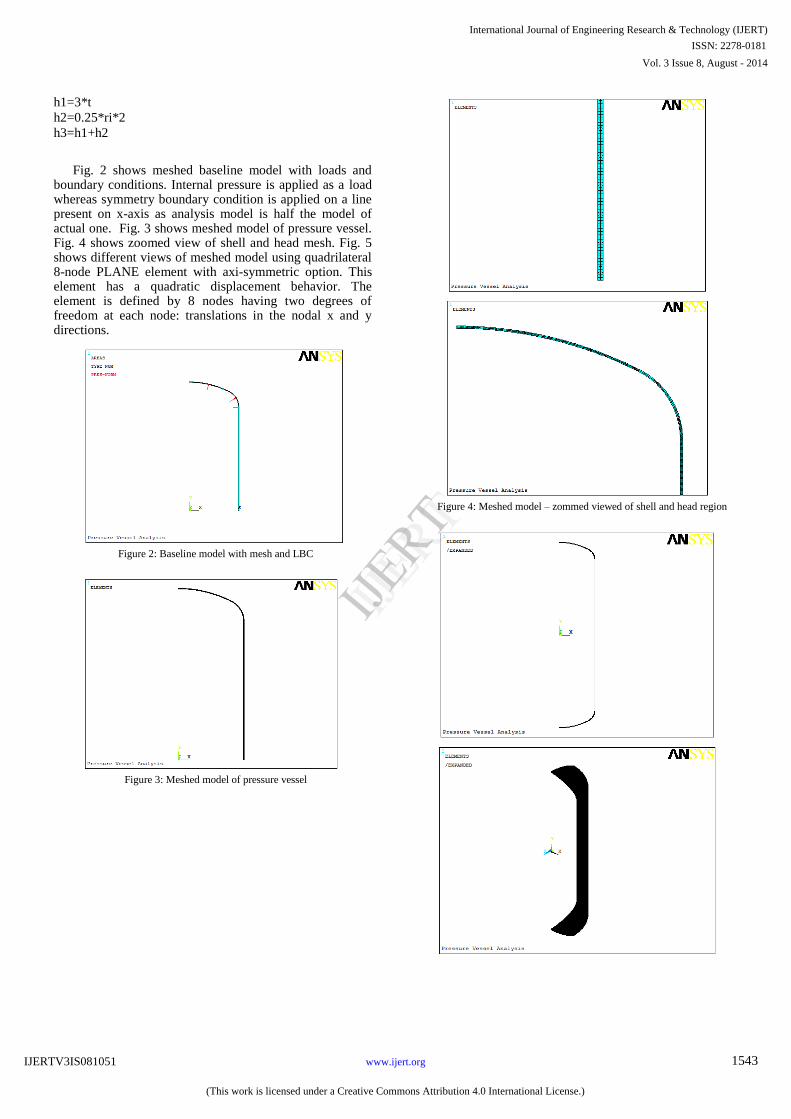
Fig. 2 shows meshed baseline model with loads and boundary conditions. Internal pressure is applied as a load whereas symmetry boundary condition is applied on a line present on x-axis as analysis model is half the model of actual one. Fig. 3 shows meshed model of pressure vessel. Fig. 4 shows zoomed view of shell and head mesh. Fig. 5 shows different views of meshed model using quadrilateral 8-node PLANE element with axi-symmetric option. This element has a quadratic displacement behavior. The element is defined by 8 nodes having two degrees of freedom at each node: translations in the nodal x and y directions.
Figure 2: Baseline model with mesh and LBC
Figure 3: Meshed model of pressure vessel
Figure 4: Meshed model – zommed viewed of shell and head region
1543
International Journal of Engineering Research & Technology (IJERT)
Vol. 3 Issue 8, August - 2014
IJERT
IJERT
ISSN: 2278-0181
www.ijert.orgIJERTV3IS081051
(This work is licensed under a Creative Commons Attribution 4.0 International License.)

Figure 5: Meshed model – different views
Stress and deflections results are typically studied for
pressure vessels. Fig. 6 shows stress distribution in baseline model of pressure vessel and maximum stress is 183 MPa. Fig. 7 shows deflection in baseline model of pressure vessel and maximum deflection is 0.7 mm. This figure shows deformed (colored) as well as undeformed pressue vessel (black). Stress reults are very close to theoretical result hence proposed analysis method can be used for further probabilistic design and analysis.
Figure 6: Von-Mises Stress distribution in baseline model of pressure
vessel
Figure 7: Deflection in baseline model of pressure vessel
IV. PROBABILISTIC DESIGN OF PRESSURE VESSEL
Probabilistic design is an analysis technique for assessing the effect of uncertain input parameters in the model. A probabilistic analysis allows you to determine the extent to which uncertainties in the model affect the results of a finite element analysis. An uncertainty (or random quantity) is a parameter whose value is impossible to determine at a given point [20].
In deterministic approach, pressure vessel models are expressed and described with specific numerical and deterministic values; material properties are entered using certain values, the geometry of the component is assigned a certain length or width, etc. Naturally, the results of a deterministic analysis are only as good as the assumptions and input values used for the analysis. The validity of those results depend on how correct the values are for the component under real life conditions.
In reality, every aspect of an analysis model is subjected to scatter (in other words, is uncertain in some way). Material property values are different if one specimen is compared to the next. This kind of scatter is inherent for materials and varies among different material types and material properties. Likewise, the geometric properties of components can only be reproduced within certain manufacturing tolerances. The same variation holds true for the loads that are applied to a finite element model. This means that almost all input parameters used in a finite element analysis are inexact, each associated with some degree of uncertainty.
It is neither physically possible nor financially feasible to eliminate the scatter of input parameters completely. The reduction of scatter is typically associated with higher costs either through better and more precise manufacturing methods and processes or increased efforts in quality control; hence, accepting the existence of scatter and dealing with it rather than trying to eliminate it makes products more affordable and production of those products more cost-effective.To deal with uncertainties and scatter, one can use the ANSYS Probabilistic Design System (PDS) to know effect of input scatter on output:
1544
International Journal of Engineering Research & Technology (IJERT)
Vol. 3 Issue 8, August - 2014
IJERT
IJERT
ISSN: 2278-0181
www.ijert.orgIJERTV3IS081051
(This work is licensed under a Creative Commons Attribution 4.0 International License.)

If the input variables of a finite element model are
subjected to scatter, how large is the scatter of the
output parameters? How robust are the output
parameters? Here, output parameters can be any
parameter that ANSYS can calculate.
If the output is subjected to scatter due to the
variation of the input variables, then what is the
failure probability?
Which input variables contribute the most to the
scatter of an output parameter and to the failure
probability? What are the sensitivities of the output
parameter with respect to the input variables?
Probabilistic design can be used to determine the effect
of one or more variables on the outcome of the analysis. Fig. 8 shows various paramters used for probabilistic design and analysis of pressure vessel. Present work considers:
Geometric parameters: Inner radius, Outer radius,
Length
Material parameters: Youngs modulus and poission
ratio
Load parameters: Pressure
Figure 8: Parameter distributions in pressure vessel during probablistic
design
All the parameters are considered as varying with Gaussian ( or Normal ) distribution as shown in Fig. 8. Baseline model inputs for spring are used. Using uncertainties in above stated three parameters (see Table 4), probabilistic design is perforemed using ANSYS to know sensitivity of each parameter on stress and deflection. PDS within ansys uses Monte Carlo Simulation approach and analysis was looped through 100 sample points considering the variations defined in the input variables and the corresponding statistical analysis of the output parameters.
Table 4: Parameters used in probabilistic design of pressure
vessel Parameter
Type
Parameter Distribution
Type
Mean
(or Baseline)
Standard
Deviation or
Limits
Geometric Inner Radius Normal 452.12 mm 9.0
Thickness Normal 5.0 mm 0.70
Length Normal 2362.0 mm 23.62
Material Youngs
Modulus
Normal 206000 MPa 4120.0
Poissions
Ratio
Normal 0.33 0.033
Load Force Normal 1.724 MPa 0.085
The ANSYS APDL commands can be used to perform the entire probabilistic design analysis by creating input file and submitting it as a batch job. The usual process for probabilistic design consists of the following general steps. The items in parentheses indicate which ANSYS processor is necessary to perform the given task.
1. Create an analysis file for use during looping. The file
should represent a complete analysis sequence and
must do the following:
Build the model parametrically (PREP7).
Obtain the solution(s) (SOLUTION).
Retrieve and assign to parameters the quantities
that will be used as random input variables and
random output parameters (POST1/POST26).
2. Establish parameters in the ANSYS database which
correspond to those used in the analysis file.
3. Enter PDS and specify the analysis file (PDS).
4. Declare random input variables (PDS).
5. Visualize random input variables (PDS). Optional.
6. Specify any correlations between the RVs (PDS).
7. Specify random output parameters (PDS).
8. Choose the probabilistic design tool or method (PDS).
9. Execute the loops required for the probabilistic design
analysis (PDS).
10. Fit the response surfaces (if you did not use a Monte
Carlo Simulation method) (PDS).
11. Review the results of the probabilistic analysis (PDS).
V. RESULTS AND DISCUSSION
One of the objective of this research is to study
probabilistic response analysis of pressure vessel. Hence,
this section present results of probabilistic design results.
An overview on the data is provided by several graphics in
the next few pages.
Fig. 9 to 14 shows sample history for various input
parameters. Each figure shows following data:
Mean – This is as given in input Table 4
Standard deviation – This is given in input Table 4
Skewness – A measure of the asymmetry of the
probability distribution
Kurtosis – A measure of the peakedness of the
probability distribution
Minimum – Minimum value within sample history
Maximum - Maximum value of within sample history
1545
International Journal of Engineering Research & Technology (IJERT)
Vol. 3 Issue 8, August - 2014
IJERT
IJERT
ISSN: 2278-0181
www.ijert.orgIJERTV3IS081051
(This work is licensed under a Creative Commons Attribution 4.0 International License.)

Figure 9: Sample history for thickness
Figure 10: Sample history for inner radius
Figure 11: Sample history for length
Figure 12: Sample history for modulus of elasticity
Figure 13: Sample history for poissions ratio
Figure 14: Sample history for internal pressure
1546
International Journal of Engineering Research & Technology (IJERT)
Vol. 3 Issue 8, August - 2014
IJERT
IJERT
ISSN: 2278-0181
www.ijert.orgIJERTV3IS081051
(This work is licensed under a Creative Commons Attribution 4.0 International License.)

Fig. 15 shows sample history for output parameters i.e.
von-Mises stress.
Figure 15: Sample history for von-Mises stress
Fig. 16 to 21 graphically depicts a histogram of each
input and output parameters. The values given on each
distribution plot were mean value, standard deviation,
skewness, kurtosis, minimum value and maximum value,
respectively. Values of skewness and kurtosis are very
close to zero indicating validity of normal distribution. Red
colored line shows distribution fitted within 100 samples.
All the inputs confirm to the input distribution type.
Figure 16: Histogram of thickness
Figure 17: Histogram of inner radius
Figure 18: Histogram of length
Figure 19: Histogram of Youngs Modulus
1547
International Journal of Engineering Research & Technology (IJERT)
Vol. 3 Issue 8, August - 2014
IJERT
IJERT
ISSN: 2278-0181
www.ijert.orgIJERTV3IS081051
(This work is licensed under a Creative Commons Attribution 4.0 International License.)

Figure 20: Histogram of Poissons ratio
Figure 21: Histogram of internal pressure
Fig. 22 shows the value of mean, standard deviation,
skewness, kurtosis, maximum and minimum value for von-
Mises stress. Although all input parameters vary using
normal distribution function but output stress don‟t follow
same. It can be seen from values of Kurtosis and Skewness.
Figure 22: Histogram of von-Mises stress
Technical products are typically designed to fulfill
certain design criteria based on the output parameters. For
pressure vessel, a design criterion is that the stress should
be within allowable limit. The cumulative distribution
curve for von-Mises stress is shown in Fig. 23. The line in
middle is the probability P. The upper and lower curves in
Fig. 23 are the confidence interval using a 95% confidence
level. The confidence interval quantifies the accuracy of
the probability results.
Figure 23 : 95% confidence interval for von-Mises stress
After the reliability of the pressure vessel has been
quantified, it may happen that the resulting value is not
sufficient. Then, probabilistic methods can be used to
answer the following question: Which input variables
should be addressed to achieve a robust design and
improve the quality? The answer to that question can be
derived from probabilistic sensitivity diagrams plot.
The result of the proposed method is Spearman rank-
order correlation to determine which random parameters
are most significant in affecting the uncertainty of the
design. The sensitivity analysis results obtained are shown
in Fig. 24. The sensitivities are given as relative values (bar
chart) and relative to each other (pie chart). From Figures
as shown below, the thickness and internal pressure have
significant influence on the von-Mises stress. On the other
hand, inner radius, length, modulus of elasticity and
poissions ratio have insignificant influence on von-mises
stresses.
1548
International Journal of Engineering Research & Technology (IJERT)
Vol. 3 Issue 8, August - 2014
IJERT
IJERT
ISSN: 2278-0181
www.ijert.orgIJERTV3IS081051
(This work is licensed under a Creative Commons Attribution 4.0 International License.)

Figure 24: Sensitivity plot for von-Mises stress
While the sensitivities point indicate which
probabilistic design parameters one need to modify to
have an impact on the reliability probability, scatter plots
give a better understanding of how and how far one
should modify the sensitive input variables. Improving the
reliability and quality of a product typically means that the
scatter of the relevant random output parameters must be
reduced. To reduce the scatter of the random output
parameter to improve reliability and quality, one has two
options:
Reduce the width of the scatter of the most important
random input variables
Shift the range of the scatter of the most important
random input variables
Fig. 25 and 26 shows scatter of sensitive input parameters
on von-Mises stress. Scatter of sensitive parameters for
stress is as expected and follows particular increasing or
decreasing trend.
Figure 25: Scatter of thickness for von-Mises stress
Figure 26: Scatter of internal pressure for von-Mises stress
VI. CONCLUSIONS
Major conclusions for present study are listed as below:
Successfully carried out probabilistic design of
pressure vessels used using ANSYS PDS feature.
Probabilistic design uses Gaussian distribution for various
input parameters and simulation uses Monte Carlo
simulation technique for sampling.
From study it appears that the thickness and
internal pressure have significant influence on the output
parameter i.e. von-Mises stress. On the other hand,
modulus of elasticity and poissions ratio, inner radius and
length have a insignificant influence on von-Mises stress.
Analytically calculated stress in pressure vessel
(baseline model) is lower than allowable limit of material.
This ensures safe design of pressure vessel based on ASME
calculations. These results have been validated using
commercial FEA tool ANSYS and error is within 10%.
REFERENCES
[1] http://en.wikipedia.org/wiki/Pressure_vessel [2] David Roylance, “Pressure vessel”, Department of Material Science
and Engineering, Massachusetts Institute of Technology, Cambridge, MA 02139, August 23, 2001.
[3] http://www.weisstaler.de [4] ASME Boiler and Pressure Vessel Code (1992 edition) Code Case
N-47-29 [5] http://www.nafems.org/downloads/benchmark/july05/knowledge_ba
se-008.pdf [6] P. Bhattacharjee Structural Reliability Assessment of Pressure
Vessel. Journal of Aerospace Quality and Reliability. Vol.5 pp 159-163 Jan 2009.
[7] Dennis Moss, “Pressure vessel” published by Gulf Professional Publishing, 3rd Edition
[8] VB Bhandari, “Design of Machine Elements”, TATA McGraw Hill, New Delhi
[9] Donatello, Annaratone, "Pressure vessel design", ISBN-10 3-540-49142-2 springer berlin heidelberg new york, springer-verlag berlin heidelberg, (2007)
[10] http://www.hansontank.com/ [11] Nitin S. Gokhale, Sanjay S. Despande, Dr. Anand N. Thite, Practical
Finite Element Analysis, Finite To Infinite, 1st Ed. 2007 [12] Afshari, P. et al., A finite element approach to Aanalysis of pressure
vessels and piping, 1989 Int. ANSYS Conf, ed. D. E. Dietrich, SAS, Vol. 1, 1989, p. 41.
[13] Aggarwal, S. K. et al., Comparisono f stressesin different type pressure vessel heads by finite element method, Period. Polytech., 24 (1980) 91-108.
1549
International Journal of Engineering Research & Technology (IJERT)
Vol. 3 Issue 8, August - 2014
IJERT
IJERT
ISSN: 2278-0181
www.ijert.orgIJERTV3IS081051
(This work is licensed under a Creative Commons Attribution 4.0 International License.)

[14] Alujevic, A. et al., Analysis of heavy steel pressure vessels using the finite element method, Strojniski Vestn., 25 (1979) 157-9
[15] Asada S, et al. Verification of alternative criteria for shakedown evaluation using flat head vessel. ASME Press Vess Piping Conf, PVP 2002;439:17–22.
[16] Estrada H. Axisymmetric analysis of a laminated cylindrical shell with variable thickness. Int SAMPE Tech Conf, Long Beach 2004;2589–98.
[17] Guillot MW, Helms JE. Comparison of different methodologies for stress analysis of reinforcing pads. ASME Press Vess Piping Conf, PVP 2003;459:75–9.
[18] Kim YJ, et al. Estimation of non-linear deflection for cylinder under bending and its application to CANDU pressure tube integrity assessment. Nuclear Engng Des 2003;223(3):255–62.
[19] www.ansys.com/ [20] Stefan Reh , Jean-Daniel Beley Et al., (2005), „Probabilistic finite
element analysis using ANSYS‟, University of Applied Sciences, Berliner Tor 21, D-20099 Hamburg, Germany.
1550
International Journal of Engineering Research & Technology (IJERT)
Vol. 3 Issue 8, August - 2014
IJERT
IJERT
ISSN: 2278-0181
www.ijert.orgIJERTV3IS081051
(This work is licensed under a Creative Commons Attribution 4.0 International License.)
