determining the tensile response of materials at high ... the tensile response of materials at high...
TRANSCRIPT

Contents lists available at ScienceDirect
Optics and Lasers in Engineering
journal homepage: www.elsevier.com/locate/optlaseng
Determining the tensile response of materials at high temperature usingDIC and the Virtual Fields Method
Guillermo Valeri, Behrad Koohbor, Addis Kidane⁎, Michael A. Sutton
Department of Mechanical Engineering, University of South Carolina, 300 Main Street, SC 29208, Columbia
A R T I C L E I N F O
Keywords:Digital image correlationFull-field deformationTensile propertiesVirtual fields method304 stainless steel
A B S T R A C T
An experimental approach based on Digital Image Correlation (DIC) is successfully applied to predict theuniaxial stress-strain response of 304 stainless steel specimens subjected to nominally uniform temperaturesranging from room temperature to 900 °C. A portable induction heating device equipped with custom madewater-cooled copper coils is used to heat the specimen. The induction heater is used in conjunction with aconventional tensile frame to enable high temperature tension experiments. A stereovision camera systemequipped with appropriate band pass filters is employed to facilitate the study of full-field deformation responseof the material at elevated temperatures. Using the temperature and load histories along with the full-field straindata, a Virtual Fields Method (VFM) based approach is implemented to identify constitutive parametersgoverning the plastic deformation of the material at high temperature conditions. Results from theseexperiments confirm that the proposed method can be used to measure the full field deformation of materialssubjected to thermo-mechanical loading.
1. Introduction
Determining the mechanical response of materials at elevatedtemperatures is a subject of great interest in metal forming as well asaerospace and aero-engine industries. Measurement of the deforma-tion response under tensile loading at high temperatures is essential toestablish the thermomechanical and thermophysical properties ofmaterials as a basis for determining the reliability of a component orstructure exposed to elevated temperatures. However, there are certainchallenges associated with accurate measurement of high temperaturetensile response of materials. Conventionally, high temperature tensilebehavior of an engineering material is obtained by conducting experi-ments in well-controlled environments while measuring the globaldeformation response using extensometers [1,2]. In this context, theterm extensometer refers to either contact or non-contacting methodsthat provide an average measurement over a specified gage length.Although this methodology provides acceptable results and is widelyused in engineering applications, accuracy of the deformation mea-surements will be highly sensitive to the equipment used in theexperiment. Moreover, in cases where the presence of local phenomenagives rise to considerable localization of deformation, extensometer-based strain measurements may not provide quantitative evidence ofsuch deformation localization phenomena [3]. On the other hand,temperature-resistant strain gages provide a reliable approach for
strain measurements performed at significantly high temperatures,with the capability to measure the strain localizations. However, theapplication of such temperature-resistant strain gages is limited topoint measurements and relatively lower working temperatures [4–6].
Recent advances in the area of non-contacting full-field measure-ments have proven to provide reliable alternatives for the conventionalmaterial testing methods. In particular, digital image correlation (DIC)is one of the most appealing techniques, having the capability ofproviding accurate information on the deformation response of mate-rials subjected to extreme conditions, with the benefit of use ofstraightforward specimen preparation [7]. Three dimensional DIC(3D-DIC) has the capability to adjust the spatial resolution, ability totake measurements on curved surfaces [8] and on specimens havingdifferent sizes and/or shapes [9–11]. The method has also been shownto be suitable both for static and dynamic measurements [8,12]. Thefirst work in this area was performed by Lyons et al. [14] in 1996. Inthis study, the authors conducted a series of experiments to assess thecapabilities of 2D DIC in the measurement of full-field deformations atelevated temperatures. It was found that the variations in the refractiveindex of heated air outside the furnace can result in substantial imagedistortions. It was also found in this work that the visible thermalradiation emitted by the material when heated to temperatures above650–700 °C alters the contrast and the intensity of the speckle pattern,and consequently introduces significant amounts of errors to the image
http://dx.doi.org/10.1016/j.optlaseng.2016.11.004Received 28 August 2016; Received in revised form 8 October 2016; Accepted 7 November 2016
⁎ Correspondence to: Department of Mechanical Engineering (Room A132), University of South Carolina, 300 Main Street, SC 29208, Columbia.E-mail address: [email protected] (A. Kidane).
Optics and Lasers in Engineering 91 (2017) 53–61
0143-8166/ © 2016 Elsevier Ltd. All rights reserved.
crossmark

correlation process. More recent works have studied DIC for measuringstrains at temperatures ranging from room temperature to 1200 °C.Grant et al. [15] presented a method that overcomes the black bodyradiation issue by implementation of optical filters and special illumi-nation sources, providing accurate DIC measurements up to 1100 °C.In another research, Wu et al. [16] implemented a single-lens 3D-DICapproach to measure the thermal linear expansion of an aluminaceramic plate up to a temperature of 1200 °C. In this work, Wu et al.[16] proposed a calibration-free single lens 3D-DIC system based onbilateral telecentric lens and a bi-prism to facilitate measurement ofout-of-plane displacements at high temperature conditions.
Another limitation associated with the application of DIC at hightemperatures is due to the deteriorating effect of extreme temperatureson the speckle pattern. In recent years, the application of novelspeckling methods capable of sustaining integrity and efficiency atextreme temperatures has been studied. Application of temperature-resistant coatings such as LSI boron nitride and aluminum oxide-basedceramic coatings [14], temperature resistant white Y2O3 paint andother ceramic paints [17] a mixture of black cobalt oxide with liquidcommercial inorganic adhesive [18] and the use of plasma sprayedtungsten powder as the speckle pattern are examples on novelspeckling methods, facilitating the application of DIC in temperaturesup to 2600 °C [13].
With the rapidly growing applications of digital image correlation inthe area of material characterization, further research is required toestablish simpler high temperature DIC techniques that overcome thepreviously described limitations. It is also beneficial to devise experi-mental techniques that employ portable heating systems compatiblewith multiple testing machine configurations and for different samplesizes and geometries, in order to take advantage of the convenience ofthe DIC's simple and versatile setup equipment. In light of this, thepresent work focuses on the application of a portable high temperature3D DIC measurement system that can be employed with a wide rangeof specimen geometries and sizes. The effectiveness of the system isverified by successfully conducting tensile experiments at temperaturesup to 900 °C to study the thermomechanical properties of a 304stainless steel specimens. The advantage of conducting full-fieldmeasurements over the conventional test methodologies are high-lighted in an analytical study based on the method of virtual fields,which facilitates the identification of the constitutive response of thematerial with acceptable accuracy.
2. Experimental
2.1. Material and specimen geometry
Flat dog-bone specimens are extracted from an as-received plate ofcommercially available low-carbon 304 stainless steel. This material isselected due to its non-magnetic and excellent scaling resistancecharacteristics. Tensile specimens are coated with a thin layer ofultra-high temperature resistant white yttrium oxide spray paint. Themaximum working temperature for yttrium oxide coating used in thiswork is reported by the manufacturer as 1500 °C. A high temperatureblack silica-based ceramic paint is then applied on top of the whitecoating to obtain a fine speckle pattern, used for the image correlationpurposes. Black speckle particles with an average size of 50 µm areproduced in this way. Specimens are kept at room temperature for 24 hto let the paint fully dry. Fig. 1 illustrates a tensile specimen with amagnified view of the speckle pattern in the area of interest.
2.2. Tensile experiments
Tensile experiments are initially carried out at room temperature toobtain the reference stress-strain response of the material. To do so,the specimen is inserted into hydraulic clamp grips of a conventionaltensile frame. The specimen is then loaded in displacement control
mode at a constant cross-head speed of 10 mm/min. The synchronizedload data is used with the measured strain data to determine the truestress. True strain and true strain rates are determined using the full-field strain data obtained from DIC, as discussed in more detail inforthcoming sections.
To conduct experiments at high temperatures, an induction heatingsystem is used in conjunction with the tensile frame used in roomtemperature experiment. The induction heating system employed is aportable table-top unit [17,19]. Using the appropriately dimensionedcoil system, the induction heating system is suitable for a wide varietyof specimen geometries and loading systems [19]. The induction heateris equipped with a water-cooled copper coil system that heats up thespecimen at a rate of 1.6 °C/s and provides relatively uniformtemperature distribution in the heated area. Prior to the onset of thetensile experiments, a steel specimen is clamped at the bottom grip ofthe tensile machine inside the coil and heated to the target tempera-ture. After a dwell time of several minutes to achieve nominallyuniform conditions at the target temperature, the specimen is clampedat the top grip and the tensile loading experiment is immediatelyinitiated. Target temperatures used in this work are 300 °C, 500 °C,700 °C and 900 °C. The temperature of the specimen is measuredduring the tensile experiments using a non-contacting infra-redthermometer, with a nominal measurement accuracy of ± 1 °C.Temperature history of the specimen at the location of the area ofinterest is recorded at the same sampling rate used for load and imageacquisitions. Reproducibility of the results is ensured by conductingseveral experiments per target temperature. Fig. 2 illustrates theexperimental setup in this work. Note that the heating coil system ispositioned such that the maximum temperature is always achievedinside the area of interest. Due to the fact that the deformation ismostly localized in areas over which the highest temperature is applied,the camera system was positioned by making sure the location of thelocalized necking would be encompassed inside the area of interest.
2.3. Imaging and digital image correlation
Three-dimensional digital image correlation is utilized to measurethe full-field deformation response of the specimens subjected totensile loading at high temperature. To this purpose, a pair of 5 MPCCD cameras, each equipped with a 100 mm macro lens is used toacquire stereo images during deformation. Synchronized stereo image
Fig. 1. (a) Tensile specimen geometry with a magnified view of the area of interestshown in (b). All dimensions in mm.
G. Valeri et al. Optics and Lasers in Engineering 91 (2017) 53–61
54

pairs are captured at full-field resolution of 2448×2048 pixel2. Stereoimage pairs are acquired continuously at a rate of 1 frame per secondfor the 25×12.7 mm2 area of interest shown in Fig. 2b. The region ofinterest is located at the center of the specimen surface. The imageacquisition rate is synchronized with the load-cell data sampling ratevia a data acquisition system.
Radiation from a heated object can significantly alter the intensityof the images captured by ordinary imaging equipment. The variationof image intensity is proportional to the spectral energy emitted from aheated object, whereas the radiation energy is itself a function oftemperature and wavelength, as described by the Planck's radiation law[18]:
I λ T hcλ e
( , ) = 2 1− 1hc λkT
2
5 / (1)
where I λ T( , ) is the spectral radiation energy, λ is wavelength, T isabsolute temperature; h, c and k are Planck's constant, speed of lightand the Boltzmann constant, respectively. Variation of spectral energywith respect to temperature is plotted in Fig. 3 for three wavelengths inthe range of visible light. It is clearly indicated that the radiation energyincreases substantially at temperatures > 700 °C, while this increase ismore significant at larger wavelengths. It is noted that the energyvariation of the wave with the shortest wavelength is negligiblecompared with the other two waves. The shortest wavelength shownhere (450 nm) corresponds to the visible blue light, indicating that the
use of blue light illumination can considerably reduce the error due tothe intensity change.
Since such variations in the intensity of the images at hightemperatures can introduce significant error to the image correlationprocess, a method is required to resolve this issue. In this regard, oneapproach is to eliminate the unwanted radiative light using appropriateoptical filters and then add in illumination from a separate, stablesource that will provide sufficient illumination for the experiment. Toeliminate the unwanted radiative light, the imaging system should beequipped with appropriate filters which allow for the transmission of aspecific range of wavelengths consistent with that of the illuminationsource and well-removed from the higher intensity radiative illumina-tion wavelengths. Accordingly, blue band pass filters (BP470, suppliedby Midwest Optical Systems, Inc.) with a wavelength range of 425–495 nm are used to eliminate the contribution of unwanted wave-lengths. The other beneficial effect of blue band pass filters is shownschematically in Fig. 4. As depicted in Fig. 4, the maximum transmis-sion efficiency of the blue band pass filters takes place in a range ofwavelengths over which the quantum efficiency of the camera is alsohighest. To further demonstrate the efficiency of the utilized blue bandpass filter, images captured at 900 °C with and without the blue filterare shown in Fig. 5. A simple visual comparison of these images showsthat the radiative component at high temperature conditions deterio-rates image contrast when the filter is not in use.
Images captured during specimen deformation are used as input tothe software Vic-3D (Correlated Solutions, Inc.) for image correlationand further quantitative analysis. Details concerning the image corre-lation process are reported in Table 1. Different strain components arecomputed using the full-field displacement data employing a Gaussianfiltering and a filter size of 15. Strain rate is calculated over the area ofinterest using the full-field strain data and applying a simple centraldifference scheme as:
ε tε t Δt ε t Δt
Δt ( ) =
( + ) − ( − )2yy
yy yy
(2)
where subscript ‘yy’ denotes vertical direction, and Δt is interframetime (Δt=1 s).
3. Strain measurment performance
To evaluate the strain measurement performance at each tempera-ture, a set of 9 stationary images were taken from the area of interest ina strain-free state. In a strain-free condition, full-field strains are
Fig. 2. (a) Experimental setup with a magnification of the area of interest shown in (b).
Fig. 3. Variation of radiation energy with temperature, for three different wavelengthswithin the range of visible light.
Fig. 4. Variation of quantum efficiency of the camera and the transmission efficiency ofthe utilized band-pass filter as a function of wavelength.
G. Valeri et al. Optics and Lasers in Engineering 91 (2017) 53–61
55

expected to show zero values over the entire region of interest.However, due to various strain uncertainty sources, correlated imagestaken from strain-free specimens show strain patterns in the form ofrandomly distributed noise. To quantify the strain noise in ourmeasurements, the mean value and standard deviation of the full-fieldstrain data obtained from the strain-free conditions were obtained.Fig. 6 shows both the standard deviation (variability) and the meanvalue (bias) of the full-field strain data at selected temperature levels.Mean strain curves indicate negligible non-zero values, confirming thatthe data is essentially unbiased. Standard deviation curves shown inFig. 6b indicate strain variability on the order of several hundredmicrostrains, the value of which increases with temperature.
Since the measured strain variability is considerably smaller thanthe actual applied strains, both the magnitude and overall trends in themeasurements are consistent with the actual specimen response.However, in cases where these levels of noise are important, e.g. incase of measuring elastic modulus at high temperature conditions [14],
Fig. 5. Gray level images acquired at (a) room temperature, (b) 900 °C with bandpass filter and (c) 900 °C without filter.
Table 1Image correlation details used in the present study.
Full-field measurement technique 3D DIC (Vic-3D)
Subset 25×25 pixel2
Step 6 pixelMagnification factor 20 µm/pixelStrain filtering (filter size) Gaussian (15)Matching criterion Normalized squared differencesInterpolation Optimized 8-tap interpolationShape function Affine
Strain variability 350 °C 110 µε600 °C 324 µε800 °C 360 µε900 °C 400 µε
Fig. 6. Variation of (a) mean and (b) standard deviation in stationary images captured at strain-free conditions in different temperatures.
G. Valeri et al. Optics and Lasers in Engineering 91 (2017) 53–61
56

then approaches such as image averaging may be necessary tominimize the noise. Another approach is to perform spatial smoothingof the strain data to reduce strain variability [12]. Spatial smoothingcan be readily achieved in several ways; large strain filters [7] and two-dimensional surface fitting. Owing to the insignificant influences ofstrain noise levels in our final results, no spatial smoothing isperformed in the present work.
4. Identification of visco-plastic constitutive response
The objective in this work is to utilize the virtual fields method(VFM) in conjunction with our full-field measurements to identify thevisco-plastic constitutive response of the examined material over atemperature range of 25 °C to 900 °C. To this purpose, the constitutiveresponse of the material is first considered to take the general form ofthe Johnson-Cook model [1] as:
σ A Bε C ε T= ( + )(1 + ln *)(1 − * )pn m (3)
where σ and εp are flow stress and effective plastic strains, respectively;ε* denotes plastic strain rate normalized with the reference quasi-staticstrain rate; and T* denotes the homologous temperature, defined as:
T T TT T
* = −−M
0
0 (4)
in which T0 and TM represent reference temperature (298 K) andabsolute melting temperature (1700 K) of the material, respectively.Parameters A, B, n, C and m in Eq. (3) are material constants that needto be identified experimentally. The first three constants, i.e. A, B andn, can be readily obtained from the quasi-static stress-strain curveextracted at reference strain rate and temperature conditions and bythe use of simple curve fitting. Fig. 7 shows the experimental truestress-strain curve plotted at reference strain rate and temperature.Accordingly, parameters A, B and n are identified as 393 MPa,743.1 MPa and 0.568, respectively, at a reference strain rate of4.7×10−4 s−1.
The main idea here is to identify the other material parameters Cand m using the method of virtual fields. In quasi-static deformation,the principle of virtual work can be written as:
∫ ∫ ∫σ ε dV T u dS f u dV i j− * + * + * = 0 ( , ) = (1, 2, 3)V
ij ijS
i iV
i iV (5)
where σij and Ti denote the components of stress tensor and tractionvector, respectively; fi is the body force vector; V is the volume over
which the equilibrium is written; SV represents the boundary surface ofV; u*i denotes the components of a “virtual displacement field”; ε*ij arethe components of the virtual strain tensor derived from u*i . Incomparison with the magnitude of the tensile load applied on thespecimen, volume forces are neglected in this work. Eq. (3) remainsvalid for any specimen in quasi-static equilibrium as long as akinematically admissible virtual displacement field is incorporated.For the specific case of uniaxial tension, the virtual displacement fieldsuggested by Avril et al. [20] is adopted in this work. Accordingly, thevirtual displacement and strain components are expressed as:
⎪
⎪
⎧⎨⎩
⎧⎨⎪
⎩⎪uu y
εε
ε
* = 0* =
* = 0* = 1* = 0
x
y
xx
yy
xy (6)
The virtual field described in Eq. (6) is defined over the area ofinterest used in full-field measurements. The area used in this study isshown schematically in Fig. 8.
Assuming that the surface measurements remain valid through thethickness of the specimen, after substituting the virtual displacementand strain fields in Eq. (3) the equilibrium equation can be rewritten inthe simple form:
⎡⎣⎢
⎤⎦⎥∫t σ τ dS P τ L− ( ) + ( ) = 0
Syy
(7)
where P is the measured far-field tensile load; t and L representthickness and length of the area of interest, respectively; S is the areaon which full-field measurements are performed; τ is time. In case ofuniaxial tension, the equivalent stress σ is equivalent to the verticalcomponent of the stress tensor σyy. Therefore, Eq. (7) can be furthersimplified as:
∫ σ ε ε T C m τ dS P τ Lt
( , *, *, , , ) = ( )S
p (8)
Note that the constants A, B and n are already identified at thispoint. Thus, the only unknown parameters in Eq. (8) are materialconstants C and m. Due to the presence of experimental noise in theload and full-field deformation measurements, the unknowns in Eq. (8)may not be directly evaluated. Instead, to determine the constants Cand m, an iterative solution algorithm is implemented in which a costfunction,Φ, is minimized with respect to the unknown parameters:
Fig. 7. Experimental and model curves obtained at reference temperature (T0=298 K)
and reference strain rate 4.7×10⁻⁴ s−1. Fig. 8. Schematic of the tensile specimen with the dimensions of the area of interest onwhich full-field measurements are conducted.
G. Valeri et al. Optics and Lasers in Engineering 91 (2017) 53–61
57
⎛⎝⎜
⎞⎠⎟∫∑ ∑Φ C m
Sσ ε ε T C m τ dS P τ L
St( , ) = 1 ( , *, *, , , ) − ( ).
i
N
τ τ
τ τ
Sp
=1 =
= 2f
0 (9)
Eq. (9) defines the cost function Φ as the quadratic deviationbetween the average flow stress measured from the average plasticstrain, strain rate and temperature within the area of interest and thestress measured from the far-field tensile load, summed up over theduration of the experiment. The termsτ0 and τf in Eq. (9) denote theinstants of plastic deformation initiation (yielding) and plastic instabil-ity (necking), respectively. The parameter N denotes the total numberof experiments conducted at different temperatures ranging from roomtemperature to 900 °C, and at various strain rates. The advantage of theapplication of such a cost function over the traditional finite elementmodel updating (FEMU) is explained in [20].
Note that the integral term in Eq. (9) can be approximated as theaverage flow stress of the material at area S. To evaluate average σ in S,spatial averaging of εp, ε* and T* can be conducted within area S, andthe integral term can be simplified as:
∫ σ ε ε T C m τ dS σ ε ε T C m τ w L( , *, *, , , ) ≈ ( , *, *, , , ). .S
p p (10)
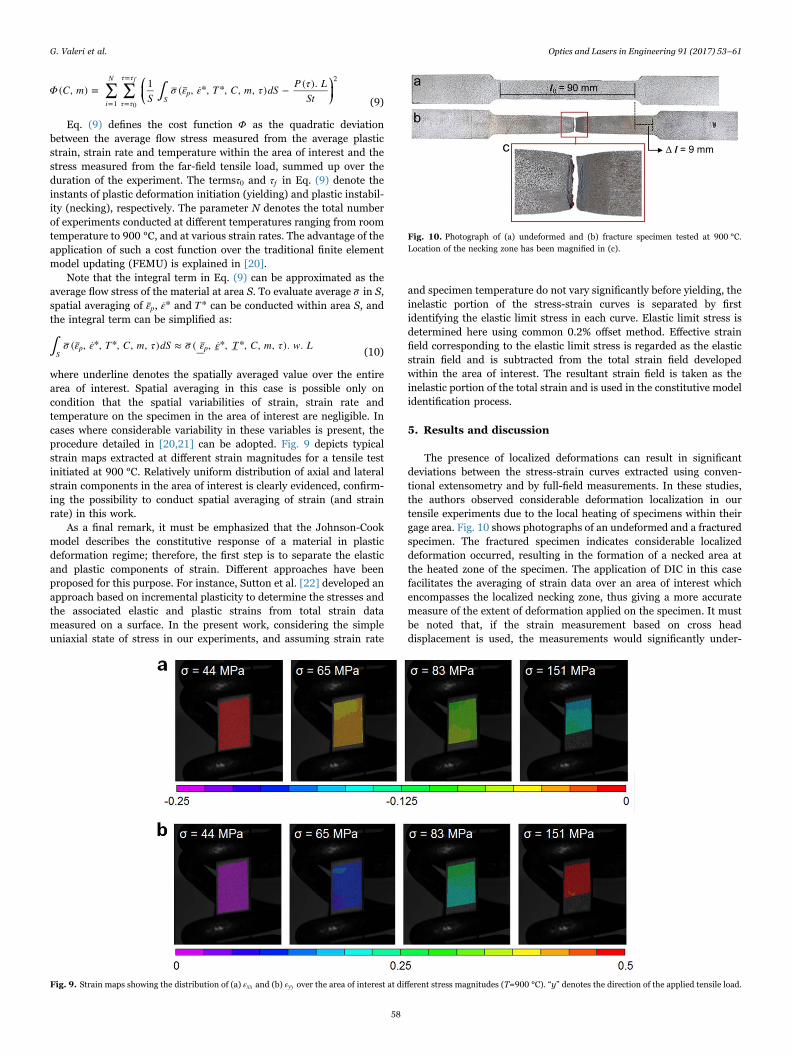
where underline denotes the spatially averaged value over the entirearea of interest. Spatial averaging in this case is possible only oncondition that the spatial variabilities of strain, strain rate andtemperature on the specimen in the area of interest are negligible. Incases where considerable variability in these variables is present, theprocedure detailed in [20,21] can be adopted. Fig. 9 depicts typicalstrain maps extracted at different strain magnitudes for a tensile testinitiated at 900 °C. Relatively uniform distribution of axial and lateralstrain components in the area of interest is clearly evidenced, confirm-ing the possibility to conduct spatial averaging of strain (and strainrate) in this work.
As a final remark, it must be emphasized that the Johnson-Cookmodel describes the constitutive response of a material in plasticdeformation regime; therefore, the first step is to separate the elasticand plastic components of strain. Different approaches have beenproposed for this purpose. For instance, Sutton et al. [22] developed anapproach based on incremental plasticity to determine the stresses andthe associated elastic and plastic strains from total strain datameasured on a surface. In the present work, considering the simpleuniaxial state of stress in our experiments, and assuming strain rate
and specimen temperature do not vary significantly before yielding, theinelastic portion of the stress-strain curves is separated by firstidentifying the elastic limit stress in each curve. Elastic limit stress isdetermined here using common 0.2% offset method. Effective strainfield corresponding to the elastic limit stress is regarded as the elasticstrain field and is subtracted from the total strain field developedwithin the area of interest. The resultant strain field is taken as theinelastic portion of the total strain and is used in the constitutive modelidentification process.
5. Results and discussion
The presence of localized deformations can result in significantdeviations between the stress-strain curves extracted using conven-tional extensometry and by full-field measurements. In these studies,the authors observed considerable deformation localization in ourtensile experiments due to the local heating of specimens within theirgage area. Fig. 10 shows photographs of an undeformed and a fracturedspecimen. The fractured specimen indicates considerable localizeddeformation occurred, resulting in the formation of a necked area atthe heated zone of the specimen. The application of DIC in this casefacilitates the averaging of strain data over an area of interest whichencompasses the localized necking zone, thus giving a more accuratemeasure of the extent of deformation applied on the specimen. It mustbe noted that, if the strain measurement based on cross headdisplacement is used, the measurements would significantly under-
Fig. 9. Strain maps showing the distribution of (a) εxx and (b) εyy over the area of interest at different stress magnitudes (T=900 °C). “y” denotes the direction of the applied tensile load.
Fig. 10. Photograph of (a) undeformed and (b) fracture specimen tested at 900 °C.Location of the necking zone has been magnified in (c).
G. Valeri et al. Optics and Lasers in Engineering 91 (2017) 53–61
58
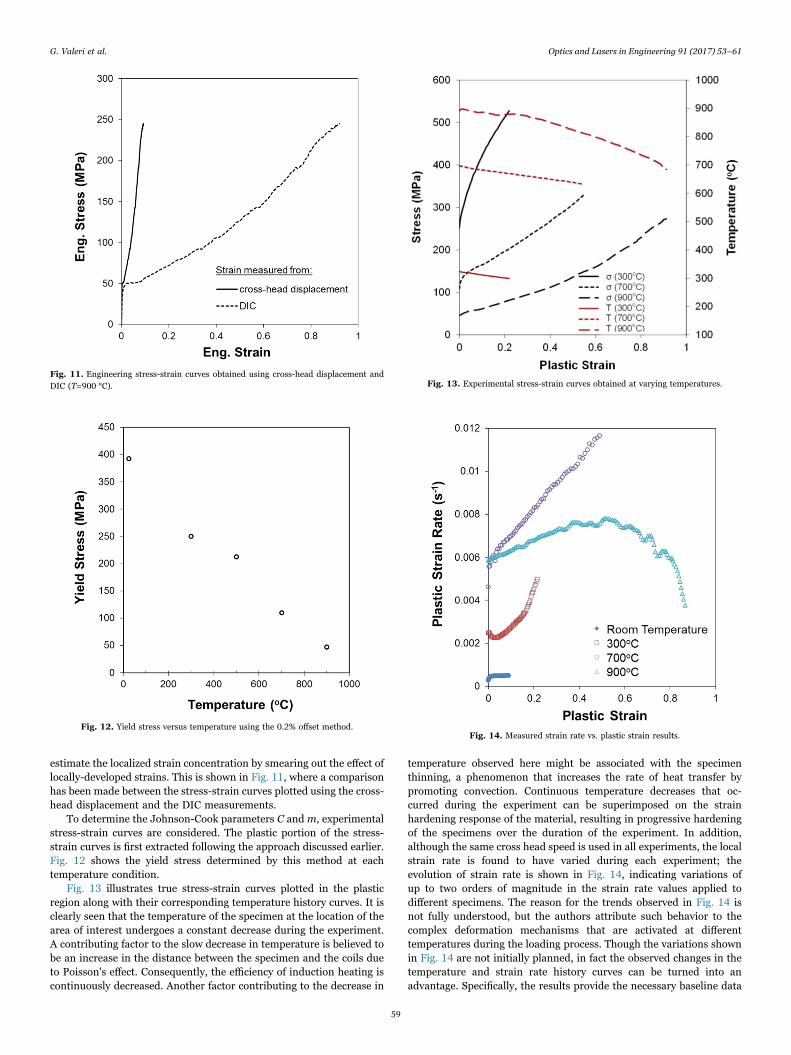
estimate the localized strain concentration by smearing out the effect oflocally-developed strains. This is shown in Fig. 11, where a comparisonhas been made between the stress-strain curves plotted using the cross-head displacement and the DIC measurements.
To determine the Johnson-Cook parameters C and m, experimentalstress-strain curves are considered. The plastic portion of the stress-strain curves is first extracted following the approach discussed earlier.Fig. 12 shows the yield stress determined by this method at eachtemperature condition.
Fig. 13 illustrates true stress-strain curves plotted in the plasticregion along with their corresponding temperature history curves. It isclearly seen that the temperature of the specimen at the location of thearea of interest undergoes a constant decrease during the experiment.A contributing factor to the slow decrease in temperature is believed tobe an increase in the distance between the specimen and the coils dueto Poisson's effect. Consequently, the efficiency of induction heating iscontinuously decreased. Another factor contributing to the decrease in
temperature observed here might be associated with the specimenthinning, a phenomenon that increases the rate of heat transfer bypromoting convection. Continuous temperature decreases that oc-curred during the experiment can be superimposed on the strainhardening response of the material, resulting in progressive hardeningof the specimens over the duration of the experiment. In addition,although the same cross head speed is used in all experiments, the localstrain rate is found to have varied during each experiment; theevolution of strain rate is shown in Fig. 14, indicating variations ofup to two orders of magnitude in the strain rate values applied todifferent specimens. The reason for the trends observed in Fig. 14 isnot fully understood, but the authors attribute such behavior to thecomplex deformation mechanisms that are activated at differenttemperatures during the loading process. Though the variations shownin Fig. 14 are not initially planned, in fact the observed changes in thetemperature and strain rate history curves can be turned into anadvantage. Specifically, the results provide the necessary baseline data
Fig. 11. Engineering stress-strain curves obtained using cross-head displacement andDIC (T=900 °C).
Fig. 12. Yield stress versus temperature using the 0.2% offset method.
Fig. 13. Experimental stress-strain curves obtained at varying temperatures.
Fig. 14. Measured strain rate vs. plastic strain results.
G. Valeri et al. Optics and Lasers in Engineering 91 (2017) 53–61
59

for identification of a single thermo-visco-plastic constitutive law over awide range of temperature and strain rates while using a minimumnumber of experiments. In this regard, the Johnson-Cook parametersC and m can be identified by taking into account the entire populationof data points obtained in this work. Once the material parameters Candm are identified, experimental stress-strain curves can be correctedand replotted at constant temperature and strain rate conditions.
Specifically, the following approach is used to identify the materialconstants C and m:
1) Collect the entire population of data points obtained from tensileexperiments. Each data point within this collection contains aunique set of load, strain, strain rate and temperature informationobtained at a given time.
2) Select initial values for the unknown Johnson-Cook parameters Cand m. Calculate the flow stress, σ , using the initial values of C andm, along with the strain, strain rate and temperature valuescollected in step 1. Note that other model parameters A, B and nare already known at this point and can be directly substituted intoEq. (3) to calculate σ . The initial values of C=0 and m =0 areconsidered as the starting point in this work.
3) Evaluate the cost function Φ (Eq. (9)) using the computed σ and themeasured far-field tensile load P.
4) Update C and m, and repeat steps 2 and 3 for the updated values ofthese constants. In the present work, updating the temperatureparameter m is conducted by constantly increasing m from m=0 tom=1 at increments of 0.02. Similarly, C is updated over a range of0–0.4 in increments of 0.05. It should be noted here that the rangeof values selected for the unknown parameters m and C must bereasonable [21]. The lower bound values (m, C=0) are selectedbased on the fact that metallic materials generally show stresssoftening at elevated temperatures and stress hardening at higherstrain rate conditions; thus m and C may not take negative values.The upper bound values (m=1, C=0.4) are chosen such that therange of these parameters would include the previously documen-ted values for a number of different steel alloys [23–25].
5) Identify the pair of C andm values that minimizes the cost function.
Fig. 15 depicts the variation of cost function with the unknownmodel parameters C and m. Inspection of Fig. 15 shows that the costfunction is well conditioned and is most sensitive to variations in m,with a relatively wide range of C values giving similar values for Φmin.Results from our studies result in a unique minimum for C=0.18 and
m=0.36. Accordingly, the final Johnson-Cook model parameters for theexamined 304 stainless steel are listed in Table 2.
Experimental stress-strain curves shown earlier in Fig. 13 can nowbe corrected and replotted at constant temperature and strain rates.Fig. 16 illustrates a comparison between the experimentally obtainedand corrected stress-strain curves. The difference between the twocurves is more significant at higher plastic strains. In addition, themaximum relative difference is observed for the case of the specimentested at 900 °C, where larger variations in strain rate and temperature(see Figs. 13 and 14) occurred during tensile loading of the specimen. Itis also clearly seen in Fig. 16 that the slope of the corrected curves issmaller than the uncorrected curves for all temperatures above 20 °C.This observation is consistent with previous statements concerning thehigher rate of work hardening in cases where a constant decrease intemperature and/or a continuous increase of strain rate takes placeduring high temperature tensile experiments.
As shown in Fig. 16, the overall slope of the stress-strain curvesdecreases at higher temperatures, indicating a lower rate of workhardening. This can also be shown by plotting the work hardening rateversus plastic strain at constant strain rate but different temperatures.In this regard, the rate of work hardening, θ , can be calculated bydifferentiating flow stress with respect to plastic strain, as:
θ σε
nBε C ε T= ∂∂
= (1 + ln *)(1 − * )p ε T
pn m
*, *
−1
(11)
Fig. 17 shows the variation of θ with respect to plastic strain plottedat different temperature conditions.
As a final remark, it is worth noting that the approach proposed inthis work to obtain the stress-strain curves for constant temperatureand strains rate conditions is of particular significance in conventional
Fig. 15. Normalized cost function as a function of C and m.
Table 2Johnson-Cook model parameters obtained for 304 stainless steel.
A (MPa) B (MPa) n Ca mb
393 743.1 0.568 0.18 0.36
a Strain rates range: 4.7×10⁻⁴–1.2×10−2.b Temperature range: 20–900 °C.
Fig. 16. Experimental and corrected stress-strain curves. Corrected curves are plotted atconstant temperature and constant strain rate of 10−3 s−1.
G. Valeri et al. Optics and Lasers in Engineering 91 (2017) 53–61
60

hot deformation studies. Note that even under nearly ideal experi-mental conditions, maintaining the specimen temperature and strainrate at constant levels is extremely challenging. Even when nominallyinsulated specimen conditions are present, specimen temperatures canundergoes significant variations due to heat generation resulting fromplastic deformation [26,27]. This temperature rise certainly affects loadmeasurement and eventually reduces the efficiency and reliability ofthe obtained data. The approach proposed here can be regarded as aneasy-to-implement method to increase the accuracy level of experi-mental data conventionally collected assuming constant temperatureand strain rate conditions during a high temperature deformationexperiment.
Finally, as highlighted in these studies, temporal variability ofstrain rate and specimen temperature during testing can actually beconsidered as an advantage. In this regard, novel test protocols can bedevised so that strain rate and temperature are intentionally variedduring a single test, such that the identification of high temperatureviscoplastic constative response of the material can be carried out witha minimum number of experiments. This can be achieved through full-field measurements in conjunction with identification analyses such asthe Virtual Fields Method utilized in this work.
6. Conclusions
A series of tensile experiments is performed on 304 stainless steelmaterial exposed to temperatures from 25°C to 900 °C using a 3D-DICmethodology. The full-field strain measurement is used in conjunctionwith the VFM to identify the visco-plastic constitutive response using ageneral form of thee Johnson-Cook constitutive model.
Using the measured variations in temperature and strain rate onthe specimen during the tensile loading process, a least square metricusing the measured strain data is developed to identify the unknownparameters in the Johnson-Cook model obtained over a wide range oftemperature and strain rates. The experimental stress-strain curvesobtained from the DIC were successfully obtained for conditions ofconstant temperature and strain rate.
Acknowledgements
The financial support, Haythornthwaite Research Initiation Grantof ASME Applied Mechanics Division through Haythornthwaite foun-dation is greatly acknowledged.
References
[1] Johnson GR, Cook WH. A constitutive model and data for metals subjected to largestrains, high strain rates and high temperature. In: Proceedings of the 7thinternational symposium on ballistics; 1983. p. 541–7.
[2] Lin YC, Chen X, Liu G. Amodified Johnson-Cook model for tensile behaviors oftypical high-dtrength alloy steel. Mater Sci Eng A 2010;527:6980–6.
[3] Parsons E, Boyce MC, Parks DM. An experimental investigation of the large-straintensile behavior of neat and rubber-toughened polycarbonate. Polymer2004;45:2665–84.
[4] Sharpe WN. Strain gages for long-term high-temperature train measurement. ExpMech 1975;15(12):482–8.
[5] Gregory OJ, Slot AB, Amons PS, Crisman EE. High temperature strain gages basedon reactively sputtered AlNx thin films. Surf Coat Technol 1996;88:79–89.
[6] Turner RC, Fuierer PA, Newnham RE, Shrout TR. Materials for high temperatureacoustic and vibration sensors: a review. Appl Acoust 1994;41(4):299–324.
[7] Sutton MA, Orteu JJ, Schreier HW. Image correlation for shape, motion anddeformation measurements. New York: Springer; 2009.
[8] Koohbor B, Kidane A, Lu W-Y, Sutton MA. Investigation of the dynamic stress–strain response of compressible polymeric foam using a non-parametric analysis.Int J Impact Eng 2016;91:170–82.
[9] Koohbor B, Ravindran S, Kidane A. Meso-scale strain localization and failureresponse of an orthotropic woven glass-fiber reinforced composite. Compos Part B:Eng 2015;78:308–18.
[10] Sutton MA, Li N, Joy DC, Reynolds AP, Li X. Scanning electron microscopy forquantitative small and large deformation measurements Part I: SEM imaging atmagnifications from 200 to 10,000. Exp Mech 2007;47(6):775–87.
[11] Ghorbani R, Matta F, Sutton MA. Full-field deformation measurement and crackmapping on confined masonry walls using digital image correlation. Exp Mech2015;55(1):227–43.
[12] Pierron F, Sutton MA, Tiwari V. Ultra high speed DIC and virtual fields methodanalysis of a three point bending impact test on an aluminum bar. Exp Mech2011;51(4):537–63.
[13] Guo X, Liang J, Tang Z, Cao B, Yu M. High-temperature digital image correlationmethod for full-field deformation measurement captured with filters at 2600 °Cusing spraying to form speckle patterns. Opt Eng 2014;53(6), [063101-1-12].
[14] Lyons JS, Liu J, Sutton MA. High-temperature deformation measurements usingdigital-image correlation. Exp Mech 1996;36(1):64–70.
[15] Grant B, Stone H, Withers P, Preuss M. High-temperature strain field measurementusing digital image correlation. J strain Anal Eng Des 2009;44(4):263–71.
[16] Wu L, Zhu J, Xie H. Single-lens 3D digital image correlation system based on abilateral telecentric lens and a bi-prism: validation and application. Appl Opt2015;54(26):7842–50.
[17] Koohbor B, Valeri G, Kidane A, Sutton MA. Thermo-mechanical properties ofmetals at elevated temperatures. Adv Opt Methods Exp Mech 2015;3:117–23.http://dx.doi.org/10.1007/978-3-319-22446-6_15.
[18] Pan B, Wu D, Wang Z, Xia Y. High-temperature digital image correlation methodfor full-field deformation measurement at 1200 °C. Meas Sci Technol 2011;22,[015701-1-11].
[19] Kidane A, Shukla A. Quasi-static and dynamic fracture initiation toughness of Ti/TiB layered functionally graded material under thermo-mechanical loading. Eng.Frac. Mec. 2010;77:479–91.
[20] Avril S, Pierron F, Sutton MA, Yan J. Identification of elasto-visco-plasticparameters and characterization of Lüders behavior using digital image correlationand the virtual fields method. Mech Mater 2008;40:729–42.
[21] Le Louëdec G, Pierron F, Sutton MA, Reynolds AP. Identification of the local elasto-plastic behavior of FSW welds using the virtual fields method. Exp Mech2013;53:849–59.
[22] Sutton MA, Deng X, Liu J, Yang L. Determination of elastic-plastic stresses andstrains from measured surface strain data. Exp Mech 1995;36(2):99–112.
[23] Holmquist TJ, Johnson GR. Determinatoin of constants and comparison of resultsfor various constitutive models. J Phys IV 1991;01(C3):853–60.
[24] Umbrello DM, Saoubi R, Outeiro JC. The influence of Johnson-Cook materialconstants on finite element simulation of machining of AISI 316L steel. Int J MachTools Manuf 2007;47:462–70.
[25] Chen AY, Ruan HH, Wang J, Chan HL, Wang Q, Li Q, Lu J. The influence of strainrate on microstructure transition of 304 stainless steel. Acta Mater2011;59:3697–709.
[26] Semiatin SL, Seetharaman V, Weiss I. Flow behavior and globularization kineticsduring hot working of Ti-6Al-4V with a colony alpha microstructure. Mater Sci EngA 1999;263:257–71.
[27] Semiatin SL, Lahoti GD. Deformation and unstable flow in hot forging of Ti-6Al-2Sn-4Zr-2Mo-0.1Si. Metall Trans A 1981;12(10):1705–17.
Fig. 17. Variation of θ with respect to plastic strain at different temperatures.
G. Valeri et al. Optics and Lasers in Engineering 91 (2017) 53–61
61