determining the refractive index dispersion and thickness ... · method to determine the refractive...
TRANSCRIPT
Determining the refractive index dispersionand thickness of hot-pressed chalcogenide thin filmsfrom an improved Swanepoel method
Y. Fang1• D. Jayasuriya1
• D. Furniss1• Z. Q. Tang1
•
Ł. Sojka1,2• C. Markos1,3
• S. Sujecki1,2• A. B. Seddon1
•
T. M. Benson1
Received: 7 March 2017 / Accepted: 16 May 2017 / Published online: 3 June 2017� The Author(s) 2017. This article is an open access publication
Abstract The well-known method presented by Swanepoel can be used to determine the
refractive index dispersion of thin films in the near-infrared region from wavelength values
at maxima and minima, only, of the transmission interference fringes. In order to extend
this method into the mid-infrared spectral region (our measurements are over the wave-
length range from 2 to 25 lm), the method is improved by using a two-term Sellmeier
model instead of the Cauchy model as the dispersive equation. Chalcogenide thin films of
nominal batch composition As40Se60 (at.%) and Ge16As24Se15.5Te44.5 (at.%) are prepared
by a hot-pressing technique. The refractive index dispersion of the chalcogenide thin films
is determined by the improved method with a standard deviation of less than 0.0027. The
accuracy of the method is shown to be better than 0.4% at a wavelength of 3.1 lm by
comparison with a benchmark refractive index value obtained from prism measurements
on Ge16As24Se15.5Te44.5 material taken from the same batch.
Keywords Chalcogenide glasses � Refractive index � Dispersion
1 Introduction
A chalcogenide glass is a glass containing one or more Group 16 elements of the Periodic
Table, sulfur (S), selenium (Se), or tellurium (Te), usually formulated with additions of
germanium, arsenic or antimony to increase glass stability and robustness (Seddon 1995).
& T. M. [email protected]
1 Mid-Infrared Photonics Group, George Green Institute for Electromagnetics Research, Faculty ofEngineering, University of Nottingham, University Park, Nottingham NG7 2RD, UK
2 Institute of Telecommunication, Teleinformatics and Acoustics, Wroclaw University ofTechnology, Wybrzeze Wyspianskiego 27, 50-370 Wrocław, Poland
3 DTU Fotonik, Department of Photonics Engineering, Technical University of Denmark,Ørsteds Plads 343, 2800 Kongens Lyngby, Denmark
123
Opt Quant Electron (2017) 49:237DOI 10.1007/s11082-017-1057-9
Since chalcogenide glasses provide a wide range of glass compositions, different physical
properties can be achieved, including refractive index. The properties of mid-infrared
(MIR) transparency, high refractive index, low phonon energy, high optical non-linearity
(Zakery and Elliott 2003), and an ability to doped them with rare-earth element ions
(Sanghera and Aggarwal 1999; Sanghera et al. 2009; Tang et al. 2015; Falconi et al. 2016),
make chalcogenide glasses attractive for use in planar photonic integrated circuits (Seddon
et al. 2006, 2014; Abdel-Moneim et al. 2015), and narrow- and broad-band fibre-based
laser sources (Petersen et al. 2014) and amplifiers (Hu et al. 2015; Falconi et al. 2017) for
the MIR. Although much research effort has been paid to the development and charac-
terisation of chalcogenide glasses for photonics, relatively little refractive index dispersion
data are presently available at MIR wavelengths, see for example: Orava et al. (2009), Qiao
et al. (2011), Dantanarayana et al. (2014), Gleason et al. (2016), Wang et al. (2017) and
references therein.
Refractive index, and very often its wavelength dispersion, is one of the key parameters
that influences the design of optical components. Techniques commonly used for refractive
index measurement include the modelling of transmission or reflection spectroscopic data
(Swanepoel 1985; Marquez et al. 1998), spectroscopic ellipsometry (Orava et al. 2009;
Wang et al. 2017), prism coupling (Carlie et al. 2011), grating coupling (Laniel et al.
2003), and the measurement of the minimum deviation angle of light passing through a
prism (Fang et al. 2016). Several of these techniques require intensive sample preparation,
are time consuming, and are costly to conduct. More importantly, it has until recently been
difficult to apply some of these techniques to the MIR spectral region because of the
paucity of suitable beam sources (Carlie et al. 2011). Carlie et al. (2011) modified a
commercial system prism coupling system (Metricon model 2010) using additional laser
sources, detectors, and a GaP prism in order to enable the measurement of refractive index
dispersion at spot wavelengths over the 1.5–10.6 lm range and used it to determine the
refractive index of As2Se3 bulk glass and thin films across this wavelength region to an
accuracy of ±0.001. Due to the high accuracy of the method the authors were able to
compare the refractive indices of as-deposited and annealed As2Se3 films with those of the
parent bulk glasses. They showed that an as-deposited thin film had a lower refractive
index than that of the bulk; subsequent annealing of the films increased the refractive index
back up to the level of the bulk glass. This illustrates the importance of the thermal history
of the glass on its physical structure, and hence on its physical properties such as density
and refractive index. In Dantanarayana et al. (2014) we reported the continuous linear
refractive index dispersion at ambient temperature of two bulk chalcogenide glasses, AsSe
and GeAsSe, over the 0.4–33 lm wavelength range obtained by means of spectroscopic
ellipsometry. A two-term Sellmeier equation, with one resonant visible-region absorption
and one resonant far-infrared absorption, was determined as sufficient and appropriate for
fitting the refractive index dispersion over the wavelength range for which the extinction
coefficient was less than 0.0005. The fitting accuracy was better than 0.1%. Nevertheless,
the accuracy in measuring the refractive index by means of spectroscopic ellipsometry is
inherently limited by surface effects (Poelman and Smet 2003) as a thin contamination
layer, oxide layer, or small defects on the surface can all potentially yield different optical
constants for the glass.
The method of Swanepoel (1985) was presented to determine the refractive index and
thickness of thin films in the transparent region from wavelength values at maxima and
minima, only, of the transmission interference fringes. This entails measuring two trans-
mission spectra, one at normal incidence and another at oblique incidence. The Swanepoel
method was used by Corrales et al. (1995) to measure the refractive index of an As2Se3 thin
237 Page 2 of 19 Y. Fang et al.
123

film in the 600–2000 nm wavelength region and the method yielded values for refractive
index and average thin film thickness to an accuracy of better than 3%. In this paper, an
improved Swanepoel method, based on Swanepoel (1985), but modified by the introduc-
tion of a Sellmeier dispersion equation in order improve the applicability of the method to
chalcogenide glasses at MIR wavelengths, is introduced. It is used to determine the
refractive index dispersion of thin As40Se60 (at.%, nominal batch composition) and
Ge16As24Se15.5Te44.5 (at.%, nominal batch composition) hot-pressed glass films in the MIR
spectral region to an accuracy of better than 0.4%. The actual glass compositions measured
using scanning electron microscopy energy dispersive X-ray diffraction (SEM-EDX) were
found to match the nominal batch compositions to within the ±0.7 at.% accuracy and
precision of the measurements. The present improvements apply to the transparency region
of chalcogenide glasses and are distinct from other improvements to the Swanepoel
method recently suggested by Jin et al. (2017) who described on a tangency point method
(TPM) to resolve problems observed when using the Swanepoel method in the strong
absorption region.
The remainder of the paper is organised in the following way: in Sect. 2, the preparation
of thin film samples of Ge16As24Se15.5Te44.5 and As40Se60 is introduced, which embraces
glass-melting, fibre-drawing, propylamine-etching and hot-pressing. This section also
presents experimental measurements of the transmission through the GeAsSeTe and AsSe
thin films using Fourier transform infrared spectroscopy (FTIR). Section 3 discusses the
appropriate refractive index model to describe the refractive index dispersion of chalco-
genide glasses in the MIR spectral region and the basic theory of the improved Swanepoel
method to determine the refractive index and thickness of the thin films. Section 4 presents
the refractive index and thickness of the thin films obtained from the improved Swanepoel
method. The improvements in determining the refractive index dispersion from the
improved Swanepoel method are highlighted by comparison with the original approach.
The results from the improved method are also compared to the results from ellipsometry,
the minimum deviation method and commercial data, in this section. The important
conclusions drawn from the study are highlighted in Sect. 5.
2 Sample preparation and FTIR measurements
2.1 Glass melting
In preparing the glass Ge16As24Se15.5Te44.5 and As40Se60 compositions studied here, the As
(7 N purity, Furakawa Denshi) and Se (5 N purity, Materion) elemental precursors were
heat-treated under vacuum (10-3 Pa) at 310 and 260 �C, respectively, in order to purify
them by driving off volatile oxides. Ge (5 N purity, Materion) and Te (5 N purity,
Materion) were untreated. The elements were subsequently batched under a nitrogen
atmosphere in a MBraun glove-box (B0.1 ppm H2O and B0.1 ppm O2) into a vitreous
silica ampoule (Multi-Lab Ltd, UK). Before batching the elements, the vitreous silica
ampoule was etched using 40% v/v hydrofluoric acid (HF) and rinsed with deionised water;
it was next air and then vacuum baked (under vacuum *10-3 Pa) at 1000 �C for 6 h in a
vertical furnace (TF105/4.5/IZF, Instron) to drive off physisorbed and chemisorbed water
from the inside surface of the silica glass ampoule. After batching, the silica ampoule was
sealed (under *10-3 Pa vacuum) and placed in a rocking furnace to melt and homogenise
the glass, at *750 �C/12 h for the Ge16As24Se15.5Te44.5 composition and at *800 �C/12 h
Determining the refractive index dispersion and thickness… Page 3 of 19 237
123
for the As40Se60 composition. The melts were quenched and annealed for 1 h at their
respective glass transition temperature (Tg) before slowly cooling them down to room
temperature. This produced glass rods which were *10 mm in diameter and *70 mm in
length.
2.2 Thin film sample preparation
A hot-pressing technique was developed to prepare thin films of chalcogenide glass; this
involved the hot-pressing of circa 20 mm lengths of fibre, with a nominal diameter of
250 lm, using the hot-press previously described in Fang et al. (2016) (ICTON): Seddon
et al. (2006), Abdel-Moneim et al. (2015). The as-annealed preforms (*10 mm diameter
and *70 mm length) of Ge16As24Se15.5Te44.5 and As40Se60, prepared as in Sect. 2.1, were
drawn into optical fibres using a customised Heathway draw-tower in a 10,000-Class
clean-room. The fibres were drawn under a N2 flow (BOC white-spot) at a viscosity of
around 104.5 Pa s. The final fibre diameter was 250 ± 10 lm. The outer surface of the
fibres was shiny and no defects could be seen by the naked eye. Five Ge16As24Se15.5Te44.5
fibres, each of about 250 lm diameter and 20 mm length, were cleaved from the Ge16-
As24Se15.5Te44.5 fibre. The five 20 mm lengths of chalcogenide fibre were each immersed
in propylamine (Sigma-Aldrich 99 mol.%) for 30 min at room temperature under atmo-
spheric pressure. Subsequently the etched fibres were taken out of the propylamine and
were immersed in acetone (99.8%, Sigma Aldrich) for 10 min and subsequently each fibre
was individually cleaned carefully using isopropanol (IPA, HPLC grade, Fisher Chemical)
with optical lens tissue. A silica glass ampoule (Multi-Lab Ltd, UK) was used as the
container for the propylamine-etching; this was rinsed with distilled water and dried under
vacuum (*10-3 Pa). The five propylamine-etched 20 mm long fibres were then placed on
a tungsten carbide plate (800 mm diameter, of flatness 0.08 lm and of surface finish
0.009 lm) surrounded by a 20 lm thick stainless steel shim (Supplier: Hollinbrow Ltd,
UK) and then covered by a second tungsten carbide plate. The fibre samples were hot-
pressed under vacuum (10-4 Pa) at Tg ? 40 �C (viscosity *108 Pa s) with a maximum
pressure of 700 N between the two plates. The samples were then annealed at the onset-Tg
(175 �C) and allowed to cool with the discs. In order not to damage the samples while
opening the press, solvents (acetone and if necessary IPA) were squirted into the gap
between the two tungsten carbide plates. As40Se60 thin films, this time with a 25 lm target
(shim) thickness, were also prepared following the same method.
2.3 Optical transmission measurements on the thin-film chalcogenide glasssamples using FTIR
A GlobarTM source, KBr beam splitter and DLaTGSD301 detector were set up in the FTIR
spectrometer (Bruker IFS 66v/s) to measure the interference transmission spectra of the
thin films in the wavelength range from 1 to 25 lm; 25 lm was the maximum wavelength
possible with this set-up in the Bruker FTIR. Because of the low efficiency of the KBr
beam splitter and the DLaTGSD301 detector at wavelengths below 2 lm, clear extrema of
interference fringes were only obtained over the wavelength range from 2 to 25 lm.
The Ge16As24Se15.5Te44.5 or As40Se60 thin film prepared using the hot-pressing tech-
nique was mounted on a home-made rotation stage, which was accurate up to 0.1�,installed in the sample compartment of the FTIR spectrometer. In the FTIR spectrometer a
He–Ne beam, which was used for alignment, indicated the position of the GlobarTM.
237 Page 4 of 19 Y. Fang et al.
123

Careful alignment was undertaken to ensure that the axis of rotation went through the
surface of the thin film at the focal point of the He–Ne beam and that no lateral dis-
placement of the light took place during rotation. The location of normal incidence was
determined by ensuring that equivalent transmission spectra were obtained after rotation
through equal angles in a clockwise and anticlockwise sense.
In FTIR thin film transmission measurements, air absorption in the optical path in the
mid-infrared region distorted the observed interference fringes, as indicated in Fig. 1. The
main absorption bands observed were: CO2 absorption at around 4.2 and 15 lm and H–O–
H absorption at around 2.7 and 6.2 lm (Gibson and MacGregor 2013). A background
spectrum was collected immediately before each thin film transmission measurement,
without the sample present, with care to ensure that the measurement conditions remained
the same; this considerably reduced the effect of air absorption.
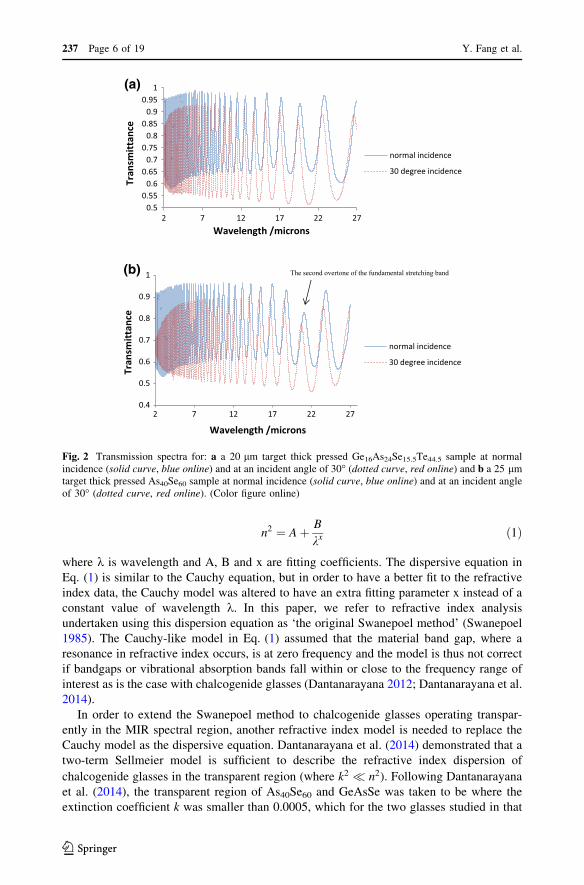
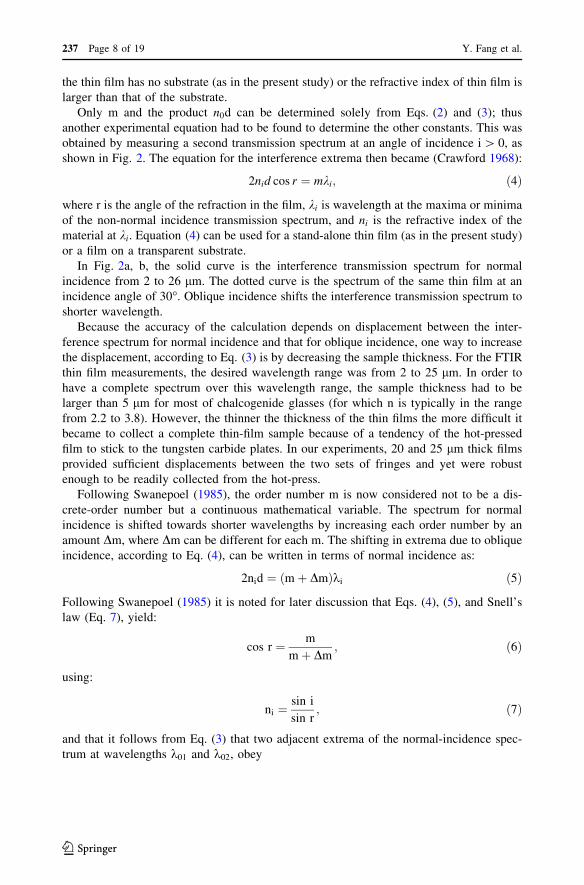
Figure 2a, b shows the FTIR interference transmission spectra at normal incidence and
at an incident angle of 30� of the Ge16As24Se15.5Te44.5 and As40Se60 thin films, respec-
tively. In Fig. 2, the solid curves are the interference fringes obtained from the case of
normal incidence and the red curves are from the case of oblique incidence. For the
transmission spectra of As40Se60 in Fig. 2b, an obvious material absorption occurred at
*21 lm, which was identified in Maklad et al. (1974) as the second overtone of the
fundamental stretching band due to AsSe3 pyramid units in a As2Se3 glass structural matrix
itself. This will be discussed further in Sect. 4 with regards to the Sellmeier model adopted
in this paper.
3 The theory and analysis of the improved Swanepoel method
3.1 The dispersive refractive index model
Referring to Fig. 2, the method of Swanepoel (1985) was developed to determine the
dispersive refractive index and thickness of thin films in the region where k2 � n2 from
wavelength values at maxima and minima, only, of the transmission interference fringe.
This entailed obtaining two spectra, one at normal incidence and another at oblique
incidence. In Swanepoel (1985) the material refractive index was fitted to the dispersive
equation given in Eq. (1):
0.4
0.5
0.6
0.7
0.8
0.9
1
2 3 4 5 6 7 8
Tran
smitt
ance
Wavelength /µm
CO2 absorption band at circa 4.2 μm
Fig. 1 The transmission spectrum of a Ge16As24Se15.5Te44.5 thin film of nominal thickness 20 lm withoutcareful background collection
Determining the refractive index dispersion and thickness… Page 5 of 19 237
123
n2 ¼ Aþ B
kxð1Þ
where k is wavelength and A, B and x are fitting coefficients. The dispersive equation in
Eq. (1) is similar to the Cauchy equation, but in order to have a better fit to the refractive
index data, the Cauchy model was altered to have an extra fitting parameter x instead of a
constant value of wavelength k. In this paper, we refer to refractive index analysis
undertaken using this dispersion equation as ‘the original Swanepoel method’ (Swanepoel
1985). The Cauchy-like model in Eq. (1) assumed that the material band gap, where a
resonance in refractive index occurs, is at zero frequency and the model is thus not correct
if bandgaps or vibrational absorption bands fall within or close to the frequency range of
interest as is the case with chalcogenide glasses (Dantanarayana 2012; Dantanarayana et al.
2014).
In order to extend the Swanepoel method to chalcogenide glasses operating transpar-
ently in the MIR spectral region, another refractive index model is needed to replace the
Cauchy model as the dispersive equation. Dantanarayana et al. (2014) demonstrated that a
two-term Sellmeier model is sufficient to describe the refractive index dispersion of
chalcogenide glasses in the transparent region (where k2 � n2). Following Dantanarayana
et al. (2014), the transparent region of As40Se60 and GeAsSe was taken to be where the
extinction coefficient k was smaller than 0.0005, which for the two glasses studied in that
0.50.55
0.60.65
0.70.75
0.80.85
0.90.95
1
2 7 12 17 22 27
Tran
smitt
ance
Wavelength /microns
normal incidence
30 degree incidence
0.4
0.5
0.6
0.7
0.8
0.9
1
2 7 12 17 22 27
Tran
smitt
ance
Wavelength /microns
normal incidence
30 degree incidence
(a)
(b) The second overtone of the fundamental stretching band
Fig. 2 Transmission spectra for: a a 20 lm target thick pressed Ge16As24Se15.5Te44.5 sample at normalincidence (solid curve, blue online) and at an incident angle of 30� (dotted curve, red online) and b a 25 lmtarget thick pressed As40Se60 sample at normal incidence (solid curve, blue online) and at an incident angleof 30� (dotted curve, red online). (Color figure online)
237 Page 6 of 19 Y. Fang et al.
123
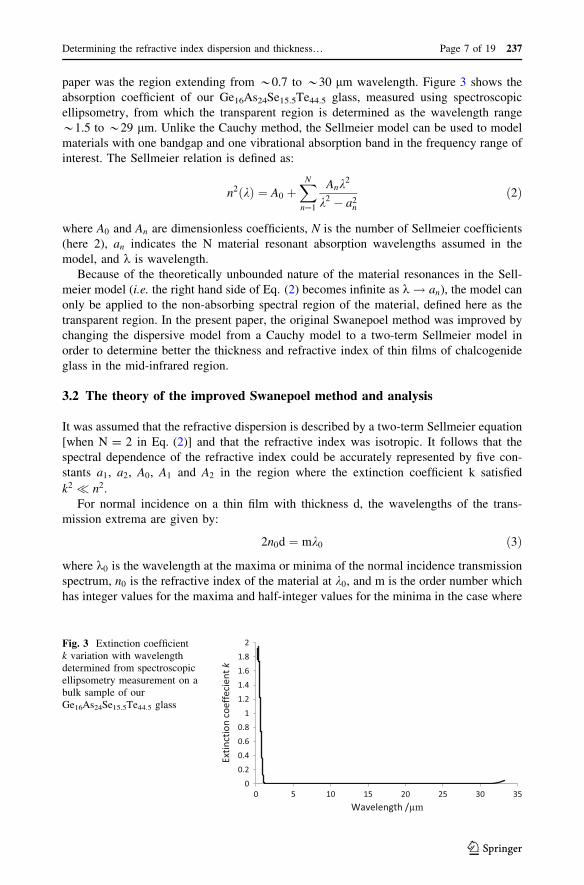
paper was the region extending from *0.7 to *30 lm wavelength. Figure 3 shows the
absorption coefficient of our Ge16As24Se15.5Te44.5 glass, measured using spectroscopic
ellipsometry, from which the transparent region is determined as the wavelength range
*1.5 to *29 lm. Unlike the Cauchy method, the Sellmeier model can be used to model
materials with one bandgap and one vibrational absorption band in the frequency range of
interest. The Sellmeier relation is defined as:
n2ðkÞ ¼ A0 þXN
n¼1
Ank2
k2 � a2n
ð2Þ
where A0 and An are dimensionless coefficients, N is the number of Sellmeier coefficients
(here 2), an indicates the N material resonant absorption wavelengths assumed in the
model, and k is wavelength.
Because of the theoretically unbounded nature of the material resonances in the Sell-
meier model (i.e. the right hand side of Eq. (2) becomes infinite as k ! an), the model can
only be applied to the non-absorbing spectral region of the material, defined here as the
transparent region. In the present paper, the original Swanepoel method was improved by
changing the dispersive model from a Cauchy model to a two-term Sellmeier model in
order to determine better the thickness and refractive index of thin films of chalcogenide
glass in the mid-infrared region.
3.2 The theory of the improved Swanepoel method and analysis
It was assumed that the refractive dispersion is described by a two-term Sellmeier equation
[when N = 2 in Eq. (2)] and that the refractive index was isotropic. It follows that the
spectral dependence of the refractive index could be accurately represented by five con-
stants a1, a2, A0, A1 and A2 in the region where the extinction coefficient k satisfied
k2 � n2.
For normal incidence on a thin film with thickness d, the wavelengths of the trans-
mission extrema are given by:
2n0d ¼ mk0 ð3Þ
where k0 is the wavelength at the maxima or minima of the normal incidence transmission
spectrum, n0 is the refractive index of the material at k0, and m is the order number which
has integer values for the maxima and half-integer values for the minima in the case where
00.20.40.60.8
11.21.41.61.8
2
0 5 10 15 20 25 30 35
Extin
ctio
n co
effe
cien
t k
Wavelength /μm
Fig. 3 Extinction coefficientk variation with wavelengthdetermined from spectroscopicellipsometry measurement on abulk sample of ourGe16As24Se15.5Te44.5 glass
Determining the refractive index dispersion and thickness… Page 7 of 19 237
123
the thin film has no substrate (as in the present study) or the refractive index of thin film is
larger than that of the substrate.
Only m and the product n0d can be determined solely from Eqs. (2) and (3); thus
another experimental equation had to be found to determine the other constants. This was
obtained by measuring a second transmission spectrum at an angle of incidence i[ 0, as
shown in Fig. 2. The equation for the interference extrema then became (Crawford 1968):
2nid cos r ¼ mki; ð4Þ
where r is the angle of the refraction in the film, ki is wavelength at the maxima or minima
of the non-normal incidence transmission spectrum, and ni is the refractive index of the
material at ki. Equation (4) can be used for a stand-alone thin film (as in the present study)
or a film on a transparent substrate.
In Fig. 2a, b, the solid curve is the interference transmission spectrum for normal
incidence from 2 to 26 lm. The dotted curve is the spectrum of the same thin film at an
incidence angle of 30�. Oblique incidence shifts the interference transmission spectrum to
shorter wavelength.
Because the accuracy of the calculation depends on displacement between the inter-
ference spectrum for normal incidence and that for oblique incidence, one way to increase
the displacement, according to Eq. (3) is by decreasing the sample thickness. For the FTIR
thin film measurements, the desired wavelength range was from 2 to 25 lm. In order to
have a complete spectrum over this wavelength range, the sample thickness had to be
larger than 5 lm for most of chalcogenide glasses (for which n is typically in the range
from 2.2 to 3.8). However, the thinner the thickness of the thin films the more difficult it
became to collect a complete thin-film sample because of a tendency of the hot-pressed
film to stick to the tungsten carbide plates. In our experiments, 20 and 25 lm thick films
provided sufficient displacements between the two sets of fringes and yet were robust
enough to be readily collected from the hot-press.
Following Swanepoel (1985), the order number m is now considered not to be a dis-
crete-order number but a continuous mathematical variable. The spectrum for normal
incidence is shifted towards shorter wavelengths by increasing each order number by an
amount Dm, where Dm can be different for each m. The shifting in extrema due to oblique
incidence, according to Eq. (4), can be written in terms of normal incidence as:
2nid ¼ m þ Dmð Þki ð5Þ
Following Swanepoel (1985) it is noted for later discussion that Eqs. (4), (5), and Snell’s
law (Eq. 7), yield:
cos r ¼ m
m þ Dm; ð6Þ
using:
ni ¼sin i
sin r; ð7Þ
and that it follows from Eq. (3) that two adjacent extrema of the normal-incidence spec-
trum at wavelengths k01 and k02, obey
237 Page 8 of 19 Y. Fang et al.
123
m ¼ n01k02
2 n02k01 � n01k02ð Þ : ð8Þ
Substitution Eq. (2) into Eq. (3) yields:
m2k20 ¼ A þ Bk2
0
k20 � a2
1
þ Ck20
k20 � a2
2
; ð9Þ
where A ¼ 4ad2, B ¼ 4bd2 and C ¼ 4cd2. The order numbers m at each extremum are
required before the values of A, B, C, a1 and a2 in the two-term Sellmeier fit can be
determined.
In Swanepoel (1985) the values of m were found by introducing an intermediate
quantity M as
M ¼ k02
2 k01 � k02ð Þ ; ð10Þ
where M�m. M = m in the non-dispersive case. In the dispersive case, the dispersion of
M was described by the approximate form:
M ¼ Cs
k0
1 þ Ds
kyo
� �ð11Þ
where Cs, Ds and y are fitting parameters. It will be shown in Sect. 4 that this approach
works well for determining m in the present studies. The dispersion of M can also be
described using a Sellmeier-inspired fitting of the form:
M ¼ E
k0
1 þ F
1 � b1
k0
� �2þ G
1 � b2
k0
� �2
0B@
1CA; ð12Þ
where E, F, G, b1 and b2 are fitting parameters which can then be used to find values of m
(BM) where, at each extremum wavelength ko, m takes an integer value close to trans-
mission maxima and half integer values of m close to transmission minima
Substitution Eq. (2) into Eq. (5), using Eq. (9), and solving for Dm yields:
Dm ¼ m2 k20
k2i
þ B
k2i
1
1 � a1
ki
� �2� 1
1 � a1
k0
� �2
0B@
1CAþ C
k2i
1
1 � a2
ki
� �2� 1
1 � a2
k0
� �2
0B@
1CA
264
375
1=2
�m:
ð13Þ
The value of ni at each wavelength can be calculated using Eqs. (13), (6) and (7).
Since m increases by 1/2 for each successive extremum described by Eq. (5), the value
of d, film thickness, can subsequently be determined. If the order the first extremum, m1, is
considered to be at the long-wavelength end, Eq. (5) can be written for the successive
extreme as described in an earlier paper of Swanepoel (1983), as:
L
2þ Dm
� �¼ 2d
ni
ki
� m1; ð14Þ
Determining the refractive index dispersion and thickness… Page 9 of 19 237
123
where m1 is the first order number, L = 0, 1, 2, 3…. Using L2þ Dm
� �as the dependent
variable and ni
kias the independent variable, a straight line can be plotted whose gradient
can be used to determine d.
With d and m known, the final values of refractive index at the wavelength of extrema
can be determined from Eq. (3). The two-term Sellmeier model of Eq. (2) is then used to
fit the final values of refractive index.
4 Results and discussion
The interference transmission spectra of the Ge16As24Se15.5Te44.5 and the As40Se60 thin
films are shown respectively in Fig. 2a, b. The solid curves in Fig. 2 represent the inter-
ference transmission spectrum for normal incidence whereas the dotted spectrum is that for
an incidence angle of 30�. Because the accuracy of the calculation depends on (k0 � ki),the angle of non-normal incidence should be large enough to get sufficient displacement
but not so large that the lateral spreading of the beam provides errors in the case of non-
uniform films. No particular significance should be attached to the actual values of
transmission of the oblique angle of incidence spectrum (dotted curve, red online) because
the effects of polarization can influence its magnitude for large angles of incidence (Fowles
1975). Another method to get sufficient displacement is to decrease the thickness of thin
films. As discussed in Sect. 3.2, decreasing the thickness of the thin film will result in
increasing difficulties in collecting complete samples after the hot-pressing. Thin films
having nominal thicknesses of 20 and 25 lm provide sufficient displacements between two
fringes and yet were strong enough to be collected.
Since the interference fringes below 2.85 lm are influenced by atmospheric water
absorption at wavelengths around 2.7 lm and the displacements (k0 � ki) were relatively
small, which led to errors in determining the thickness of the thin film as well as of the
refractive index, the extrema at wavelengths below 2.85 lm were not selected when
determining the thickness of the thin film. Some wavelengths of the extrema of Ge16-
As24Se15.5Te44.5 and As40Se60 thin films are listed in Tables 1 and 2 as k0 for normal
incidence and as ki for oblique incidence. These values could be determined to an accuracy
of 1 nm from the transmission spectra, sufficient to get a meaningful result (Swanepoel
1985).
The values of M that were calculated from Eq. (10), using the wavelengths at which
adjacent extrema occur at normal incidence, are shown in Table 2. These values were fitted
to Eq. (12) iterating b1 in steps of 0.0001 lm from 0 to 1.5 lm and b2 in steps of 0.01 lm
from 32 to 100 lm for Ge16As24Se15.5Te44.5, since the resonance wavelength b1 and b2
must be initially placed outside the transparent window fitting region to avoid the Sellmeier
model becoming unbounded (Dantanarayana et al. 2014). For AsSe, b1 was varied from 0
to 0.7 lm in steps of 0.0001 lm and b2 was iterated from 30 to 100 lm in steps of
0.01 lm. A good fit was obtained for both Ge16As24Se15.5Te44.5 and As40Se60 yielding
estimates for m at each extrema wavelength ko, termed my following the notation of
Swanepoel (1985), as
myk0 ¼ 123:20 þ 16:19
1 � 1:22k0
� �2þ 1:04 � 10�6
1 � 100:00k0
� �2for Ge16As24Se15:5Te44:5 ð15aÞ
237 Page 10 of 19 Y. Fang et al.
123
myk0 ¼ 142:60 þ 519:80
1 � 0:70k0
� �2þ 5:33 � 10�6
1 � 100:00k0
� �2for As40Se60 ð15bÞ
The values of M from Eq. (10) and my from Eqs. (15a, 15b) are shown in Table 1, together
with the actual value of m deduced.
The original Swanepoel approach to determining M, summarised by Eq. (11), yields
Mk0 ¼ 164:3268
k3:60
þ 139:6986 for Ge16As24Se15:5Te44:5 ð16aÞ
Table 1 Calculations of refractive index of Ge16As24Se15.5Te44.5 (GeAsSeTe) and As40Se60 (AsSe) thinfilms from the improved Swanepoel method
Thin film k0 ki M my m Dm ni n nellipsometry
GeAsSeTe 22.786 22.509 6.1 6.1 6 0.0770 3.150 3.131 3.1255
21.052 20.760 7.0 6.6 6.5 0.0944 2.967 3.134 3.1371
19.635 19.370 7.3 7.1 7 0.0985 3.011 3.148 3.1447
18.381 18.136 7.3 7.6 7.5 0.1036 3.040 3.158 3.1503
17.203 16.996 8.2 8.1 8 0.0994 3.201 3.152 3.1549
16.217 16.013 8.7 8.6 8.5 0.1102 3.136 3.157 3.1583
… …3.042 3.005 46.7 46.8 46 0.5650 3.214 3.205 3.2065
3.010 2.974 48.3 47.4 46.5 0.5669 3.227 3.205 3.2072
2.979 2.943 47.7 47.9 47 0.5864 3.195 3.206 3.2078
2.948 2.912 48.4 48.4 47.5 0.5875 3.209 3.207 3.2085
2.918 2.883 49.0 49.0 48 0.5944 3.207 3.208 3.2092
2.888 2.853 49.5 48.5 0.6008 3.206 3.208 3.2099
d = 21.83 lm n3:1lm from the minimum deviation method ¼ 3:1920
AsSe 23.896 23.5169 7.5 7.3 7 0.1213 2.720 2.710 –
22.411 22.0428 8.0 7.8 7.5 0.1333 2.687 2.723 –
21.087 20.7323 8.6 8.2 8 0.1440 2.671 2.733 –
19.934 19.5787 8.3 8.7 8.5 0.1611 2.604 2.745 –
18.803 18.5132 9.7 9.2 9 0.1466 2.804 2.742 –
17.880 17.5843 9.8 9.7 9.5 0.1655 2.714 2.752 –
… …3.040 2.991 57.8 57.6 57 0.9311 2.800 2.807 –
3.014 2.966 57.3 58.1 57.5 0.9341 2.808 2.807 –
2.988 2.941 58.4 58.6 58 0.9296 2.826 2.807 –
2.962 2.916 59.5 59.1 58.5 0.9392 2.824 2.808 –
2.938 2.891 60.7 59.6 59 0.9554 2.812 2.808 –
2.914 2.867 – 60.1 59.5 0.9717 2.800 2.808 –
d = 30.88 lm n3:1lm from the minimum deviation method ¼ 2:7972
Determining the refractive index dispersion and thickness… Page 11 of 19 237
123
Mk0 ¼ 930:3893
k3:60
þ 173:9862 for As40Se60 ð16bÞ
As in Swanepoel (1985) the values of my are calculated from the first terms on the right
hand side of Eqs. (16a) and (16b), and are shown in Table 2 along with the connected
values of m. From Tables 1 and 2, it can be seen that both of these methods are able to
determine the actual order number m of the fringes in Fig. 2.
The actual values of m are used in Eq. (9), iterating a1 in step of 0.0001 lm from 0 to
1.5 lm and a2 in step of 0.01 lm from 32 to 100 lm for Ge16As24Se15.5Te44.5. For
As40Se60, b1 was iterated from 0 to 0.7 lm in step of 0.0001 lm and b2 was iterated from
30 to 100 lm in step of 0.01 lm. The best fit was obtained for a1 ¼ 0:4051 and a2 ¼ 41:85
Table 2 Calculations of the refractive index of Ge16As24Se15.5Te44.5 (GeAsSeTe) and As40Se60 (AsSe) thinfilms from the original Swanepoel method
Thin film k0 ki M my m Dm ni n nellipsomtry
GeAsSeTe 22.786 22.509 6.1 6.1 6 0.0740 3.212 3.158 3.1255
21.052 20.760 7.0 6.6 6.5 0.0916 3.010 3.159 3.1371
19.635 19.370 7.3 7.1 7 0.0963 3.045 3.159 3.1447
18.381 18.136 7.3 7.6 7.5 0.1017 3.067 3.160 3.1503
17.203 16.996 8.2 8.1 8 0.0980 3.224 3.160 3.1549
16.217 16.013 8.7 8.6 8.5 0.1089 3.154 3.161 3.1583
…3.042 3.005 46.7 45.9 46 0.5660 3.217 3.206 3.2065
3.010 2.974 48.3 46.4 46.5 0.5673 3.230 3.206 3.2072
2.979 2.943 47.7 46.9 47 0.5853 3.198 3.207 3.2078
2.948 2.912 48.4 47.4 47.5 0.5862 3.212 3.207 3.2085
2.918 2.883 49.0 47.9 48 0.5930 3.210 3.208 3.2092
2.888 2.853 48.4 48.5 0.5993 3.210 3.209 3.2099
d = 21.84 lm n3:1lm from the minimum deviation method ¼ 3:1920
AsSe 23.896 23.5169 7.5 7.3 7 0.1131 2.815 2.761 –
22.411 22.0428 8.0 7.8 7.5 0.1258 2.765 2.761 –
21.087 20.7323 8.6 8.3 8 0.1371 2.735 2.761 –
19.934 19.5787 8.3 8.7 8.5 0.1546 2.657 2.761 –
18.803 18.5132 9.7 9.3 9 0.1415 2.853 2.762 –
17.880 17.5843 9.8 9.7 9.5 0.1604 2.755 2.762 –
…3.040 2.991 57.8 57.2 57 0.9394 2.788 2.797 –
3.014 2.966 57.3 57.7 57.5 0.9323 2.796 2.797 –
2.988 2.941 58.4 58.2 58 0.9379 2.814 2.798 –
2.962 2.916 59.5 58.7 58.5 0.9475 2.812 2.798 –
2.938 2.891 60.7 59.2 59 0.9639 2.800 2.798 –
2.914 2.867 – 59.7 59.5 0.9803 2.788 2.799 –
d = 30.98 lm n3:1lm from the minimum deviation method ¼ 2:7972
237 Page 12 of 19 Y. Fang et al.
123
in the case of Ge16As24Se15.5Te44.5, which is shown in Fig. 3a and a1 ¼ 0:6584 and a2 ¼58:30 in the case of As40Se60 as shown in Fig. 3c yielding:
m2k20 ¼ 1:118 þ 1:924 � 104k2
k2 � 0:40512þ 1353k2
k2 � 41:852for Ge16As24Se15:5Te44:5 ð17aÞ
m2k20 ¼ 2:425 � 104 þ 5524k2
k2 � 0:65842þ 8832k2
k2 � 58:302for As40Se60 ð17bÞ
From the original Swanepoel method, the best fit was obtained when x = 1 yielding:
m2k20 ¼ 2:028 � 103
k1þ 1:893 � 104 for Ge16As24Se15:5Te44:5 ð18aÞ
m2k20 ¼ 3:506 � 103
k1þ 2:901 � 104 for As40Se60 ð18bÞ
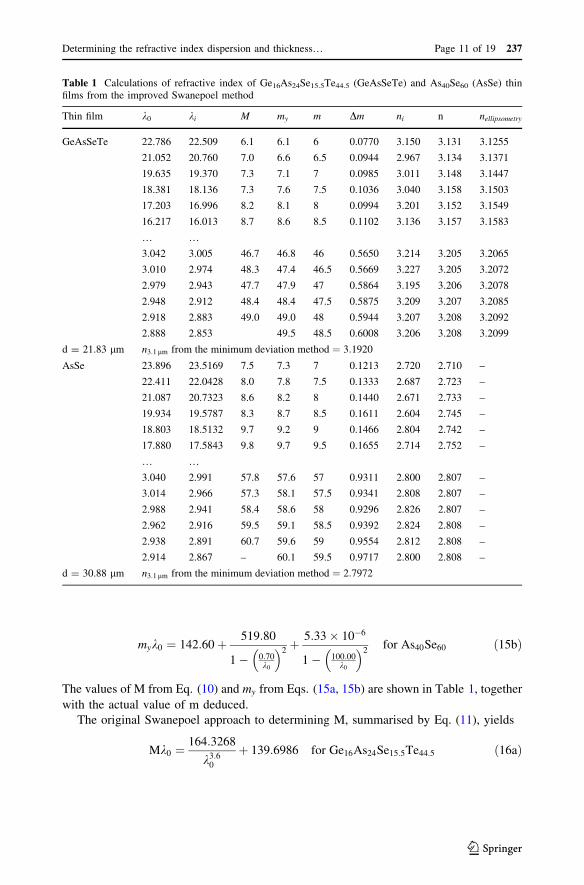
For Ge16As24Se15.5Te44.5, the best fitting from the original Swanepoel method is shown
in Fig. 4c. The value of R2 (correlation coefficient) is 0.8997 and MSE (mean squares
error) is 3.584 9 103. After the improvement of the method, the fitting is shown in Fig. 4a
18400
18600
18800
19000
19200
19400
19600
19800
0 5 10 15 20 25
(mλ 0
)2
Wavelength /μm
27500
28000
28500
29000
29500
30000
30500
0 10 20 30
(mλ 0
)2
Wavelength /μm
18600
18800
19000
19200
19400
19600
19800
0 0.1 0.2 0.3 0.4
(m*λ
)^2
1/λ
27500
28000
28500
29000
29500
30000
30500
0 0.1 0.2 0.3 0.4
(m* λ
)^2
1/λ
(a) (b)
(c) (d)
Fig. 4 a, b Best fit to Eq. (9) in the improved Swanepoel method, Eqs. (17a, 17b), for a Ge16As24Se15.5-
Te44.5, b As40Se60; c, d best fit to the experimental data using the original Swanepoel method, Eqs. (18a,18b), c Ge16As24Se15.5Te44.5, d As40Se60
Determining the refractive index dispersion and thickness… Page 13 of 19 237
123
with R2 = 0.9954 and MSE = 1.621 9 102. Applying the original Swanepoel method to
As40Se60, R2 of the best fit is 0.6702 and the MSE is 4.686 9 104, as shown in Fig. 4d.
From Fig. 4b, the best fit from the improved Swanepoel method yields R2 = 0.9980 and
MSE = 2.858 9 102. The poor fits from the original Swanepoel method indicate that the
original dispersive model is not appropriate to describe the refractive index dispersion of
chalcogenide thin films in the mid-infrared region. In contrast, good quality fitting to the
mk0 data, as in Eq. (9), was obtained by using a two-term Sellmeier model as the dis-
persive equation.
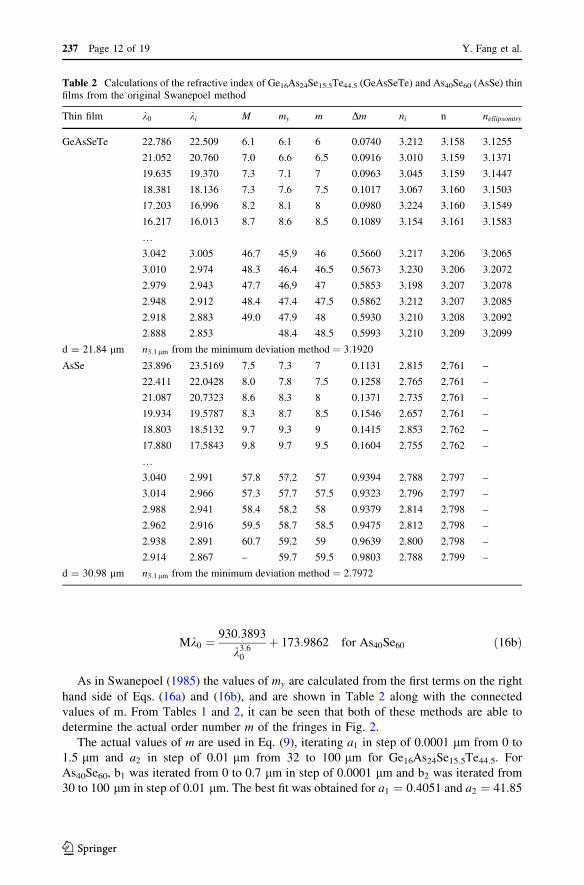
Dm was calculated from Eq. (13) and ni was calculated from Eqs. (6) and (7). The
results of Dm and ni for Ge16As24Se15.5Te44.5 and As40Se60 from the improved method are
shown in Table 1. Figure 5 shows a plot of l/2 ? Dm as a function of ni/ki; Eq. (14) shows
that the gradient of this straight line plot is 2d. The slope of the straight line is 43.66 lm for
Ge16As24Se15.5Te44.5 and 61.76 lm for As40Se60, yielding values for d of d ¼ 21:83 lm
(target thickness: 20 lm) and d ¼ 30:88 lm (target thickness: 25 lm), respectively. The
difference between the calculated thickness and the target thickness can be attributed to the
quality of the shims, short hot-pressing time or the high glass-melt viscosity during the hot
pressing.
The results of Dm and ni for Ge16As24Se15.5Te44.5 and As40Se60 from the original
Swanepoel are shown in Table 2. The plots of Eq. (14) are shown in Fig. 5b for
-10
0
10
20
30
40
50
0 0.2 0.4 0.6 0.8 1 1.2
l/2+Δ
m
ni/λi /μm-1 -10
0
10
20
30
40
50
0 0.5 1 1.5
l/2+Δ
m
ni/λi /μm-1
-10
0
10
20
30
40
50
60
70
0 0.2 0.4 0.6 0.8 1 1.2
l/2+Δ
m
ni/λi /μm-1-10
0
10
20
30
40
50
60
70
0 0.5 1 1.5
l/2+Δ
m
ni/λi /μm-1
(a) (b)
(c) (d)
Fig. 5 Plot of l/2 ? Dm as a function of ni=ki for: a Ge16As24Se15.5Te44.5 thin film from improvedSwanepoel method; b Ge16As24Se15.5Te44.5 thin film from the original method; c As40Se60 thin film fromimproved Swanepoel method and d As40Se60 thin film from the original Swanepoel method to determine thefilm thickness d
237 Page 14 of 19 Y. Fang et al.
123
Ge16As24Se15.5Te44.5 and Fig. 5d for As40Se60. The calculated thickness of GeAsSeTe and
AsSe are 21.84 and 30.98 lm, respectively.
From Fig. 5a, b, the MSE from the improved method for the Ge16As24Se15.5Te44.5
measurement was 4.302 9 10-4 lower than that from the original Swanepoel method. The
MSE from the improved method for AsSe was 2.425 9 10-3 lower than that from the
original method, as shown in Fig. 5c, d. Although the quality of the line fitting was similar,
the values of Dm from the original method were obtained from the poor fitting in Fig. 4c,
which would have led to an error in determining the film thickness d. In the case of
Ge16As24Se15.5Te44.5, the thickness determination was better by 0.01 lm in the improved
method, which would have led to *0.001 difference in refractive index. In the case of
As40Se60, the observed difference of thickness was 0.1 lm which would have led to a
refractive index difference of *0.009.
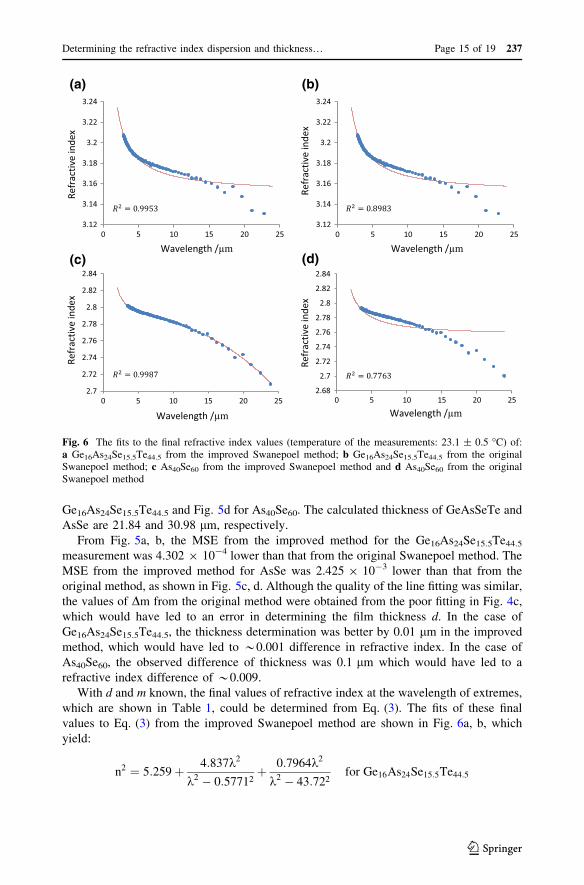
With d and m known, the final values of refractive index at the wavelength of extremes,
which are shown in Table 1, could be determined from Eq. (3). The fits of these final
values to Eq. (3) from the improved Swanepoel method are shown in Fig. 6a, b, which
yield:
n2 ¼ 5:259 þ 4:837k2
k2 � 0:57712þ 0:7964k2
k2 � 43:722for Ge16As24Se15:5Te44:5
3.12
3.14
3.16
3.18
3.2
3.22
3.24
0 5 10 15 20 25
Refr
activ
ein
dex
Wavelength /μm
3.12
3.14
3.16
3.18
3.2
3.22
3.24
Refr
activ
ein
dex
Wavelength /μm
2.7
2.72
2.74
2.76
2.78
2.8
2.82
2.84
0 5 10 15 20 25
Refr
activ
ein
dex
Wavelength /μm
2.68
2.7
2.72
2.74
2.76
2.78
2.8
2.82
2.84
0 5 10 15 20 25
Refr
activ
e in
dex
Wavelength /μm
(a) (b)
(c) (d)
0 5 10 15 20 25
Fig. 6 The fits to the final refractive index values (temperature of the measurements: 23.1 ± 0.5 �C) of:a Ge16As24Se15.5Te44.5 from the improved Swanepoel method; b Ge16As24Se15.5Te44.5 from the originalSwanepoel method; c As40Se60 from the improved Swanepoel method and d As40Se60 from the originalSwanepoel method
Determining the refractive index dispersion and thickness… Page 15 of 19 237
123
n2 ¼ 3:463 þ 4:341k2
k2 � 0:39202þ 2:124k2
k2 � 56:312for As40Se60
In our previous study of a Sellmeier refractive index model fit to As40Se60 ellipsometry
data (Dantanarayana et al. 2014), several different sets of Sellmeier coefficients could be
obtained depending on the choice of an parameters in the Sellmeier fit. We believe that it is
important that the two-term Sellmeier model lends itself to a physical interpretation as this
could open the way to the model being a predictive tool. In our previous work, in the two-
term Sellmeier the a1 coefficient was proposed to be linked to the optical bandgap and a2
proposed to be associated with vibrational band resonant fundamental absorption. The
value of a2 in Dantanarayana et al. (2014) was 41.395 lm which fits well with the position
of the fundamental As–Se stretching band calculated to occur at 41.7 lm (Maklad et al.
1974). Performing a fit to the present experimental data for the refractive index of As40-
Se60, but now fixing the value of a2 to that which was used in Dantanarayana et al. (2014),
yields:
n2 ¼ 4:196 þ 3:602k2
k2 � 0:438342þ 0:975k2
k2 � 41:3952for As40Se60
with R2 = 0.9975. Compared to the best fit in Fig. 6c, the R2 decreases from 0.9987 to
0.9975. The difference between the two fits may be attributed to the limited experimental
wavelength region (2–25 lm) and the effect of the material absorption [at 20.8 lm—
which is the first overtone of the As–Se fundamental stretching vibrational absorption at
41.7 lm (Maklad et al. 1974)]. For the Ge16As24Se15.5Te44.5 glass no bandgap information
is available, and no obvious material absorption was noticed in the transmission spectrum
and thus a best Sellmeier fit to the experimental data is presented.
The fits of these final values to Eq. (3) from the original Swanepoel method are shown
in Fig. 6b, d, which yield:
n2 ¼ 1:064
k1þ 9:926 for Ge16As24Se15:5Te44:5
n2 ¼ 0:7057
k1þ 7:591 for As40Se60
For the Ge16As24Se15.5Te44.5 thin film, the Sellmeier dispersive equation introduced in
this paper also provided better curve fitting to the refractive index data than the original
dispersive equation, as shown in Fig. 6a, b. The value of R2 improved from 0.8983 to
0.9953. For the As40Se60 thin film, the fit from the improved Swanepoel method is far
better than that from the original method, as shown in Fig. 6c, d. In Fig. 6b, d, it is obvious
that the original dispersive equation could not encompass the entire transparent window of
chalcogenide glasses. The results confirm the findings of Dantanarayana et al. (2014) that a
two-term Sellmeier model, with one resonant absorption in the glass optical bandgap
region and one resonant absorption in the fundamental absorption spectral region in the
mid-infrared, is sufficient for fitting the refractive index dispersion across the transparent
window of each glass.
The refractive indices of Ge16As24Se15.5Te44.5 and As40Se60 from the present thin film
measurements, a prism minimum deviation measurement (Fang et al. 2016) and ellip-
sometry are shown in Fig. 7. All the Ge16As24Se15.5Te44.5 measurements were made on
glass samples from the same glass-melt-batch. The prism and thin film measurements for
237 Page 16 of 19 Y. Fang et al.
123
As40Se60 were also made on glass from the same glass-melt-batch but the ellipsometry
measurements are those reported in Dantanarayana et al. (2014) and were made on
As40Se60 glass from a different glass-melt-batch. The minimum deviation method in our
laboratory is able to determine the refractive index of chalcogenide prisms with a standard
deviation of less than 0.001; we take these results as our benchmark value. From Fig. 7a,
the difference in refractive index for the Ge16As24Se15.5Te44.5 from the thin film mea-
surements and from the minimum deviation measurements is 0.0119 (0.37%) at a wave-
length of 3.1 lm, which might be attributed to their different thermal history (that is, the
difference in quenching and annealing of the bulk glass to make the prism and after hot-
pressing to make the thin film). In contrast, since the thin film and ellipsometry sample of
Ge16As24Se15.5Te44.5 were actually both hot-pressed in a similar manner, which provided a
similar thermal history, this provides understanding of why the error in refractive index
between them is less than 0.17% from 2 to 25 lm. For As40Se60, the difference in
refractive index between the thin film measurements and ellipsometry is greater than that
for the Ge16As24Se15.5Te44.5, but is still less than 1.05% from 2 to 25 lm, and is subject to
unintentional compositional differences between the different glass batches which were
prepared and then melted independently of one another. From Fig. 7b, the difference in
refractive index between the thin film measurements and the prism minimum deviation
measurements is 0.0079 (0.28%) at a wavelength of 3.1 lm, and the difference in the
refractive index from the improved Swanepoel method compared to the commercial Schott
data (Schott 2013) is less than 0.0043. Repeated measurements showed that the refractive
index dispersion is determined by the improved method with a standard deviation of less
than 0.0027 for the As40Se60 thin films and less than 0.002 for the Ge16As24Se15.5Te44.5
thin films.
The Swanepoel method in both the original and improved forms is sensitive to the
calculated sample thickness, as indicated by Eq. (3). The surfaces of the thin films of
Ge16As24Se15.5Te44.5 and As40Se60 produced were both not perfect. However, according to
(Swanepoel 1985) these kinds of glass surface undulation and glass surface defects (so long
as they are limited in size relative to the wavelength of the light) do not affect the
wavelength values of the extrema and hence the method used still yields correct and
accurate values for refractive index and thickness.
3.083.1
3.123.143.163.18
3.23.223.243.26
0 5 10 15 20 25 30
Refr
activ
e in
dex
Wavelength /μm
2.662.68
2.72.722.742.762.78
2.82.822.84
0 5 10 15 20 25 30
Refr
activ
e in
dex
Wavelength /μm
Sellmeier fit to thin film data Sellmeier fit to thin film data
Ellipsometry data of AsSe
Schott data (2012) (a) (b)
Ellipsometry data of GeAsSeTe
Prism measurement Prism measurement
Fig. 7 Sellmeier fit to the final refractive index values of a Ge16As24Se15.5Te44.5 and b As40Se60 from FTIRthin film measurements comparing to the data from minimum deviation measurement, ellipsometry andSchott (2013)
Determining the refractive index dispersion and thickness… Page 17 of 19 237
123
5 Conclusions
A hot-pressing technique was used to fabricate chalcogenide glass thin films of 20 and
25 lm target thickness from fibres. The characteristic interference fringes in the spectral
transmission of these thin films were obtained over the wavelength range from 2 to 25 lm
by FTIR spectroscopy. The Swanepoel method (Swanepoel 1985) was modified to include
a two-term Sellmeier model as the dispersive equation and was successfully applied to
determine the refractive index of Ge16As24Se15.5Te44.5 and As40Se60 thin films over the
wavelength range from 2 to 25 lm to an accuracy of better than 0.4%. It was shown that
the original Swanepoel method (Swanepoel 1985) failed to correctly determine the
refractive index dispersion of the chalcogenide glasses studied in the MIR spectral region
because it uses an inappropriate Cauchy-like dispersive equation. The average thicknesses
of the non-uniform thin films were also determined by the improved Swanepoel method
presented.
Acknowledgements The authors are grateful to the Naval Research Laboratory (Washington D. C. USA)for their support in providing the ICL used in this work.
Open Access This article is distributed under the terms of the Creative Commons Attribution 4.0 Inter-national License (http://creativecommons.org/licenses/by/4.0/), which permits unrestricted use, distribution,and reproduction in any medium, provided you give appropriate credit to the original author(s) and thesource, provide a link to the Creative Commons license, and indicate if changes were made.
References
Abdel-Moneim, N.S., Mellor, C.J., Benson, T.M., Furniss, D., Seddon, A.B.: Fabrication of stable, low lossoptical loss rib-waveguides via embossing of sputtered chalcogenide glass-film on glass-chip. Opt.Quantum Electron. 47(2), 351–361 (2015)
Carlie, N., Anheier, N., Qiao, H., Bernacki, B., Phillipes, M., Petit, L., Musgraves, J., Richardson, K.:Measurement of the refractive index dispersion of As2Se3 bulk glass and thin films prior to and afterlaser irradiation and annealing using prism coupling in the near- and mid-infrared spectral range. Rev.Sci. Instrum. 82, 053103-1–053103-7 (2011)
Corrales, C., Ramırez-Malo, J., Fernandez-Pena, J., Villares, P., Swanepoel, R., Marquez, E.: Determiningthe refractive index and average thickness of AsSe semiconducting glass films from wavelengthmeasurement only. Appl. Opt. 34, 7907–7913 (1995)
Crawford, F.S.: Waves, p. 182. McGraw-Hill, New York (1968)Dantanarayana, H.: Application of TLM for optical micro-resonators. Ph.D. thesis, Faculty of Engineering,
The University of Nottingham, Nottingham (2012)Dantanarayana, H.G., Abdel-Moneim, N., Tang, Z., Sojka, L., Sujecki, S., Furniss, D., Seddon, A.B., Kubat,
I., Bang, O., Benson, T.M.: Refractive index dispersion of chalcogenide glasses for ultra-highnumerical-aperture fiber for mid-infrared supercontinuum generation. Opt. Mater. Express 4(7),1444–1455 (2014)
Falconi, M.C., Palma, G., Starecki, F., Nazabal, V., Troles, J., Taccheo, S., Ferrari, M., Prudenzano, F.:Design of an efficient pumping scheme for mid-IR Dy3 ? :Ga5Ge20Sb10S65 PCF fiber laser. IEEEPhotonics Technol. Lett. 28(18), 1984–1987 (2016)
Falconi, M.C., Palma, G., Starecki, F., Nazabal, V., Troles, J., Adam, J., Taccheo, S., Ferrari, M., Pru-denzano, F.: Dysprosium-doped chalcogenide master oscillator power amplifier (MOPA) for mid-IREmission. J. Lightwave Technol. 35(2), 265–273 (2017)
Fang, Y., Sojka, L., Jayasuriya, D., Furniss, D., Tang, Z.Q. Markos, C., Sujecki, S., Seddon, A.B., Benson,T.M.: Characterising refractive index dispersion in chalcogenide glasses. In: Proceedings of 18thInternational Conference on Transparent Optical Networks (2016)
Fowles, G.R.: Introduction to Modern Optics, p. 44. Holt, Rinhart and Winston, New York (1975)Gibson, D., MacGregor, C.: A novel solid state non-dispersive infrared CO2 gas sensor compatible with
wireless and portable deployment. Sensors 13(6), 7079–7103 (2013)
237 Page 18 of 19 Y. Fang et al.
123
Gleason, B., Richardson, K., Sisken, L., Smith, C.: Refractive index and thermo-optic coefficients of Ge–As–Se chalcogenide glasses. Int. J. Appl. Glass Sci. 7(3), 374–383 (2016)
Hu, J., Menyuk, C.R., Wei, C., Shaw, L.B., Sanghera, J.S., Aggarwal, I.D.: Highly efficient cascadedamplification using Pr3 ? -doped mid-infrared chalcogenide fiber amplifiers. Opt. Lett. 40(16),3687–3690 (2015)
Jin, Y., Song, B., Jia, Z., Zhang, Y., Lin, C., Wang, X., Dai, S.: Improvement of Swanepoel method forderiving the thickness and the optical properties of chalcogenide thin films. Opt. Express 25(1),440–451 (2017)
Laniel, J.M., Menard, J., Turcotte, K., Villeneuve, A., Vallee, R., Lopez, C., Richardson, K.A.: Refractiveindex measurements of planar chalcogenide thin film. J. Non Cryst. Solids 328, 183–191 (2003)
Maklad, M.S., Mohr, R.K., Howard, R.E., Macedo, P.B., Moynihan, C.T.: Multiphonon absorption inAs2S3–As2Se3 glasses. Solid State Commun. 15, 855–858 (1974)
Marquez, E., Gonzalez-Leal, J.M., Prieto-Alcon, R., Vlcek, M., Stronski, A., Wagner, T., Minkov, D.:Optical characterization of thermally evaporated thin films of As40S40Se20 chalcogenide glass byreflectance measurements. Appl. Phys. 67, 371–378 (1998)
Orava, J., Kohoutek, T., Wagner, T., Cerna, Z., Vicek, M., Benes, L., Frumarova, B., Frumar, M.: Opticaland structural properties of Ge-Se bulk glasses and Ag-Ge-Se thin films. J. Non Cryst. Solids 355,1951–1954 (2009)
Petersen, C.R., Møller, U., Kubat, I., Zhou, B., Dupont, S., Ramsay, J., Benson, T., Sujecki, S., Abdel-Moneim, N., Tang, Z., Furniss, D., Seddon, A., Bang, O.: Mid-infrared supercontinuum covering the1.4–13.3 lm molecular fingerprint region using ultra-high NA chalcogenide step-index fibre. Nat.Photonics 8(11), 830–834 (2014)
Poelman, D., Smet, P.: Methods for the determination of the optical constants of thin films from singletransmission measurements: a critical review. J. Phys. D Appl. Phys. 36, 1850–1857 (2003)
Qiao, H., Anheier, N., Musgraves, J., Richardson, K., Hewak, D.: Measurement of chalcogenide glassoptical dispersion using a mid-infrared prism coupler. Proc. SPIE 8016(80160F), 1–10 (2011)
Sanghera, J.S., Aggarwal, I.D.: Active and passive chalcogenide glass optical fibers for IR applications: areview. J. Non Cryst. Solids 256–257, 6–16 (1999)
Sanghera, J.S., Shaw, L.B., Aggarwal, I.D.: Chalcogenide glass-fiber-based mid-IR sources and applica-tions. J. Sel. Top. Quantum Electron. 15(1), 114–119 (2009)
Schott Glass Inc.: Schott Infrared Chalcogenide Glass—IRG26 (2013)Seddon, A.B.: Chalcogenide glasses: a review of their preparation, properties and applications. J. Non Cryst.
Solids 184, 44–50 (1995)Seddon, A.B., Pan, W.J., Furniss, D., Miller, C.A., Rowe, H., Zhang, D.M., Mcbrearty, E.M., Zhang, Y.,
Loni, A., Sewell, P., Benson, T.M.: Fine embossing of chalcogenide glasses—a new fabrication routefor photonic integrated circuits. J. Non Cryst. Solids 352(23–25), 2515–2520 (2006)
Seddon, A.B., Abdel-Moneim, N.S., Zhang, L., Pan, W.J., Furniss, D., Mellor, C.J., Kohoutek, T., Orava, J.,Wagner, T., Benson, T.M.: Mid-infrared integrated optics: versatile hot embossing of mid-infraredglasses for on-chip planar waveguides for molecular sensing. Opt. Eng. 53(7), 071824-1–071824-9(2014)
Swanepoel, R.: Determination of the thickness and optical constants of amorphous silicon. J. Phys. E: Sci.Instrum. 16, 1214–1222 (1983)
Swanepoel, R.: Determining refractive index and thickness of thin films from wavelength measurementsonly. Opt. Soc. Am. 2, 1339–1343 (1985)
Tang, Z., Furniss, D., Fay, M., Sakr, H., Sojka, L., Neate, N., Weston, N., Sujecki, S., Benson, T.M.,Seddon, A.B.: Mid-infrared photoluminescence in small-core fiber of praseodymium-ion doped sele-nide-based chalcogenide glass. Opt. Mater. Express 5(4), 870–886 (2015)
Wang, Y., Qi, S., Yang, Z., Wang, R., Yang, A., Lucas, P.: Composition dependences of refractive indexand thermo-optic coefficient in Ge–As–Se chalcogenide glasses. J. Non Cryst. Solids 459, 88–93(2017)
Zakery, A., Elliott, S.: Optical properties and applications of chalcogenide glasses: a review. J. Non Cryst.Solids 330(1), 1–12 (2003)
Determining the refractive index dispersion and thickness… Page 19 of 19 237
123