determining the hydraulic properties of a swelling soil
TRANSCRIPT

i
Determining the Hydraulic Properties of a Swelling Soil from a Transient Evaporation Experiment
P I' P. oivin, M. Vauclin, and P. Baveye
I ABSTRACT' Most methods irsed to determine tlie hydraulic properties of s~vell-
iiig soils (i.e., tlie slirinlcage cnrve [ e ( 3 ) ] , tlie moisture retention cnrve (/1(3)], and the hydraulic conductivity curve [ K ( 3 ) ] ) are time c~nsuni- ing because they require iiiea~iireinents of several different paranie- ters (either in separate experinients or by using very expensive equip- ment). We propose a siriiplc evaporation experinient to sininl- taneonsly cleteriiiine all three soil hyclranlic properties. The method is illustrated using saniples afa Vertisol from tlie Seneg:il River valley. The valile of e ( 3 ) is determined (luring the experiiiient by horizontal :incl vertic:il linear deformation nieasnrenients, whereas an inverse piir:inieter estimation iiiethocl is used to cleterniiiie lr(3T) ancl K ( 3 ) . This method relies on a water Ilow nioclcl that takes into account tlie three-cliiiieiisioii~il ancl :inisotropic deforniation of tlie soil. l'lie reliability of the estini;itecl parameter vi~liies was checked ant1 we coiiiparetl tlie resnlts with those obtiiinecl by a ninltistep outllow experiment. Good ;igreenient WIS found between tlie rcsnlts of the different proceclnres. l'lie sensitivity of tlic iiictliocl to c1elorni:ition \v:is also analyzccl. I n tlic soil investig:itccl, tlie inverse nietliotl does not see111 to reqoirc tlie ilse of a water Ilow moclcl that takes into acconnt clcforiiiation. However, a correction for c1cforni:ition is needed if tlie c1iar:ictcristic fnnctions are songlit in ternis of tlie volu- metric water content of the soil.
N SPITE or: c o " w o u s EFFORTS for several decadcs, I ni od e 1 i ng wa te r and so I u te tra n Spor t i n swe I I i ng- shrinking soils remains a very challenging endeavor, evcii in the abscncc of cracks. Sevcral approaclics have been proposcd to derivc water flow equations applicable to these soils, and have met with reasonably good suc- cess in practice. Progress continues to be made i n this area, for example with the development by Garnier et al. (1997) of a water flow equation that accounts for anisotropic, three-dimensional deformit' ion.
Where daunting challenges persist, however, is in the experimental determination of model parameters. In rigid soils, two characteristic functions need to be evalu- atcd: tlie moisture characteristic curve (moisture con- tent-pressure head relationship) and the unsaturated hydraulic conductivity vs. pressure head curve. In swell- ing soils, the so-called shrinkage curve relating the spe- cific volume of a soil sample to its moisture content must also be defined. Often, the shrinkage curve is de- termined (e.g., via hydrostatic weighing) in a separate experiment (Kim et al., 1993; Crescinianno and Iovino,
P. Garnier, Laboratoire d'Hydrophysique, ORSTOM, 32, Avenue Henri Varagnat, 93143 Bondy Cedex, France: M. Rieu, ORSTOM. 213 Rue Lafayette, 75480 Paris Cedex, France: P. Boivin, ORSTOM Ham. BP 1346, Dakar, Senegal; M. Vauclin, Laboratoire d'Etude des Transferts en Hydrologie et Environnement, LTHE, UMR (CNRS. INPG. UJF). BP 53.3SO-ll Grenoble Cedex 9, France; and P. Baveye, Lab. of Environmental Geophysics, Bradfield Hall, Cornell Univ., Ithaca, NY. Received 6 Dec. 1996. "Corresponding author (rieu@
' paris.orstom.fr). .- - I
Published in Soil Sci. Soc. Am. J. 61:1555-15e3 (1997). - - . . . . .
1995). Simultaneous measurement of the three functions characterizing swelling soils may be achieved experi- mentally, for example using the dual gamma-ray system used by Angulo Jaramillo (1989). However, these cur- rent measurement techniques tend to be time consum- ing, making them ill suited for routine analysis. Some progress was achieved recently with the development by Kim et al. (1992) of a technique to measure the deformation curve at the same time as the other hydrau- lic properties.
In rigid soils, inverse methods are attractive for the estimation of transport and retention parameters (Zach- man et al., 1981; Kool et al., 19S5; Eching et al., 1994). The same methods might be used advantageously in swelling soils. In the last few years, several attempts have been made in this direction (Kim et al., 1993; Cres- cinianno and Iovino, 1995), using outflow experiments. However, they have relied on one-dimensional water flow models that do not account for deformation. A water flow model considering deformation might be used in order to evaluate if the estimated parameters are sensitive to the deformation.
In this context, tlie first objective of this research was to describe 'and test a new method to evaluate the hydraulic characteristics of swelling soils. This method is based on transient evaporation experiments, on an inverse estimation technique, and on the use of tlic water flow equation developed by Garnier et al. (1997) accounting for anisotropic deformation. The niethod is illustrated with experimental data obtained on three Vertisol samples from the Senegal River valley. Results obtained from direct measurement and from the appli- cation of an inverse method to multistep outflow data are compared following Eching et al. (1994).
The second objective of our research was to evaluate the sensitivity of the estimated hydraulic properties to tlie deformation in spier to determine if it is necessary to take into account the deformation in the water flow model.
,
MATERIALS AND METHODS Evaporation and Multistep Outflow Experiments
Soil
The, evaporation and the multistep outflow experiments were carried out with identical Vertisol samples from Podor, in the Senegal River valley. Each type of experiment was carried out with three samples. The textural composition of the soil is 10% sand, 24% silt, and 66% clay. According to x-ray diffraction data, the composition of the clay phase is as follows: 60% smectite, 30% kaolinite, 5% illite, and 5% chlo- rite. The soil was sieved through a 200-pm screen and satu- rated with distilled and degassed water. The soil was air dried for 4s h and mixed regularly until it reached a stable moisture content. It was then packed to a uniform wet bulk density (= 1.9 g cn1-j) into 4.8-cm-diam. and 5-cm-long brass cylinders.
.

1556 SOIL SCI. SOC. AM. J.. VOL. 61, NOVEMBER-DECEMBER 1997
Samples were removed from the cylinder and final saturation was accomplished by wetting the cylindrical samples from the bottom at a pressure head of -0.1 m of water.
Evaporation Experiment
The evaporation experiment was carried out in a controlled- temperature chamber at 27°C. The cylindrical soil sample was placed on the plate of a balance (0.01-g accuracy) in order to determine the evaporative water loss with time (Fig. 1). A plastic film covered the vertical side so that evaporation oc- curred only through the top surface. Two tensiometers with a 2-cm-long cup (0.2-cm 0.d.) were inserted horizontally in the sample at 1 and 4 cm from the top surface. The ceramic cups were connected to pressure transducers (Model SA, Data Instruments) with a sensitivity of 2 2 cm of water. The soil water pressure head h (cm) can be deduced from the tensio- metric measurement T (cm) and overburden head R (cm) via the relationship h = T - 0. The overburden head is calculated from the overlying so2 density y (g cm-3) and-the slope of the swelling curve V with the equation R = V + Jfydz (Talsma, 1974). Laser spot (LB-72, Keyence Corp., Nanterre, France) and laser barriers (LX2-12, Keyence Corp.) were used to measure soil sample height and diameter, respectively. The sensitivities were 2 pm for the laser spot and 100 pm for the laser barriers. We used laser sensors because they are more sensitive and more practical to measure lateral deformation than the contact sensors commonly used (e.g., Kim et al., 1992). The plastic film was removed at the tensiometer limit in order to accelerate the evaporation at the end of the experi- ment. The evaporation experiment was stopped when the sam- ple volume remained constant. The evaporation rate was 0.55 cm3 h-l for 6 h and the 0.45 cm3 h-l. After drying the sample at 105"C, the dry bulk density at the shrinkage limit Pd" (g cm-3) was determined from hydrostatic weighing using a plastic bag (Boivin et al., 1991). and the density of the solid particles (ps) was determined from the mass of the solid particles and the water displaced by them. The value of p, is 2.696 g cm-j.
Measurement of the diameter and height of the sample gave the void ratio e([) (volume of void/volume of solid, m3 m-3) as a function of time by:
PI where L( t ) (cm) and LI, (cm) are the heights of the sample at time t and at the shrinkage limit (SL), respectively, and D ( t ) (cm) and DI, (cm) are the diameters of the sample at time f and at the shrinkage limit, respectively.
During its deformation, the volume v of a soil sample of length z may be related to its shrinkage limit volume vg and
1 .. , I LASERSPOT 3. . '..i..' I
i LASERRAY .. : . . PLASTIC FILM
I
IOMETER TENSIOMET
LASFD BARI
,I.
BALANCE ZERS
Fig. 1. Apparatus used to determine the hydraulic properties of a sample of swelling soil under evaporation.
- I I I ' t ' - I , < I 1 I ' , ,
length zlI by using Bronswjik's (1990) dimensionless geometry factor, r,, defined by:
When the deformation occurs only in the vertical direction (z), r, = 1. In the case of isotropic deformation, r, = 3. If vertical deformation is predominant then 1 < r, <3, otherwise r, > 3. In our experiments, the geometry factor can be calcu- lated as a function of time using Eq. [2] expressed in terms of the diameter of the soil sample:
[31
Multistep Outflow Experiment
In each multistep outflow experiment, the soil sample was placed in a pressure cell and was subjected to an increase in water suction through a ceramic plate with an impedance of 0.01342 h-,l. The experiments were carried out by applying successive water suction increments at the bottom of the sam- ple because pneumatic pressure at the top could have affected ' the shrinkage behavior. The multistep outflow experiments . were performed on the soil in steps of suction at values of i -50, -100, -170, -240, -450, and -620 cm of water. The ', outflow was measured with a burette linked by tubing between the sample and the vacuum pump. The microtensiometer was
.
installed horizontally at 1 cm from the top of the sample. Microtensiometer and transducer had the same characteristics as in the evaporation experiment. A contact sensor (Model RDP, Schlumberger, Montrouge, France), with a sensitivity of 10 pm, was used to measure the change in the sample height with time. The void ratio e was calculated from the sample height measurement by:
141
The geometry factor r, was calculated at the initial time using Eq. [3] and measurement of the height and the diameter at the initial and final time. The geometry factor was assumed to be constant during shrinkage.
Water Flow Model The three-dimensional form of the general water flow equa-
tion in a Lagrangian coordinate system is given by (e.g., Raats and Klute, 196s; Angulo Jaramillo, 1989; Garnier et al., 1997):
*
where 6 (m' m-')-is the moisture ratio (volume of water/ volume of solid), (cm h-I) is the hydraulic conductivity tensor relative to the solid phase, H (cm) is the soil water head, the operator V, indicates that the spatial derivatives are with respect to Lagrangian coordinates. The terms of the transformation gradient tensor F y are Fsij = a.u,/aX,. They ex- press the rapport between the spatial coordinate (xi) and the material coordinate ( X j ) (Baveye, 1992).
Garnier et al. (1997) showed that for a three-dimensional deformation, horizontally isotropic (in the direction perpen- dicular to the z axis) but anisotropic otherwise, the transfornia- tion gradient tensor F, has the following form:

GARNIER ET AL.: HYDRAULIC PROPERTIES DETERMINED FROM TRANSIENT EVAPORATION
O
In this expression, the state of reference, denoted by the subscript O, may be chosen arbitrarily. In the following, e(l (m' m-j) will be taken as the void ratio at shrinkage limit.
In the case of our experiments, water flow is assumed to be one-dimensional relative to the solid particles and the de- formation is assymed to be three-dimensional and isotropic in the horizontal plane. Water movement is considered to take place in response to a total head gradient made up of three components, i.e., pressure head, gravitational head (positive upward), and overburden head. Under these conditions, water flow is assumed to be described by the following water flow equation, which results from the introduction of Eq. [6] into Eq. [5] (Garnier et al., 1997):
[71
where Z (cm) is the Lagrangian coordinate. T h e terms I, T I , and Tz of Eq. [7] are defined, respectively, by :
TZ = K ( l - yV) Pc1 Analytical Functions
Van Genuchten's (1950) equation, with the Burdine (1953) condition for the retention characteristic /!(a), and the equa- tion of Brooks and Corey (1964) for the hydraulic function K ( 6 ) were selected because they can be applied to a wide range of soils (Fuentes et al., 1992). Using the moisture ratio variable, the equation of van Genuchten's (1980) model is given by:
where Se is the effective saturation, 6, (m' KI-^) and 6, (m3
3 .- a structural
resid& '2
1557
Moisture Ratio 8 (cm3 Fig. 2. Scheniatic representation of the soil shrinkage curve and of
its transition points according to Braudeau's (1988a) model.
m-') are the residual and saturated moisture ratios, and CL (cm-I), n, and nz are empirical parameters. The Burdine condi- tion is nz = 1 - 2/t1. The hydraulic conductivity function is described by the Brooks and Corey (1964) model:
K(4) = KS(Se)O [lo1 where K, (cm h-I) is the saturated hydraulic conductivity and B is an empirical parameter.
For the swelling curve e(4), we selected the model of Braudeau (195Sa,b) and Braudeau and Touma (1995) because i t can reproduce a structural deformation occurring near satu- ration in most intact swelling soil samples. These researchers proposed a mathematical expression (Table 1) involving the coordinates of four experimental points (the shrinkage limit [SL], the air entry into the microaggregates [AE], the limit of the contribution of macroporosity to shrinkage [LM], and the maximum swelling of the microaggregates [MS]), in addition to the slope of the linear part of the principal deformation (K,) and the slope of the linear part of the structural deforma- tion (&) (Fig. 2).
Inverse Method Using Evaporation Data For the evaporation experiment, the initial and boundary
conditions of Eq. [7] are:
[Ilal
Z = O WI
4 = Si(2) t = o o 5 2 5 Lo i14 TI - - TZ = E( t ) t > O az
rsb
z = Lo [ 1 l C l
where.a,(Z) represents the initial moisture ratio distribution, E(r) (cm h-') is the evaporation rate determined from the
Table 1. Parametric equations associated with the different deformation regimes in Braudeau's (1988a.b) model.
Deformation reginiesf
Region SL e = esL
Equations of the Brandeau model
Region SL-AE Q - QSL
Region AE-LR.1 e = K,(Q - B&E) + eAE
Beyond R.IS
f SL = shrinkage limit; AE, air entry into microaggregates; LM, linlit of the contribution of macroporosity to shrinkage; MS, maximum microaggregate e = KI (6 - 8,s) + eats
swelling.

1558 SOIL SCI. SOC. AM. J.. VOL. 61. NOVEMBER-DECEMBER 1997
1.5
h
T
E, I-- 3 W -a O .- c ' 0.5 9 P
(J
soil sample weight measurement and its diameter deformation, z,, = O indicates the top of the sample, and LO (cm) is the final height of the sample or the material length. A numerical solution of Eq. [7] using the conditions of Eq. [ l l ] was obtained via a finite-difference method with an implicit discretization scheme.
This numerical solution, as well as all other calculations carried out in this research, made use of C++ utilities similar to the FORTRAN utilities described by Bailey (1993). These utilities allow computations to b e performed with arbitrarily high precision and make it possible to verify that the results are not affected by round-off errors.
Since the saturation moisture ratio 4, was fixed a t its labora- tory-measured value, the inverse solution of Eq: [7] implies the estimation of five parameters; a, n, a,, K,, and B. These unknown parameters were determined by minimizing the least-squares objective function O(b): - -
,+ / ,:"
height shrinkage combined shrinkage
. . -. - . -. .
--
, ,'
.<. r
where b is a vector containing the parameters to be estimated, Tis the total number of time intervals, h (cm) is the measured pressure head, h (cm) is the simulated pressure head computed by the numerical model, ZL and Z2 correspond to the vertical position of the two tensiometers in the material coordinate system, and wi is the weighting factor. The minimization of O(b) is carried out using the simplex method (Nedler and Mead, 1965; Chen e t al., 19S6).
Inverse Method Using Outflow Multistep Data
Eq. [7], with the following initial and boundary conditions: The equation describing the drainage experiment was again
4 = Si(Z) t = O O I Z 5 Lo [13a]
t > O Z = O [13b]
[ i34 where K , (cm h-I) is the saturated hydraulic conductivity of the porous ceramic plate, d (cm) is the thickness of the plate, Himp (cm) is the suction imposed a t the bottom of the plate, and H,I, (cm) is the total soil water head at the soil-porous
plate interface, which was calculated by the model at the last node.
The parameters were estimated from cumulative outflow measurement and pressure head measurement near the top of the soil sample. The unknown parameters were determined by minimizing the objective function O(b):
i= I
i= I where Q is the cumulative transient outflow volume (cm'), and N and fil are the number of measurements for cumulative outflow and pressure head, respectively. The variables vi and wi are weighting coefficients.
Direct Method Using Multistep Outflow Data The direct method of Ahuja and El-Swaify (1976) was
slightly modified to determine the hydraulic characteristic of the swelling soil. It was based on (i) the measurements o f , cumulative outflow of water flowing from the soil sample ' through a high-resistance porous plate placed on the bottom and (ii) measurements of soil water pressure head near the ~
top of the sample. Although flow is transient, the analysis '
of the experiment assumes that flow is steady within small successive time intervals. We consider that the downward flow direction is positive and the top of the sample is defined as z = O. Total soil water head at the soil-porous plate interface can be calculated using Darcy's equation on the basis of plate impedance and measured flux. The relation obtained is:
11151
where q (cm h-l) is the water flux. The hydraulic conductivity is calculated using Darcy's equation:
where Hsup (cm) is the total soil water head near the top of the soil, which can be calculated from tensiometer measurements. Measurements at each subsequent suction increment allow the hydraulic fu8t ions to be computed. The experimental
GARNIER ET AL.: HYDRAULIC PROPERTIES DETERMINED FROM TRANSIENT EVAPORATION 1559
3.3 Isotropic shrinkage
t.
3.1 i;: i?
8
u 2.9
o 2.7
I I
Tensiometer limit
2.5 0.60 0.60 1 .o0 1.20 1.40
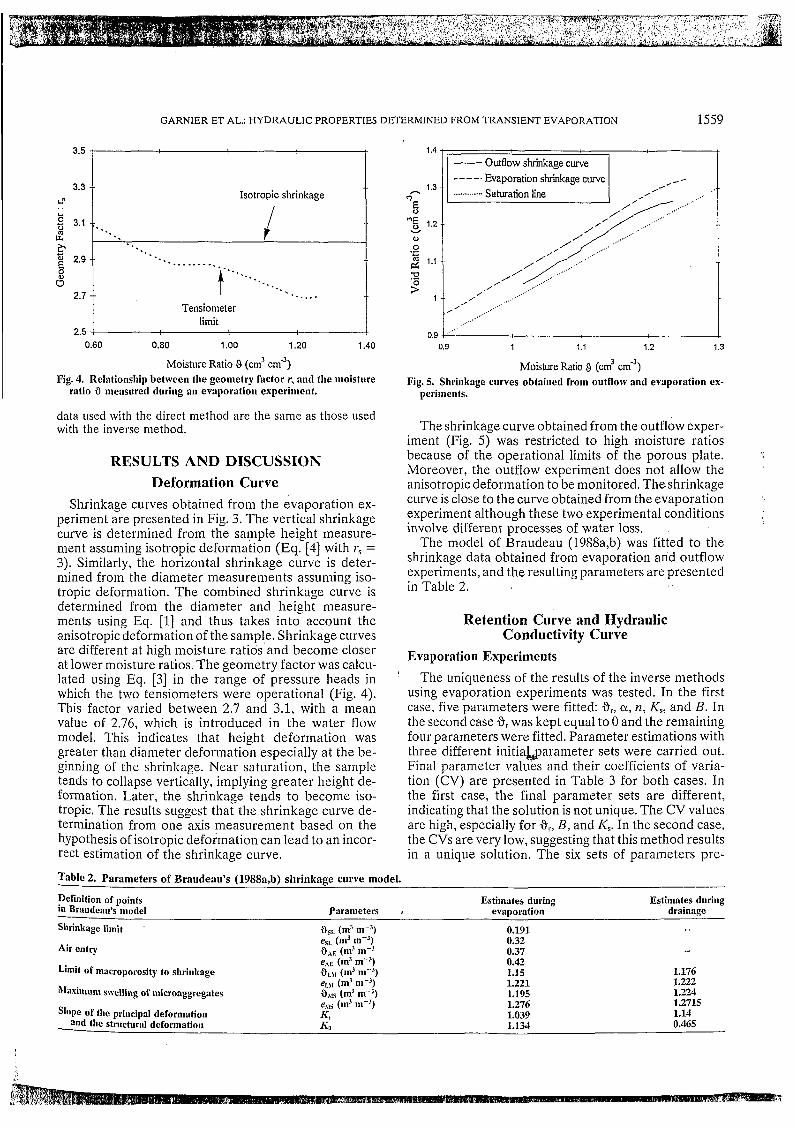
Moisture Ratio 9 (cm’ c ~ n ’ ~ ) Fig. 4. Relalionship between the geonietry factor r, and tlie nioistiire
ratio B nieasored during an evaporation experinlent.
data used with the direct method are the same as those used with the inverse method.
RESULTS AND DISCUSSION Deformation Curve
Shrinkage curves obtained from the evaporation ex- periment are presented in Fig. 3. The vertical shrinkage curve is determined from the sample height measure- ment assuming isotropic deformation (Eq. [4] with rs = 3). Similarly, the horizontal shrinkage curve is deter- mined from the diameter measurements assuming iso- tropic deformation. The combined shrinkage curve is determined from the diameter and height measure- ments using Eq. [l] and thus takes into account the anisotropic deformation of the sample. Shrinkage curves are different at high moisture ratios and become closer at lower moisture ratios. The geometry factor was calcu- lated using Eq. [3] in the range of pressure heads in which the two tensiometers were operational (Fig. 4). This factor varied between 2.7 and 3.1, with a mean value of 2.76, which is introduced in the water flow model. This indicates that height deformation was greater than diameter deformation especially at the be- ginning of the shrinkage. Near saturation, the sample tends to collapse vertically, implying greater height de- formation. Later, the shrinkage tends to become iso- tropic. The results suggest that the shrinkage curve de- termination from one axis measurement based on the hypothesis of isotropic deformation can lead to an incor- rect estimation of the shrinkage curve.
i .4
1.3 h
3
r5 ng 1.2
2 1.1
9
u o O .- - 2
1
0.9
Evaporation shrinkage curve ............ Saturation line
, ,,.’ ,’ / - . ,..’ ’ ,’ ..’ , ...” ...’ ...’ ....
0.9 1 1.1 1.2 1.3
Moisture Ratio 9 (cm’ cm-’) Fig. 5. Shrinkage curves obtained from outflow and evaporation ex-
periments.
The shrinkage curve obtained from the outflow exper- iment (Fig. 5) was restricted to high moisture ratios because of the operational limits of the porous plate. Moreover, the outflow experiment does not allow the anisotropic deformation to be monitored. The shrinkage curve is close to the curve obtained from the evaporation experiment although these two experimental conditions involve different processes of water loss.
The model of Braudeau (19SSa,b) was fitted to the shrinkage data obtained from evaporation and outflow experiments, and the resulting parameters are presented in Table 2.
Retention Curve and Hydraulic Conductivity Curve
Evaporation Experiments The uniqueness of the results of the inverse methods
using evaporation experiments was tested. In the first case, five parameters were fitted: ar, a, n, K,, and B. In the second case 6, was kept equal to O and the remaining four parameters were fitted. Parameter estimations with three different initiaQarameter sets were carried out. Final parameter values and their coefficients of varia- tion (CV) are presented in Table 3 for both cases. In the first case, the final parameter sets are different, indicating that the solution is not unique. The CV values are high, especially for a,, B, and K,. In the second case, the CVs are very low, suggesting that this method results in a unique solution. The six sets of parameters pre-
Table 2. Parameters of Braudeau’s (1988a,b) shrinkage curve model.
Definition of points Estimates during Estimates during in Braudeau’s nioclel Paranieters I evanoration drainage Shrinkage limit
Air entry
Limit of macroporosity to shrinkage
hkimum swelling of microag, oregates
Slope of the principal deformation and the structural deformation
as,, (ni3 niÏ3) 0.191 - es,, (ml ni-’) 0.32 aAE ( 1 d III-’ 0.37 - eAE (d m-’) 0.42 QLIl (m’ inAJ) 1.15 1.176 eLIl (m’ ni-3) 1.221 1.222 6rls (m3 nÏ3 ) 1.195 1.224 eIIs (m’ m-3) 1.276 1.2715 K, G, 1.134
1.039 1.14 0.465

1560
~
SOIL SCI. SOC. AM. J., VOL. 61, NOVEMBER-DECEMBER 1997
Table 3. Final parameters obtained by estimating five parameters (Method 1) or four parameters (Method 2) during an evapora- tion exoeriment.
Final estimates
Parameter Estimation 1 Estimation 2 Estimation 3 CV, O/O
Method 1 9, (m3 m-I) 0.001 0.453 0.698 92
n 2.088 2.153 2.252 4 K, (cm h-l) 0.0095 0.0083 0.0072 14 B 24.753 14.347 8.839 51
ci (cm-l) 0.0266 0.024 0.0217 9
Method 2 9 , ( n 1 ~ m - ~ ) O O O O ci (cm-I) 0.0262 0.0262 0.0262 2 x 10⁻⁵
Ks (cm h-l) 0.0095 0.0095 0.0095 lo-' B 24.774 24.774 24.774 7 x 10⁻³
n 2.088 2.088 2.088 3 x 10⁻⁶
sented in Table 2 result in six superimposed curves. To complete this analysis, correlation coefficients were calculated from the covariance matrix (Yeh, 1986). In the first case, the higher correlation coefficients were found for 6, (=70%), which indicates that it is highly correlated with the other parameters. In the second case the highest correlation coefficients are found for K, but they are all smaller ( ~ 4 0 % ) than in the first case. In the remainder of this study, the value of 4, will be kept equal to zero. It is thus close to the residual moisture ratio, which is defined as oven dryness (Cinzia and Nimmo, 1994).
Table 4 gives estimated parameters from the evapora- tion inverse method using three different samples treated under the same conditions. The parameters are very close for each sample. The observed differences appear due to measurement errors and variability among samples.
The top and bottom pressure heads measured and calculated with parameters given in Table 4 (Sample 1) are presented in Fig. 6.
Multistep Outflow Experiments The uniqueness of the results from the inverse method
using multistep outflow data was also tested. We found the same results as for the evaporation experiment. The inverse method results in a unique solution if only four parameters are estimated ((Y, n, K,, .and B ) . Table 5 provides estimated parameters on the multistep outflow experiments using three different samples treated under the same conditions. As with the evaporation method,
Table 4. Estimated parameters and their confidence intervals ob- tained from three samples with the evaporation inverse method.
Final estimates Confidence
Sample Sample Sample interval Parameters 1 2 3 at 95%
6, (m3 III-'), measured 1.26 1.3 1.25 6, (m3 III-]), fixed
ci (cm-I) 0.0262 0.0335 0.034 6.2 X lo-' n 2.088 2.087 2.077 3.2 X lo-' K , (cm h-') 0.0095 0.0313 0.00436 1.2 X lo-' B 24.774 27.978 25.22 4.7 X lo-'
estimated parameters O O O
800
h
O 10 20 30
Time (Hr) Fig. 6. Pressure heads measured and calculated from an evapora-
the differences in the estimated parameters for the three samples were very small.
The pressure head and the cumulative outflow mea- sured and calculated with parameters given in Table 5 (Sample 1) are presented in Fig. 7.
Comparison of Evaporation and Multistep Outflow Methods
The results obtained from the evaporation inverse method, the outflow inverse method, and the direct outflow method are presented in Fig. 8. For each inverse method, the mean hydraulic functions were obtained by arithmetic averaging of h and log K as functions of 4 for the three samples whose parameters are given in Tables 4 and 5. The experimental data were measured during the same experiment as for Sample 1 (Table 5). The hydraulic conductivity data are presented with the error interval calculated from the error associated with measurements of drained water volume in the burette (20.05 cm3).
We found, like Eching and Hopmans (1993) and Ecli- ing et al. (1994), who worked on rigid soils, that the multistep outflow parameter estimation method is in good agreement with the direct measurement of K(4) and h(4) for swe'ffhg soils.
The inverse method associated with the multistep out- flow or with the evaporation experiment gave very close results, which are also very similar to results obtained by the direct method. The deviation between the optimized and measured h(4) and K(4) with the evaporation and outflow experiments can be explained by experimental
Table 5. Estimated parameters and their confidence intervals ob- tained from three samples with the multistep outflow inverse method.
tion experiment.
Final estimates Confidence
Sample Sample Sample interval Parameters 1 2 3 at 95%
6, (m3 III+), measured 1.24 1.27 1.28 9, (m3 m-9, fixed
estimated O O O ci (cn1-l) 0.022 0.0166 0.0177 1.1 X lu-' n 2.084 2.112 2.113 7.8 x lo-' K, (em h-') 0.0034 0.00362 0.018 7.8 x lo-' B 25.81 19.97 28 9.4 x 10⁻²

GARNIER ET AL.: HYDRAULIC PROPERTIES DETERMINED FROM TRANSIENT EVAPORATION 1561
h - k
500 ; k
0
v - 400 I A
o f t
O 50 100 150 200
Time @Ir)
12 I- al
B 4 10 -- 3
A
A Measured
3 8
0.2
--
Y
O 50 100 150 200
Time (hr) Fig. 7. (A) Pressure head and (E) cumulative outflow measured and
calculated from a multistep outflow experiment.
errors and the differences in the macrostructure of the samples. The evaporation inverse method is more inter- esting than methods associated with multistep outflow experiments because it allows the whole shrinkage curve, including the geometry factor, to be estimated at once, because. the experimental setup is simpler, and because the experiment is faster than with currently available methods.
Analysis of the Sensitivity to Deformation A parameter estimation via the evaporation inverse
method was performed (Sample 1) using the water flow model but neglecting shrinkage and overburden pres- sure. The parameter estimated values were very close to those obtained previously when the model considered deformation explicitly (Table 6). In the water flow ex- periment, the deformation is calculated on the basis of the overburden head, the various gradients, and the evaporation area. The overburden head is 9 cm at the beginning of the experiment at the bottom of the Sam- ple. The sample variations of height and diameter are 2 and 3 mm, respectively, at the tensiometer limit. This deformation seems not to be sufficiently significant to have any influence on parameter estimation. For this type of soil, taking into account shrinking deformation in the water flow model associated with the inverse method seems to be optional. Thus, a water flow model
800 ’
. . . . . . . Outflow inverse méthod - Evaporation inverse method
A
600 -- Ê 2. -c ‘o . .
.. 400 --
0.9 1 1.1 1.2 1.3
Moisture Ratio 9 (cm’
-2 -- W
M .- a .> -3 --
, 4- O
-3 c O
o u -4
a E
-- .- - -3
@ -5
s --
M
0.9 1 1.1 1.2 1.3
Moisture Ratio 9 (cm3 ~ m - ~ ) Fig. 8. Hydraulic characteristics estimated via evaporation and out-
flow inverse methods and measured from an outflow experiment.
assuming rigidity of soil would be sufficient. However, this latter model uses@he volumetric water content vari- able (0, = water volumeltotal volume) instead of the moisture ratio variable used in the water flow model in swelling soils (6 = water volumelsolid particles volume). The relation between these two variables is 0, = 4/(1 + e). The value of 0, can be calculated with or without considering a variation in total volume. The expressions for h(8,) and K(0,) are calculated from those for h(4) and K(4) using the parameters presented in Table 5.
I Table 6. Final parameters from the evaporation inverse method with and without neglect of the deformation in the water flow model.
Final estimates
Parameters With deforniation Without deformation
9, (m3 m-4 O O a (cm-’) 0.0262 0.0276 n 2.088 2.087 K , (cm h-’) 0.0095 0.00917 B 24.77 24.66

1562
.- b
.g -3 o
71
$ -4 .- - 3
P E 2 -5 3 cl
SOIL SCI. SOC. AM. J.. VOL. 61, NOVEMBER-DECEMBER 1997
--
--
--
*O0 9 I A
h 600 j E o v \
0.35 0.4 0.45 0.5 0.55 Volumetric Water content eV (cm3 cm")
-1 i t
-6 ! 1 1. 0.35 0.4 0.45 0.5 0.55
Volumetric Water Content e,, (cm3 cmS3) Fig. 9. (A) Soil water pressiire liead and (B) hydraulic conductivity
as functions of the volumetric water content when deformation is neglected (dashed line) or is taken into account (solid line).
These calculations either take into account the deforma- tion using the measured curve for e(4) or assume that the initial volume of the sample remains constant. The results of these two approaches are presented in Fig. 9. The two curves are in poor agreement. The global deformation of the soil, which is 14% of its initial volume at the lower limit of the range of tensiometer readings, seems to be large enough to have an influence on the expression of 8,. Thus, if a water flow model that as- sumes that the soil is rigid is used with the inverse method. it is necessary to correct the resulting relations h(8,) and K ( 8 , ) using knowledge of the deformation, curve e(i3).
CONCLUSION We proposed a new method based on an evaporation
experiment to determine simultaneously the three hy- draulic properties of swelling soils. The deformation curve e(4), determined by horizontal and vertical linear deformation measurements, takes into account the an-
isotropy of the deformation. We confirmed that this technique is more accurate than that based on one- dimensional linear deformation measurement assuming isotropy of the deformation. The hydraulic characteris- tics, h(6) and K(4). are estimated via an inverse method using a water flow model for swelling media. The results are in good agreement with those obtained from multistep outflow experiments using either a direct or an inverse method. The advantages of the evaporation experiment are that its setup is simpler than that for drainage experiments and it provides results faster. We concluded that the proposed evaporation inverse method is well adapted to determine the hydraulic prop- erties in the type of swelling soil used in this investi- gation.
A sensitivity analysis was performed and showed that for this particular type of swelling soil, it is not necessary to take into account the deformation in the water flow model used for the inverse method as long as the tar- geted characteristic curves are expressed in terms of the moisture ratio 4. Under these conditions, a water flow '*
model assuming rigidity of the soil is sufficient. Never- theless, whenever estimates of the relationships /i(&) ,
and K(0,) are sought, it is necessary to take the shrink- '
age curve into consideration.
ACKNOWLEDGMENTS
We are very grateful to Gerard Bellier of ORSTOM Bondy (Laboratoire d'Hydrophysique) for his useful advice and es- perimental assistance.
REFERENCES Ahuja, L.R., and S.A. El-Swaify. 1976. Determining both water char-
acteristic and hydraulic conductivity of a soil core at high water contents from a transient flow experiment. Soil Sci. 12l:I9S-1-ll.i.
Angulo Jaramillo, R. 19S9. Caracterisation hydrodynamique de sols deformables partiellement saturés: Etude experimentale i I'aicle de la spectrométrie gamma double source. Ph.D. diss. Natl. Poly- technical Inst. of Grenoble. Grenoble, France.
Bailey, D.H. 1993. Multiprecision translation and execution ot' FOR- TRAN programs. ACM Trans. Math. Softw. 19(3):2SS-3 19.
Baveye, P. 1992. Operational aspects of the mechanics of deforniin: porous media: T lmry and application to expansive soil.;. p. 79-96 111 T. Karalis (ed.) Mechanics of s\veliing. Springcr-Verlag Berlin.
Boivin, P.. D. Brunet, and C. Gascuel-Odoux. 1991. Densité apparente d'échantillon de sol: Méthode de la poche plastique. Bull. Groupe Fr. Humidite Neutronique 2859-71.
Braudeau. E. 19SSa. Equation généralisée des courbes de retrait d'échantillons de sols structurés. C.R. Acad. Sci. Ser. 7. -307:
Braudeau. E. I9SSb. Essai de caractérisation quantitative de I'Ctat structural d'un sol basé sur I'étude de la courbe de retrait. C.R. Acad. Sci. Ser. 2, 307:1933-1936.
Braudeau, E., and J. Touma. 1995. h4odeling shrinkage ol' unconfined soil cores. p. 11-12. Ili Vadose zone hydrology: Cuttine across disciplines. Univ. of California, Davis.
Bronswijk. J.J.B. 1990. Shrinkage geometry of a heavy clay soil :it various stresses. Soil Sci. Soc. Am. J. 54:1500-1502.
Brooks, R.H., and A.T. Corey. 1964. Hydraulic properties of porous media. Hydrol. Pap. 3. Colo. State Univ., Fort Collins.
Burdine, N.T. 1953. Relative permcability calculations from pore-sizc distribution data. Trans. Am. Inst. Min. Metall. Pet. Eng. lW7-77.
Chen. D.H., Z. Saleem. and D.W. Grace. 19SG. A new simples proce- dure for function minimization. Int. J. h4odell. Simul. 6(3):Sl-S5.
Cinzia. R., and J.R. Nimmo. 1994. Modeling of soil water retention from saturation to oven dryness. Water Resour. Res. 30:701-70S.
Crescimano, G., and M. Iovino. 1995. Parameter estimation by inverse
1731-1734.

SFvllTH ET AL.: ERROR IN AIR PERMEAMETER MEASUREMENTS 1563
method based on one step and multistep outflow experiments. Geoderma 68:257-277.
Eching, S.O., and J.W. Hopnians. 1993. Optimization of hydraulic functions from transient outflow and soil water pressure data. Soil Sci. Soc. Am. J. 57:1167-1174.
Eching, S.O., J.W. Hopmans, and O. Wenclroth. 1994. Unsaturated hydraulic conductivity from transient multistep outflow and soil water pressurc data. Soil Sci. Soc. Am. J. 5S:GS7-695.
Fuentes, C., R. Haverkamp, and J.Y. Parlange. 1992. Parameter con- straints on closed-form soil-water relationships. J. Hydrol. (Ani- sterdani) 134:117-242.
Garnier, P., E. Perrier, R. Angulo-Jaramillo, and P. Baveye. 1997. Numerical model of 3-dimensional anisotropic deformation and 1- dimensional water flow in swelling soils. Soil Sci. 162(6):410-420.
Kim, D.J., J. Feyen, and H. Vereecken. 1993. Prediction of dynamic hydraulic properties in a ripening soil. Geoderma 57:231-246.
Kim, D.J., H. Vereeken, J. Feyen, D. Boels, and J.J.B. Bronswijk. 1992. On the characterization of properties of an unripe marine clay soil II. A method on the determination of hydraulic properties. Soil Sci. 15459-7 I.
Kool, J.B.. J.C. Parker, and M.Th. van Genuchten. 1985. Determining soil hydraulic properties from one-step outflow experiments'by parameter estimation: 1. Theory and numerical studies. Soil Sci. Soc. Am. J. 49:1348-1354.
Nedler, J.A., and R. Mead. 19G5. A simplex procedure for function minimization. Comput. J. 7:308-313.
Raats, P.A.C., and A. Klute. 1965. Transport in soils: The balance of momentum. Soil Sci. Soc. Am. Proc. 32:452-456.
Talsma, T. 1974. Moisture profiles in swelling soils. Aust. J. Soil Res. 12:71-75.
van Genuchten, M.Th. 1980. A closed-form equation for predicting the hydraulic conductivity of unsaturated soils. Soil Sci. Soc. Am. J. 44:892-898.
Yeh, W.W.-G. 1986. Review of parameter identification procedures in groundwater hydrology: The inverse problem. Water Resour. Res. 22:95-105.
Zachman, D.W., P.C. Duchateau, and A. Klute. 1981. The calibration of Richards' flow equation for a draining column by parameter identification. Soil Sci. Soc. Am. J. 45:1012-1015.
A Source of Systematic Error in Transient-Flow Air Permeameter Measurements James E. Smith,'k Michel J. L. Robin. and David E. Elrick
ABSTRACT The data from transient-flow air pernieanieters often eshibit curva-
ture in the theoretically linear plots of the natual log of pressiire vs. time. This W S originally attributed to errors in water nianonieter data caused by the inertia of the water in the manometer. The resulting recommendation was to ignore the early time dah when calculating the air permeability of a soil by these methods. We have demonstrated and qiiantified that the exhibited ciirvatiire is a direct conseqiience of small changes in temperature in the soiirce air tank as a resiilt of the cooling of the expanding air during tlie permeability determina- tion. This vas accomplished by interfacing the air permeameter with a computer to collect pressure and temperature data at a relatively high frequency. The data acquisition procedure facilitated tlie calcula- tion of the change in pressure and temperature with respect to time, which allowed the direct solution of the differential forni of the equa- tions describing the mass flux of air from the tank through the core. The data is compared with the theoretical relationship expected for the core based on air pernieability determined using a steady-state method.
IR PERmABILITY has been recognized as an important A soil property for more than a century (Elgabaly and Elghamry, 1970), and is fundamental to our under- standing of many environmental problems in the vadose zone. While diffusion is an important mechanism for soil aeration, convective flow contributes significantly to soil aeration, especially at shallow depths in soils with large pores (Hillel, 1980, p. 270).
JE. Smith, Dep. of Hydrology and Water Resources, Univ. of Arizona. Tucson, AZ 85721-0011 (present address: Canada Centre for Inland Waters, P.O. Box 5050, Burlington, ON, Canada L7R 4A6); M.J.L. Robin, Dep. of Geology, Univ. of Ottawa, Ottawa, ON, Canada; and D.E. Elrick,Dep. of Land Resource Science, Univ. of Guelph, Guelph. ON. Canada. Received 15 Aug. 1996. Torresponding author (James. [email protected]).
Published in Soil Sci. Soc. Am. J. 6131563-1563 (1997).
I
Air permeability is also important in the study of soil structure (Buehrer, 1932) and the stability of soil structure (Reeve, 1953,1965). Air permeability has also been used as an index of soil structure in studies of soil compaction (Barden and Pavlakis, 1971) and soil crust openness (Hillel, 1980, p. 281).
Air permeability of a soil as a function of water con- tent is required information for assessment of vacuum extraction and air sparging technologies and for density- dependent gas-phase transport of volatile organic com- pounds such as chlorinated solvents (Mendoza and Frind, 1990a,b). The measurement of air permeability as a function of water content (or of soil water tension) gives information about the dynamics of the pores (con- tinuity, connectivity, and tortuosity), while the more routinely done soil water content characteristic curve determination gives static information (pore-size distri- bution). Corey (1957)@ilized the nondestructive nature of air permeability measurements to determine the in- trinsic permeability of soil samples before initiation of experiments with simultaneous water and air flow.
Air permeability can be measured by either steady- state or transient methods. However, transient-flow methods offer several advantages: They usually require less volume of air to pass through the core for a given permeability determination, and the duration of the test can be shorter. This reduces the potential for changing the water content of the soil core by drying, or of causing water migration within the core due to pressure changes.
This study investigated an important source of error in the determination of air permeability of porous media by the transient-flow method first proposed by Kirkham (1946). Kirkham's method uses a very simple and inex- pensive apparatus and has been described in a number of books discussing methods of soil analysis (Reeve, 1965; Smith and Mullins, 1991; Stephens, 1996). The method involves pressurizing a source air tank and then
