determining favorable days for summertime severe convection in the deep south chad entremont nws...
TRANSCRIPT

Determining Favorable Days Determining Favorable Days for Summertime Severe for Summertime Severe
Convection in the Deep SouthConvection in the Deep South
Chad EntremontChad Entremont
NWS Jackson, MSNWS Jackson, MS

Situation / ConcernsSituation / Concerns
During the months of June, July and During the months of June, July and August, the primary mode of severe August, the primary mode of severe weather is damaging winds from weather is damaging winds from microbursts.microbursts.
During this time, large synoptic scale During this time, large synoptic scale forcing is pushed well to the north and forcing is pushed well to the north and the southern states are left with very the southern states are left with very subtle features to drive the daily subtle features to drive the daily convection.convection.

Distribution of Severe Weather (May-Sep)Distribution of Severe Weather (May-Sep)Compliments of NWS BirminghamCompliments of NWS Birmingham
398
476
91
221
529
25
134
607
19
85
407
31 19
94
19
0
100
200
300
400
500
600
700
# o
f R
epo
rts
May Jun Jul Aug Sep
Month
Monthly Severe Weather Reports (1961-2000)
Hail
Wind
Tor

GoalGoal
To differentiate between To differentiate between the days there will be the days there will be severe convection to the severe convection to the days of just general days of just general thunderstorms.thunderstorms.

MethodologyMethodology
Used 12z soundings from KJAN & Used 12z soundings from KJAN & KBMX from 1999 to 2003KBMX from 1999 to 2003
Sample size is 326 soundingsSample size is 326 soundings Excluded strongly forced or frontal Excluded strongly forced or frontal
forced systems as well as tropical forced systems as well as tropical systemssystems

MethodologyMethodology
Modified the 12z soundings to Modified the 12z soundings to determine certain instability determine certain instability parametersparameters
Used initial conditions and 0-12 hr Used initial conditions and 0-12 hr model forecasts to locate favorable model forecasts to locate favorable synoptic patterns that support synoptic patterns that support convectionconvection

MethodologyMethodology
Collected Severe reports from Collected Severe reports from Stormdata DatabaseStormdata Database to determine to determine “event” days vs “Null” days“event” days vs “Null” days
EventEvent days are defined as any day with days are defined as any day with at least one severe reportat least one severe report
NullNull days are days with no severe days are days with no severe reportsreports
There were 137 event days (42%)There were 137 event days (42%) Reports were collected within the CWA Reports were collected within the CWA
of interest for the local soundingof interest for the local sounding

Sounding ModificationSounding ModificationUsed 12z soundings from KJAN and KBMX Used 12z soundings from KJAN and KBMX from 1999 to 2003 during the months of from 1999 to 2003 during the months of June, July and August.June, July and August.
Modified the 12z sounding for Modified the 12z sounding for temperature and dew point, utilizing a temperature and dew point, utilizing a sounding application called sounding application called
N-Sharp.N-Sharp.
The temperature and dew point used The temperature and dew point used were taken from hourly observations just were taken from hourly observations just before and closest to thunderstorms or before and closest to thunderstorms or what best represented the area.what best represented the area.

Key ParametersKey Parameters
Surface Based Cape (SBCAPE)Surface Based Cape (SBCAPE) Lifted Index (LI)Lifted Index (LI) Precipitable Water (PW)Precipitable Water (PW) 850-500mb temperature difference or 850-500mb temperature difference or
Vertical TotalsVertical Totals Downdraft Cape (DCAPE or DAPE)Downdraft Cape (DCAPE or DAPE) 0 - 6 km Shear0 - 6 km Shear

SBCAPESBCAPE
3728
2725
1140
2009
3142
4685
3289
4154
1000
1500
2000
2500
3000
3500
4000
4500
5000
Events Null
J / K
g
Box indicates Box indicates 75th and 75th and 25th 25th percentilespercentiles
Whiskers Whiskers indicate 90th indicate 90th and 10th and 10th percentilespercentiles

Lifted Index (LI)Lifted Index (LI)
-3
-9
-8
-9
-7
-10
-5
-7
-12
-10
-8
-6
-4
-2
0Events Null
C
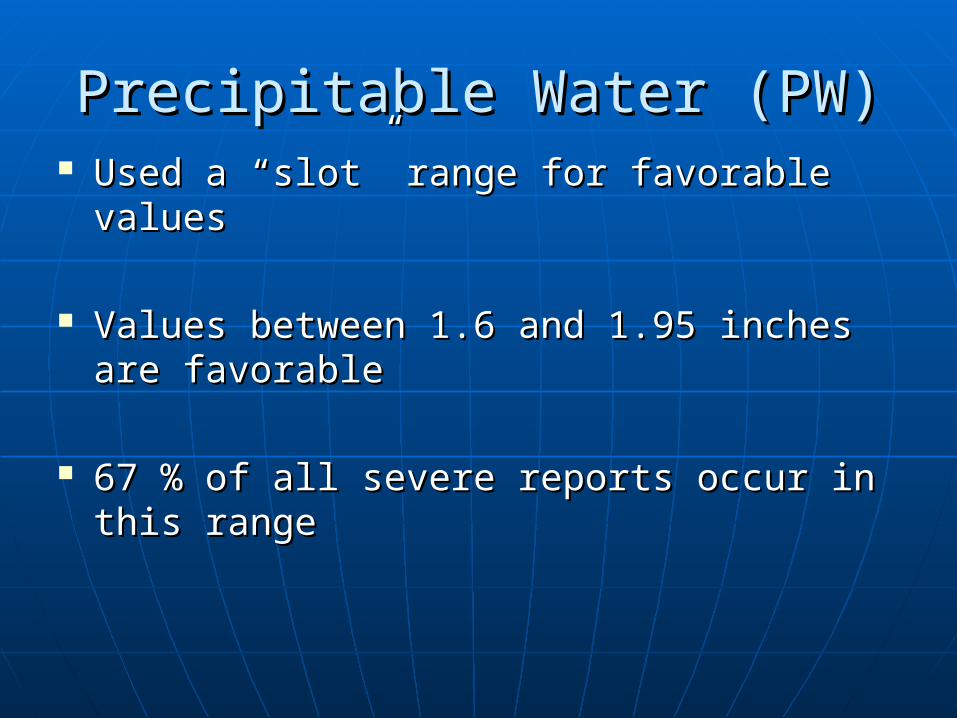
Precipitable Water (PW)Precipitable Water (PW) Used a “slot” range for favorable valuesUsed a “slot” range for favorable values
Values between 1.6 and 1.95 inches are Values between 1.6 and 1.95 inches are favorablefavorable
67 % of all severe reports occur in this 67 % of all severe reports occur in this rangerange

850 - 500mb Temp Difference850 - 500mb Temp Difference
29.6
27.6
24.6
23.4
24.3
25.3
26.4
28.1
22
23
24
25
26
27
28
29
30
Events Null
C

DCAPEDCAPE
Favorable values > 900 J/kg when the Favorable values > 900 J/kg when the SBCAPE was > 3000 J/kgSBCAPE was > 3000 J/kg
This was done because the DCAPE could be This was done because the DCAPE could be very high but the instability would not be very high but the instability would not be sufficient enough to support deep convection.sufficient enough to support deep convection.
Using the above “favorable values”, an Using the above “favorable values”, an “event” occurred on 71 of 104 days. The “event” occurred on 71 of 104 days. The frequency of occurrence was 68 %frequency of occurrence was 68 %
This N-sharp program also tells you what This N-sharp program also tells you what level the parcel descended fromlevel the parcel descended from
Any parcel descending from a level above Any parcel descending from a level above 600mb should be given extra attention600mb should be given extra attention

0 - 6 km Shear0 - 6 km Shear
Favorable value, > 8 m/s when SBCAPE was > Favorable value, > 8 m/s when SBCAPE was > 3000 J/kg3000 J/kg
Using the above “favorable values”, an “event” Using the above “favorable values”, an “event” occurred on 31 of 40 daysoccurred on 31 of 40 days
The frequency of occurrence was 78 %The frequency of occurrence was 78 % When the shear was < 9 m/s and SBCAPE > 3000 When the shear was < 9 m/s and SBCAPE > 3000
J/kg, an “event” occurred 38 of 69 days, a J/kg, an “event” occurred 38 of 69 days, a frequency of occurrence of 55 %frequency of occurrence of 55 %
When the shear was > 8 m/s and SBCAPE < 3000 When the shear was > 8 m/s and SBCAPE < 3000 J/kg, an “event” occurred only 1 of 81 daysJ/kg, an “event” occurred only 1 of 81 days

Quantifying the ParametersQuantifying the Parameters
Use a checklist style application to Use a checklist style application to organize each parameter.organize each parameter.
Determine favorable ranges for each Determine favorable ranges for each parameter and weight the values parameter and weight the values (point scale)(point scale)
Define a daily potential with the point Define a daily potential with the point totals.totals.
At JAN we use: Extreme, Likely, At JAN we use: Extreme, Likely, Chance, Slight Chance and Little Chance, Slight Chance and Little ChanceChance

Microburst Checklist and Potential ScaleMicroburst Checklist and Potential Scale

Distribution of the Daily PotentialDistribution of the Daily PotentialNumber of Days that Occurred in each Potential (326 total)Number of Days that Occurred in each Potential (326 total)
12
32
7666
141
0
20
40
60
80
100
120
140
160
# of
Day
s
Extreme Likely Chance SlightChance
Little

Distributions and EventsDistributions and Events
12 of 12
29 of 32
52 of 76
27 of 66
17 of 141
0
20
40
60
80
100
120
140
160
Extreme Likely Chance SlightChance
Little
Days
Event Days

Avg # of Events for each PotentialAvg # of Events for each Potential
12
7
4
2
0.20
2
4
6
8
10
12
14
16
Avg # of Events
Extreme Likely Chance SlightChance
Little

Synoptic AnalysisSynoptic AnalysisImportant Fields to ConsiderImportant Fields to Consider
850 mb Theta E ridges, moisture transport and 850 mb Theta E ridges, moisture transport and lapse rates (vertical totals)lapse rates (vertical totals)
500 mb winds, looking for subtle veering with 500 mb winds, looking for subtle veering with time (weak trough passage), increases in wind time (weak trough passage), increases in wind speed and positions of any shear axisspeed and positions of any shear axis
250 mb jet positions, diffluent areas, jet streaks, 250 mb jet positions, diffluent areas, jet streaks, shear axis and divergenceshear axis and divergence
Combine sfc instability (CAPE, LI) and moisture Combine sfc instability (CAPE, LI) and moisture convergence with the favorable regions described convergence with the favorable regions described aboveabove

July 13, 2003 CaseJuly 13, 2003 Case
12z JAN sounding12z JAN sounding 850 and 500 mb RUC forecast at 18z850 and 500 mb RUC forecast at 18z 250 mb winds and divergence250 mb winds and divergence radar picture of a downburstradar picture of a downburst Severe weather plotSevere weather plot

12z, July 13 JAN Modified Sounding12z, July 13 JAN Modified Sounding
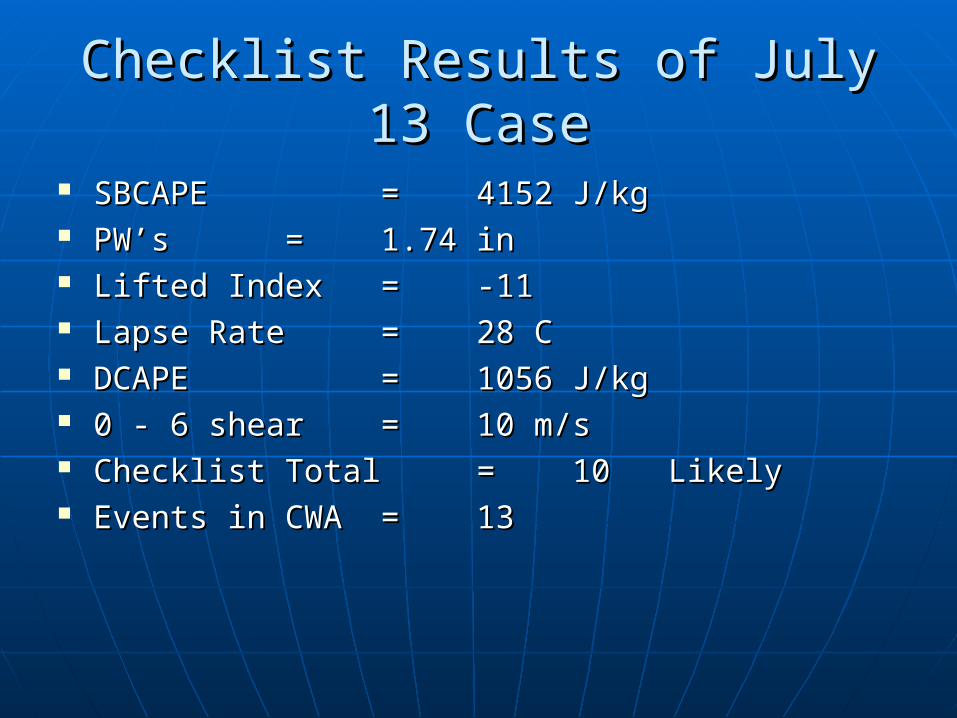
Checklist Results of July 13 CaseChecklist Results of July 13 Case
SBCAPESBCAPE == 4152 J/kg4152 J/kg PW’sPW’s == 1.74 in1.74 in Lifted IndexLifted Index== -11-11 Lapse RateLapse Rate == 28 C28 C DCAPEDCAPE == 1056 J/kg1056 J/kg 0 - 6 shear0 - 6 shear == 10 m/s10 m/s Checklist TotalChecklist Total == 10 Likely10 Likely Events in CWAEvents in CWA == 1313

18z 850mb RH (img), Winds, Theta E, Moisture Transport18z 850mb RH (img), Winds, Theta E, Moisture Transport

18z 500mb Winds (isotachs), Vorticity (img)18z 500mb Winds (isotachs), Vorticity (img)

18z 250mb Winds (isotachs), Divergence18z 250mb Winds (isotachs), Divergence

21z 250mb Winds (isotachs), Divergence21z 250mb Winds (isotachs), Divergence

18z SBCAPE, LI, Sfc Winds18z SBCAPE, LI, Sfc Winds

19z Visual Sat Image, LI, Sfc Obs19z Visual Sat Image, LI, Sfc Obs

Downburst just North of the GWX radarDownburst just North of the GWX radar
Microburst 8 Microburst 8 mi N of GWXmi N of GWX
50 kts at 470 50 kts at 470 ft AGLft AGL
Amazingly, Amazingly, no official no official severe severe weather weather reports!reports!

Severe Weather Reports, Hail, WindSevere Weather Reports, Hail, Wind

Loop of the Visual Sat Image Loop of the Visual Sat Image and 5 min Lightningand 5 min Lightning
SummarySummary Try and quantify instability and Try and quantify instability and
sounding parameterssounding parameters A checklist that distributes points to A checklist that distributes points to
certain parameters works well.certain parameters works well. Instability does not work alone, synoptic Instability does not work alone, synoptic
and model analysis need to be done to and model analysis need to be done to identify favorable regionsidentify favorable regions
The collocation of favorable synoptic The collocation of favorable synoptic patterns and strong instability point you patterns and strong instability point you in the right directionin the right direction

Parameter SummaryParameter Summary Values > 3500 J/kg are favorable for SBCAPEValues > 3500 J/kg are favorable for SBCAPE Values between 1.6 and 1.95 are good for PWValues between 1.6 and 1.95 are good for PW Values < -8 are favorable for Lifted IndexValues < -8 are favorable for Lifted Index Values > 27 C and especially >28.4 C are Values > 27 C and especially >28.4 C are
favorable for 850-500mb temp differencefavorable for 850-500mb temp difference Values > 900 J/kg and especially > 1200 J/kg Values > 900 J/kg and especially > 1200 J/kg
or favorable for DCAPE when SBCAPE is > or favorable for DCAPE when SBCAPE is > 3000 J/kg (give extra consideration when the 3000 J/kg (give extra consideration when the parcel descends from a level <600mb)parcel descends from a level <600mb)
Values > 8 m/s for 0-6 shear are favorable Values > 8 m/s for 0-6 shear are favorable when SBCAPE is > 3000 J/kgwhen SBCAPE is > 3000 J/kg

Future WorkFuture Work Continue to experiment with new parameters, Continue to experiment with new parameters,
emphasis on atmospheric moisture, mainly emphasis on atmospheric moisture, mainly mid and upper levelsmid and upper levels
Investigate radar data to try and improve on Investigate radar data to try and improve on traditional radar techniques that are traditional radar techniques that are precursors to damaging wind and severe precursors to damaging wind and severe weather during the warm seasonweather during the warm season
Incorporate lightning data and trends with Incorporate lightning data and trends with radar (using SCAN, storms with CG rates >17 radar (using SCAN, storms with CG rates >17 strikes/min should strongly be considered for strikes/min should strongly be considered for warnings)warnings)

Another Microburst!Another Microburst! Intense microburst Intense microburst
near DGX, near DGX, Brandon radar, on Brandon radar, on Aug 6Aug 6thth 2003 2003
Several pixels of Several pixels of >62 kts, max >62 kts, max output of 68 kts!output of 68 kts!
Numerous trees Numerous trees and powerlines and powerlines were blown down. were blown down. A billboard was A billboard was also blown down also blown down along I-20. Twenty along I-20. Twenty homes sustained homes sustained minor damageminor damage

The EndThe End