determine population size of bangladesh - hdrc-bd. · pdf filedetermine population size of...
TRANSCRIPT
Determine Population Size of Bangladesh
Considering Land and Resources
Prepared by:
Abul Barkat, Ph.D1
Matiur Rahman, Ph.D2
Md. Abdullah, MA2
Faisal M Ahamed, MS3
G M Suhrawardy, MSS4
Human Development Research Centre (HDRC)
Prepared for:
National Institute of Population Research and Training (NIPORT)
Azimpur, Dhaka
Dhaka: August 2014
1 Professor, Department of Economics, University of Dhaka; Chief Advisor (Hon.), Human Development Research Centre
(HDRC); and Team Leader of the Study 2 Senior Research Consultant, Human Development Research Centre (HDRC) 3 Senior Research Associate, Human Development Research Centre (HDRC) 4 Research Consultant, Human Development Research Centre (HDRC)
Director General
National Institute of Population
Research and Training (NIPORT)
Ministry of Health and Family Welfare
FOREWORD
The National Institute of Population Research and Training (NIPORT) under the Research, Survey
and Development activities of the approved Operational Plan of “Training, Research and
Development”, HNPSDP of the Ministry of Health and Family Welfare (MOHFW) have been
assigned to float the study entitled “Study to Determine Population Size of Bangladesh Considering
Land and Resources” in 2014. The Human Development Research Centre (HDRC), through
competitive bidding was entrusted with the responsibility to conduct this almost unexplored in the
past, complex and nationally significant research study. The HDRC has taken the challenge and
carried out the study with an aim to determine optimum population size for Bangladesh considering
land and resources.
The study has analyzed the changing pattern of total land area, cultivable land and forest area in
Bangladesh; food production and consumption gaps; available resources in terms of productive
human capital, gross domestic product (GDP) with share of various sectors and other resources using
a twenty-one year time series data. It has developed model to determine optimum population and
estimated optimum population size for Bangladesh considering assumptions on land size and
available resources deploying a number of different scenarios.
I am grateful to the researchers of HDRC, guided by Professor Dr. Abul Barkat, who have devoted
their fullest possible intellect, time and all out efforts to complete this methodologically complex and
nationally vital research report.
I express my gratitude to the professionals of NIPORT for their sincerest efforts in publishing this
report.
Director General
NIPORT
Director (Research)
National Institute of Population
Research and Training (NIPORT)
Ministry of Health and Family Welfare
PREFACE
The research study titled “Study to Determine Population Size of Bangladesh Considering Land and
Resources” conducted during the year 2014 is an outcome of highest order intellectual effort of the
researchers of Human Development Research Centre (HDRC) guided by a top grade researcher in
Bangladesh and outside, Professor Dr. Abul Barkat. This research study was conducted with an aim to
determine optimum population size for Bangladesh considering land and resources. The NIPORT has
been a collaborator to this study of high national significance.
The study has used secondary data to analyse the changing pattern of total land area, cultivable land
and forest area in Bangladesh; food production and consumption gaps; available resources in terms of
productive human capital, gross domestic product (GDP) with share of various sectors and other
resources and developed models to determine optimum population in Bangladesh, and finally,
determined the optimum population of Bangladesh using these models.
I must express my indebtedness to Professor Dr. Abul Barkat, the Team Leader of the study and his
research team members at HDRC for their performing the complex research job on the subject and
finally to come up with the estimates of Optimum Population Size of Bangladesh which will guide the
population and development plans and strategies of Bangladesh.
I am deeply indebted to the professionals of the Research unit of NIPORT for their sincerest
assistance extended to the HDRC research team towards timely completion of the study maintaining
highest possible quality.
(Md. Rafiqul Islam Sarker)
ACKNOWLEDGEMENT
NIPORT has awarded us at the Human Development Research Centre (HDRC) to conduct a
very complex, previously unexplored and intellectually challenging research study titled
“Study to Determine Population Size of Bangladesh Considering Land and Resources”. The
accompanying report is the outcome of that intellectual challenge.
The successful administration of the Research Study would not have been possible without
the commitment and dedication of all those researchers of HDRC who were involved in this
challenging process.
The commendable enthusiasm of Director General, NIPORT, and Line Director, Training,
Research and Development, Operational Plan of HPNSDP, NIPORT towards the study is
highly appreciated and I am highly indebted to him. I am thankful to Md. Rafiqul Islam
Sarker, Director, Research and, Program Manager (R, S & D) NIPORT, for his positive
support towards the study. I am indebted to Mr. Subrata Kumar Bhadra for his providing us
with thoughtful inputs and unstinted support at various necessary stages of this study.
The in-house staff members of HDRC worked untiringly at all the stages. I thank all those
uncomplaining souls at HDRC.
Prof. Abul Barkat, PhD Dhaka: August 2014
Study Team Leader
&
Chief Advisor (Hon.), HDRC
Abbreviations and Acronyms
ADP Annual Development Programme
Ar Area
ASMTO Area Shown More Than Once
BANBEIS Bangladesh Bureau of Educational Information & Statistics
BBS Bangladesh Bureau of Statistics
BCF Billion Cubic Feet
BCS Bangladesh Civil Service
BiA Bangladeshis in Abroad
BoT Balance of Trade
CBR Crude Birth Rate
CDR Crude Death Rate
CF Current Fallows
CLF Civilian Labor Force
const. Constant
CPR Contraceptive Prevalence Rate
CW Cultivable Waste
DSSAT Decision Support System for Agro-technology Transfer
EAP Economically Active Persons
ECNEC Executive Committee of National Economic Council
est. Estimated
FER Foreign Exchange Reserve
FP Family Planning
FR Fertility Rate
GDP Gross Domestic Product
GNI Gross National Income
GNP Gross National Product
GoB Government of Bangladesh
Govt. Government
GRR Gross Reproduction Rate
GWH Gigawatt Hour
HDRC Human Development Research Centre
HNPSDP Health Population and Nutrition Sector Development Program
IC Installed Capacity
IMR Infant Mortality Rate
IQL Index for Quality of Life
kWh Kilowatt Hour
LEB Life Expectancy at Birth
LFS Labor Force Survey
LPL Lower Poverty Line
MMR Maternal Mortality Rate
MOHFW Ministry of Health and Family Welfare
MR Mortality Rate
MW Megawatt
MWRA Married Woman in Reproductive Age
NAC Net Availability for Consumption
NAfC Land Not available for cultivation
NCA Net Cropped Area
NIPORT National Institute of Population Research and Training
NMR Neonatal Mortality Rate
NRR Net Reproduction Rate
PE Public Expenditure
PEDA Population-Environment-Development-Agriculture
per.cap per capita
POPN Population
PPP Purchasing power parity
Pro Production
RH Reproductive Health
Rmt Remittance
ser. Services
SME Small & Medium Enterprise
SSCA Senate Standing Committee Australia
TCA Total Cropped Area
TFR Total Fertility Rate
TP Total Production
U5M Under five Mortality
UN United Nations
UPL Upper Poverty Line
WI Welfare Index

CONTENTS
Sl. No. Title Page #
Acknowledgements
Executive Summary ........................................................................................................................... i-iii
CHAPTER 1: BACKGROUND AND OBJECTIVES OF THE STUDY ................................................... 1
1.1 Introduction and Rationale .............................................................................................................. 1
1.2 Objectives ............................................................................................................................... 2
1.3 Scopes ............................................................................................................................... 2
1.4 Limitations ............................................................................................................................... 3
CHAPTER 2: LITERATURE REVIEW ...................................................................................................... 4
CHAPTER 3: METHODOLOGY AND ANALYTICAL MODEL .......................................................... 16
3.1 Introduction ............................................................................................................................. 16
3.2 Resource Base Analysis ................................................................................................................. 16
3.3 Technical Approach of the First Model: Model Interlinking Demographic Model, Production
Model and Welfare Index .............................................................................................................. 16
3.4 Technical Approach of the Second Model: Model of Optimum Population for Sustainable
Development ............................................................................................................................. 17
3.5 Variables: Selection, Categorization, and Data Sources ............................................................... 18
CHAPTER 4: ANALYSIS OF RESOURCE BASE ................................................................................. 21
4.1 Introduction ............................................................................................................................. 21
4.2 Changing Pattern of Total Land Area, Cultivable Land and Forest Area ...................................... 21
4.3 Food Production and Consumption Analysis ................................................................................ 22
4.4 Analysis of Human Capital, GDP and its Compositions, and other Productive Resources ........... 26
CHAPTER 5: DETERMINING OPTIMUM POPULATION SIZE .......................................................... 36
5.1 Introduction ............................................................................................................................. 36
5.2 First Model: Model Interlinking Demographic Model, Production Model, and Welfare Index ... 38
5.3 Second Model: Model of Optimum Population for Sustainable Development ............................. 41
CHAPTER 6: CONCLUSION ................................................................................................................... 45
Annex: Primary Variable List .............................................................................................................. 47-50
REFERENCES ............................................................................................................................. 51
List of Figures, Tables and Boxes
List of Figures
Figure 2.1: Bangladesh population in 2020 – How much will be the increment, why (reason), what
can be done? ........................................................................................................................ 13
Figure 4.1: Percentage change in total cultivable land and total forest area, 1991-2010 ...................... 22
Figure 4.2: Percentage change in production of food grains (excluding minor cereals) and pulse,
1991-2010 ............................................................................................................................ 23
Figure 4.3: Percentage change in consumption of food grains (excluding minor cereals) and pulse,
1991-2010 ........................................................................................................................... 24
Figure 4.4: Gap between production and consumption of food grains excluding minor cereals and
pulse (in ‘000’ M.tons), 1991-2010 .................................................................................... 25
Figure 4.5: Percentage change in GDP at constant price (base: 1995-96) and at PPP value, 1991-
2010 ............................................................................................................................. 27
Figure 4.6: Percentage change in per capita GDP at constant price and at PPP value, 1991-2010 ....... 27
Figure 4.7: Percentage change in number of expatriates and inward remittance, 1991-2010 ................ 29
Figure 4.8: Percentage change in GDP share for Agriculture and Forestry, and Fishing sub-sector,
1991-2010 ........................................................................................................................... 33
Figure 4.9: Percentage change in GDP share for Education, Health and Social works, Public
administration and Defence, and Community, Social and Personal Services, 1991-2010 . 34
Figure 4.10: Percentage change in GDP share for Electricity, Gas and Water Supply; Transport,
Storage and Communication; Mining and Quarrying, 1991-2010 ....................................... 34
Figure 4.11: Percentage change in improved water source and sanitation coverage, 1991-2010 ............ 35
Figure 5.1: Gap between projected and optimum population of Bangladesh,
2011-2020 (in millions) ....................................................................................................... 44
List of Tables
Table 3.1: Categorization of Variables ................................................................................................. 19
Table 4.1: Changing pattern of cultivable land and forest area, 1991-2010 ......................................... 21
Table 4.2: Changing pattern of food grains and pulse production, 1991- 2010 ................................... 23
Table 4.3: Changing pattern of food grains and pulse consumption, 1991- 2010 ................................ 24
Table 4.4: Changing pattern of gap between consumption and production of food grains and pulse,
1991-2010 ........................................................................................................................... 25
Table 4.5: Changing pattern of GDP and per capita GDP based on constant price and purchasing-
power-parity, 1991-2010 ..................................................................................................... 26
Table 4.6: Changing pattern of number of registered doctors, 1991- 2010........................................... 27
Table 4.7: Changing pattern of enrolment in secondary school, 1991- 2010 ........................................ 28
Table 4.8: Changing pattern of number of expatriates and inward remittance, 1991-2010 .................. 29
Table 4.9: Changing pattern of Annual Development Programme (ADP) expenditure, 1991- 2010 ... 30
Table 4.10: Changing pattern of total generation of electricity, 1991-2010 ........................................... 30
Table 4.11: Gross Domestic Product at constant market price (Base: 1995-96) by Sectors – FY
1990-91 to 2010-11 (in crore Taka) ..................................................................................... 31
Table 4.12: Percentage change in Gross Domestic Product at constant market price (Base: 1995-96)
by Sectors – FY 1991-92 to FY 2010-11 ............................................................................ 32
Table 4.13: Percentage change in improved sanitation and water source coverage, 1990-2010 ............ 35
Table 5.1: Projected population size of Bangladesh for the period between 2011 and 2020 as per
MOHFW 1996 study (Barkat et al, 1996; Model C) ............................................................ 37
Table 5.2: Data of population for 1990-2010 and projected population for 2011-2015 ....................... 38
Table 5.3: Data of GNI for 1990-2010 and projected for 2011-2015 using log-linear (Cobb-
Douglas) production model .................................................................................................. 39
Table 5.4: Projected estimates of regressors to be used for welfare index (based on annual growth
rate) ............................................................................................................................. 39
List of Figures, Tables and Boxes
Table 5.5: Desired estimates of welfare indices using government intended growth rate of 8% up
to 2015 and 10% afterwards ................................................................................................ 40
Table 5.6: Estimates of supportable optimum population using desired welfare index indicators ....... 40
Table 5.7: Pertinent variables and their data to develop the model ....................................................... 41
Table 5.8: Correlation coefficients of variables with population .......................................................... 42
Table 5.9: Results of hypothesis testing for multiple regression model ................................................ 43
Table 5.10: Projected and optimum population of Bangladesh, 2011-2020 ........................................... 43
Table 5.11: Projected and optimum population of Bangladesh for the period between 2011 and
2020, results of various models ............................................................................................ 44
List of Boxes
Box 5.1: Acronyms and synonyms for each population projection model used in the study ........... 36
Box 5.2: Production Model ................................................................................................................. 38
Box 5.3: Multiple Regression Equation .............................................................................................. 42
Executive Summary
The concept of optimum population size is one of the most debatable and contentious areas of
thoughts having very little consensus among the population-development community.
Whatever the nature and essence of the debate is, the relevant researchers hold more or less
an agreement that the optimum population size is situation-specific, need-specific, time-
specific, and policy-specific. There is a severe dearth of research pursuit in modeling
optimum population size in the global level, let alone in Bangladesh. Various models
pertaining to different types of population projections and associated methodologies are
available in the relevant literature. However, to the best of our knowledge, there exists a
distinct dearth of model to estimate optimum population considering changing pattern of land
and allied resources and outcomes, human capital, sectoral shares in GDP, and other variables
and resources. In the context of this epistemological vacuum, Human Development Research
Centre (HDRC) has been commissioned by National Institute of Population Research and
Training (NIPORT) to determine the optimum population size for Bangladesh considering
assumptions on land and available resources.
Attempts have been made to develop two independent models. After a rigorous review of
relevant literature and consultations with the pertinent experts, appropriate variables have
been identified for specifications of the desired models. The First Model enjoys the freedom
of considering the eligible variables while the Second Model is developed considering the
objective constraint of the study. In each of the models, optimum population has been
estimated for the period between 2011 and 2020, on the basis of different projected scenarios
of population for the same 10 years period.
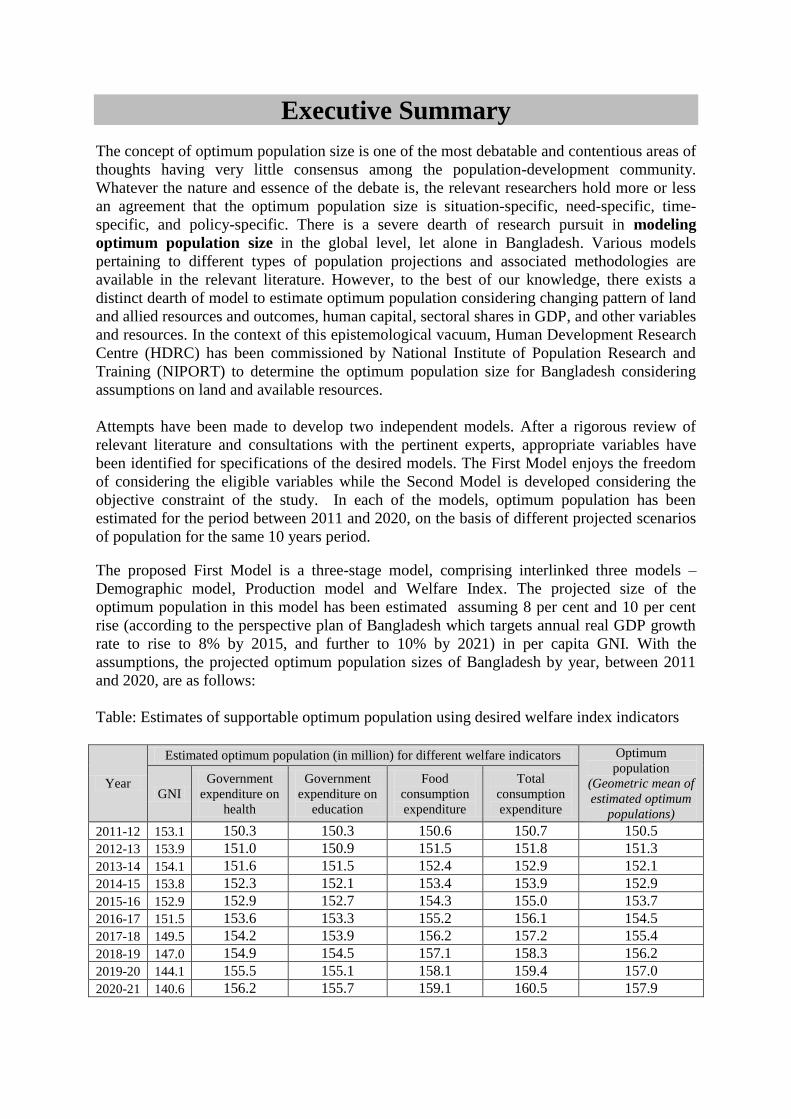
The proposed First Model is a three-stage model, comprising interlinked three models –
Demographic model, Production model and Welfare Index. The projected size of the
optimum population in this model has been estimated assuming 8 per cent and 10 per cent
rise (according to the perspective plan of Bangladesh which targets annual real GDP growth
rate to rise to 8% by 2015, and further to 10% by 2021) in per capita GNI. With the
assumptions, the projected optimum population sizes of Bangladesh by year, between 2011
and 2020, are as follows:
Table: Estimates of supportable optimum population using desired welfare index indicators
Year
Estimated optimum population (in million) for different welfare indicators Optimum
population
(Geometric mean of
estimated optimum
populations)
GNI
Government
expenditure on
health
Government
expenditure on
education
Food
consumption
expenditure
Total
consumption
expenditure
2011-12 153.1 150.3 150.3 150.6 150.7 150.5
2012-13 153.9 151.0 150.9 151.5 151.8 151.3
2013-14 154.1 151.6 151.5 152.4 152.9 152.1
2014-15 153.8 152.3 152.1 153.4 153.9 152.9
2015-16 152.9 152.9 152.7 154.3 155.0 153.7
2016-17 151.5 153.6 153.3 155.2 156.1 154.5
2017-18 149.5 154.2 153.9 156.2 157.2 155.4
2018-19 147.0 154.9 154.5 157.1 158.3 156.2
2019-20 144.1 155.5 155.1 158.1 159.4 157.0
2020-21 140.6 156.2 155.7 159.1 160.5 157.9
HDRC
Report on Study to Determine Population Size of Bangladesh Considering Land and Resource
ii
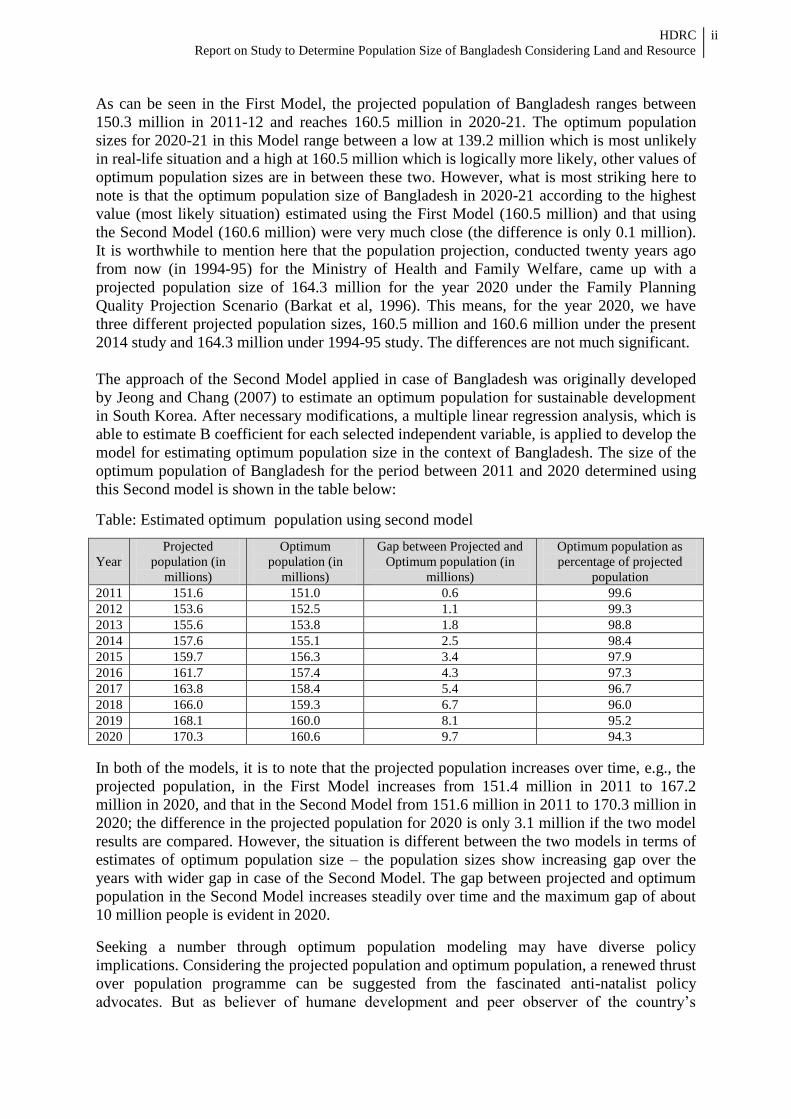
As can be seen in the First Model, the projected population of Bangladesh ranges between
150.3 million in 2011-12 and reaches 160.5 million in 2020-21. The optimum population
sizes for 2020-21 in this Model range between a low at 139.2 million which is most unlikely
in real-life situation and a high at 160.5 million which is logically more likely, other values of
optimum population sizes are in between these two. However, what is most striking here to
note is that the optimum population size of Bangladesh in 2020-21 according to the highest
value (most likely situation) estimated using the First Model (160.5 million) and that using
the Second Model (160.6 million) were very much close (the difference is only 0.1 million).
It is worthwhile to mention here that the population projection, conducted twenty years ago
from now (in 1994-95) for the Ministry of Health and Family Welfare, came up with a
projected population size of 164.3 million for the year 2020 under the Family Planning
Quality Projection Scenario (Barkat et al, 1996). This means, for the year 2020, we have
three different projected population sizes, 160.5 million and 160.6 million under the present
2014 study and 164.3 million under 1994-95 study. The differences are not much significant.
The approach of the Second Model applied in case of Bangladesh was originally developed
by Jeong and Chang (2007) to estimate an optimum population for sustainable development
in South Korea. After necessary modifications, a multiple linear regression analysis, which is
able to estimate B coefficient for each selected independent variable, is applied to develop the
model for estimating optimum population size in the context of Bangladesh. The size of the
optimum population of Bangladesh for the period between 2011 and 2020 determined using
this Second model is shown in the table below:
Table: Estimated optimum population using second model
Year
Projected
population (in
millions)
Optimum
population (in
millions)
Gap between Projected and
Optimum population (in
millions)
Optimum population as
percentage of projected
population
2011 151.6 151.0 0.6 99.6
2012 153.6 152.5 1.1 99.3
2013 155.6 153.8 1.8 98.8
2014 157.6 155.1 2.5 98.4
2015 159.7 156.3 3.4 97.9
2016 161.7 157.4 4.3 97.3
2017 163.8 158.4 5.4 96.7
2018 166.0 159.3 6.7 96.0
2019 168.1 160.0 8.1 95.2
2020 170.3 160.6 9.7 94.3
In both of the models, it is to note that the projected population increases over time, e.g., the
projected population, in the First Model increases from 151.4 million in 2011 to 167.2
million in 2020, and that in the Second Model from 151.6 million in 2011 to 170.3 million in
2020; the difference in the projected population for 2020 is only 3.1 million if the two model
results are compared. However, the situation is different between the two models in terms of
estimates of optimum population size – the population sizes show increasing gap over the
years with wider gap in case of the Second Model. The gap between projected and optimum
population in the Second Model increases steadily over time and the maximum gap of about
10 million people is evident in 2020.
Seeking a number through optimum population modeling may have diverse policy
implications. Considering the projected population and optimum population, a renewed thrust
over population programme can be suggested from the fascinated anti-natalist policy
advocates. But as believer of humane development and peer observer of the country’s
HDRC
Report on Study to Determine Population Size of Bangladesh Considering Land and Resource
iii
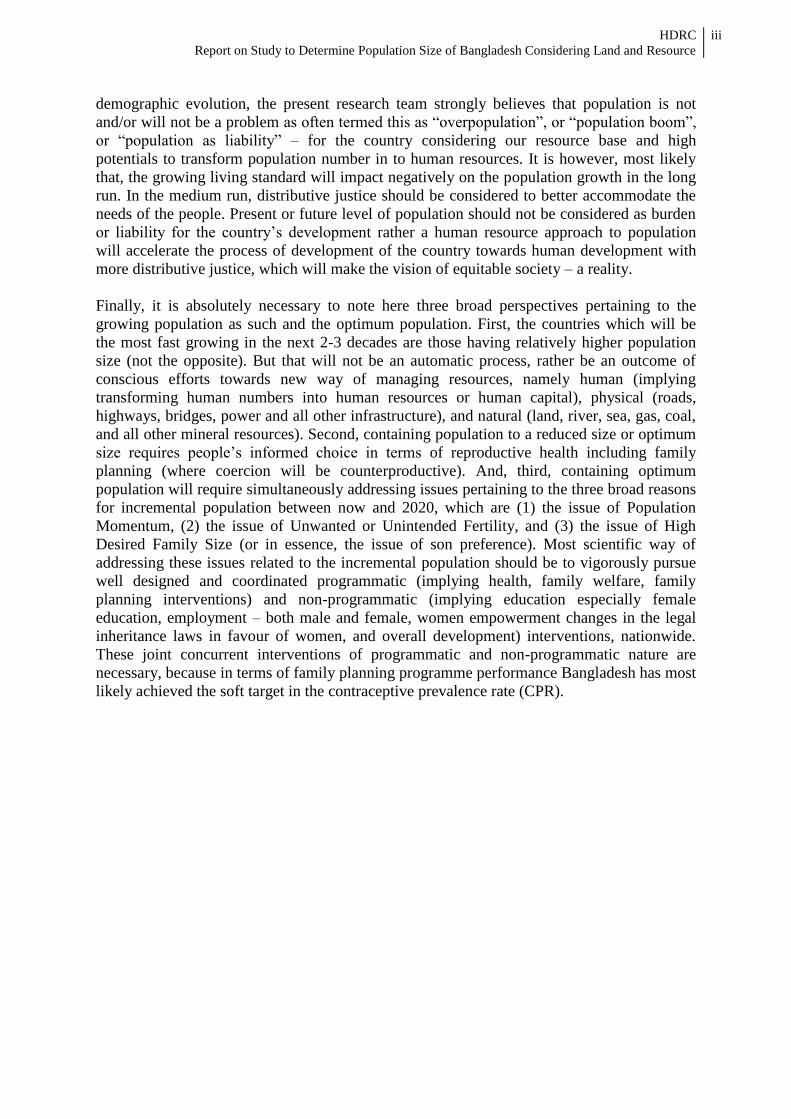
demographic evolution, the present research team strongly believes that population is not
and/or will not be a problem as often termed this as “overpopulation”, or “population boom”,
or “population as liability” – for the country considering our resource base and high
potentials to transform population number in to human resources. It is however, most likely
that, the growing living standard will impact negatively on the population growth in the long
run. In the medium run, distributive justice should be considered to better accommodate the
needs of the people. Present or future level of population should not be considered as burden
or liability for the country’s development rather a human resource approach to population
will accelerate the process of development of the country towards human development with
more distributive justice, which will make the vision of equitable society – a reality.
Finally, it is absolutely necessary to note here three broad perspectives pertaining to the
growing population as such and the optimum population. First, the countries which will be
the most fast growing in the next 2-3 decades are those having relatively higher population
size (not the opposite). But that will not be an automatic process, rather be an outcome of
conscious efforts towards new way of managing resources, namely human (implying
transforming human numbers into human resources or human capital), physical (roads,
highways, bridges, power and all other infrastructure), and natural (land, river, sea, gas, coal,
and all other mineral resources). Second, containing population to a reduced size or optimum
size requires people’s informed choice in terms of reproductive health including family
planning (where coercion will be counterproductive). And, third, containing optimum
population will require simultaneously addressing issues pertaining to the three broad reasons
for incremental population between now and 2020, which are (1) the issue of Population
Momentum, (2) the issue of Unwanted or Unintended Fertility, and (3) the issue of High
Desired Family Size (or in essence, the issue of son preference). Most scientific way of
addressing these issues related to the incremental population should be to vigorously pursue
well designed and coordinated programmatic (implying health, family welfare, family
planning interventions) and non-programmatic (implying education especially female
education, employment – both male and female, women empowerment changes in the legal
inheritance laws in favour of women, and overall development) interventions, nationwide.
These joint concurrent interventions of programmatic and non-programmatic nature are
necessary, because in terms of family planning programme performance Bangladesh has most
likely achieved the soft target in the contraceptive prevalence rate (CPR).
CHAPTER 1
BACKGROUND AND OBJECTIVES OF THE STUDY
1.1 Introduction and Rationale
Bangladesh is in the third stage of demographic transition, experiencing the fastest population
growth between 1961 and 1991 accumulating population size doubled in just 30 years. While
in the following 20 years, population size increased only by 35 per cent and expected to
decline further (Nabi 2011 cited in Bangladesh Bureau of Statistics, BBS 1994 and 2011).
The projection done by the Bangladesh Bureau of Statistics (BBS) showed that the total
population of Bangladesh was 152.5 million in mid-2012 with a density of 1,034 person per
sq. km (BBS 2011). Almost two decades before this BBS projection, the population
projection done in 1994 for the Ministry of Health and Family Welfare by Barkat. et.al
(1996), using three different family planning-related scenario, namely base projection
scenario, intender projection scenario and quality projection scenario1 came up with projected
population sizes under each scenario for a relatively longer time period of 30 years between
1994 and 2024. In Barkat et al, 1996, the projected population size shown for the year 2012
was 172.1 million under base projection scenario, 161.3 million under intender projection
scenario, and 153.2 million under the quality projection scenario (Barkat et al, 1996, pp. 17,
24, 33). The latest version of World Population Prospects (2012 revision: medium variant)
revealed that the population of Bangladesh will add up to 34 per cent more and increase to
maximum 203.7 million in 2060 and will begin to decline later (UN Population Division
2013). Here, in order to show the relevance of our own Bangladesh work actually conducted
in 1994 and published in 1996 on a 30-year long projection of population, it is worth
mentioning that for the year 2024 the projected population for Bangladesh was 216.9 million
according to the base projection scenario, 190.2 million according to the intender projection
scenario, and 168.6 million according to the quality projection scenario key (Barkat et al., pp.
17, 24, 33). The key reasons for presenting the projected population of Bangladesh using
different scenarios pertaining to family planning and associated reproductive health is just to
convey the message that family planning matters; and what matters most in family planning
is not just the family planning programme per se but knowledge based programme
facilitating peoples informed choices, which in turn, is a real possibility if programme is
designed in a way which will do everything, in addition to sustaining the current level of
contraception use, undertake innovative measures to transform the intenders into users, raise
continuation rates, impose use effectiveness, and shift toward use of longer-acting methods
(for details see, Barkat et al, 1996, pp. 36-46).
Bangladesh Population Policy 2012 aims to attain a healthy, happy and prosperous
Bangladesh through planned development and control of population size (MOHFW 2012).
Limiting population size into a tolerable level is one of the major bases for updating the
existing population policy. Keeping same line of action, the ECNEC undertook a crucial
decision to determine an optimum population size for Bangladesh considering limited but
highly fertile geographic landscape and growing resources of the country (ECNEC decision
on August 23, 2011). However, it’s a valid concern how much population can be afforded by
our land and resources, which are often considered to be depleted on environmental and
1 Details about the content of these scenarios are presented in Chapter 2 dealing with Literature Review and in section 5.1
of Chapter 5.
HDRC
Report on Study to Determine Population Size of Bangladesh Considering Land and Resource
2
ecological degradation ground. This is the concept close to the concept of populations
“carrying capacity”2.
The total land area of Bangladesh is fixed like other sovereign geographical territory with
regular conversion among the land typos. This conversion is much more prevalent in the case
of agricultural land. Both inter-conversion (agricultural land converted to non-agricultural
uses) and intra-conversion (conversion among crop land, water body, forest land etc.) of
agricultural land are taking place having logical concerns for food security, resource
utilization and maintenance. Against the backdrop of the aforementioned issue, determination
of optimum population size can be a desirable policy variable which may facilitate future
resource (productive human capital, GDP with share of various sectors and other resources)
mobilization and utilization plan.
For the optimization of the population size at a particular point of time, we need to know our
primary resource base which can afford minimum living standard (at least above poverty
line) for the common people. In this respect, analysis of the changing pattern of total land
area (including cultivable land and forest area) will aid us to trace the resource dynamics;
which can also be complemented with the analysis of available resources in terms of
productive human capital and GDP compositions.
1.2 Objectives
The present study aims to determine optimum population size for Bangladesh considering
land and resources. Specifically the study has moved forward with the following objectives:
1. Analyse the changing pattern of total land area, cultivable land and forest area in
Bangladesh;
2. Analyse food production and consumption gaps;
3. Analyse available resources in terms of productive human capital, gross domestic
product (GDP) with share of various sectors and other resources; and
4. Estimating optimum population size for Bangladesh considering assumptions on
land size and available resources.
1.3 Scopes
The study primarily aims to estimate optimum population size for Bangladesh considering
assumptions on land size and available resources. Here we are offering two independent
models. The proposed first model is a three-stage-model, comprising three interlinked
models- Demographic model, Production model, and Welfare Index. The second model
adopted here was developed and applied by Jeong and Chang (2007) to estimate an optimum
population size for sustainable development in South Korea. After necessary modifications of
this second model, a multiple linear regression analysis, which is able to estimate B
coefficient for each selected independent variable, is applied to develop the model for
estimating optimum population size in the context of Bangladesh. We have analyzed the
major resources with a time span of twenty one years, from 2000 to 2020 as background
work of the warranted optimum population models.
2 There exist at least 26 different definitions of human carrying capacity published since 1975 (Cohen., J.E. 1995, p. 232).
Some details about the concept of human carrying capacity as it is related with the determination of optimum population
size is presented in Chapter 2.
HDRC
Report on Study to Determine Population Size of Bangladesh Considering Land and Resource
3
1.4 Limitations
As already mentioned, the determination of population size considering land and other
relevant resources or, in other words, the determination of optimum population size is a
difficult-to-accomplish task – both methodologically and in real life situation due to various
exogenous and endogenous reasons. The task accomplished in this research study was not
free of limitations; and the limitations presented below are serious by nature:
1. The selection of resources is highly constrained by the limited objectives of the study.
Considerations have been confined to primary resource base which can afford
minimum living standard (at least above poverty line) for the common people.
2. The assumptions made in the process of determining optimum population, may not
hold in the following years.
3. The regression coefficients have been considered constant over time. More
experiments and analysis are required to determine whether they vary over time.
4. It is most likely that, fine tuning the modeling strategies adopted and explained in this
study including inclusion of more variables in the framework of interdependent
structure could provide more precise estimates.
5. Some variables, not significantly correlated to population, have been considered for
objective restrictions.
6. Any similar kind of model was hardly available to be taken as guide.
7. The operational definitions of various variables are different in different sources, from
where data have been collected. This has been an unavoidable constraint.
HDRC
Report on Study to Determine Population Size of Bangladesh Considering Land and Resource
4
CHAPTER 2
LITERATURE REVIEW
The discourse of optimum population was inaugurated in the discipline of economics.
Reverend Thomas Robert Malthus FRS, an English cleric and scholar, was a key figure in
this area (Dasgupta 1969) whose theory was based on a two-variable dynamic model of the
interconnected effects of income and population. In economics, overpopulation is not merely
a numerical demographic fact describing ‘too many people’, rather it is about production
arising from the manner in which land and other resources are used (McNicoll 2005).
Optimum population is defined in the discipline as the population that achieves a given aim
in the most satisfactory way. Optimum population will be different according to the aim that
one seeks to achieve in considering ‘the most satisfactory way’. However, overpopulation has
been argued as a central reason for weakening the potential of sustainable development.
Nonetheless, it is not commonplace to undertake theoretical and/or empirical research on
optimum population in relation to sustainable development (Jeong and Chang 2007).
Jeong and Chang (2007) attempted to estimate an optimum population in terms of sustainable
development of South Korea. The study used population as the dependent variable, and the
states of the natural and human-made environment as the independent variables. The impact
of each variable on the determination of optimum population size was expected to be
different, which was defined as ‘relative importance of each variable’. The relative
importance was considered when the optimum population size was estimated. Regression
analysis and factor analysis, which derived the relative importance of a variable, required a
set of time-series data. The variables, whose correlation coefficients with population are
higher than 0.900 at a significant level of 0.001, were identified from forty-five variables of
the Korean statistical yearbooks. Nine were selected as the final explanatory variables
determining population in the order of a high correlation coefficient, as the number of the
explanatory variables in regression analysis should be less than the sample size (The study
used a ten-year time series data set which corresponded to a sample size of 10). However,
two methods were developed, using multiple regression analysis. The first method concerned
the objective states of environmental components. The second was drawn from questionnaire
survey data that measured public consensus on the desirable states of the environmental
components. A different number for optimum population was estimated by the former
according to the scenarios; as the optimum population for sustainable development is not a
fixed number, rather it is dependent upon the values of the variables included in the
estimation.
An Australian Senate Committee – the Senate Standing Committee Australia or SSCA (1994)
– has estimated the optimum population in Australia in terms of carrying capacity using the
main empirical concept of sustainable development, including technology options, possible
patterns of resource use and quality of life. Pimentel et al. (1994) argue that the earth’s long-
term sustainability calls for a population of less than half its present level, in particular, with a
focus on resources as a sub category of the natural environment. Lutz et al. (2002) have
developed the PEDA (Population-Environment-Development-Agriculture) model on the
basis of the interactions between population growth, education, land degradation, agricultural
production and food insecurity. On the other hand, McNicoll (2005, pp. 4-5) argues that the
built-in environment and subjective welfare of the average inhabitants should be included in
estimations of the optimum population.
HDRC
Report on Study to Determine Population Size of Bangladesh Considering Land and Resource
5
Singer (1972) explored different approaches to develop a methodology that will allow a
calculation of "optimum levels of population". Singer’s discussion is confined to the United
States, but the methodology is broad enough to handle experiences of other countries,
including less-developed countries. The study is primarily based on hard core economics, but
it draws major inputs from other areas, such as technology, natural resources management,
environmental effects, and demography. The general approach has been to develop an Index
for Quality of Life (IQL or Q-index) and to maximize this index as a function of level and
distribution of population. The technique consists of a reshuffling of national income
accounts so as to be able to go from the Gross National Product (GNP) to the index for
quality of life, plus a careful discussion of what is and what is not to be included. The initial
part of Singer’s study consists of a projection of the index for quality of life as population
level increases and as population distribution changes, under the assumption of various
technologies, particularly as these relate to the consumption of minerals, energy, and other
natural resources. One would expect that as economic growth continues, an increasing
fraction of expenditures would be for the diseconomies of scale produced by population
growth and economic growth. This study should be useful by providing a rational base for
governmental policies regarding population, both in the United States and abroad. Another
application of the study is related to technology assessment, by measuring the impact on
economic well-being through the introduction of new technologies. Therefore, one can gauge
the necessary and desirable investments in certain new technologies. In general, mathematical
models resulting from Singer’s study can become useful diagnostic tools to analyze the
consequences of various public and private policy decisions.
Gretchen et al. (1994), in their paper, raised six critical points to reach a conclusion on the
understanding of optimum global population. Those six points are as follows:
Firstly, an optimum population size is not the same as the maximum number of people
that could be packed onto Earth at one time, nurtured, as they would have to be, by
methods analogous to those used to raise battery chickens. Rather, almost everyone
who puts value on human life appreciates the importance of quality of life.
Obviously, many more human beings could exist if a sustainable population were
maintained for thousands to millions of years than if the present population
overshoot were to destroy much of Earth's capacity to support future generations.
Secondly, an optimum population size should be small enough to make it possible to
provide the minimal physical ingredients of a decent life to everyone (e.g.,
Ehrlich et al, 1993), given both the inequitable distribution of wealth and resources
and uncertainty regarding rates of long-term, sustainable resource extraction and
environmental impacts. Nathan Keyfitz (1991) is agreeable: "If we have one point
of empirically backed knowledge, it is that bad policies are widespread and
persistent. Social science has to take account of them." The grossly inequitable
distribution of wealth and basic resources prevailing today is highly destabilizing
and disruptive. ... A further downward adjustment in the optimum should be made
to ensure against both natural and human-induced declines in the sustainable flow of
resources from the environment into the economy and increases in anthropogenic
flows of wastes, broadly defined, in the opposite direction.
Thirdly, basic human rights in the social sphere (such as freedom from racism, sexism,
religious persecution, and gross economic inequity) should be secure from problems
generated by the existence of too many people. Everyone should have access to
education, health care, sanitary living conditions, and economic opportunities; but
HDRC
Report on Study to Determine Population Size of Bangladesh Considering Land and Resource
6
these fundamental rights are difficult to assure in large populations, especially
rapidly growing ones. Political rights are also related to population size, although
this is seldom recognized (Parsons 1977). Democracy seems to work best when
populations are small relative to resource bases; personal freedom tends to be
restricted in situations of high population density and/or scarce resources.
Fourthly, an optimum population size should be large enough to sustain viable
populations in geographically dispersed parts of the world to preserve and foster
cultural diversity. It is by no means obvious that the dominant and spreading
"Western" culture has all the secrets of long-term survival (Ehrlich 1980) – to say
nothing of cornering the market on other values. Cultural diversity is an important
feature of the species in and of itself. Unfortunately, many cultures borne by small
groups of people are in danger of being swamped by the dominant culture with its
advanced technologies and seductive media, or worse, of being destroyed
deliberately because of social intolerance or conflicts over resources.
Fifthly, an optimum population size would be sufficiently large to support a "critical
mass" in each of a variety of densely populated areas where intellectual, artistic, and
technological creativity would be stimulated. While creativity can also be sparked in
sparsely populated areas, many cultural endeavors require a level of specialization,
communication, and financial support that is facilitated by the social infrastructure
characteristic of cities.
Sixthly, an optimum population size would also be small enough to ensure the viability
of biodiversity. This criterion is motivated by both selfish and ethical
considerations. Humanity derives many important direct benefits from other species,
including aesthetic and recreational pleasure, many pharmaceuticals, and the basis
and health of agriculture. Furthermore, the human enterprise is supported in myriad
ways by the free services provided by healthy natural ecosystems, each of which has
elements of biodiversity as key working parts (Ehrlich and Ehrlich 1992).
Joel Cohen (1996) in his seminal work titled “How Many People Can the Earth Support?”
has dealt with many critical dimensions related to the Optimum World Population and
relevant methodological issues. As to the projection methods and limitation of demographers,
Cohen wrote “Popular and professional accounts of population matters often fail to make
clear to the real uncertainty about the demographic future … Here is one of the best-kept
secrets of demography: most professional demographers no longer believe they can predict
precisely the future growth rate, size, composition and spatial distribution of population…
This uncertainty derives from the way demographers try to develop knowledge about the
future population … All approaches to population prediction assume that some mechanism
(whether deterministic or partially random) that has operated in the past will continue to
operate in the future… Attempts to predict total population size have followed three main
paths. Mathematical extrapolation assumes that future population sizes are determined by
present and past population sizes, and nothing more ... In most instances, the mathematical
formula has no visible connection to the observable mechanisms of human population
growth. A second approach, called the cohort-component method, assumes that the
composition or distribution of the population according to age and sex plus past age-specific
and sex-specific rates of birth, death and migration are enough to predict the future size of
each subgroup of the population and hence the populations’ growth and size… Finally,
system models, while typically ignoring the detailed age and sex composition of the
population, posit quantitative interactions of population growth and size with non-
HDRC
Report on Study to Determine Population Size of Bangladesh Considering Land and Resource
7
demographic factors such as industrialization, agriculture, pollution and natural resources …
the most ambitious efforts so far show that present knowledge is not up to the task” (see
details, Cohen, 1996, pp.109-111). In responding to the question of ‘what do we know for
sure about the future of global population’, Cohen maintains, “The Law of Prediction asserts:
the more confidence someone places in an unconditional prediction of what will happen in
human affairs, the less confidence you should place in that prediction … Nevertheless, a few
modest but important certainties emerged from our critical look into the future … (those can
be summarized under four headings): uncertainty, zero population growth, momentum and
Methuselah’s choice. The future of human population growth is uncertain; that much is sure!
What we do not know for sure exactly how uncertain. There is no reliable way (so far) to
construct 90 per cent confidence interval for the population or population growth rate of the
United States, Thailand or the World in the year 2025 … The Earth’s human population must
ultimately approach a long-term average growth rate of zero… [As to the momentum aspect]
The remaining things we know for sure about the future of population are conditional
predictions… Methuselah’s choice: average length of life is a stationery population = 1/birth
rate… People cannot have both a high birth rate and a long life expectancy, and still have a
stationary population” (Cohen 1996, pp.153-157). In terms of highly contentious
methodological issues pertaining to the projection of optimum world population, it would be
worthwhile to mention the following as stated by Cohen:
(a) In 1970, world population approached 3.7 billion people. In that year, H.R. Hulett
estimated that the optimal population of the world must be less than one billion
people. No surprising advances in data or theory occurred between 1967 and 1970.
The difference of more than 1,000-fold between the numbers obtained by De Wit and
Hulett results from radically different approaches and assumptions (see Cohen 1996,
p.179).
(b) In 1992, the United Nations published seven projections of regional and world
population to the year 2150. All seven projections used the cohort-component
method with five-year intervals of age and time. The seven projections differed only
in their assumptions about fertility. Here the fun began. Like the speed shown on
your car’s speedometer, the total fertility rate is not a prediction; it is only an
indicator. American women are unlikely to have their life time fertility described by
the 1990 total fertility rate (TFR) of the United States. The total fertility rate
measures the current rate or level of fertility. The two most interesting projections
assumed, first, that fertility would remain constant at its present levels and, second,
that fertility would drop to the replacement level instantaneously (see Cohen 1996,
pp. 136-137).
(c) The projections of the United Nations, the World Bank and Frejka (all upto year
2150) all assumed business as usual: continuous social and economic development,
no large-scale epidemics, famines or wars, no agricultural or environmental crises,
no surprising developments in technology or social organization that would greatly
reduce the desire for children and no radical changes in government’s population
policies. Such projections provided an image of gradual change that is comforting to
the public and to politicians, more comforting than the facts can guarantee (see
Cohen 1996, pp.146-147).
HDRC
Report on Study to Determine Population Size of Bangladesh Considering Land and Resource
8
In ‘Limits to Growth’, Meadows and Meadows constructed a computer model using five
variables – population, food, industrialization, non-renewable resources, and pollution – to
compute the consequences of various population-related assumptions about the future
(Meadows et al, 1972). They have computed various scenarios and presented those as
conditional predictions. The commonness in all the scenarios was that the first, both
population and industrialization showed upward movement and then fell sharply downward.
Meadows et al. denoted the pattern as “overshoot and collapse” (known as World3 model
financially supported by Club of Rome) and they have concluded these as fundamental
properties both of their model and of the world itself. The key points they mentioned are as
follows: “The basic behavior mode of the world system is exponential growth of population
and capital, followed by collapse … [T]his behavior mode occurs if we assume no change in
the present system or if we assume any number of technological changes in the system… The
unspoken assumption behind all of the model runs we have presented … is that population
and capital growth should be allowed to continue until they reach some ‘natural’ limit”
(Meadows et al, 1972, p.149).
Most of the population projections and especially the projections about the optimum size of
population concentrate on certain variables of interest (mostly chosen by those who project or
predict) assigning same or different weights to different variables are intended to come up
with various scenarios on the size of future population of a country or a region or the world
etc. in a time line (by year or appropriate to say, for mid-year population), which carries
implicit or explicit notion of carrying capacity of the absolute number of people that a space
(country or region or continent or sub-continent or world) can support considering various
demographic, economic, environmental, social, technological variables – either in static or in
dynamic situations. Hence, it would be of most appropriate necessity to delve deeper into the
very concept of population’s carrying capacity, along with the problems of operationalizing
the concept and making projections (estimations) based on the concept. First of all, from
logical and scientific points of view it should be made clear that any scientific concept to be
truly scientific must have the trait to be measured and calculated. Here, as already noted, Joel
Cohen found 26 verbal definitions of human carrying capacity published since 1975 (see,
Cohen 1995, p. 232). Second, before presenting some of those concepts of human carrying
capacity, it would be plausible to mention here that the definitions vary extremely widely;
often contradict one another; lack single generally accepted meaning; vary widely in
addressing the issue of the time horizon; lack inadequate power of recognizing unlimited
inner potentials of human being; lack consensus about the non-predictability of knowledge
and technology; some are static some are dynamic, some are deterministic some are
stochastic; some are based on a single limiting factor some are based on several limiting
factors and some others reflect a combination of both.3
Now let us see first what are the major definitions of the concepts of human carrying
capacity and then the problems associated with operationalization and measurement of
population size or optimum population size using those concepts as philosophical basis.
Some of the major definitions of the concept of human carrying capacity are as follows:
3 In order to ensure better clarity on these, the following are in order: In static systems the values of all variables are
constant through time, while dynamic estimates allow for changes with time. Deterministic estimates assume fixed values
for all parameters, while stochastic estimates include random variations in at least some of the parameters with the result
that the probability of an outcome is less than one. Based on these dimensions of the concept of carrying capacity
Fearnside concluded that, since the real world is characterized by both changes with time and variability, dynamic
stochastic estimates should lead to the most realistic estimates of carrying capacity (for details, see, Fearnside 1986, p.70).
HDRC
Report on Study to Determine Population Size of Bangladesh Considering Land and Resource
9
(a) “The carrying capacity, however, is not given exogenously; it is determined
endogenously. This implies that development strategies, encompassing interrelated
sets of goals and policy measures, can make it possible to have a continuing
expansion of carrying capacity” (United Nations 1980, reprinted in Ghosh 1984,
p.74).
(b) “Because of increases in knowledge, the earth’s ‘carrying capacity’ has been
increasing throughout the decades and centuries and millennia to such an extent that
the term ‘carrying capacity’ has by now no useful meaning. These trends strongly
suggest a progressive improvement and enrichment of the earth’s natural resource
base, and of mankind’s lot on earth” (Simon and Kahn 1984, p.45).
(c) “In sum, the closer a low-income agricultural region or country is to having no trade,
only marginal technological improvements available for adoption, no effective
institutional base for spreading such improvements as are known and warranted, no
vent for surplus [population] in the face of declining marginal returns to incremental
arable land, and population growth more rapid than productivity growth, the closer it
is to the simple model of a country approaching its carrying ceiling [T]he key is the
speed with which the constraints are pushed back” (Muscat 1985, p.20).
(d) “The carrying capacity of a particular region is the maximum population of a given
species that can be supported indefinitely, allowing for seasonal and random
changes, without any degradation of the natural resource base that would diminish
this maximum population in the future” (Kirchner et.al 1985, p.45).
(e) “The basic definition of sustainable carrying capacity … is: the maximum number of
persons that can be supported in perpetuity on an area, with a given technology and
set of consumptive habits, without causing environmental degradation” (Fearnside
1986, p.73).
(f) “In its simplest form, carrying capacity can be expressed as the size of population
which may be sustained by a given territory at a given physical standard of living.
The concept is, of course, an extension of the biological definition; but when applied
to human societies, it becomes infinitely more complex, infinitely more subtle. Not
only do cultural, economic and political factors come into play; human societies have
the possibility of expanding their carrying capacity through the deliberate selection
and pursuit of development options which allow for the enhancement and sustainable
use of physical resources while ensuring that economic growth is not surpassed by
population growth and the material demands of individuals” (King 1987, p.7)
(g) “As applied to human populations, the concept of carrying capacity is obviously a
slippery one. Man is a tool making animal, capable of squeezing out of his
environment more than undisturbed nature would provide for his needs… in contrast
to the case of animal ecology, the capacity of a given environment to support human
populations can expand relatively rapidly. On the other hand … for humans, a
physical definition of needs may be irrelevant. Human needs and aspirations are
culturally determined…” (Demeny 1988, pp.215-216).
(h) “Carrying capacity can be defined as ‘the number of people that the planet can
support without irreversibly reducing its capacity to support people in the future’.
While this is a global-level definition, it applies at [the] national level too, albeit with
many qualifications as concerns international relationships of trade, investment, etc.
In fact it is a highly complex affair, reflecting food and energy supplies, eco-system
services, human capital, people’s lifestyles, cultural constraints, social institutions,

HDRC
Report on Study to Determine Population Size of Bangladesh Considering Land and Resource
10
political structures, and above all public policies among many other factors, all of
which interact with each other” (Myers 1992, pp.18-19).
(i) “The carrying capacity is the size of population that can be sustained by the
environment indefinitely …. For human populations the term ‘carrying capacity’ is
much more complex because of the many kinds of resources people take from the
environment, the many kinds of wastes they return, and the great variability in
technology, institutions, and lifestyles. Carrying capacity is a dynamic concept”
(Meadows et. al 1992, p.261).
(j) “Carrying capacity refers to the number of individuals who can be supported in a
given land area over the long term without degrading the physical, ecological,
cultural and social environment…. Although the advent of technology permits
humans to exceed natural carrying capacity limits in some respects, the ultimate use
of any human population is still constrained by amounts of arable land, potable
water, and other resources” (Miller 1992, p.81).
(k) “For human beings, the matter [of carrying capacity] is complicated by two factors:
substantial individual differences in types and quantities of resources consumed and
rapid cultural (including technological) evolution of the types and quantities of
resources supplying each unit of consumption. Thus, carrying capacity varies
markedly with culture and level of economic development” (Daily and Ehrlich 1992,
p.762)
(l) “The carrying capacity of the earth is not a natural constant – it is a dynamic
equilibrium, essentially determined by human action” (Heiling 1994, p.255).
(m) “Carrying capacity is the largest number of any given species that a habitat can
support indefinitely … The earth’s capacity to support humans is determined not just
by our most basic food requirements but also by our levels of consumption of a
whole range of resources, by the amount of waste we generate, by the technologies
we choose for our varied activities, and by our success at mobilizing to deal with
major threats” (Postel 1994, pp.3-4).
The definitions of the concept of human carrying capacity presented above are both
controversial and useful in understanding and measuring optimum population size. The
related controversies and complexities have already been mentioned. However, to conclude
on this issue, it would be useful to raise the question which is already raised by Joel Cohen
that, the estimates of how many people the Earth can support vary from less than one billion
to more than 1,000 billion (Cohen 1995, p.212). Cohen argued that the low estimates indicate
that more people are already on the Earth than can be supported (for some time period,
usually not stated, in some mode of life considered plausible or desirable by the estimator).
As to the high estimates, Cohen argues that, high estimates indicate that the Earth could
sustain substantially more than 10 billion or 15 billion people, even as many as 10 or 100
times more – once again, for some unstated time period in some mode of life considered
plausible or desirable by the estimator. In explaining further the scientific essence of the
highest number estimates, Cohen, using a figure, plotted the estimates as a function of time,
on a logarithmic scale of population size, and finally came up with two striking features. The
first striking feature is that, there is no clear increasing or decreasing trend in the estimated
upper bounds. And the second striking feature is that the scatter among the estimates seems
to increasing with passage of time, as more and more extreme (both high and low) estimates
are proposed, challenged and defended. The argument then boils down to the methods of
estimation, where it is most important to note that though the numerical details of each
HDRC
Report on Study to Determine Population Size of Bangladesh Considering Land and Resource
11
estimate are unique, the methods fall into a few broad groups: categorical assertion, curve
fitting, generalizations from observed population density, constraint by single resource,
constraint by multiple resources converted to a single resource, constraint by multiple
independent resources, and system models (for details about all abovementioned, see, Cohen,
1995, pp. 213-232).
Although there exist documents – some are official, some others are unofficial – containing
population projection of Bangladesh, most are projections based on cohort-component
method which incorporates variables related to the composition or distribution of the
population according to age and sex plus past age-specific and sex-specific rates of birth,
death and migration; and most importantly all those projections, in their mathematical
extrapolation and in their models, assume that what has operated in the past will continue to
operate in the future. These are just static models, which have no power to see the reality of
dynamic changes in the relevant variables used in the model. All these projections are usual
and simple projections aiming at estimating the possible sizes of future population under
different scenarios (as defined by the projectionists themselves or by the officially guided
need-mostly needs of political nature). Hence, most of these projections although contain
some indicative elements of optimum population, they are in reality not at all projections
aimed at estimating the Optimum Population size of Bangladesh. However, in this plethora
of projection exercises one exception is evident in a rigorous projection exercise done 20
years back titled “Strategic Directions of the Bangladesh National Family Planning
Programme: 1995-2005” in Bangladesh (projection exercises were done in 1994-95 and
published in 1996) under the auspices of the Ministry of Health and Family Welfare (for
details see, Barkat et al, 1996). In this population projection exercise, the exceptionality lies
not only in the innovative nature of the projection model, but also in the fact that the model
used can be denoted, to a large extent, as a model projecting optimum population size of
Bangladesh based on two scenarios using a mix of cohort-component method in a dynamic
fashion and various variables related to the national family planning programme. The two
scenarios worked out in this model have been termed by the authors as (1) Intender scenario
and the projection as “Intender Projection”, and (2) Quality scenario and the population
projection as “Quality Projection”. Accordingly, in order to realize each scenario, appropriate
programme strategies have also been devised, which included set of both programmatic and
non-programmatic interventions along with implementation action steps to be pursued by the
government, non-government agencies, private sector, and the development partners (for
details, see, Barkat et al, 1996, pp. 21-46). One of the major innovations of this projection
was to develop the concept of ‘intender’ as opposed to the traditionally used and widely
accepted concept of “unmet need” (for family planning or for contraception). The study
argued that the concept of “unmet need” for family planning or contraception is flawed since
this concept of “unmet need” is researchers’ defined and not defined by the ‘clients’
themselves. To the contrary, the new concept first time appeared in the relevant literature
which is discovered by Barkat et al. 4 (based on the in-depth secondary analysis of the
Bangladesh Demographic and Health Survey 1993-94) – the family planning “intender”
concept is the concept defined by the clients themselves and has nothing to do with the
researchers’ defined flawed but extensively used concept. As opposed to the people who fall
under the unmet need or unmet demand categories who may or may not have expressed any
intention to use family planning methods or contraceptives (in the survey), the ‘intenders’ are
those who have expressed their intention to use family planning methods or contraceptives –
4 Barkat., A., Howlader, SR., Khuda, B, and Bose., ML. (1996b). Family Planning Unmet Need in Bangladesh: Basis for a
Prototype Family Planning Programme. Prepared for The Futures Group International, Inc., USA, Dhaka: University
Research Corporation Bangladesh.
HDRC
Report on Study to Determine Population Size of Bangladesh Considering Land and Resource
12
either to space or to stop child birth, either in immediate future or in near future or after a few
years – and may or may not fall under the researcher’s defined concept of ‘unmet need’.
Pertaining to this, the secondary analysis of BDHS 1993-94 conducted by the authors have
revealed that a large number of women (two-thirds) in the ‘unmet need’ and “non-user non-
unmet-need” categories have expressed their intention to use some contraceptive method, and
most of the unmet-need women – 65 per cent – expressed their future intention to use
contraception (for details see, Barkat et al, 1996b). The projected population size, which, to a
large extent, may be termed as optimum population size was the size compatible with the
programmatically higher order scenario, denoted in the study as “Quality Scenario”. This
scenario comprises all elements of intender scenario i.e., do comply with the intender’s
intention to use contraception, or, in other words, convert intenders into users plus all
elements emphasizing substantial improvement in the quality of family planning services for
all users implying gradual improvements in contraceptive continuation rate, effectiveness
rate, and gradual shift in contraceptive method mix towards longer-acting methods and all
based on informed choice of the people for which vigorous efforts on behavioral
communication changes along with development in economic (e.g; employment, social safety
not programmes, public health services etc.) and social fronts are necessary. After conducting
all these complex and innovative exercises, the projected population size (which may be
termed as close-to-optimum size, as can be seen in the Introduction of Chapter 5) under the
“Quality Projection” was 153.2 million in 2012 and the same for 2024 was 168.6 million
(see, Barkat et al, 1996, p.33).
This is based on the recent declining wanted fertility rate, the UN global population
projection shows that Bangladesh population may be stabilized in 2051 with the population
of about 195 million under the condition that current wanted fertility rate which is as low as
1.6 TFR far below replacement level will be achieved as early as possible (Neaz 2013).
Conducting digital interpretation of satellite image, a study by Hasan et al, 2013 has
attempted to quantify land availability in 1976, 2000 and 2010. The amount of total land,
comprising of both agricultural and non-agricultural land, increased from 3,57,83,529.7 acre
in 1976 to 3,60,07,094.4 acre in 2010. The agricultural land use declined annually by 0.25 per
cent with the concomitant annual rise in the non-agricultural land use by 3.03 per cent during
the study period. The study has also explored the changing pattern of crop and which
included land under cultivated, cultivable waste and current fallow. The total area under crop
land was estimated at 2,41,10,781.5 acre in 1976 (67.38% of total land area) and at
2,16,17,284.4 acre in 2010 (60.04% of total land area) with annual decline of 0.304 per cent,
posing grave food insecurity implication for a vast number of population in the medium run.
A most recent study on increasing commercialization of agricultural land also notes the same
findings in the household level observations (Barkat, Suhrawardy and Osman 2015). Nearly
one-fifth (19.9%) of the households decreased their crop land and a 12.6 per cent amount of
crop land underwent intra-conversion of land to other agricultural subsectors. The declining
trend was also observed in the case of forest, from 43,34,645 acre in 1976 to 35,42,316 acre
in 2010, with an annual fall of 0.54 per cent.
The gap between demand (consumption) and production of rice due to climate change was
analyzed by Basak (2012) through simulation study under five different scenarios, which
found a significant demand-production gap of rice during 2050, 2070 and 2100. Decision
Support System for Agro-technology Transfer (DSSAT) model predicted that rice yield may
be reduced from 4.95 per cent to 24.66 per cent. The study also projected percentage of
deprived population from rice under different climate scenarios.
HDRC
Report on Study to Determine Population Size of Bangladesh Considering Land and Resource
13
The Labor Force Survey 2010 (LFS 2010) reported that economically active population of
the country was 56.7 million in 2010 of which 6.8 million were employed in the formal sector
(mostly skilled and semi-skilled) and 47.3 million people got employment in the informal
sector (mostly semi-skilled and unskilled).
Before concluding the literature review, it would be pertinent to address the issue of reasons
for incremental population in Bangladesh, as well as indicate the type and nature of necessary
interventions to ameliorate those reasons. Again, while the broad reasons for incremental
population in Bangladesh is more or less known, the relative share of each reason attributable
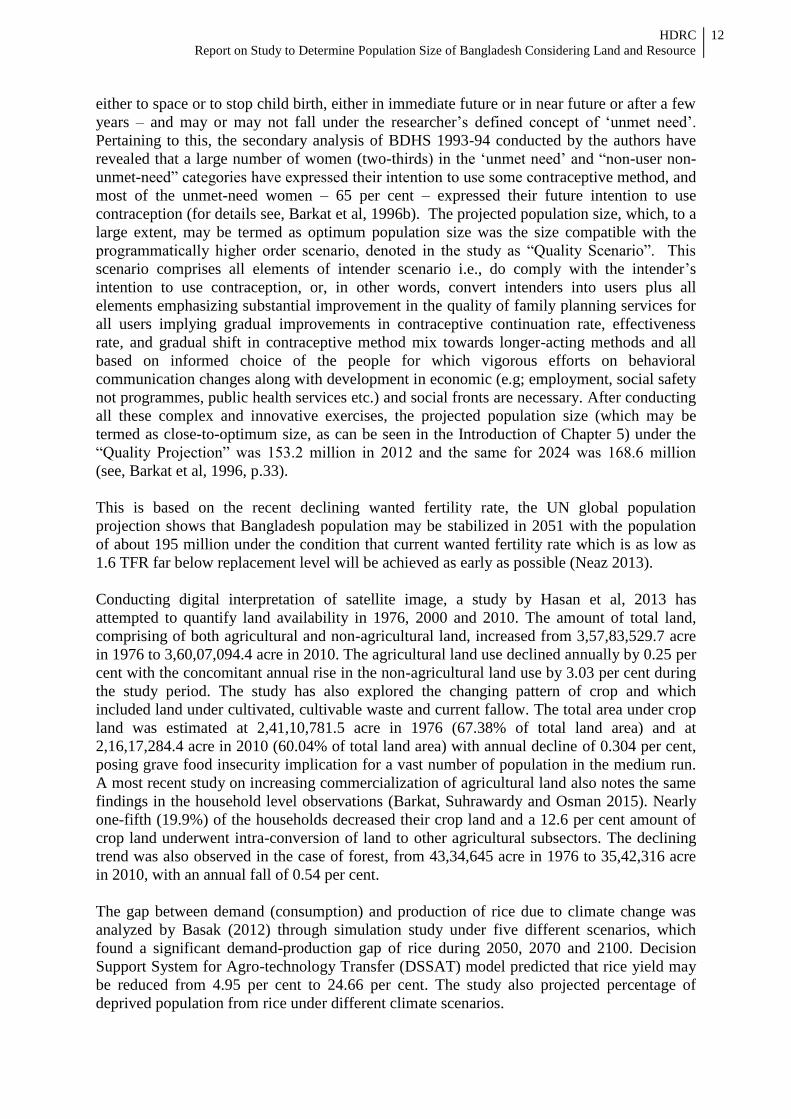
to the increment is debatable (there is no consensus on this). As early as in 2001, Barkat
argued, that assuming that the Bangladesh population of 130 million in the year 2000 is
projected to reach 210 million in 20205, the broad key reasons attributable to the 80 million
increment of population in 20 years’ time (between 2000 and 2020) will be threefold, namely,
(1) the population momentum effect, (2) the unwanted /unintended fertility, and (3) the high
desired family size (see, Barkat 2001, p. unnumbered). According to this estimate, out of the
80 million incremental population – a 50 per cent (i.e; 40 million) will be attributable to the
population momentum effect, 35 per cent (i.e; 28 out of 80 million) will be attributable to the
unwanted/unintended fertility, and the rest, 15 per cent (i.e; 12 out of 80 million) will be
attributable to the high desired family size (see, Figure 2.1).
Figure 2.1: Bangladesh population in 2020 – How much will be the increment, why
(reason), what can be done?
In explaining the essence of each of the broad reasons and programmes to be undertaken to
address each reason, and thereby reduce the incremental population, Barkat argued the
following:
First, The most important attributable reason – the population momentum effect is the issue
with those who are already born. The fact is that, due to the young age structure of the
population, the population size of Bangladesh is expected to increase for some time
5 Which may not be the case in real life situation is terms of projected population size in 2020, however, the key point here
is not the projected absolute size of the population – the point is reasons attributable to the increment, the share of each
broad reason in the total increment, and things to do to address the reasons.
Reasons for increment Programme intervention needs
(family planning plus development)
Reproductive health (RH)/ family planning (FP),
general health, female education, female
employment, women empowerment
RH/FP, general health, education, women
empowerment
RH/FP, general health, education, economic,
women empowerment, legal rights (inheritance,
ownership etc.)
210
130
in m
illi
on
2000 2020
12
28
40 Population
momentum (50%)
Unwanted/unintended
fertility (35%)
High desired
family size (15%)
Source: Barkat 2001, p. unnumbered
HDRC
Report on Study to Determine Population Size of Bangladesh Considering Land and Resource
14
even after attainment of replacement level fertility. Thus, even after attaining the
replacement level fertility, the number of women entering the reproductive age
continuum (15-49 years) will be higher than the number of women leaving that
continuum. About half of the total female population comprises those who are not
married and who are in the age group of 0-19 years. The size of the female population
of this age group is at least 30 million, and they would be entering the marriage cohort
during the next 20 years. Assuming that those women who are 48 years old in this
year will be out of the reproductive age continuum by end of this year, the number
entering the reproductive age continuum in the next year, would be about 1 million and
the number leaving the reproductive age continuum in the same year would be 0.3
million. Thus, the total number of married women in reproductive ages (MWRAs) in
next year would be about 0.7 million higher than those in this year. The main
question, therefore, is what should be done in order to be able to minimize the annual
net entry of this additional 0.7 million women into the net of MWRAs? In order to
minimize this "momentum effect", as indicated in Figure 2.1, it would be necessary to
implement, among other things, the following: strictly enforce the legal age at marriage
for females; further raise the female age at marriage; meet the unmet need for
reproductive health; ensure high quality RH services as well as expand the demand for
those services; vigorously implement the female secondary stipend programme;
introduce female stipend for higher education; further strengthen the complementary
and supplementary role of the NGOs and the private sector; and involve elected
representatives and community leaders in activities directed toward acceleration of the
process of population stabilization through ensuring high quality life.
Second, The reduction of unwanted/unintended fertility has various dimensions which
include all the components of reproductive health and socio-cultural norms, values,
traditions, as well as economic reasons. In the family planning sphere, the demand for
fertility regulation and unmet need for contraception and services have several
implications. Assuming that there are about 30 million MWRAs (excluding those in
fecund and menopausal), the existing demand for fertility regulation amounts to 23
million (17 million users plus 6 million unmet need). This absolute number of unmet
need (6 million) population in Bangladesh is almost equal to the total number of
married women in the reproductive ages in each of the countries such as Australia,
Peru, Kenya, Venezuela, Malaysia. About 90 per cent (i.e., 5.5 million out of 6
million) of those with unmet need live in the rural areas. The unmet need is relatively
high among young couples and in the low performing areas. Thus, considering the
absolute increasing size, innovative and multi dimensional program efforts are needed
(See, Figure 2.1).
Third, Although apparently the relative weight of high desired family size in incremental
population is low, in reality this may not be the case. The impact-factor may be much
higher than the estimated appearance. This is important to know that the population
stabilization cannot be brought about by family planning and health efforts alone. In
this regard, investments in human capital, especially those efforts which accelerate the
process of women's empowerment as well as the process of mortality decline,
especially among infant and child, are quite effective. It should be noted here that the
desired family size in Bangladesh is much less than the actual size. This desired
family size is one of the lowest in the developing world. This gap between the desired
and actual family size indicates that every third birth is an unplanned one. On the
other hand, the low desired family size reflects the rising aspiration for small family
size by the poor women. The fact is that about 50 million poor women are employed
HDRC
Report on Study to Determine Population Size of Bangladesh Considering Land and Resource
15
in textile and readymade garment industries, organized under microcredit, and small
income generation activities; mobility has increased, aspiration for better quality of life
is showing up, which cannot be achieved through unplanned birth and unintended
pregnancies. Also, research findings in Bangladesh clearly show that educated women
have different reproductive behavior than those not educated: educated women have
better employment opportunities; educated women have lower fertility; educated
women have more modern outlook; etc. (see, Barkat 2001, p. unnumbered) Literacy,
access to credit and productive resources, and employment are the major interventions
through which women's empowerment can be brought about.
Finally, the above analysis of reasons for incremental population and need to address the
reasons through various programmatic and non-programmatic interventions, it is
pertinent in connection with determination of optimum population size to raise and
remind the following: This is true that remarkable successes have been achieved in the
population program without significant changes in the economic life of the millions of
people. But we are confronted with the question that, can this apparent momentum be
sustained? One can argue that the `easy' population targets have already been reached
and that reducing family sizes still further will be much more difficult. This question
can be raised very justifiably because of the following reasons: infant, child and under-
5 mortality levels are still high and parents can still expect similar number of children
to die; to poor parents children bring practical benefits-especially in terms of security
(old age support, protection against disaster or destitution); parents may want children
because of the income they add to the poor families; parents possess son preference
(parents without sons are less likely to practice family planning); confined role of
women (purdah); social and cultural obstacles to reproductive health including family
planning in some areas.
Bangladesh's demographic future is still fraught with difficulties: in the next 30 years the
country will have to cope with an inevitable doubling of population. The cumulative effect of
all those factors mentioned above can be summarized as below: the population pressure has
already created additional demands on the already scarce land, water, and other non-
renewable resources, thereby making it increasingly difficult to support the increasing
number of human beings; the declining land-man ratio as well as the limited absorptive
capacity of agriculture and lack of agrarian reform (e.g. distribution of khas land to the poor)
have pushed a vast number of people from the rural to the urban areas and that without any
concomitant industrialization and creation of urban amenities and facilities, most of the
migrants end-up in low productivity, informal sector jobs, and live in deplorable conditions in
slums and shanty towns. All the above stated analysis alongwith complex dynamics of
development warrants proactive thinking about the determination of a population size of
Bangladesh considering land and other resources, i.e; the optimum population for
Bangladesh.
The review of literature related to the relevant data and information needed for population
projection and especially for the projection of optimum population size or the projection of
population size of Bangladesh considering land and other resources permits to conclude that
there exists a clear dearth of such data and information in Bangladesh. However, it is also
true that Bangladesh, as compared to many other countries with similar level of economic
development (measured in terms of per capita GDP, per capita GNI or human development
index) is better positioned in terms of population related data necessary for population
projection using cohort-component approach.
HDRC
Report on Study to Determine Population Size of Bangladesh Considering Land and Resource
16
CHAPTER 3
METHODOLOGY AND ANALYTICAL MODEL
3.1 Introduction
Concept of optimum population is situation-specific, need-specific, and policy-specific. It
should be taken care in determining optimum population size, so that it is based on some
criteria such as its acceptability, unambiguity and calculations ease. We need to address
whether we shall be better-off or worse-off as our population increases by specified amount.
Considering this setting, the present study aims to develop empirical model for estimating
optimum population, based on secondary data analysis.
The study has involved a combination of “Ex-post Facto Research” and “Analytic Research”.
Exploratory Research has also been a part of the Research Design. Principally Quantitative
approach has been adopted. However, some qualitative approaches like Experts’ opinions are
also used for the study purpose. Separate discussions and combined brain storming sessions
have been arranged with relevant experts.
Reviewing secondary literature in line with the study objectives has been an important task.
This has enabled the research team to understand critical appraisals for the study. The study
team has reviewed literatures from pertinent journals, reports, working papers, books, web
resources etc.
3.2 Resource Base Analysis
This study has analyzed variables relevant to various categories of land availability, land use
due to different social, economic, and socioeconomic purposes and available resources in
Bangladesh. For such purpose, pertinent data have been collected from secondary sources and
analyzed. Time series data over twenty-one years (1990-2010) have been used in this respect.
Available resources in Bangladesh have been filtered, considering their importance,
necessity, accessibility, and affordability since the list of available resources is not an
exhaustive one. Natural and human resources have been considered separately. Selection of
resources has been done through an expert opinion pool where knowledgeable persons have
ranked Bangladesh’s resources according to significance, requirement, ease of access, and
affordability. Such rank analysis has enabled us to select resources to be considered for this
study and collect necessary secondary data.
3.3 Technical Approach of the First Model: Model Interlinking Demographic Model,
Production Model and Welfare Index
As there is no universal definition of optimum population and it depends on the purpose, we
have attempted to obtain some estimates for optimum population using some welfare indices
as defined below. At first we present the basic models we need to encounter.
Demographic Model
Demographic model included population projection based on past population growth rate.
According to population growth rate of census 2011, population has been projected for 2011-
2020 and named as projected population.
HDRC
Report on Study to Determine Population Size of Bangladesh Considering Land and Resource
17
Production Model
GNI= f (cultivated land, total national investment, and total employed population)
For estimating such production function, log-linear model (following Cobb-Douglas model)
has been used. Now, in order to obtain projected figures, we fed the projected values of the
independent variables for predetermined periods. Such period was 20 years to avoid
deviations over time.
The parsimonious log-linear model was then used to estimate projected GNI for each year
(2011-20). This process included projection of each independent variable for each year
(2011-20) using estimated growth rate for past 20 years of each independent variable. The
projected values of independent variables (2011-20) were then fed to the log-linear model to
estimate projected GNI for each year (2011-20).
Welfare Index (WI)
WI= f (Goods and services, Govt. expenditures etc.)
A simplistic approach has been adopted to define welfare index where basic needs for
survival of people have been considered. Welfare index included five variables relevant to
people’s welfare, namely; GNI, Government expenditure on health, Government expenditure
on education, household consumption expenditure on food, and total consumption
expenditure of households. The following six steps has been followed in estimating projected
population using welfare index:
Step 1: Growth rate of all selected indicators for welfare index was estimated.
Step 2: Estimated growth rate was then used to estimate the projected values of all selected
indicators for welfare index.
Step 3: Projected values of all selected indicators for welfare index was divided by
projected population to find per capita projected estimates.
Step 4: Desired estimates of all selected indicators for welfare index was done applying
government intended GNI growth rate as per Perspective plan of Bangladesh 2010-
2021.
Step 5: Desired values of all selected indicators for welfare index was divided by projected
population to find per capita desired estimates.
Step 6: Optimum population was estimated dividing projected values of indicators by per
capita desired estimates.
3.4 Technical Approach of the Second Model: Model of Optimum Population for
Sustainable Development
The following three-step method has been followed in developing the second model for
estimating optimum population size.
HDRC
Report on Study to Determine Population Size of Bangladesh Considering Land and Resource
18
Step 1: Defining Optimum Population
Optimum population has been defined as the population that achieves a given aim in the most
satisfactory way. Optimum population may be different according to the aim that one seeks to
achieve in considering ‘the most satisfactory way’.
Step 2: Selecting Appropriate Variables
The study has used population as the dependent variable, and the states of the natural and
human resources as the independent variables. Optimum population is considered as a
function of available resources, in line with the stipulated objectives, and defined as follows:
Optimum Population= f (D&H Resources, Economic Resources, L&A Resources)
Where, D&H= Demography and Human, L&A= Land and Agriculture
A ten-year time series data set (from 2001 to 2010), including population, has been used. The
impact of each variable on the determination of optimum population size will be different,
which can be defined as ‘relative importance’ of each variable. The relative importance has
been considered when the optimum population size is estimated. Such relative importance
has been taken into account in developing a model for estimating optimum population size.
Regression analysis and factor analysis have been used to derive the relative importance of a
variable.
One hundred and eighteen variables including population were available from the statistical
yearbooks of various issues. Few of such variables were dropped in consultation with the
experts. The remaining variables were examined to find out their relative importance. The
variables, whose correlation coefficients with population are higher than 0.85 at a significant
level of 0.001, have been identified. Though the land resource variables have not fulfilled the
mentioned criteria, we have considered those for the objective constraint.
Step 3: Analytic Technique
A multiple linear regression analysis, which is able to estimate B coefficient as the relative
importance of each variable, has been applied for estimating optimum population size.
3.5 Variables: Selection, Categorization, and Data Sources
From the literature survey (Chapter 2) we have come to know that numbers of factors affect
change in population over time. Considering the diversity of factors primarily we have
selected 118 variables (Annexed). From that comprehensive list we have shortlisted variables
(Table 3.1) on the basis of resource implications. However, we have sub grouped those
variables into three resource categories like demography and human resources, economic
resources, and land and agricultural resources. We have considered 10 years’ observations for
our model estimation, consisting of 8 explanatory variables which have been selected from
this list according to their statistical significance.
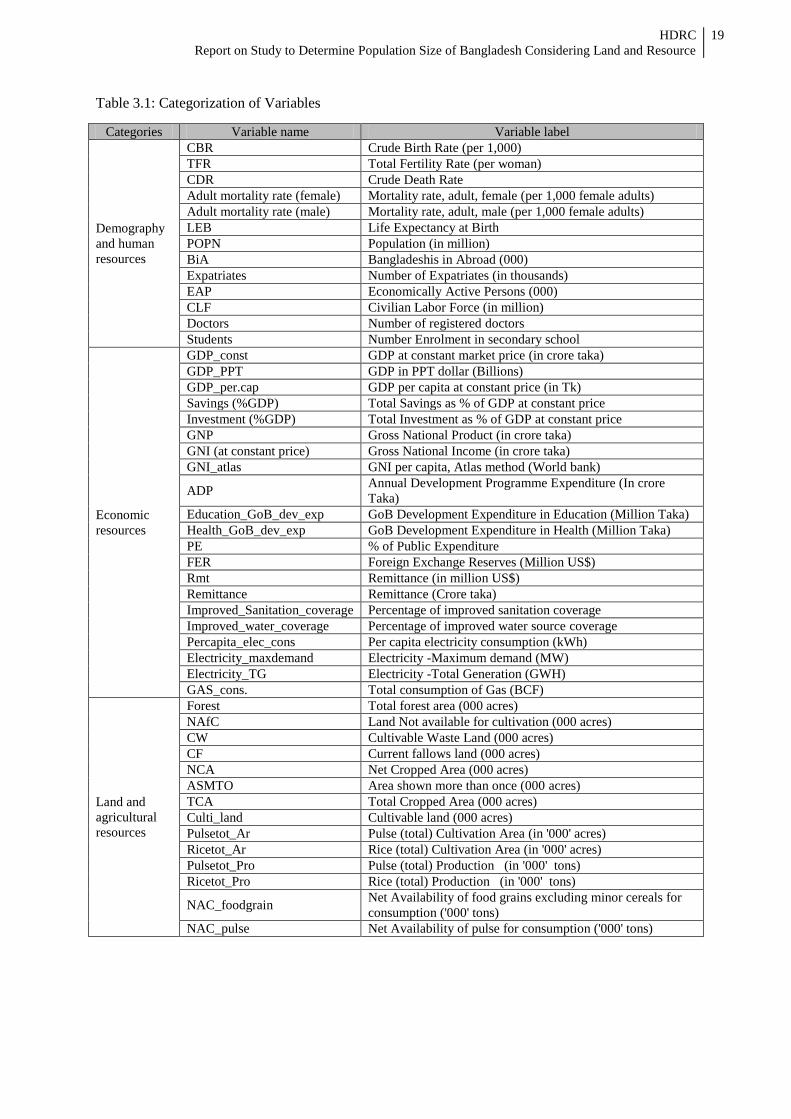
HDRC
Report on Study to Determine Population Size of Bangladesh Considering Land and Resource
19
Table 3.1: Categorization of Variables
Categories Variable name Variable label
Demography
and human
resources
CBR Crude Birth Rate (per 1,000)
TFR Total Fertility Rate (per woman)
CDR Crude Death Rate
Adult mortality rate (female) Mortality rate, adult, female (per 1,000 female adults)
Adult mortality rate (male) Mortality rate, adult, male (per 1,000 female adults)
LEB Life Expectancy at Birth
POPN Population (in million)
BiA Bangladeshis in Abroad (000)
Expatriates Number of Expatriates (in thousands)
EAP Economically Active Persons (000)
CLF Civilian Labor Force (in million)
Doctors Number of registered doctors
Students Number Enrolment in secondary school
Economic
resources
GDP_const GDP at constant market price (in crore taka)
GDP_PPT GDP in PPT dollar (Billions)
GDP_per.cap GDP per capita at constant price (in Tk)
Savings (%GDP) Total Savings as % of GDP at constant price
Investment (%GDP) Total Investment as % of GDP at constant price
GNP Gross National Product (in crore taka)
GNI (at constant price) Gross National Income (in crore taka)
GNI_atlas GNI per capita, Atlas method (World bank)
ADP Annual Development Programme Expenditure (In crore
Taka)
Education_GoB_dev_exp GoB Development Expenditure in Education (Million Taka)
Health_GoB_dev_exp GoB Development Expenditure in Health (Million Taka)
PE % of Public Expenditure
FER Foreign Exchange Reserves (Million US$)
Rmt Remittance (in million US$)
Remittance Remittance (Crore taka)
Improved_Sanitation_coverage Percentage of improved sanitation coverage
Improved_water_coverage Percentage of improved water source coverage
Percapita_elec_cons Per capita electricity consumption (kWh)
Electricity_maxdemand Electricity -Maximum demand (MW)
Electricity_TG Electricity -Total Generation (GWH)
GAS_cons. Total consumption of Gas (BCF)
Land and
agricultural
resources
Forest Total forest area (000 acres)
NAfC Land Not available for cultivation (000 acres)
CW Cultivable Waste Land (000 acres)
CF Current fallows land (000 acres)
NCA Net Cropped Area (000 acres)
ASMTO Area shown more than once (000 acres)
TCA Total Cropped Area (000 acres)
Culti_land Cultivable land (000 acres)
Pulsetot_Ar Pulse (total) Cultivation Area (in '000' acres)
Ricetot_Ar Rice (total) Cultivation Area (in '000' acres)
Pulsetot_Pro Pulse (total) Production (in '000' tons)
Ricetot_Pro Rice (total) Production (in '000' tons)
NAC_foodgrain Net Availability of food grains excluding minor cereals for
consumption ('000' tons)
NAC_pulse Net Availability of pulse for consumption ('000' tons)
HDRC
Report on Study to Determine Population Size of Bangladesh Considering Land and Resource
20
Data Sources
For the primary variable list, consisting of over hundred variables, various hard and soft
sources have been explored, among which the following are the prime ones:
1. Bangladesh Bureau of Statistics (BBS), Statistics and Informatics Division, Ministry
of Planning, Government of People’s Republic of Bangladesh, Dhaka, Bangladesh,
Statistical Year Book of Bangladesh (various issues)
2. Economic Adviser’s Wing, Finance Division, Ministry of Finance, Government of People’s Republic of Bangladesh, Dhaka, Bangladesh, Bangladesh Economic Review
(various issues)
3. Bangladesh Bureau of Statistics (BBS), Statistics and Informatics Division, Ministry
of Planning, Government of People’s Republic of Bangladesh, Dhaka, Bangladesh,
Household Income and Expenditure Survey (various issues)
4. Bangladesh Bank, Economic data: retrieved from http://www.bangladesh-
bank.org/econdata/index.php on 2 June 2014
5. World Bank, Country, Bangladesh, Data: retrieved from:
http://data.worldbank.org/country/bangladesh on 15 June 2014
6. Index Mundi, Factbook, Bangladesh: retrieved from
http://www.indexmundi.com/bangladesh/ on June 2014
7. BANBEIS, Data: retrieved from http://banbeis.gov.bd/data/index.php on 20 June
2014

HDRC
Report on Study to Determine Population Size of Bangladesh Considering Land and Resource
21
CHAPTER 4
ANALYSIS OF RESOURCE BASE
4.1 Introduction
Resources of a country comprise human resources, natural resources, capital, and technology
and entrepreneurship (Samuelson and Nordhaus 2009). Population at present and in future
both are dependent on the simultaneous interactions of the mentioned resources. This section
explores changing pattern of particular resources, from 1990 to 2010, which pose
considerable implications for optimum population.
4.2 Changing Pattern of Total Land Area, Cultivable Land and Forest Area
Total land area of Bangladesh is 56,977 sq miles (147,570 km²). This entire land area can be
divided into two broad groups - cultivable and non-cultivable. Cultivable land is the
summation of cultivable waste, total cropped area, and current fallows. Cultivable waste is
the area suitable for cultivation but lying fallow for more than one year. Current fallow is the
area already brought under cultivation, but not cultivated during the year.
Table 4.1: Changing pattern of cultivable land and forest area, 1991-2010
Year Total cultivable land
(000’ acres)
% Change
(Year by year)
Total forest area
(000’ acres)
% Change
(Year by year)
1990 38,501 - 4,693 -
1991 36,515 -5.16 4,674 -0.40
1992 36,296 -0.60 4,674 0.00
1993 35,865 -1.19 4,674 0.00
1994 35,960 0.26 4,861 4.00
1995 35,674 -0.80 5,317 9.38
1996 36,347 1.89 5,329 0.23
1997 36,949 1.66 5,572 4.56
1998 36,708 -0.65 5,572 0.00
1999 36,910 0.55 6,490 16.48
2000 37,116 0.56 6,490 0.00
2001 36,880 -0.64 6,365 -1.93
2002 36,847 -0.09 6,418 0.83
2003 36,822 -0.07 6,418 0.00
2004 36,665 -0.43 6,420 0.03
2005 36,102 -1.54 6,420 0.00
2006 36,070 -0.09 6,420 0.00
2007 36,474 1.12 6,420 0.00
2008 37,357 2.42 6,420 0.00
2009 37,589 0.62 5,754 -10.37
2010 38,621 2.75 6,368 10.67 Source: Various issues of Statistical Year Book of Bangladesh
Total cultivable land of the country has not remained fixed, though not very unusual, during
the time span of twenty one years, from 1990 to 2010 (Table 4.1). The highest cultivable land
was available in 2010 (3,86,21,000 acres) and the lowest in 1995 ( 3,56,74,000 acres). Year
to year change shows highest decline in 1991 (5.16%) and highest rise in 2010 (2.75%).
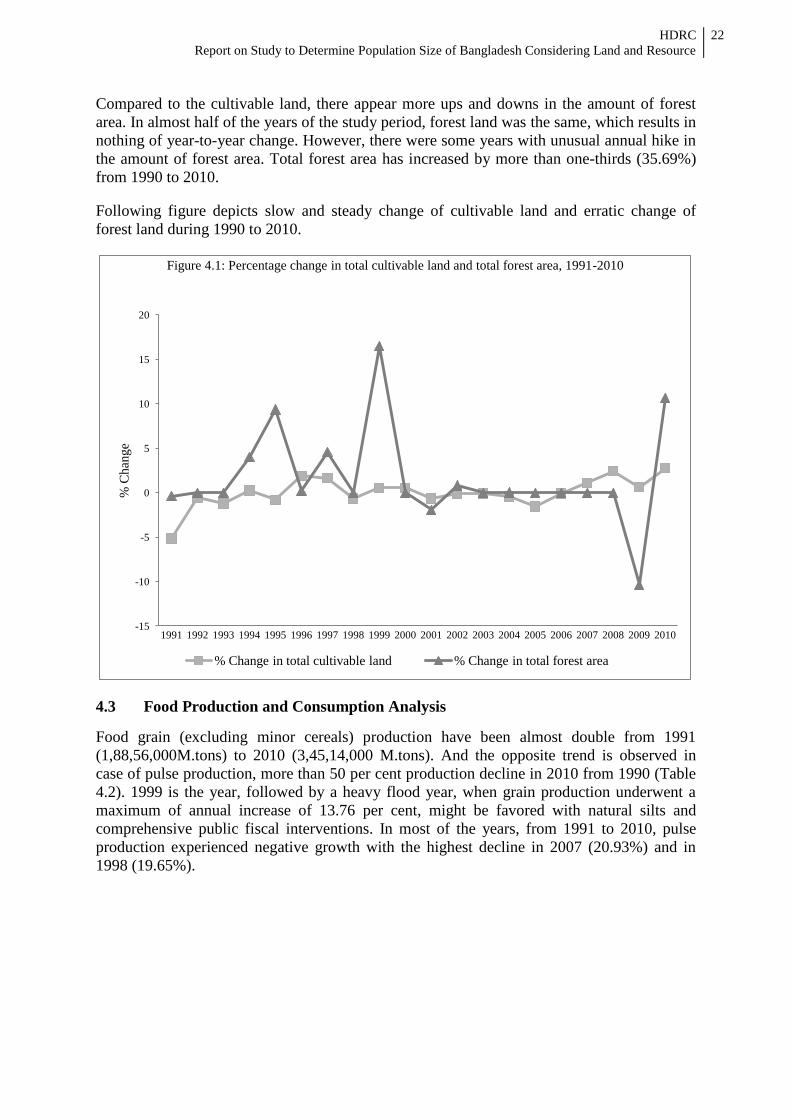
HDRC
Report on Study to Determine Population Size of Bangladesh Considering Land and Resource
22
Compared to the cultivable land, there appear more ups and downs in the amount of forest
area. In almost half of the years of the study period, forest land was the same, which results in
nothing of year-to-year change. However, there were some years with unusual annual hike in
the amount of forest area. Total forest area has increased by more than one-thirds (35.69%)
from 1990 to 2010.
Following figure depicts slow and steady change of cultivable land and erratic change of
forest land during 1990 to 2010.
4.3 Food Production and Consumption Analysis
Food grain (excluding minor cereals) production have been almost double from 1991
(1,88,56,000M.tons) to 2010 (3,45,14,000 M.tons). And the opposite trend is observed in
case of pulse production, more than 50 per cent production decline in 2010 from 1990 (Table
4.2). 1999 is the year, followed by a heavy flood year, when grain production underwent a
maximum of annual increase of 13.76 per cent, might be favored with natural silts and
comprehensive public fiscal interventions. In most of the years, from 1991 to 2010, pulse
production experienced negative growth with the highest decline in 2007 (20.93%) and in
1998 (19.65%).
-15
-10
-5
0
5
10
15
20
1991 1992 1993 1994 1995 1996 1997 1998 1999 2000 2001 2002 2003 2004 2005 2006 2007 2008 2009 2010
% C
han
ge
Figure 4.1: Percentage change in total cultivable land and total forest area, 1991-2010
% Change in total cultivable land % Change in total forest area
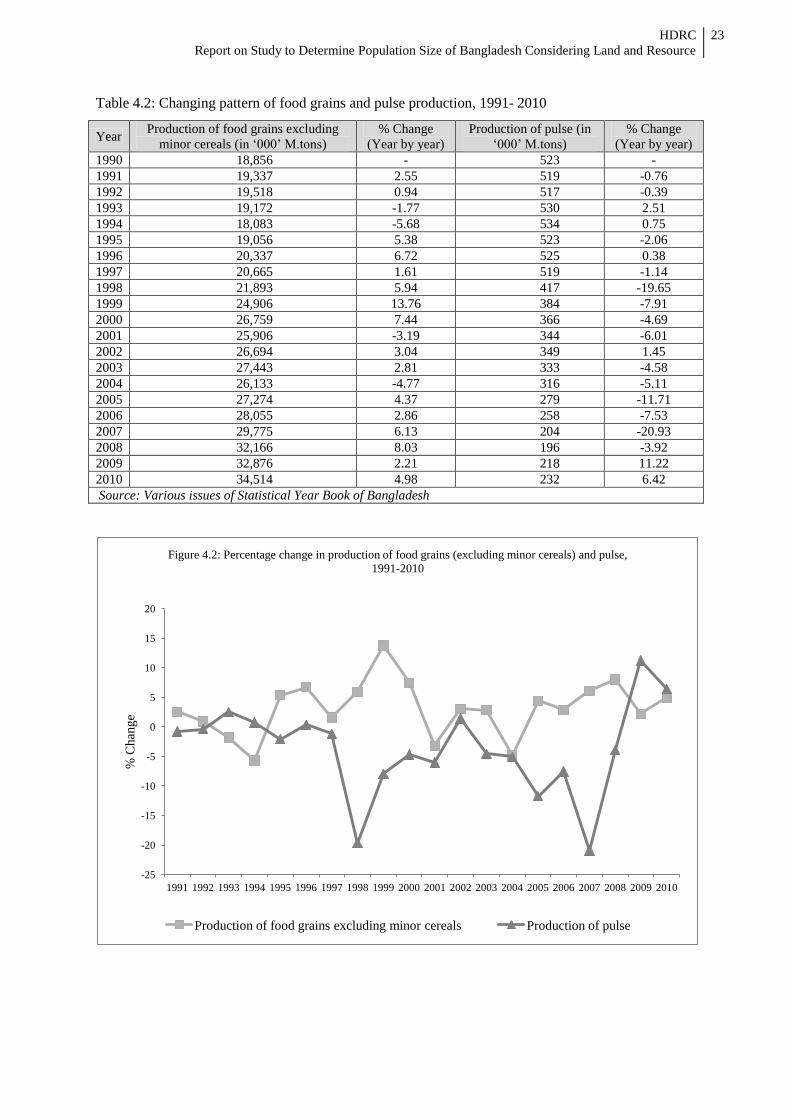
HDRC
Report on Study to Determine Population Size of Bangladesh Considering Land and Resource
23
Table 4.2: Changing pattern of food grains and pulse production, 1991- 2010
Year Production of food grains excluding
minor cereals (in ‘000’ M.tons)
% Change
(Year by year)
Production of pulse (in
‘000’ M.tons)
% Change
(Year by year)
1990 18,856 - 523 -
1991 19,337 2.55 519 -0.76
1992 19,518 0.94 517 -0.39
1993 19,172 -1.77 530 2.51
1994 18,083 -5.68 534 0.75
1995 19,056 5.38 523 -2.06
1996 20,337 6.72 525 0.38
1997 20,665 1.61 519 -1.14
1998 21,893 5.94 417 -19.65
1999 24,906 13.76 384 -7.91
2000 26,759 7.44 366 -4.69
2001 25,906 -3.19 344 -6.01
2002 26,694 3.04 349 1.45
2003 27,443 2.81 333 -4.58
2004 26,133 -4.77 316 -5.11
2005 27,274 4.37 279 -11.71
2006 28,055 2.86 258 -7.53
2007 29,775 6.13 204 -20.93
2008 32,166 8.03 196 -3.92
2009 32,876 2.21 218 11.22
2010 34,514 4.98 232 6.42
Source: Various issues of Statistical Year Book of Bangladesh
-25
-20
-15
-10
-5
0
5
10
15
20
1991 1992 1993 1994 1995 1996 1997 1998 1999 2000 2001 2002 2003 2004 2005 2006 2007 2008 2009 2010
% C
han
ge
Figure 4.2: Percentage change in production of food grains (excluding minor cereals) and pulse,
1991-2010
Production of food grains excluding minor cereals Production of pulse
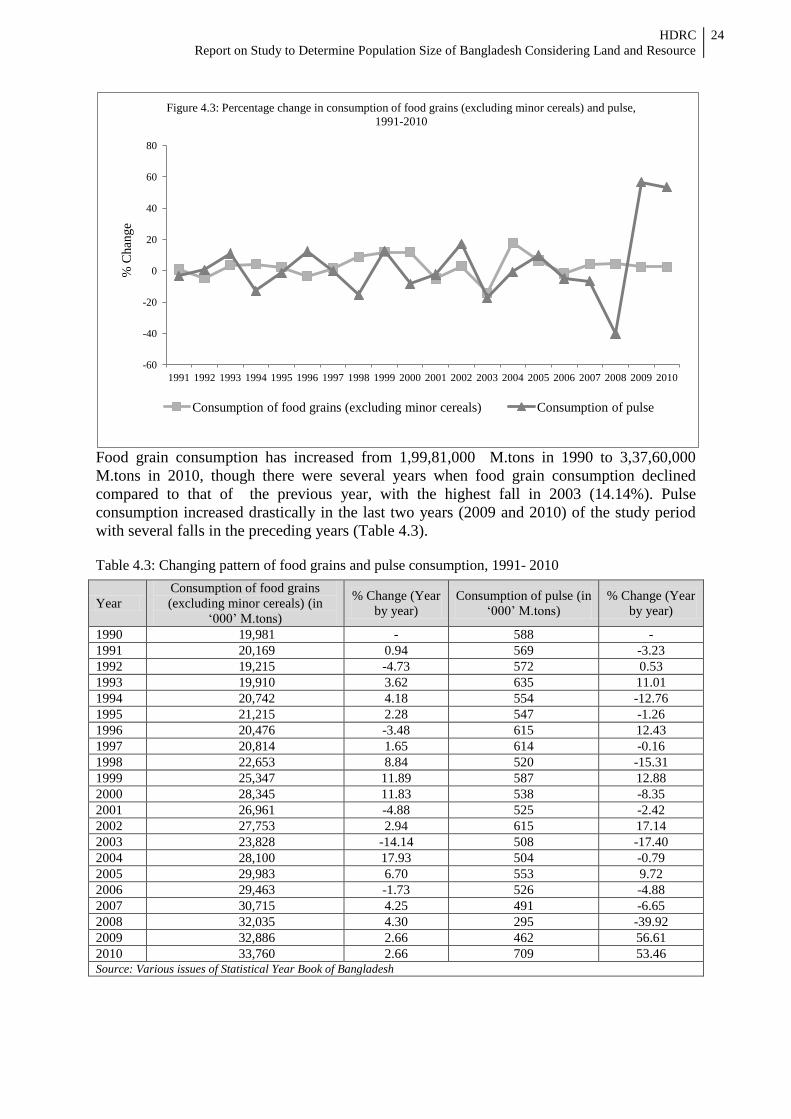
HDRC
Report on Study to Determine Population Size of Bangladesh Considering Land and Resource
24
Food grain consumption has increased from 1,99,81,000 M.tons in 1990 to 3,37,60,000
M.tons in 2010, though there were several years when food grain consumption declined
compared to that of the previous year, with the highest fall in 2003 (14.14%). Pulse
consumption increased drastically in the last two years (2009 and 2010) of the study period
with several falls in the preceding years (Table 4.3).
Table 4.3: Changing pattern of food grains and pulse consumption, 1991- 2010
Year
Consumption of food grains
(excluding minor cereals) (in
‘000’ M.tons)
% Change (Year
by year)
Consumption of pulse (in
‘000’ M.tons)
% Change (Year
by year)
1990 19,981 - 588 -
1991 20,169 0.94 569 -3.23
1992 19,215 -4.73 572 0.53
1993 19,910 3.62 635 11.01
1994 20,742 4.18 554 -12.76
1995 21,215 2.28 547 -1.26
1996 20,476 -3.48 615 12.43
1997 20,814 1.65 614 -0.16
1998 22,653 8.84 520 -15.31
1999 25,347 11.89 587 12.88
2000 28,345 11.83 538 -8.35
2001 26,961 -4.88 525 -2.42
2002 27,753 2.94 615 17.14
2003 23,828 -14.14 508 -17.40
2004 28,100 17.93 504 -0.79
2005 29,983 6.70 553 9.72
2006 29,463 -1.73 526 -4.88
2007 30,715 4.25 491 -6.65
2008 32,035 4.30 295 -39.92
2009 32,886 2.66 462 56.61
2010 33,760 2.66 709 53.46 Source: Various issues of Statistical Year Book of Bangladesh
-60
-40
-20
0
20
40
60
80
1991 1992 1993 1994 1995 1996 1997 1998 1999 2000 2001 2002 2003 2004 2005 2006 2007 2008 2009 2010
% C
han
ge
Figure 4.3: Percentage change in consumption of food grains (excluding minor cereals) and pulse,
1991-2010
Consumption of food grains (excluding minor cereals) Consumption of pulse
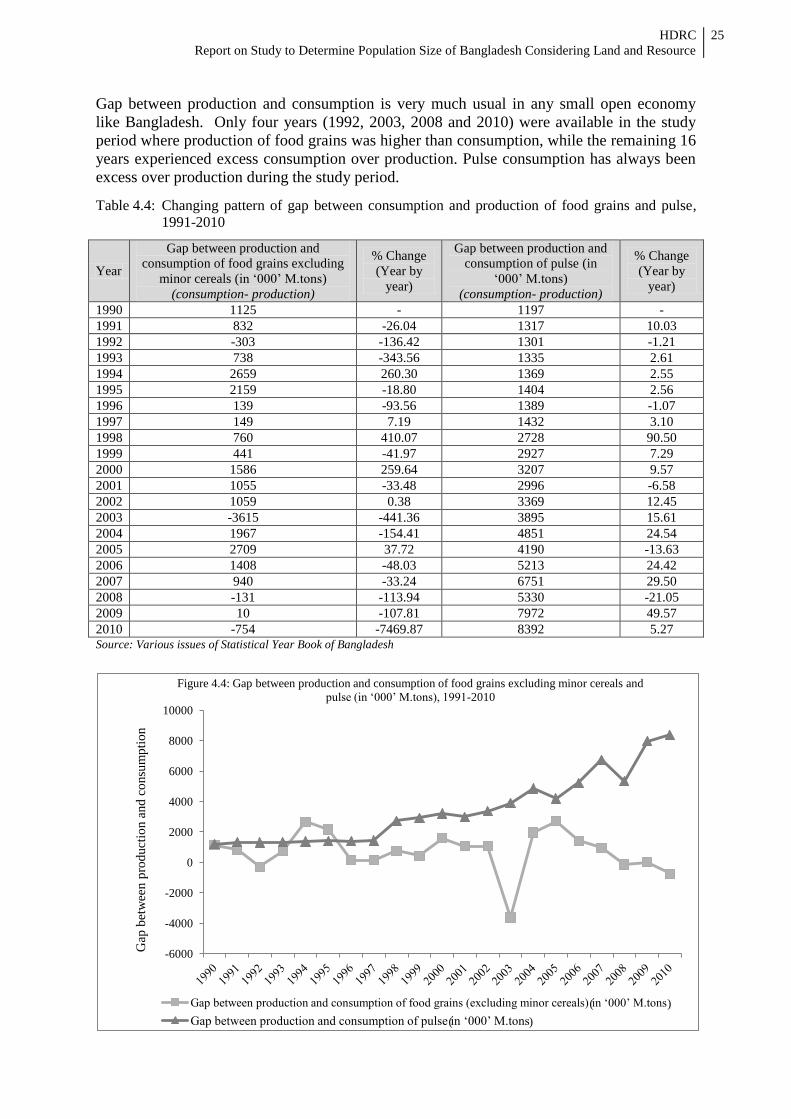
HDRC
Report on Study to Determine Population Size of Bangladesh Considering Land and Resource
25
Gap between production and consumption is very much usual in any small open economy
like Bangladesh. Only four years (1992, 2003, 2008 and 2010) were available in the study
period where production of food grains was higher than consumption, while the remaining 16
years experienced excess consumption over production. Pulse consumption has always been
excess over production during the study period.
Table 4.4: Changing pattern of gap between consumption and production of food grains and pulse,
1991-2010
Year
Gap between production and
consumption of food grains excluding
minor cereals (in ‘000’ M.tons)
(consumption- production)
% Change
(Year by
year)
Gap between production and
consumption of pulse (in
‘000’ M.tons)
(consumption- production)
% Change
(Year by
year)
1990 1125 - 1197 -
1991 832 -26.04 1317 10.03
1992 -303 -136.42 1301 -1.21
1993 738 -343.56 1335 2.61
1994 2659 260.30 1369 2.55
1995 2159 -18.80 1404 2.56
1996 139 -93.56 1389 -1.07
1997 149 7.19 1432 3.10
1998 760 410.07 2728 90.50
1999 441 -41.97 2927 7.29
2000 1586 259.64 3207 9.57
2001 1055 -33.48 2996 -6.58
2002 1059 0.38 3369 12.45
2003 -3615 -441.36 3895 15.61
2004 1967 -154.41 4851 24.54
2005 2709 37.72 4190 -13.63
2006 1408 -48.03 5213 24.42
2007 940 -33.24 6751 29.50
2008 -131 -113.94 5330 -21.05
2009 10 -107.81 7972 49.57
2010 -754 -7469.87 8392 5.27 Source: Various issues of Statistical Year Book of Bangladesh
-6000
-4000
-2000
0
2000
4000
6000
8000
10000
Gap
bet
wee
n p
rod
uct
ion a
nd
co
nsu
mp
tio
n
Figure 4.4: Gap between production and consumption of food grains excluding minor cereals and
pulse (in ‘000’ M.tons), 1991-2010
Gap between production and consumption of food grains (excluding minor cereals) in ‘000’ M.tons
Gap between production and consumption of pulse in ‘000’ M.tons
( )
) (
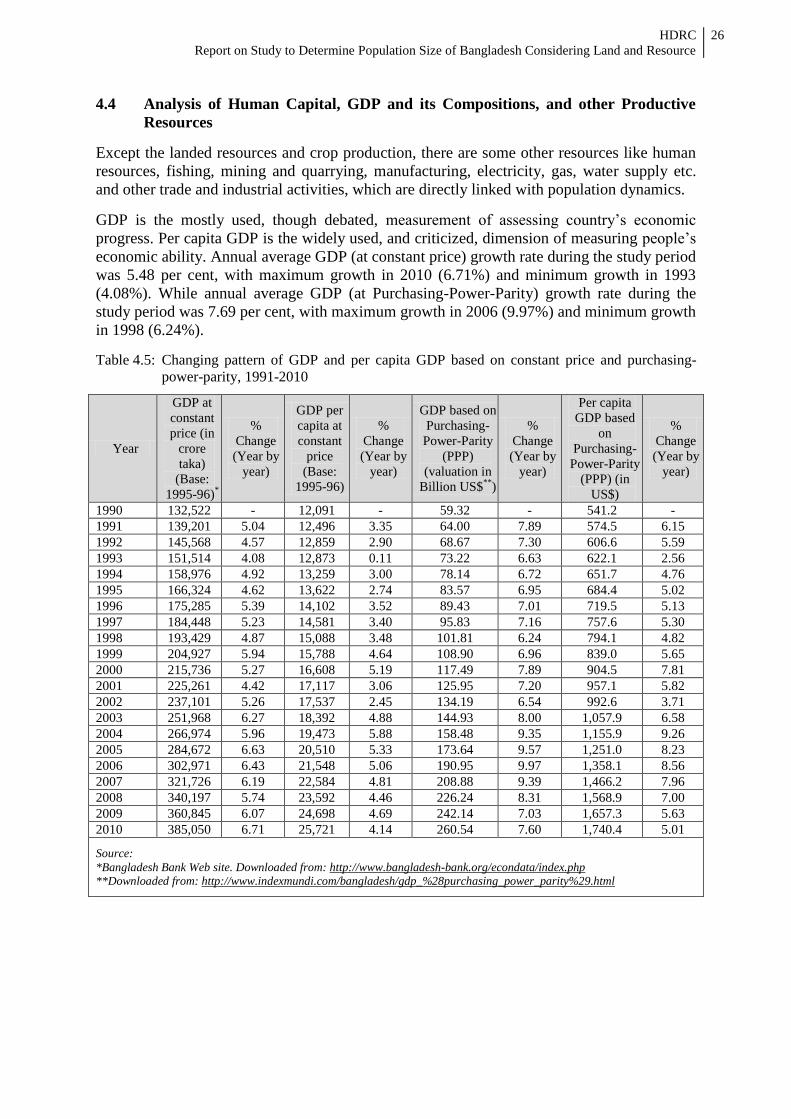
HDRC
Report on Study to Determine Population Size of Bangladesh Considering Land and Resource
26
4.4 Analysis of Human Capital, GDP and its Compositions, and other Productive
Resources
Except the landed resources and crop production, there are some other resources like human
resources, fishing, mining and quarrying, manufacturing, electricity, gas, water supply etc.
and other trade and industrial activities, which are directly linked with population dynamics.
GDP is the mostly used, though debated, measurement of assessing country’s economic
progress. Per capita GDP is the widely used, and criticized, dimension of measuring people’s
economic ability. Annual average GDP (at constant price) growth rate during the study period
was 5.48 per cent, with maximum growth in 2010 (6.71%) and minimum growth in 1993
(4.08%). While annual average GDP (at Purchasing-Power-Parity) growth rate during the
study period was 7.69 per cent, with maximum growth in 2006 (9.97%) and minimum growth
in 1998 (6.24%).
Table 4.5: Changing pattern of GDP and per capita GDP based on constant price and purchasing-
power-parity, 1991-2010
Year
GDP at
constant
price (in
crore
taka)
(Base:
1995-96)*
%
Change
(Year by
year)
GDP per
capita at
constant
price
(Base:
1995-96)
%
Change
(Year by
year)
GDP based on
Purchasing-
Power-Parity
(PPP)
(valuation in
Billion US$**
)
%
Change
(Year by
year)
Per capita
GDP based
on
Purchasing-
Power-Parity
(PPP) (in
US$)
%
Change
(Year by
year)
1990 132,522 - 12,091 - 59.32 - 541.2 -
1991 139,201 5.04 12,496 3.35 64.00 7.89 574.5 6.15
1992 145,568 4.57 12,859 2.90 68.67 7.30 606.6 5.59
1993 151,514 4.08 12,873 0.11 73.22 6.63 622.1 2.56
1994 158,976 4.92 13,259 3.00 78.14 6.72 651.7 4.76
1995 166,324 4.62 13,622 2.74 83.57 6.95 684.4 5.02
1996 175,285 5.39 14,102 3.52 89.43 7.01 719.5 5.13
1997 184,448 5.23 14,581 3.40 95.83 7.16 757.6 5.30
1998 193,429 4.87 15,088 3.48 101.81 6.24 794.1 4.82
1999 204,927 5.94 15,788 4.64 108.90 6.96 839.0 5.65
2000 215,736 5.27 16,608 5.19 117.49 7.89 904.5 7.81
2001 225,261 4.42 17,117 3.06 125.95 7.20 957.1 5.82
2002 237,101 5.26 17,537 2.45 134.19 6.54 992.6 3.71
2003 251,968 6.27 18,392 4.88 144.93 8.00 1,057.9 6.58
2004 266,974 5.96 19,473 5.88 158.48 9.35 1,155.9 9.26
2005 284,672 6.63 20,510 5.33 173.64 9.57 1,251.0 8.23
2006 302,971 6.43 21,548 5.06 190.95 9.97 1,358.1 8.56
2007 321,726 6.19 22,584 4.81 208.88 9.39 1,466.2 7.96
2008 340,197 5.74 23,592 4.46 226.24 8.31 1,568.9 7.00
2009 360,845 6.07 24,698 4.69 242.14 7.03 1,657.3 5.63
2010 385,050 6.71 25,721 4.14 260.54 7.60 1,740.4 5.01
Source:
*Bangladesh Bank Web site. Downloaded from: http://www.bangladesh-bank.org/econdata/index.php
**Downloaded from: http://www.indexmundi.com/bangladesh/gdp_%28purchasing_power_parity%29.html

HDRC
Report on Study to Determine Population Size of Bangladesh Considering Land and Resource
27
Per capita registered physician is a health indicator to assess the provision of population to
access basic and necessary health services. Annual average growth rate of the registered
doctors in the study period was 4.95 per cent, with maximum growth rate in 2006 (11.15%)
and minimum growth rate in 1991 (0.0%).
Table 4.6: Changing pattern of number of registered doctors, 1991- 2010
Year Number of registered doctors*
% Change (Year by year)
1990 20,396 -
1991 20,396 00
1992 21,455 5.19
1993 21,749 1.37
1994 23,805 9.45
1995 24,338 2.24
1996 26,535 9.03
1997 27,546 3.81
1998 28,312 2.78
1999 30,864 9.01
2000 31,952 3.53
0
1
2
3
4
5
6
7
8
9
10
1991 1992 1993 1994 1995 1996 1997 1998 1999 2000 2001 2002 2003 2004 2005 2006 2007 2008 2009 2010
% C
han
ge
Figure 4.6: Percentage change in per capita GDP at constant price and at PPP value,
1991-2010
GDP per capita at constant price Per capita GDP based on Purchasing-Power-Parity
0
2
4
6
8
10
12
1991 1992 1993 1994 1995 1996 1997 1998 1999 2000 2001 2002 2003 2004 2005 2006 2007 2008 2009 2010
% C
han
ge
Figure 4.5: Percentage change in GDP at constant price (base: 1995-96) and at PPP value,
1991-2010
GDP at constant price GDP based on Purchasing-Power-Parity (PPP)
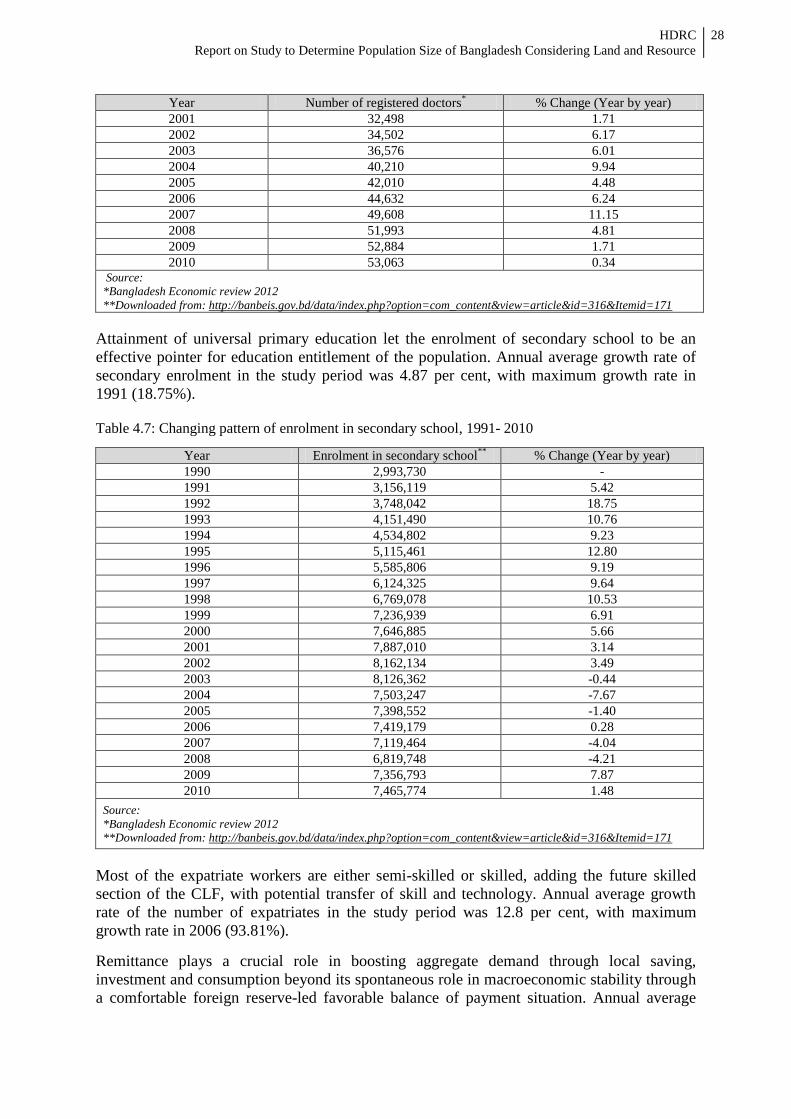
HDRC
Report on Study to Determine Population Size of Bangladesh Considering Land and Resource
28
Year Number of registered doctors*
% Change (Year by year)
2001 32,498 1.71
2002 34,502 6.17
2003 36,576 6.01
2004 40,210 9.94
2005 42,010 4.48
2006 44,632 6.24
2007 49,608 11.15
2008 51,993 4.81
2009 52,884 1.71
2010 53,063 0.34 Source:
*Bangladesh Economic review 2012
**Downloaded from: http://banbeis.gov.bd/data/index.php?option=com_content&view=article&id=316&Itemid=171
Attainment of universal primary education let the enrolment of secondary school to be an
effective pointer for education entitlement of the population. Annual average growth rate of
secondary enrolment in the study period was 4.87 per cent, with maximum growth rate in
1991 (18.75%).
Table 4.7: Changing pattern of enrolment in secondary school, 1991- 2010
Year Enrolment in secondary school**
% Change (Year by year)
1990 2,993,730 -
1991 3,156,119 5.42
1992 3,748,042 18.75
1993 4,151,490 10.76
1994 4,534,802 9.23
1995 5,115,461 12.80
1996 5,585,806 9.19
1997 6,124,325 9.64
1998 6,769,078 10.53
1999 7,236,939 6.91
2000 7,646,885 5.66
2001 7,887,010 3.14
2002 8,162,134 3.49
2003 8,126,362 -0.44
2004 7,503,247 -7.67
2005 7,398,552 -1.40
2006 7,419,179 0.28
2007 7,119,464 -4.04
2008 6,819,748 -4.21
2009 7,356,793 7.87
2010 7,465,774 1.48
Source:
*Bangladesh Economic review 2012
**Downloaded from: http://banbeis.gov.bd/data/index.php?option=com_content&view=article&id=316&Itemid=171
Most of the expatriate workers are either semi-skilled or skilled, adding the future skilled
section of the CLF, with potential transfer of skill and technology. Annual average growth
rate of the number of expatriates in the study period was 12.8 per cent, with maximum
growth rate in 2006 (93.81%).
Remittance plays a crucial role in boosting aggregate demand through local saving,
investment and consumption beyond its spontaneous role in macroeconomic stability through
a comfortable foreign reserve-led favorable balance of payment situation. Annual average
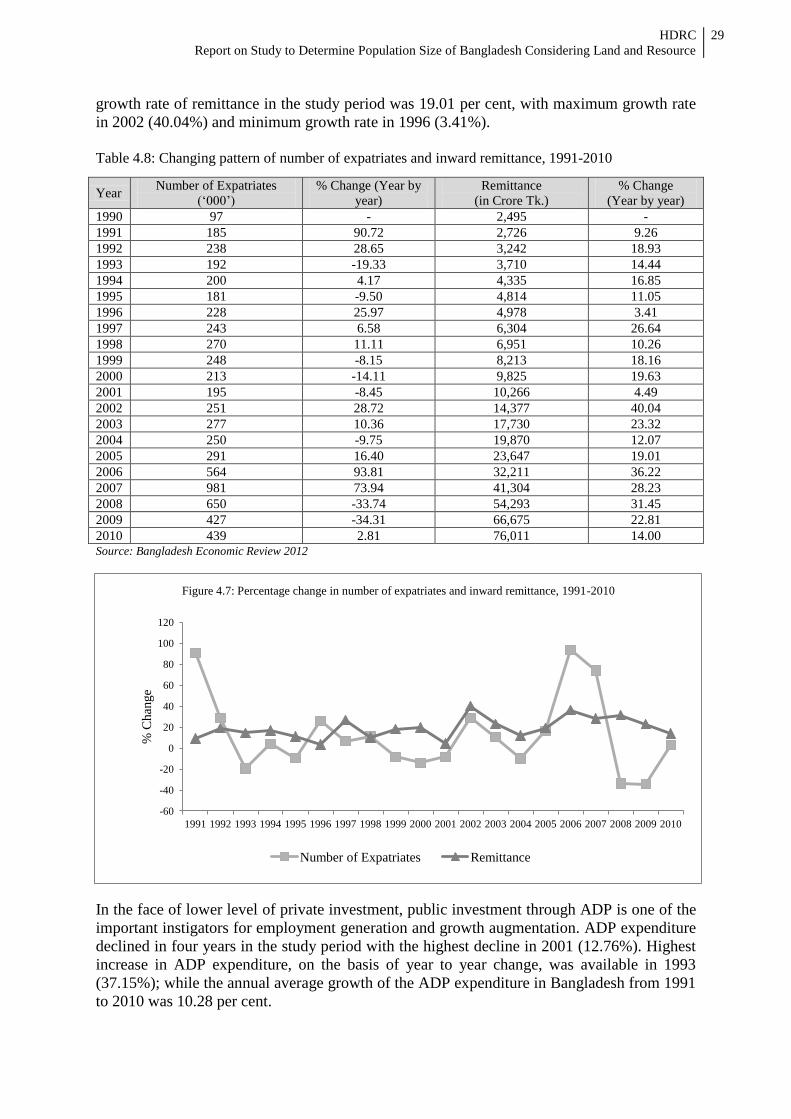
HDRC
Report on Study to Determine Population Size of Bangladesh Considering Land and Resource
29
growth rate of remittance in the study period was 19.01 per cent, with maximum growth rate
in 2002 (40.04%) and minimum growth rate in 1996 (3.41%).
Table 4.8: Changing pattern of number of expatriates and inward remittance, 1991-2010
Year Number of Expatriates
(‘000’)
% Change (Year by
year)
Remittance
(in Crore Tk.)
% Change
(Year by year)
1990 97 - 2,495 -
1991 185 90.72 2,726 9.26
1992 238 28.65 3,242 18.93
1993 192 -19.33 3,710 14.44
1994 200 4.17 4,335 16.85
1995 181 -9.50 4,814 11.05
1996 228 25.97 4,978 3.41
1997 243 6.58 6,304 26.64
1998 270 11.11 6,951 10.26
1999 248 -8.15 8,213 18.16
2000 213 -14.11 9,825 19.63
2001 195 -8.45 10,266 4.49
2002 251 28.72 14,377 40.04
2003 277 10.36 17,730 23.32
2004 250 -9.75 19,870 12.07
2005 291 16.40 23,647 19.01
2006 564 93.81 32,211 36.22
2007 981 73.94 41,304 28.23
2008 650 -33.74 54,293 31.45
2009 427 -34.31 66,675 22.81
2010 439 2.81 76,011 14.00 Source: Bangladesh Economic Review 2012
In the face of lower level of private investment, public investment through ADP is one of the
important instigators for employment generation and growth augmentation. ADP expenditure
declined in four years in the study period with the highest decline in 2001 (12.76%). Highest
increase in ADP expenditure, on the basis of year to year change, was available in 1993
(37.15%); while the annual average growth of the ADP expenditure in Bangladesh from 1991
to 2010 was 10.28 per cent.
-60
-40
-20
0
20
40
60
80
100
120
1991 1992 1993 1994 1995 1996 1997 1998 1999 2000 2001 2002 2003 2004 2005 2006 2007 2008 2009 2010
% C
han
ge
Figure 4.7: Percentage change in number of expatriates and inward remittance, 1991-2010
Number of Expatriates Remittance
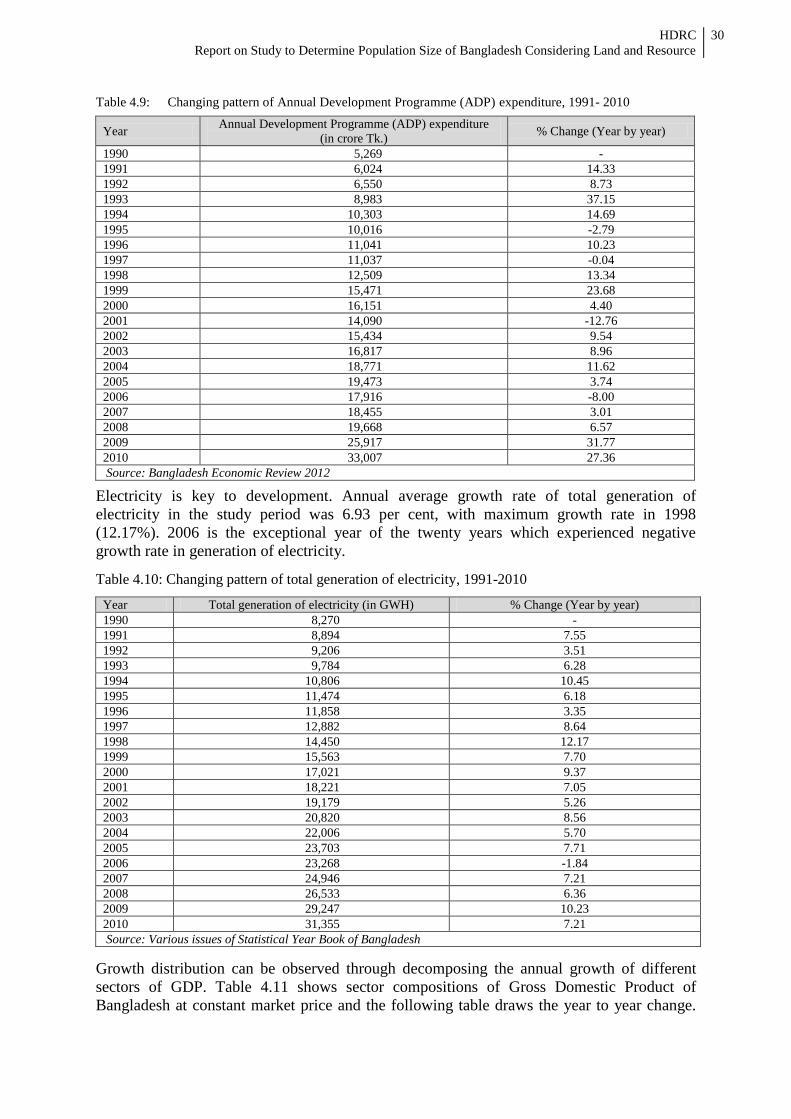
HDRC
Report on Study to Determine Population Size of Bangladesh Considering Land and Resource
30
Table 4.9: Changing pattern of Annual Development Programme (ADP) expenditure, 1991- 2010
Year Annual Development Programme (ADP) expenditure
(in crore Tk.) % Change (Year by year)
1990 5,269 -
1991 6,024 14.33
1992 6,550 8.73
1993 8,983 37.15
1994 10,303 14.69
1995 10,016 -2.79
1996 11,041 10.23
1997 11,037 -0.04
1998 12,509 13.34
1999 15,471 23.68
2000 16,151 4.40
2001 14,090 -12.76
2002 15,434 9.54
2003 16,817 8.96
2004 18,771 11.62
2005 19,473 3.74
2006 17,916 -8.00
2007 18,455 3.01
2008 19,668 6.57
2009 25,917 31.77
2010 33,007 27.36
Source: Bangladesh Economic Review 2012
Electricity is key to development. Annual average growth rate of total generation of
electricity in the study period was 6.93 per cent, with maximum growth rate in 1998
(12.17%). 2006 is the exceptional year of the twenty years which experienced negative
growth rate in generation of electricity.
Table 4.10: Changing pattern of total generation of electricity, 1991-2010
Year Total generation of electricity (in GWH)
% Change (Year by year)
1990 8,270 -
1991 8,894 7.55
1992 9,206 3.51
1993 9,784 6.28
1994 10,806 10.45
1995 11,474 6.18
1996 11,858 3.35
1997 12,882 8.64
1998 14,450 12.17
1999 15,563 7.70
2000 17,021 9.37
2001 18,221 7.05
2002 19,179 5.26
2003 20,820 8.56
2004 22,006 5.70
2005 23,703 7.71
2006 23,268 -1.84
2007 24,946 7.21
2008 26,533 6.36
2009 29,247 10.23
2010 31,355 7.21
Source: Various issues of Statistical Year Book of Bangladesh
Growth distribution can be observed through decomposing the annual growth of different
sectors of GDP. Table 4.11 shows sector compositions of Gross Domestic Product of
Bangladesh at constant market price and the following table draws the year to year change.
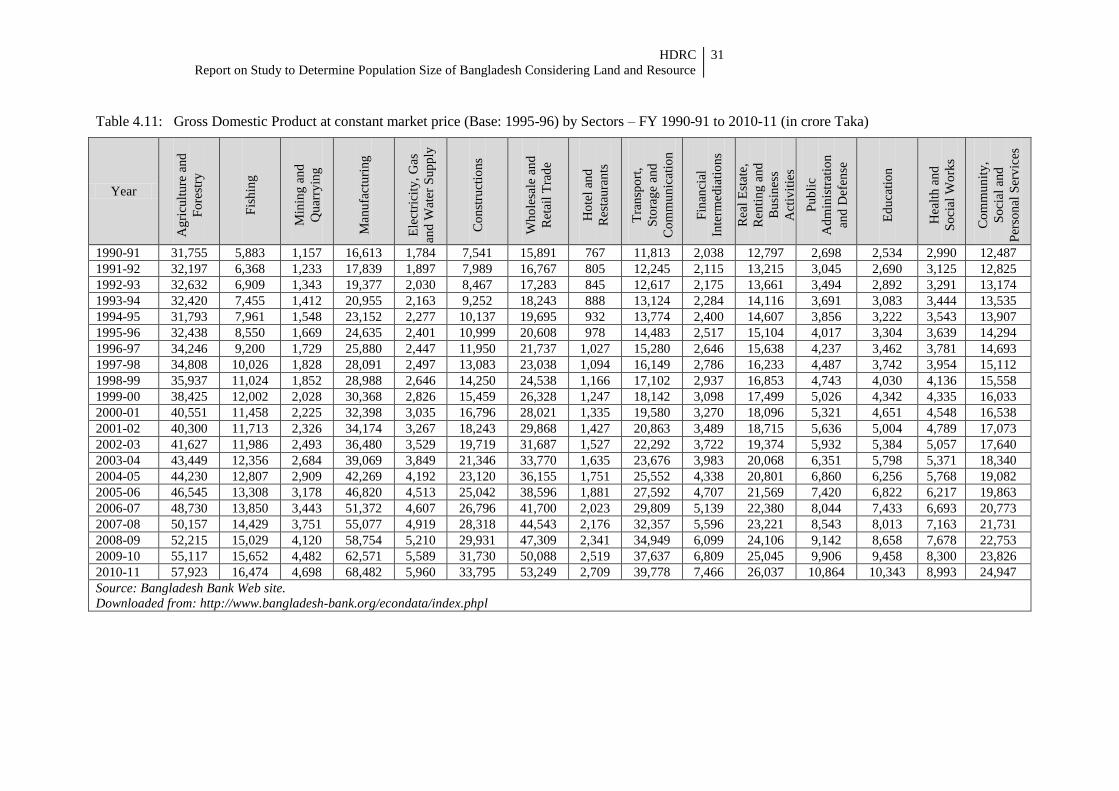
HDRC
Report on Study to Determine Population Size of Bangladesh Considering Land and Resource
31
Table 4.11: Gross Domestic Product at constant market price (Base: 1995-96) by Sectors – FY 1990-91 to 2010-11 (in crore Taka)
Year A
gri
cult
ure
and
Fo
rest
ry
Fis
hin
g
Min
ing
an
d
Qu
arry
ing
Man
ufa
ctu
ring
Ele
ctri
city
, G
as
and
Wat
er S
up
ply
Co
nst
ruct
ion
s
Wh
ole
sale
an
d
Ret
ail
Tra
de
Ho
tel
and
Res
tau
ran
ts
Tra
nsp
ort
,
Sto
rag
e an
d
Co
mm
un
icat
ion
Fin
anci
al
Inte
rmed
iati
on
s
Rea
l E
stat
e,
Ren
tin
g a
nd
Bu
sin
ess
Act
ivit
ies
Pu
bli
c
Ad
min
istr
atio
n
and
Def
ense
Ed
uca
tio
n
Hea
lth
an
d
So
cial
Wo
rks
Co
mm
un
ity
,
So
cial
an
d
Per
son
al S
erv
ices
1990-91 31,755 5,883 1,157 16,613 1,784 7,541 15,891 767 11,813 2,038 12,797 2,698 2,534 2,990 12,487
1991-92 32,197 6,368 1,233 17,839 1,897 7,989 16,767 805 12,245 2,115 13,215 3,045 2,690 3,125 12,825
1992-93 32,632 6,909 1,343 19,377 2,030 8,467 17,283 845 12,617 2,175 13,661 3,494 2,892 3,291 13,174
1993-94 32,420 7,455 1,412 20,955 2,163 9,252 18,243 888 13,124 2,284 14,116 3,691 3,083 3,444 13,535
1994-95 31,793 7,961 1,548 23,152 2,277 10,137 19,695 932 13,774 2,400 14,607 3,856 3,222 3,543 13,907
1995-96 32,438 8,550 1,669 24,635 2,401 10,999 20,608 978 14,483 2,517 15,104 4,017 3,304 3,639 14,294
1996-97 34,246 9,200 1,729 25,880 2,447 11,950 21,737 1,027 15,280 2,646 15,638 4,237 3,462 3,781 14,693
1997-98 34,808 10,026 1,828 28,091 2,497 13,083 23,038 1,094 16,149 2,786 16,233 4,487 3,742 3,954 15,112
1998-99 35,937 11,024 1,852 28,988 2,646 14,250 24,538 1,166 17,102 2,937 16,853 4,743 4,030 4,136 15,558
1999-00 38,425 12,002 2,028 30,368 2,826 15,459 26,328 1,247 18,142 3,098 17,499 5,026 4,342 4,335 16,033
2000-01 40,551 11,458 2,225 32,398 3,035 16,796 28,021 1,335 19,580 3,270 18,096 5,321 4,651 4,548 16,538
2001-02 40,300 11,713 2,326 34,174 3,267 18,243 29,868 1,427 20,863 3,489 18,715 5,636 5,004 4,789 17,073
2002-03 41,627 11,986 2,493 36,480 3,529 19,719 31,687 1,527 22,292 3,722 19,374 5,932 5,384 5,057 17,640
2003-04 43,449 12,356 2,684 39,069 3,849 21,346 33,770 1,635 23,676 3,983 20,068 6,351 5,798 5,371 18,340
2004-05 44,230 12,807 2,909 42,269 4,192 23,120 36,155 1,751 25,552 4,338 20,801 6,860 6,256 5,768 19,082
2005-06 46,545 13,308 3,178 46,820 4,513 25,042 38,596 1,881 27,592 4,707 21,569 7,420 6,822 6,217 19,863
2006-07 48,730 13,850 3,443 51,372 4,607 26,796 41,700 2,023 29,809 5,139 22,380 8,044 7,433 6,693 20,773
2007-08 50,157 14,429 3,751 55,077 4,919 28,318 44,543 2,176 32,357 5,596 23,221 8,543 8,013 7,163 21,731
2008-09 52,215 15,029 4,120 58,754 5,210 29,931 47,309 2,341 34,949 6,099 24,106 9,142 8,658 7,678 22,753
2009-10 55,117 15,652 4,482 62,571 5,589 31,730 50,088 2,519 37,637 6,809 25,045 9,906 9,458 8,300 23,826
2010-11 57,923 16,474 4,698 68,482 5,960 33,795 53,249 2,709 39,778 7,466 26,037 10,864 10,343 8,993 24,947
Source: Bangladesh Bank Web site.
Downloaded from: http://www.bangladesh-bank.org/econdata/index.phpl
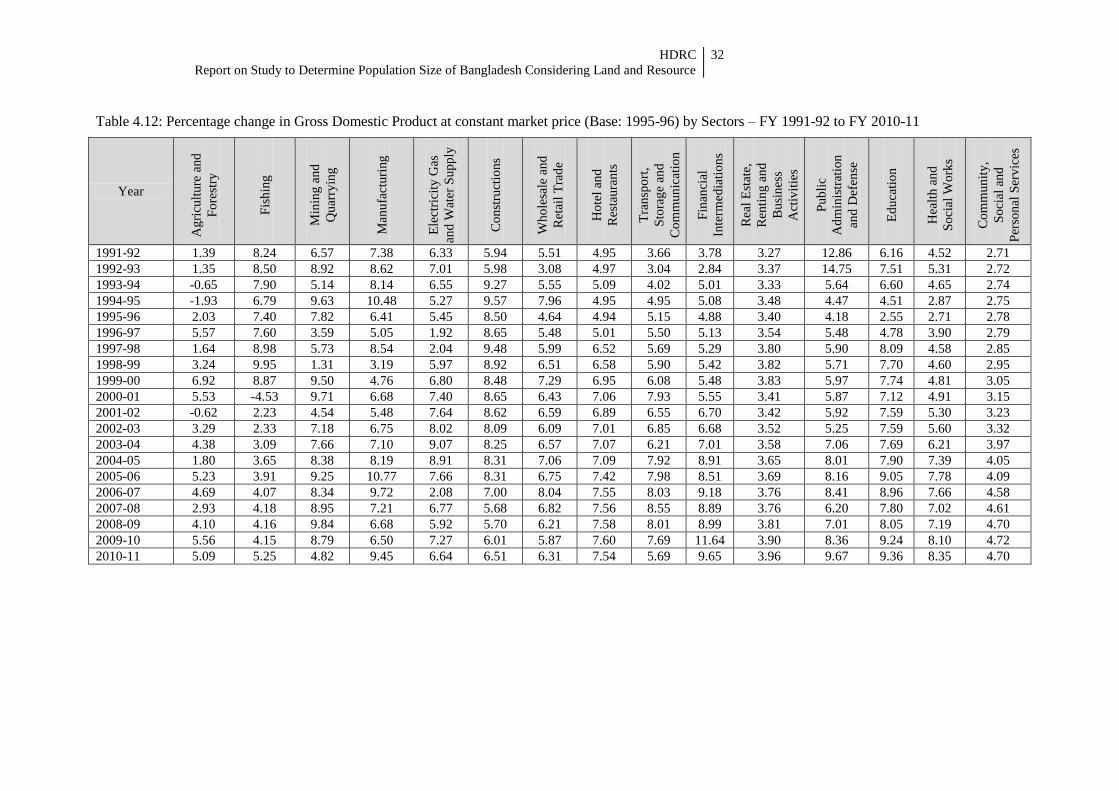
HDRC
Report on Study to Determine Population Size of Bangladesh Considering Land and Resource
32
Table 4.12: Percentage change in Gross Domestic Product at constant market price (Base: 1995-96) by Sectors – FY 1991-92 to FY 2010-11
Year A
gri
cult
ure
and
Fo
rest
ry
Fis
hin
g
Min
ing
an
d
Qu
arry
ing
Man
ufa
ctu
ring
Ele
ctri
city
Gas
and
Wat
er S
up
ply
Co
nst
ruct
ion
s
Wh
ole
sale
an
d
Ret
ail
Tra
de
Ho
tel
and
Res
tau
ran
ts
Tra
nsp
ort
,
Sto
rag
e an
d
Co
mm
un
icat
ion
Fin
anci
al
Inte
rmed
iati
on
s
Rea
l E
stat
e,
Ren
tin
g a
nd
Bu
sin
ess
Act
ivit
ies
Pu
bli
c
Ad
min
istr
atio
n
and
Def
ense
Ed
uca
tio
n
Hea
lth
an
d
So
cial
Wo
rks
Co
mm
un
ity
,
So
cial
an
d
Per
son
al S
erv
ices
1991-92 1.39 8.24 6.57 7.38 6.33 5.94 5.51 4.95 3.66 3.78 3.27 12.86 6.16 4.52 2.71
1992-93 1.35 8.50 8.92 8.62 7.01 5.98 3.08 4.97 3.04 2.84 3.37 14.75 7.51 5.31 2.72
1993-94 -0.65 7.90 5.14 8.14 6.55 9.27 5.55 5.09 4.02 5.01 3.33 5.64 6.60 4.65 2.74
1994-95 -1.93 6.79 9.63 10.48 5.27 9.57 7.96 4.95 4.95 5.08 3.48 4.47 4.51 2.87 2.75
1995-96 2.03 7.40 7.82 6.41 5.45 8.50 4.64 4.94 5.15 4.88 3.40 4.18 2.55 2.71 2.78
1996-97 5.57 7.60 3.59 5.05 1.92 8.65 5.48 5.01 5.50 5.13 3.54 5.48 4.78 3.90 2.79
1997-98 1.64 8.98 5.73 8.54 2.04 9.48 5.99 6.52 5.69 5.29 3.80 5.90 8.09 4.58 2.85
1998-99 3.24 9.95 1.31 3.19 5.97 8.92 6.51 6.58 5.90 5.42 3.82 5.71 7.70 4.60 2.95
1999-00 6.92 8.87 9.50 4.76 6.80 8.48 7.29 6.95 6.08 5.48 3.83 5.97 7.74 4.81 3.05
2000-01 5.53 -4.53 9.71 6.68 7.40 8.65 6.43 7.06 7.93 5.55 3.41 5.87 7.12 4.91 3.15
2001-02 -0.62 2.23 4.54 5.48 7.64 8.62 6.59 6.89 6.55 6.70 3.42 5.92 7.59 5.30 3.23
2002-03 3.29 2.33 7.18 6.75 8.02 8.09 6.09 7.01 6.85 6.68 3.52 5.25 7.59 5.60 3.32
2003-04 4.38 3.09 7.66 7.10 9.07 8.25 6.57 7.07 6.21 7.01 3.58 7.06 7.69 6.21 3.97
2004-05 1.80 3.65 8.38 8.19 8.91 8.31 7.06 7.09 7.92 8.91 3.65 8.01 7.90 7.39 4.05
2005-06 5.23 3.91 9.25 10.77 7.66 8.31 6.75 7.42 7.98 8.51 3.69 8.16 9.05 7.78 4.09
2006-07 4.69 4.07 8.34 9.72 2.08 7.00 8.04 7.55 8.03 9.18 3.76 8.41 8.96 7.66 4.58
2007-08 2.93 4.18 8.95 7.21 6.77 5.68 6.82 7.56 8.55 8.89 3.76 6.20 7.80 7.02 4.61
2008-09 4.10 4.16 9.84 6.68 5.92 5.70 6.21 7.58 8.01 8.99 3.81 7.01 8.05 7.19 4.70
2009-10 5.56 4.15 8.79 6.50 7.27 6.01 5.87 7.60 7.69 11.64 3.90 8.36 9.24 8.10 4.72
2010-11 5.09 5.25 4.82 9.45 6.64 6.51 6.31 7.54 5.69 9.65 3.96 9.67 9.36 8.35 4.70
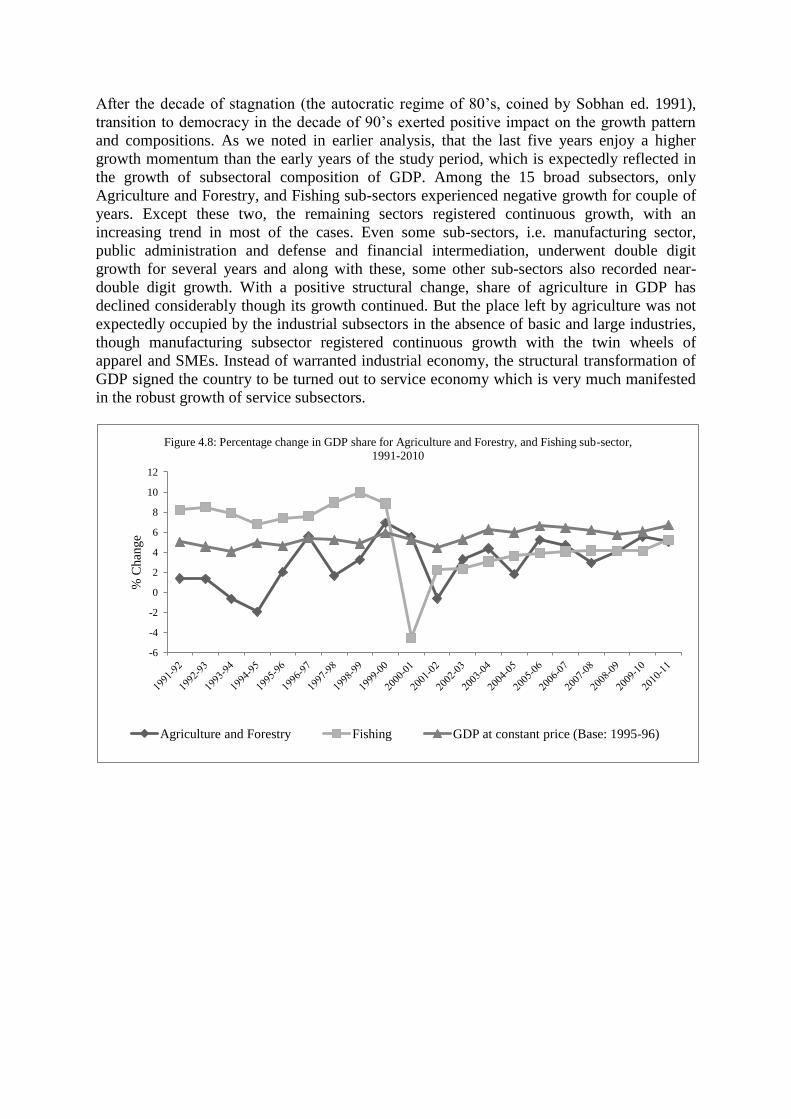
After the decade of stagnation (the autocratic regime of 80’s, coined by Sobhan ed. 1991),
transition to democracy in the decade of 90’s exerted positive impact on the growth pattern
and compositions. As we noted in earlier analysis, that the last five years enjoy a higher
growth momentum than the early years of the study period, which is expectedly reflected in
the growth of subsectoral composition of GDP. Among the 15 broad subsectors, only
Agriculture and Forestry, and Fishing sub-sectors experienced negative growth for couple of
years. Except these two, the remaining sectors registered continuous growth, with an
increasing trend in most of the cases. Even some sub-sectors, i.e. manufacturing sector,
public administration and defense and financial intermediation, underwent double digit
growth for several years and along with these, some other sub-sectors also recorded near-
double digit growth. With a positive structural change, share of agriculture in GDP has
declined considerably though its growth continued. But the place left by agriculture was not
expectedly occupied by the industrial subsectors in the absence of basic and large industries,
though manufacturing subsector registered continuous growth with the twin wheels of
apparel and SMEs. Instead of warranted industrial economy, the structural transformation of
GDP signed the country to be turned out to service economy which is very much manifested
in the robust growth of service subsectors.
-6
-4
-2
0
2
4
6
8
10
12
% C
han
ge
Figure 4.8: Percentage change in GDP share for Agriculture and Forestry, and Fishing sub-sector,
1991-2010
Agriculture and Forestry Fishing GDP at constant price (Base: 1995-96)
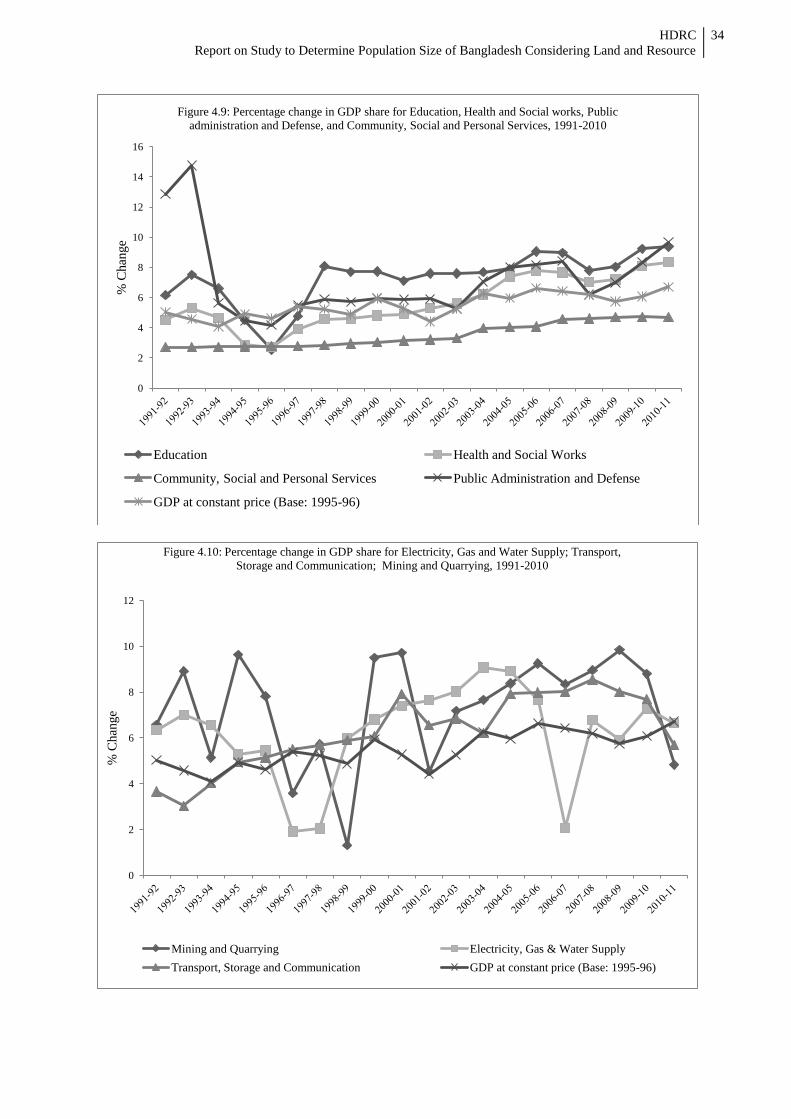
HDRC
Report on Study to Determine Population Size of Bangladesh Considering Land and Resource
34
0
2
4
6
8
10
12
14
16
% C
han
ge
Figure 4.9: Percentage change in GDP share for Education, Health and Social works, Public
administration and Defense, and Community, Social and Personal Services, 1991-2010
Education Health and Social Works
Community, Social and Personal Services Public Administration and Defense
GDP at constant price (Base: 1995-96)
0
2
4
6
8
10
12
% C
han
ge
Figure 4.10: Percentage change in GDP share for Electricity, Gas and Water Supply; Transport,
Storage and Communication; Mining and Quarrying, 1991-2010
Mining and Quarrying Electricity, Gas & Water Supply
Transport, Storage and Communication GDP at constant price (Base: 1995-96)
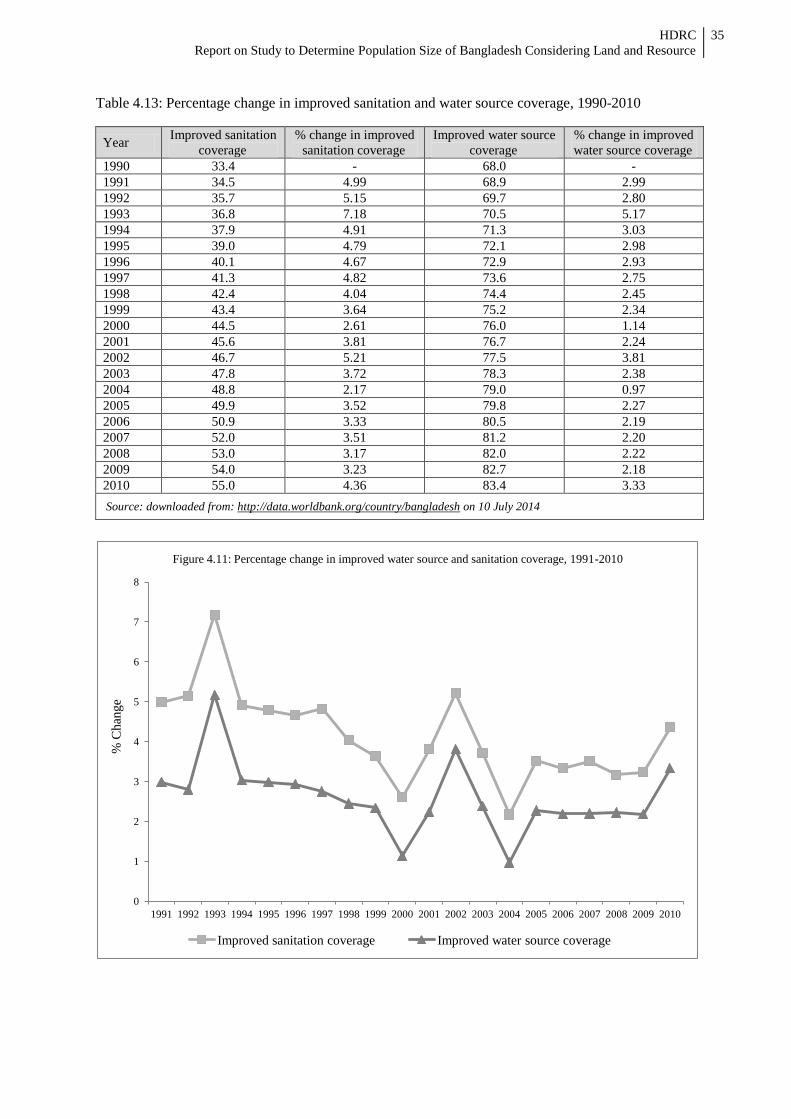
HDRC
Report on Study to Determine Population Size of Bangladesh Considering Land and Resource
35
Table 4.13: Percentage change in improved sanitation and water source coverage, 1990-2010
Year Improved sanitation
coverage
% change in improved
sanitation coverage
Improved water source
coverage
% change in improved
water source coverage
1990 33.4 - 68.0 -
1991 34.5 4.99 68.9 2.99
1992 35.7 5.15 69.7 2.80
1993 36.8 7.18 70.5 5.17
1994 37.9 4.91 71.3 3.03
1995 39.0 4.79 72.1 2.98
1996 40.1 4.67 72.9 2.93
1997 41.3 4.82 73.6 2.75
1998 42.4 4.04 74.4 2.45
1999 43.4 3.64 75.2 2.34
2000 44.5 2.61 76.0 1.14
2001 45.6 3.81 76.7 2.24
2002 46.7 5.21 77.5 3.81
2003 47.8 3.72 78.3 2.38
2004 48.8 2.17 79.0 0.97
2005 49.9 3.52 79.8 2.27
2006 50.9 3.33 80.5 2.19
2007 52.0 3.51 81.2 2.20
2008 53.0 3.17 82.0 2.22
2009 54.0 3.23 82.7 2.18
2010 55.0 4.36 83.4 3.33
Source: downloaded from: http://data.worldbank.org/country/bangladesh on 10 July 2014
0
1
2
3
4
5
6
7
8
1991 1992 1993 1994 1995 1996 1997 1998 1999 2000 2001 2002 2003 2004 2005 2006 2007 2008 2009 2010
% C
han
ge
Figure 4.11: Percentage change in improved water source and sanitation coverage, 1991-2010
Improved sanitation coverage Improved water source coverage

HDRC
Report on Study to Determine Population Size of Bangladesh Considering Land and Resource
36
CHAPTER 5
DETERMINING OPTIMUM POPULATION SIZE
5.1 Introduction
This section is the heart of this report containing, among others, the results and outcomes of
the population projection exercises done for Bangladesh considering land and other
resources. The projection conducted aimed at determining the optimum population size for
Bangladesh for each year of the time period extending between 2011 and 2020 (now-on-ward
will be termed as population projection 2014 or projection 2014, or as shown in Box 5.1). In
this study, attempts have been made to develop two different models and then deploying each
model optimum population size determination exercises have been done keeping in view,
among others, the dynamics of land and other resources. The First Model is a model
combining demographic model, production model and welfare index; and this model enjoys
the freedom of considering the eligible variables. The Second Model is a model of optimum
population for sustainable development. In addition to the results and implications of these
two models, the results of another population projection exercise conducted by a team
deployed by the MoHFW (in 1994) with Prof. Abul Barkat as the team leader, twenty years
ago from now, has been presented. In order to ease readability of these models, for each
model, some synonyms or acronyms have been interchangeably used to denote that model.
This is presented in the Box 5.1 below.
Box 5.1: Acronyms and synonyms for each population projection model used in the study
1. First Model = Model to determine optimum population size for Bangladesh (for the period
between 2011 and 2020) = Model interlinking population model, production model and welfare
index = Model A. Model A considers total and per capita GNI, per capita total household
consumption expenditure, per capita household consumption expenditure on food, Government
expenditure on Health, and Government expenditure on education. The scenario, unless otherwise
mentioned will be termed as Model A.
2. Second Model = Model for determination of optimum population for sustainable development of
Bangladesh = Model B.
3. Third Model = This is the population projection exercise conducted in 1994-95 and published in
1996 by the MoHFW. The author of this study was the team leader of the 11-member team of
high level experts drawn from both home and abroad (for names see Barkat et al, 1996) and the
report titled “Strategic Directions for the Bangladesh National Family Planning Program 1995-
2005”. The model projected population size of Bangladesh for the time period between 1995 and
2024. This model had three scenarios, namely Base Scenario, Intender Scenario, and Quality
Scenario. This model, unless otherwise mentioned, will be termed as Model C or Model MoHFW
1996, or MoHFW 1996, or Barkat et al, 1996. The three scenarios of this model will be termed, in
this study as, Model C – Base Scenario or Model C1 (to represent base scenario), Model C –
Intender Scenario or Model C2 ( to represent intender scenario), and Model C – Quality Scenario
or Model C3 (to represent quality scenario or, in other words, projected population under this
scenario)

HDRC
Report on Study to Determine Population Size of Bangladesh Considering Land and Resource
37
Now, before presenting our 2014 projection in the subsequent two sub-sections it would be of
high utility to present the results and outcomes of an in-depth population projection exercise
conducted 20 years ago (in 1994-95 for the MOHFW, which MOHFW published in 1996) by
an 11-member team of high level expert drawn from both home and abroad (for the names
and affiliations of each members of that team, see, Barkat et al, 1996). There exist, manifold
reasons for presenting the results of that model (termed in this study as Model C or Model
MOHFW 1996 or Model Barkat et al, 1996). Among other reasons, the four key reasons for
presenting the results and outcomes of that model worth mentioning are as follows: First, the
model was the first of its kind in Bangladesh. Although used cohort-component approach in
projecting population, the model to a large extent, contains traits of optimum population
projection model. Second, the results in terms of absolute size of populations of the 3rd
scenario adopted in that model, i.e., the Quality Program Scenario (Model C3) is very close
to those determined in the present 2014 exercise (both with Model A and Model B). Third,
the model provides not only the results in terms of projected population sizes by three
different scenarios (Model C1, Model C2, and Model C3), but also, more importantly
provides estimates of both necessary human resources demand exercise and financial costing
exercises (i.e; amount of money to be needed in-phases) to materialize or implement each
scenario of the model. And, fourth, the 1996 model provided not only the projection of
population sizes but also implications there on including forwarded feasible and
implementable appropriate suggestions and approaches – both in terms of family planning
and family welfare related programmatic and non-programmatic ones. The key results of
population projection of 1996 Model of MOHFW (Model C or Model MOHFW 1996 or
Model Barkat et al, 1996) are presented in Table 5.1. To facilitate comparability with the
present 2014 study, the Table 5.1 presents only the projected population size by scenarios for
each year between 2011 and 2020.
Table 5.1: Projected population size of Bangladesh for the period between 2011 and 2020 as per
MOHFW 1996 study (Barkat et al, 1996; Model C)
Year
Projected Population (in million)
Base scenario
(Model C 1)
Intended scenario
(Model C 2)
Quality scenario
(Model C 3)
2011 168.4 158.7 151.6
2012 172.1 161.3 153.2
2013 175.8 163.8 154.8
2014 175.4 166.3 156.3
2015 183.0 168.8 157.7
2016 186.7 171.2 159.2
2017 190.3 173.7 160.5
2018 194.0 176.1 161.8
2019 197.7 178.5 163.1
2020 201.4 180.8 164.3
Source: Barkat et al, 1996, pp.17,24, 33. Figures have been rounded after decimal point to next number.
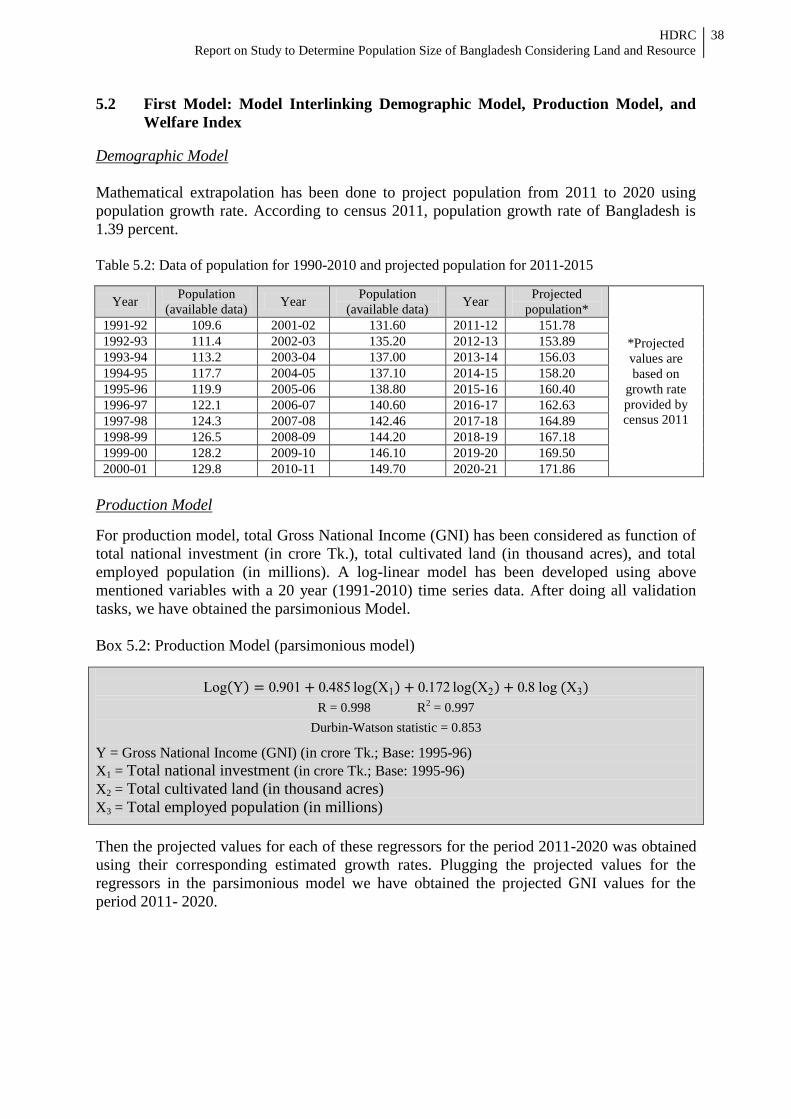
HDRC
Report on Study to Determine Population Size of Bangladesh Considering Land and Resource
38
5.2 First Model: Model Interlinking Demographic Model, Production Model, and
Welfare Index
Demographic Model
Mathematical extrapolation has been done to project population from 2011 to 2020 using
population growth rate. According to census 2011, population growth rate of Bangladesh is
1.39 percent.
Table 5.2: Data of population for 1990-2010 and projected population for 2011-2015
Year Population
(available data) Year
Population
(available data) Year
Projected
population*
*Projected
values are
based on
growth rate
provided by
census 2011
1991-92 109.6 2001-02 131.60 2011-12 151.78
1992-93 111.4 2002-03 135.20 2012-13 153.89
1993-94 113.2 2003-04 137.00 2013-14 156.03
1994-95 117.7 2004-05 137.10 2014-15 158.20
1995-96 119.9 2005-06 138.80 2015-16 160.40
1996-97 122.1 2006-07 140.60 2016-17 162.63
1997-98 124.3 2007-08 142.46 2017-18 164.89
1998-99 126.5 2008-09 144.20 2018-19 167.18
1999-00 128.2 2009-10 146.10 2019-20 169.50
2000-01 129.8 2010-11 149.70 2020-21 171.86
Production Model
For production model, total Gross National Income (GNI) has been considered as function of
total national investment (in crore Tk.), total cultivated land (in thousand acres), and total
employed population (in millions). A log-linear model has been developed using above
mentioned variables with a 20 year (1991-2010) time series data. After doing all validation
tasks, we have obtained the parsimonious Model.
Box 5.2: Production Model (parsimonious model)
Log 0 901 0 485 log 1 0 172 log 2 0 8 log 3
R = 0.998 R2 = 0.997
Durbin-Watson statistic = 0.853
Y = Gross National Income (GNI) (in crore Tk.; Base: 1995-96)
X1 = Total national investment (in crore Tk.; Base: 1995-96)
X2 = Total cultivated land (in thousand acres)
X3 = Total employed population (in millions)
Then the projected values for each of these regressors for the period 2011-2020 was obtained
using their corresponding estimated growth rates. Plugging the projected values for the
regressors in the parsimonious model we have obtained the projected GNI values for the
period 2011- 2020.
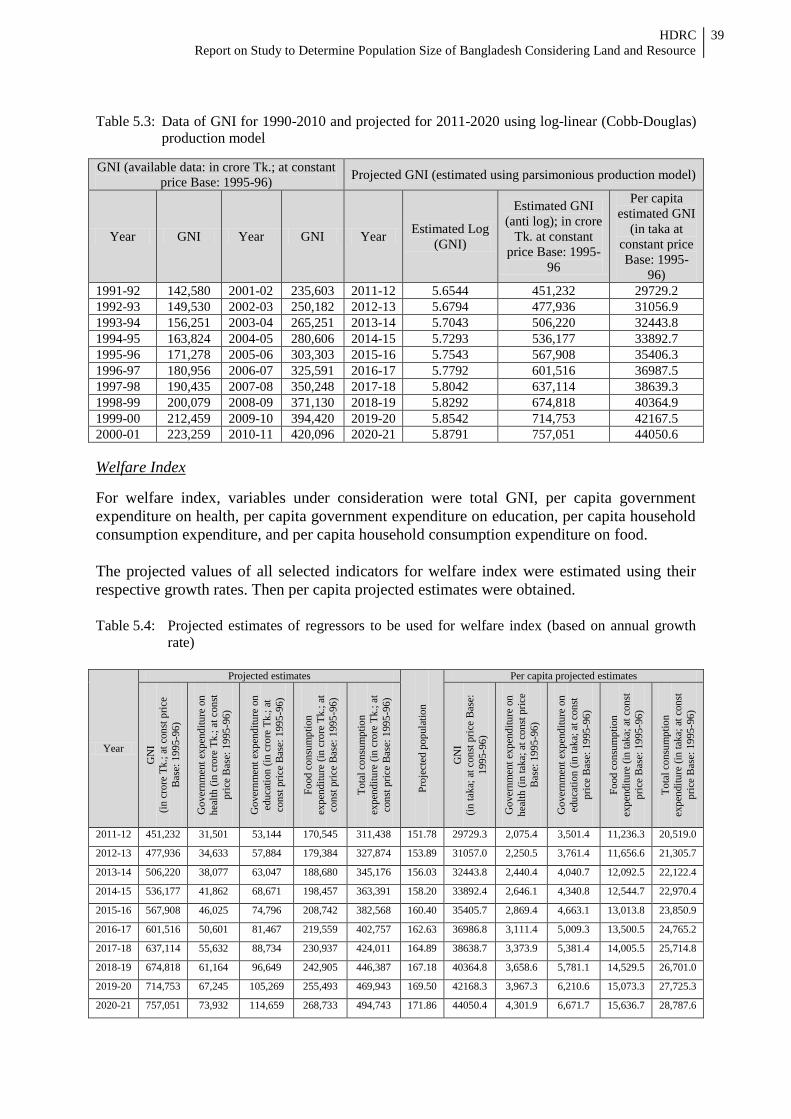
HDRC
Report on Study to Determine Population Size of Bangladesh Considering Land and Resource
39
Table 5.3: Data of GNI for 1990-2010 and projected for 2011-2020 using log-linear (Cobb-Douglas)
production model
GNI (available data: in crore Tk.; at constant
price Base: 1995-96) Projected GNI (estimated using parsimonious production model)
Year GNI Year GNI Year Estimated Log
(GNI)
Estimated GNI
(anti log); in crore
Tk. at constant
price Base: 1995-
96
Per capita
estimated GNI
(in taka at
constant price
Base: 1995-
96)
1991-92 142,580 2001-02 235,603 2011-12 5.6544 451,232 29729.2
1992-93 149,530 2002-03 250,182 2012-13 5.6794 477,936 31056.9
1993-94 156,251 2003-04 265,251 2013-14 5.7043 506,220 32443.8
1994-95 163,824 2004-05 280,606 2014-15 5.7293 536,177 33892.7
1995-96 171,278 2005-06 303,303 2015-16 5.7543 567,908 35406.3
1996-97 180,956 2006-07 325,591 2016-17 5.7792 601,516 36987.5
1997-98 190,435 2007-08 350,248 2017-18 5.8042 637,114 38639.3
1998-99 200,079 2008-09 371,130 2018-19 5.8292 674,818 40364.9
1999-00 212,459 2009-10 394,420 2019-20 5.8542 714,753 42167.5
2000-01 223,259 2010-11 420,096 2020-21 5.8791 757,051 44050.6
Welfare Index
For welfare index, variables under consideration were total GNI, per capita government
expenditure on health, per capita government expenditure on education, per capita household
consumption expenditure, and per capita household consumption expenditure on food.
The projected values of all selected indicators for welfare index were estimated using their
respective growth rates. Then per capita projected estimates were obtained.
Table 5.4: Projected estimates of regressors to be used for welfare index (based on annual growth
rate)
Year
Projected estimates
Pro
ject
ed p
op
ula
tio
n
Per capita projected estimates
GN
I
(in
cro
re T
k.;
at
con
st p
rice
Bas
e: 1
995
-96
)
Go
ver
nm
ent
exp
end
itu
re o
n
hea
lth
(in
cro
re T
k.;
at
con
st
pri
ce B
ase:
19
95
-96
)
Go
ver
nm
ent
exp
end
itu
re o
n
edu
cati
on
(in
cro
re T
k.;
at
con
st p
rice
Bas
e: 1
995
-96
)
Fo
od
con
sum
pti
on
exp
endit
ure
(in
cro
re T
k.;
at
con
st p
rice
Bas
e: 1
995
-96
)
To
tal
con
sum
pti
on
exp
endit
ure
(in
cro
re T
k.;
at
con
st p
rice
Bas
e: 1
995
-96
)
GN
I
(in
tak
a; a
t co
nst
pri
ce B
ase:
1995
-96
)
Go
ver
nm
ent
exp
end
itu
re o
n
hea
lth
(in
tak
a; a
t co
nst
pri
ce
Bas
e: 1
995
-96
)
Go
ver
nm
ent
exp
end
itu
re o
n
edu
cati
on
(in
tak
a; a
t co
nst
pri
ce B
ase:
19
95
-96
)
Fo
od
con
sum
pti
on
exp
endit
ure
(in
tak
a; a
t co
nst
pri
ce B
ase:
19
95
-96
)
To
tal
con
sum
pti
on
exp
endit
ure
(in
tak
a; a
t co
nst
pri
ce B
ase:
19
95
-96
)
2011-12 451,232 31,501 53,144 170,545 311,438 151.78 29729.3 2,075.4 3,501.4 11,236.3 20,519.0
2012-13 477,936 34,633 57,884 179,384 327,874 153.89 31057.0 2,250.5 3,761.4 11,656.6 21,305.7
2013-14 506,220 38,077 63,047 188,680 345,176 156.03 32443.8 2,440.4 4,040.7 12,092.5 22,122.4
2014-15 536,177 41,862 68,671 198,457 363,391 158.20 33892.4 2,646.1 4,340.8 12,544.7 22,970.4
2015-16 567,908 46,025 74,796 208,742 382,568 160.40 35405.7 2,869.4 4,663.1 13,013.8 23,850.9
2016-17 601,516 50,601 81,467 219,559 402,757 162.63 36986.8 3,111.4 5,009.3 13,500.5 24,765.2
2017-18 637,114 55,632 88,734 230,937 424,011 164.89 38638.7 3,373.9 5,381.4 14,005.5 25,714.8
2018-19 674,818 61,164 96,649 242,905 446,387 167.18 40364.8 3,658.6 5,781.1 14,529.5 26,701.0
2019-20 714,753 67,245 105,269 255,493 469,943 169.50 42168.3 3,967.3 6,210.6 15,073.3 27,725.3
2020-21 757,051 73,932 114,659 268,733 494,743 171.86 44050.4 4,301.9 6,671.7 15,636.7 28,787.6
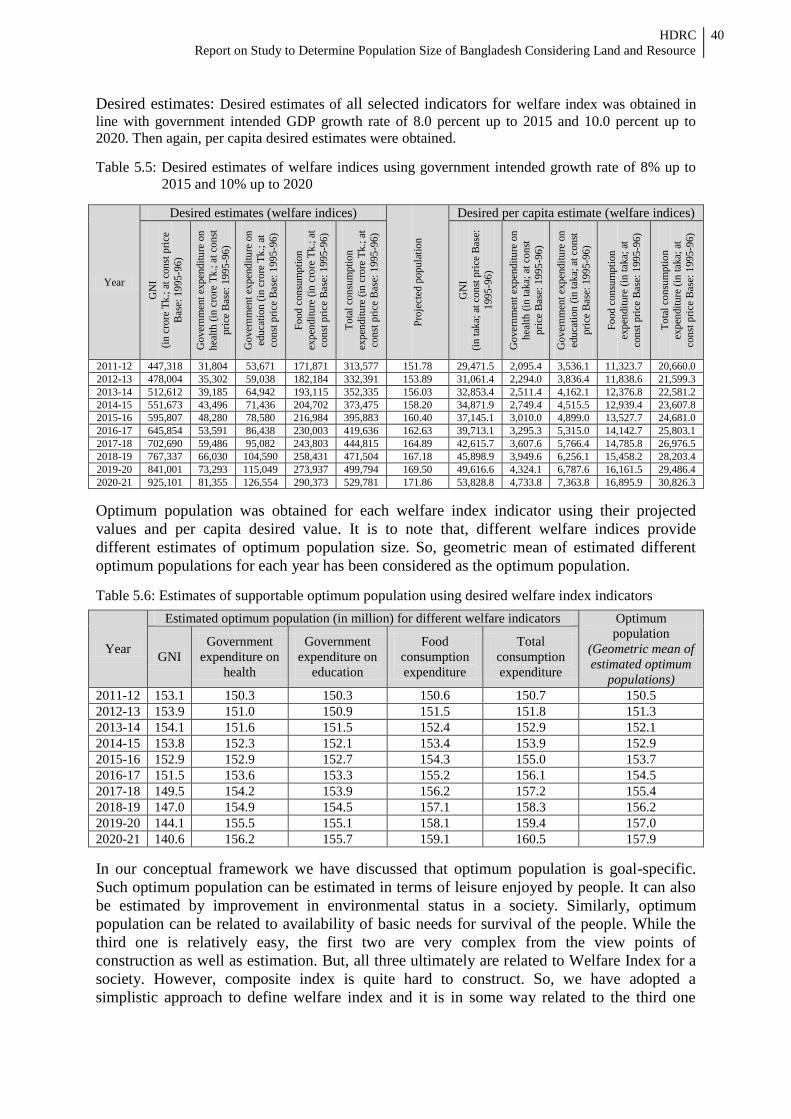
HDRC
Report on Study to Determine Population Size of Bangladesh Considering Land and Resource
40
Desired estimates: Desired estimates of all selected indicators for welfare index was obtained in
line with government intended GDP growth rate of 8.0 percent up to 2015 and 10.0 percent up to
2020. Then again, per capita desired estimates were obtained.
Table 5.5: Desired estimates of welfare indices using government intended growth rate of 8% up to
2015 and 10% up to 2020
Year
Desired estimates (welfare indices)
Pro
ject
ed p
op
ula
tio
n
Desired per capita estimate (welfare indices)
GN
I
(in
cro
re T
k.;
at
con
st p
rice
Bas
e: 1
995
-96
)
Go
ver
nm
ent
exp
end
itu
re o
n
hea
lth
(in
cro
re T
k.;
at
con
st
pri
ce B
ase:
19
95
-96
)
Go
ver
nm
ent
exp
end
itu
re o
n
edu
cati
on
(in
cro
re T
k.;
at
con
st p
rice
Bas
e: 1
995
-96
)
Fo
od
con
sum
pti
on
exp
endit
ure
(in
cro
re T
k.;
at
con
st p
rice
Bas
e: 1
995
-96
)
To
tal
con
sum
pti
on
exp
endit
ure
(in
cro
re T
k.;
at
con
st p
rice
Bas
e: 1
995
-96
)
GN
I
(in
tak
a; a
t co
nst
pri
ce B
ase:
1995
-96
)
Go
ver
nm
ent
exp
end
itu
re o
n
hea
lth
(in
tak
a; a
t co
nst
pri
ce B
ase:
19
95
-96
)
Go
ver
nm
ent
exp
end
itu
re o
n
edu
cati
on
(in
tak
a; a
t co
nst
pri
ce B
ase:
19
95
-96
)
Fo
od
con
sum
pti
on
exp
endit
ure
(in
tak
a; a
t
con
st p
rice
Bas
e: 1
995
-96
)
To
tal
con
sum
pti
on
exp
endit
ure
(in
tak
a; a
t
con
st p
rice
Bas
e: 1
995
-96
)
2011-12 447,318 31,804 53,671 171,871 313,577 151.78 29,471.5 2,095.4 3,536.1 11,323.7 20,660.0
2012-13 478,004 35,302 59,038 182,184 332,391 153.89 31,061.4 2,294.0 3,836.4 11,838.6 21,599.3
2013-14 512,612 39,185 64,942 193,115 352,335 156.03 32,853.4 2,511.4 4,162.1 12,376.8 22,581.2
2014-15 551,673 43,496 71,436 204,702 373,475 158.20 34,871.9 2,749.4 4,515.5 12,939.4 23,607.8
2015-16 595,807 48,280 78,580 216,984 395,883 160.40 37,145.1 3,010.0 4,899.0 13,527.7 24,681.0
2016-17 645,854 53,591 86,438 230,003 419,636 162.63 39,713.1 3,295.3 5,315.0 14,142.7 25,803.1
2017-18 702,690 59,486 95,082 243,803 444,815 164.89 42,615.7 3,607.6 5,766.4 14,785.8 26,976.5
2018-19 767,337 66,030 104,590 258,431 471,504 167.18 45,898.9 3,949.6 6,256.1 15,458.2 28,203.4
2019-20 841,001 73,293 115,049 273,937 499,794 169.50 49,616.6 4,324.1 6,787.6 16,161.5 29,486.4
2020-21 925,101 81,355 126,554 290,373 529,781 171.86 53,828.8 4,733.8 7,363.8 16,895.9 30,826.3
Optimum population was obtained for each welfare index indicator using their projected
values and per capita desired value. It is to note that, different welfare indices provide
different estimates of optimum population size. So, geometric mean of estimated different
optimum populations for each year has been considered as the optimum population.
Table 5.6: Estimates of supportable optimum population using desired welfare index indicators
Year
Estimated optimum population (in million) for different welfare indicators Optimum
population
(Geometric mean of
estimated optimum
populations)
GNI
Government
expenditure on
health
Government
expenditure on
education
Food
consumption
expenditure
Total
consumption
expenditure
2011-12 153.1 150.3 150.3 150.6 150.7 150.5
2012-13 153.9 151.0 150.9 151.5 151.8 151.3
2013-14 154.1 151.6 151.5 152.4 152.9 152.1
2014-15 153.8 152.3 152.1 153.4 153.9 152.9
2015-16 152.9 152.9 152.7 154.3 155.0 153.7
2016-17 151.5 153.6 153.3 155.2 156.1 154.5
2017-18 149.5 154.2 153.9 156.2 157.2 155.4
2018-19 147.0 154.9 154.5 157.1 158.3 156.2
2019-20 144.1 155.5 155.1 158.1 159.4 157.0
2020-21 140.6 156.2 155.7 159.1 160.5 157.9
In our conceptual framework we have discussed that optimum population is goal-specific.
Such optimum population can be estimated in terms of leisure enjoyed by people. It can also
be estimated by improvement in environmental status in a society. Similarly, optimum
population can be related to availability of basic needs for survival of the people. While the
third one is relatively easy, the first two are very complex from the view points of
construction as well as estimation. But, all three ultimately are related to Welfare Index for a
society. However, composite index is quite hard to construct. So, we have adopted a
simplistic approach to define welfare index and it is in some way related to the third one
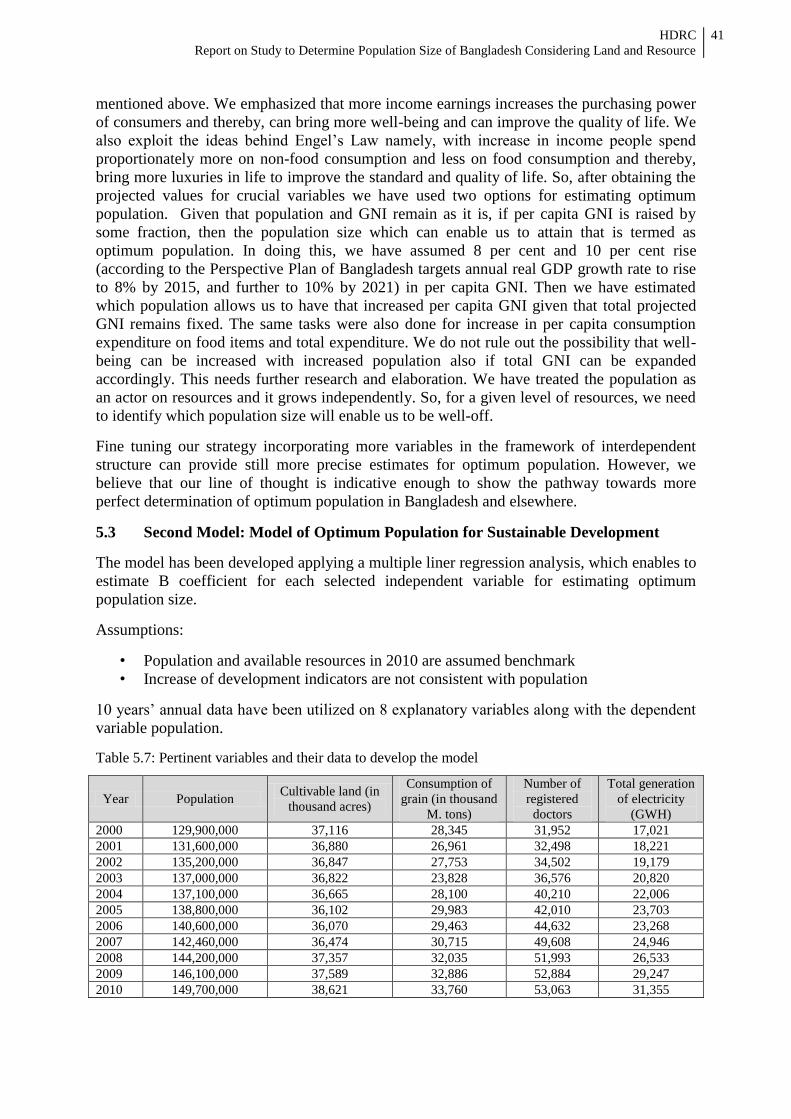
HDRC
Report on Study to Determine Population Size of Bangladesh Considering Land and Resource
41
mentioned above. We emphasized that more income earnings increases the purchasing power
of consumers and thereby, can bring more well-being and can improve the quality of life. We
also exploit the ideas behind Engel’s Law namely, with increase in income people spend
proportionately more on non-food consumption and less on food consumption and thereby,
bring more luxuries in life to improve the standard and quality of life. So, after obtaining the
projected values for crucial variables we have used two options for estimating optimum
population. Given that population and GNI remain as it is, if per capita GNI is raised by
some fraction, then the population size which can enable us to attain that is termed as
optimum population. In doing this, we have assumed 8 per cent and 10 per cent rise
(according to the Perspective Plan of Bangladesh targets annual real GDP growth rate to rise
to 8% by 2015, and further to 10% by 2021) in per capita GNI. Then we have estimated
which population allows us to have that increased per capita GNI given that total projected
GNI remains fixed. The same tasks were also done for increase in per capita consumption
expenditure on food items and total expenditure. We do not rule out the possibility that well-
being can be increased with increased population also if total GNI can be expanded
accordingly. This needs further research and elaboration. We have treated the population as
an actor on resources and it grows independently. So, for a given level of resources, we need
to identify which population size will enable us to be well-off.
Fine tuning our strategy incorporating more variables in the framework of interdependent
structure can provide still more precise estimates for optimum population. However, we
believe that our line of thought is indicative enough to show the pathway towards more
perfect determination of optimum population in Bangladesh and elsewhere.
5.3 Second Model: Model of Optimum Population for Sustainable Development
The model has been developed applying a multiple liner regression analysis, which enables to
estimate B coefficient for each selected independent variable for estimating optimum
population size.
Assumptions:
• Population and available resources in 2010 are assumed benchmark
• Increase of development indicators are not consistent with population
10 years’ annual data have been utilized on 8 explanatory variables along with the dependent
variable population.
Table 5.7: Pertinent variables and their data to develop the model
Year Population Cultivable land (in
thousand acres)
Consumption of
grain (in thousand
M. tons)
Number of
registered
doctors
Total generation
of electricity
(GWH)
2000 129,900,000 37,116 28,345 31,952 17,021
2001 131,600,000 36,880 26,961 32,498 18,221
2002 135,200,000 36,847 27,753 34,502 19,179
2003 137,000,000 36,822 23,828 36,576 20,820
2004 137,100,000 36,665 28,100 40,210 22,006
2005 138,800,000 36,102 29,983 42,010 23,703
2006 140,600,000 36,070 29,463 44,632 23,268
2007 142,460,000 36,474 30,715 49,608 24,946
2008 144,200,000 37,357 32,035 51,993 26,533
2009 146,100,000 37,589 32,886 52,884 29,247
2010 149,700,000 38,621 33,760 53,063 31,355

HDRC
Report on Study to Determine Population Size of Bangladesh Considering Land and Resource
42
Year
Total production of
pulse (in thousand
M. tons)
Annual Development
Programme expenditure
(In crore Taka)
Number of students
enrolled in
secondary school
Per capita GDP at
constant price (Base:
1995-96) (in Taka)
2000 366 16,151 7,646,885 16,607.85
2001 344 14,090 7,887,010 17,117.10
2002 349 15,434 8,162,134 17,537.06
2003 333 16,817 8,126,362 18,391.82
2004 316 18,771 7,503,247 19,472.94
2005 279 19,473 7,398,552 20,509.51
2006 258 17,916 7,419,179 21,548.44
2007 204 18,455 7,119,464 22,583.60
2008 196 19,668 6,819,748 23,592.02
2009 218 25,917 7,356,793 24,698.49
2010 232 33,007 7,465,774 25,721.44
Table 5.8: Correlation coefficients of variables with population
Variable Pearson
Correlation Sig. (2-tailed)
GDP at constant price (Base: 1995-96) .964 .000
Consumption of grain (in thousand M.tons) .927 .000
Sanitation coverage (population in millions) .947 .000
Student in secondary schools .861 .035
Annual Development Programme expenditure (in crore Taka) .935 .000
Total generation of electricity (GWH) .974 .000
Cultivable land (in thousand acres) .269 .238
Estimation methodology
Step 1: Population projection for 2011-2020 using population growth rate estimated for
2001-2010 period
Step 2: Regress selected variables on population to obtain regression coefficients and
prepare regression model
Step 3: Prepare projection for 2011-2020 each selected variable using growth rate estimated
for 2001-2010 period
Step 4: Estimate optimum population for 2011-2020 using projected values of independent
variables in regression model prepared in step 2.
The Multiple Regression Model
Box 5.3: Multiple Regression Equation
R = 0.995 R2 = 0.992
Y = Population (in millions)
X1 = Cultivable land (in million acres)
X2 = Annual consumption of grain (in million M.ton )
X3 = Annual Development Programme expenditure (In million Tk.; Base: 1995-96)
X4 = Gross Domestic Product (in million Tk.; constant Price, Base: 1995-96)
X5 = Students in secondary school (in million)
X6 = Sanitation coverage (percent population)
X7 = Annual electricity generation (GWH)
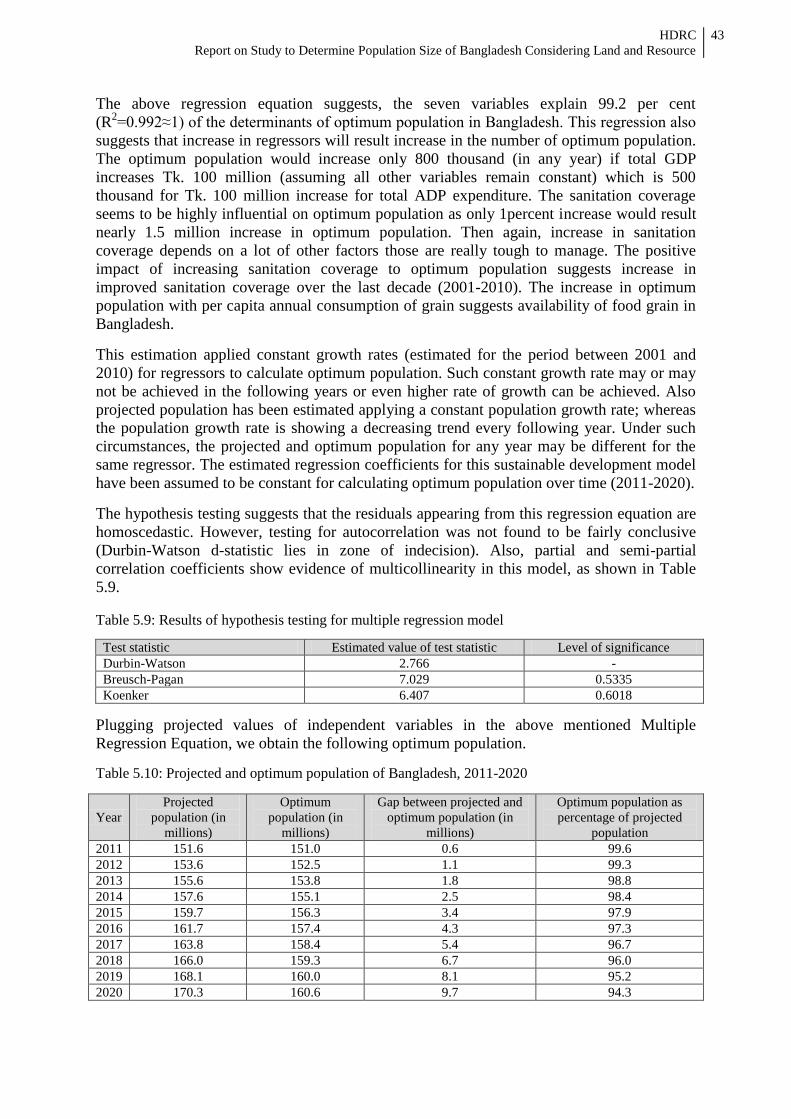
HDRC
Report on Study to Determine Population Size of Bangladesh Considering Land and Resource
43
The above regression equation suggests, the seven variables explain 99.2 per cent
(R2=0.992≈1) of the determinants of optimum population in Bangladesh. This regression also
suggests that increase in regressors will result increase in the number of optimum population.
The optimum population would increase only 800 thousand (in any year) if total GDP
increases Tk. 100 million (assuming all other variables remain constant) which is 500
thousand for Tk. 100 million increase for total ADP expenditure. The sanitation coverage
seems to be highly influential on optimum population as only 1percent increase would result
nearly 1.5 million increase in optimum population. Then again, increase in sanitation
coverage depends on a lot of other factors those are really tough to manage. The positive
impact of increasing sanitation coverage to optimum population suggests increase in
improved sanitation coverage over the last decade (2001-2010). The increase in optimum
population with per capita annual consumption of grain suggests availability of food grain in
Bangladesh.
This estimation applied constant growth rates (estimated for the period between 2001 and
2010) for regressors to calculate optimum population. Such constant growth rate may or may
not be achieved in the following years or even higher rate of growth can be achieved. Also
projected population has been estimated applying a constant population growth rate; whereas
the population growth rate is showing a decreasing trend every following year. Under such
circumstances, the projected and optimum population for any year may be different for the
same regressor. The estimated regression coefficients for this sustainable development model
have been assumed to be constant for calculating optimum population over time (2011-2020).
The hypothesis testing suggests that the residuals appearing from this regression equation are
homoscedastic. However, testing for autocorrelation was not found to be fairly conclusive
(Durbin-Watson d-statistic lies in zone of indecision). Also, partial and semi-partial
correlation coefficients show evidence of multicollinearity in this model, as shown in Table
5.9.
Table 5.9: Results of hypothesis testing for multiple regression model
Test statistic Estimated value of test statistic Level of significance
Durbin-Watson 2.766 -
Breusch-Pagan 7.029 0.5335
Koenker 6.407 0.6018
Plugging projected values of independent variables in the above mentioned Multiple
Regression Equation, we obtain the following optimum population.
Table 5.10: Projected and optimum population of Bangladesh, 2011-2020
Year
Projected
population (in
millions)
Optimum
population (in
millions)
Gap between projected and
optimum population (in
millions)
Optimum population as
percentage of projected
population
2011 151.6 151.0 0.6 99.6
2012 153.6 152.5 1.1 99.3
2013 155.6 153.8 1.8 98.8
2014 157.6 155.1 2.5 98.4
2015 159.7 156.3 3.4 97.9
2016 161.7 157.4 4.3 97.3
2017 163.8 158.4 5.4 96.7
2018 166.0 159.3 6.7 96.0
2019 168.1 160.0 8.1 95.2
2020 170.3 160.6 9.7 94.3
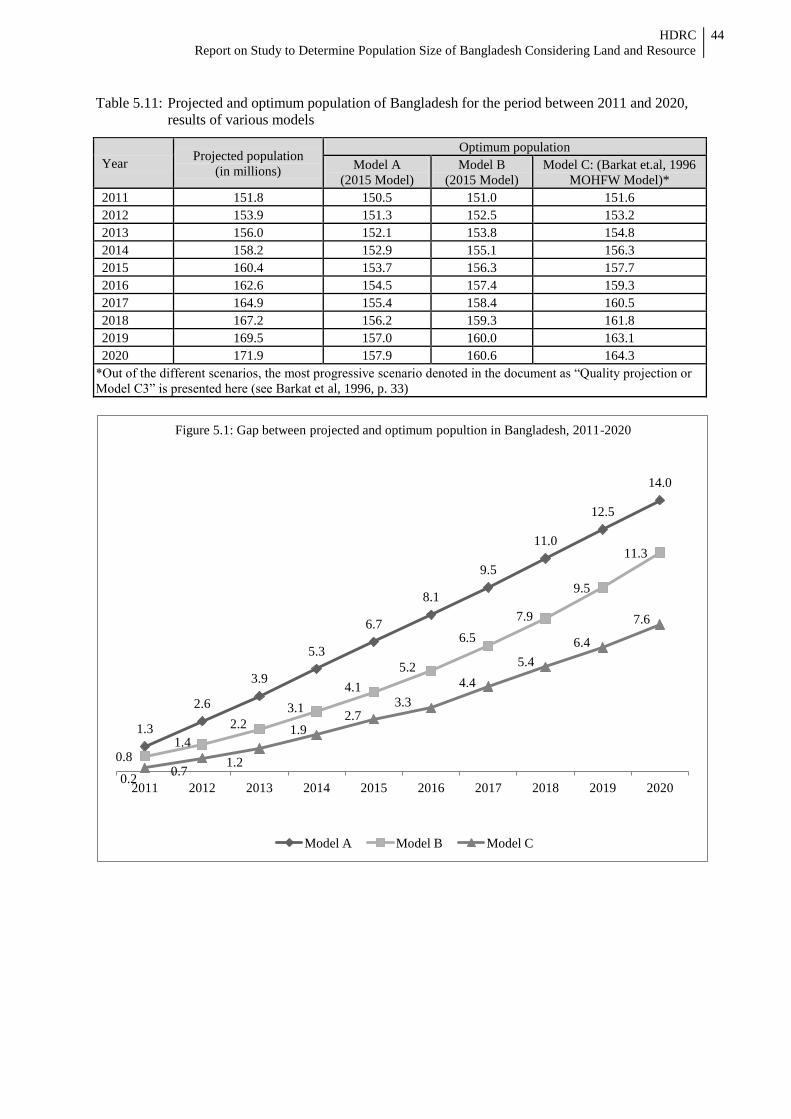
HDRC
Report on Study to Determine Population Size of Bangladesh Considering Land and Resource
44
Table 5.11: Projected and optimum population of Bangladesh for the period between 2011 and 2020,
results of various models
Year Projected population
(in millions)
Optimum population
Model A
(2015 Model)
Model B
(2015 Model)
Model C: (Barkat et.al, 1996
MOHFW Model)*
2011 151.8 150.5 151.0 151.6
2012 153.9 151.3 152.5 153.2
2013 156.0 152.1 153.8 154.8
2014 158.2 152.9 155.1 156.3
2015 160.4 153.7 156.3 157.7
2016 162.6 154.5 157.4 159.3
2017 164.9 155.4 158.4 160.5
2018 167.2 156.2 159.3 161.8
2019 169.5 157.0 160.0 163.1
2020 171.9 157.9 160.6 164.3
*Out of the different scenarios, the most progressive scenario denoted in the document as “Quality projection or
Model C3” is presented here (see Barkat et al, 1996, p. 33)
1.3
2.6
3.9
5.3
6.7
8.1
9.5
11.0
12.5
14.0
0.8 1.4
2.2
3.1
4.1
5.2
6.5
7.9
9.5
11.3
0.2 0.7
1.2
1.9 2.7
3.3
4.4
5.4
6.4
7.6
2011 2012 2013 2014 2015 2016 2017 2018 2019 2020
Model A Model B Model C
Figure 5.1: Gap between projected and optimum popultion in Bangladesh, 2011-2020

HDRC
Report on Study to Determine Population Size of Bangladesh Considering Land and Resource
45
CHAPTER 6
CONCLUSION
Two independent models have been developed under the present study to determine the
optimum population size for Bangladesh considering assumptions on land size and available
resources. In each of the models, we have estimated optimum population from 2011 to 2020,
on the basis of different projected population for the same 10 years.
In the First Model, the projected population of Bangladesh ranges between 150.3 million in
2011-12 and reaches 160.5 million in 2020-21. The optimum population sizes for 2020-21 in
this Model range between a low at 139.2 million which is most unlikely in real-life situation
and a high at 160.5 million which is logically more likely, other values of optimum
population sizes are in between these two. However, what is most striking noteworthy here is
that the optimum population size of Bangladesh in 2020-21 according to the highest value
(most likely situation) estimated using the First Model (160.5 million) and that using the
Second Model (160.6 million) were very much close (the difference is only 0.1 million). It is
also worth mentioning that the population projection, conducted twenty years ago from now
(in 1994-95) for the Ministry of Health and Family Welfare, came up with a projected
population size of 164.3 million for the year 2020 under the Family Planning Quality
Projection Scenario (Barkat et al, 1996). This means, for the year 2020, we have three
different projected population sizes, 160.5 million and 160.6 million under the present 2014
study and 164.3 million under 1994-95 study. The differences are not much significant.
Considering the projected population and optimum population, a renewed thrust over
population control program can be suggested from the fascinated anti-natalist policy
advocates. But as believer of humane development and peer observer of the country’s
demographic evolution, the present research team strongly believes that population is not
and/or will not be a problem for the country considering its resource base. Growing living
standard will impact negatively on the population growth in the long run. In the medium run,
distributive justice should be considered to better accommodate the needs of the people.
Present or future level of population should not be considered as burden or liability for the
country’s development rather a human resource approach to population will accelerate the
development of the country.
It is absolutely necessary to note here three broad perspectives pertaining to the growing
population as such and the optimum population. First, the countries which will be the most
fast growing in the next 2-3 decades are those having relatively higher population size (not
the opposite). But that will not be an automatic process, rather be an outcome of conscious
efforts towards new way of managing resources, namely human (implying transforming
human numbers into human resources or human capital), physical (roads, highways, bridges,
power and all other infrastructure), and natural (land, river, sea, gas, coal, and all other
mineral resources). Second, containing population to a reduced size or optimum size requires
people’s informed choice in terms of reproductive health including family planning (where
coercion will be counterproductive). And, third, containing optimum population will require
simultaneously addressing issues pertaining to the three broad reasons for incremental
population between now and 2020, which are (1) the issue of Population Momentum, (2) the
issue of Unwanted or Unintended Fertility, and (3) the issue of High Desired Family Size (or
in essence, the issue of son preference). Most scientific way of addressing these issues related
to the incremental population should be to vigorously pursue well designed and coordinated
programmatic (implying health, family welfare, family planning interventions) and non-

HDRC
Report on Study to Determine Population Size of Bangladesh Considering Land and Resource
46
programmatic (implying education especially female education, employment – both male and
female, women empowerment, changes in the legal inheritance laws in favour of women, and
overall development) interventions, nationwide. These joint concurrent interventions of
programmatic and non programmatic nature are necessary, because in terms of family
planning programme performance Bangladesh has most likely achieved the soft target in the
contraceptive prevalence rate (CPR).
HDRC
Report on Study to Determine Population Size of Bangladesh Considering Land and Resource
47
Annex
Primary Variable List
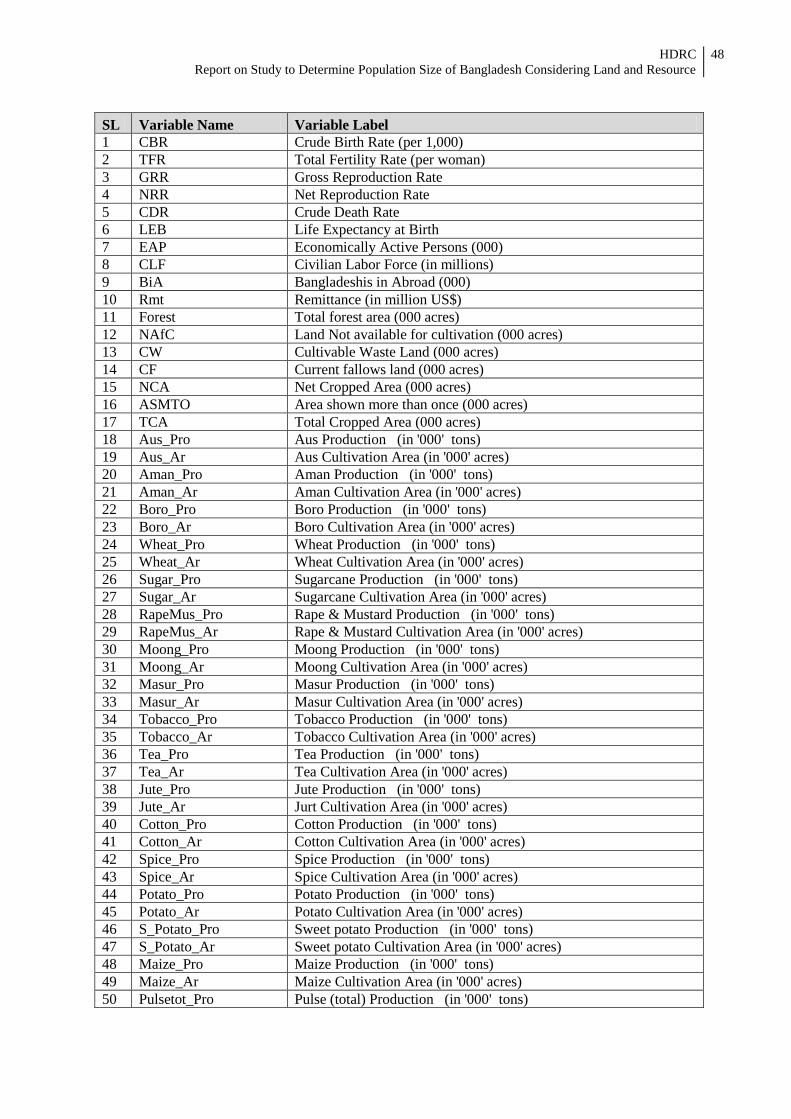
HDRC
Report on Study to Determine Population Size of Bangladesh Considering Land and Resource
48
SL Variable Name Variable Label
1 CBR Crude Birth Rate (per 1,000)
2 TFR Total Fertility Rate (per woman)
3 GRR Gross Reproduction Rate
4 NRR Net Reproduction Rate
5 CDR Crude Death Rate
6 LEB Life Expectancy at Birth
7 EAP Economically Active Persons (000)
8 CLF Civilian Labor Force (in millions)
9 BiA Bangladeshis in Abroad (000)
10 Rmt Remittance (in million US$)
11 Forest Total forest area (000 acres)
12 NAfC Land Not available for cultivation (000 acres)
13 CW Cultivable Waste Land (000 acres)
14 CF Current fallows land (000 acres)
15 NCA Net Cropped Area (000 acres)
16 ASMTO Area shown more than once (000 acres)
17 TCA Total Cropped Area (000 acres)
18 Aus_Pro Aus Production (in '000' tons)
19 Aus_Ar Aus Cultivation Area (in '000' acres)
20 Aman_Pro Aman Production (in '000' tons)
21 Aman_Ar Aman Cultivation Area (in '000' acres)
22 Boro_Pro Boro Production (in '000' tons)
23 Boro_Ar Boro Cultivation Area (in '000' acres)
24 Wheat_Pro Wheat Production (in '000' tons)
25 Wheat_Ar Wheat Cultivation Area (in '000' acres)
26 Sugar_Pro Sugarcane Production (in '000' tons)
27 Sugar_Ar Sugarcane Cultivation Area (in '000' acres)
28 RapeMus_Pro Rape & Mustard Production (in '000' tons)
29 RapeMus_Ar Rape & Mustard Cultivation Area (in '000' acres)
30 Moong_Pro Moong Production (in '000' tons)
31 Moong_Ar Moong Cultivation Area (in '000' acres)
32 Masur_Pro Masur Production (in '000' tons)
33 Masur_Ar Masur Cultivation Area (in '000' acres)
34 Tobacco_Pro Tobacco Production (in '000' tons)
35 Tobacco_Ar Tobacco Cultivation Area (in '000' acres)
36 Tea_Pro Tea Production (in '000' tons)
37 Tea_Ar Tea Cultivation Area (in '000' acres)
38 Jute_Pro Jute Production (in '000' tons)
39 Jute_Ar Jurt Cultivation Area (in '000' acres)
40 Cotton_Pro Cotton Production (in '000' tons)
41 Cotton_Ar Cotton Cultivation Area (in '000' acres)
42 Spice_Pro Spice Production (in '000' tons)
43 Spice_Ar Spice Cultivation Area (in '000' acres)
44 Potato_Pro Potato Production (in '000' tons)
45 Potato_Ar Potato Cultivation Area (in '000' acres)
46 S_Potato_Pro Sweet potato Production (in '000' tons)
47 S_Potato_Ar Sweet potato Cultivation Area (in '000' acres)
48 Maize_Pro Maize Production (in '000' tons)
49 Maize_Ar Maize Cultivation Area (in '000' acres)
50 Pulsetot_Pro Pulse (total) Production (in '000' tons)
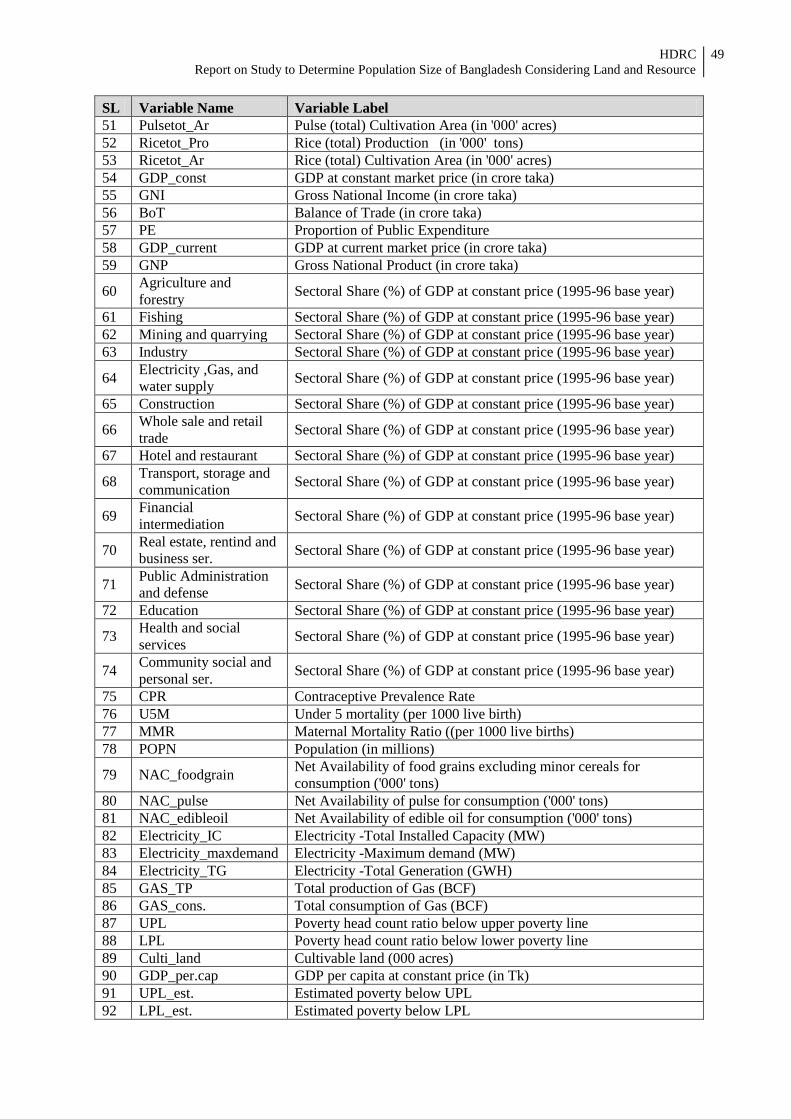
HDRC
Report on Study to Determine Population Size of Bangladesh Considering Land and Resource
49
SL Variable Name Variable Label
51 Pulsetot_Ar Pulse (total) Cultivation Area (in '000' acres)
52 Ricetot_Pro Rice (total) Production (in '000' tons)
53 Ricetot_Ar Rice (total) Cultivation Area (in '000' acres)
54 GDP_const GDP at constant market price (in crore taka)
55 GNI Gross National Income (in crore taka)
56 BoT Balance of Trade (in crore taka)
57 PE Proportion of Public Expenditure
58 GDP_current GDP at current market price (in crore taka)
59 GNP Gross National Product (in crore taka)
60 Agriculture and
forestry Sectoral Share (%) of GDP at constant price (1995-96 base year)
61 Fishing Sectoral Share (%) of GDP at constant price (1995-96 base year)
62 Mining and quarrying Sectoral Share (%) of GDP at constant price (1995-96 base year)
63 Industry Sectoral Share (%) of GDP at constant price (1995-96 base year)
64 Electricity ,Gas, and
water supply Sectoral Share (%) of GDP at constant price (1995-96 base year)
65 Construction Sectoral Share (%) of GDP at constant price (1995-96 base year)
66 Whole sale and retail
trade Sectoral Share (%) of GDP at constant price (1995-96 base year)
67 Hotel and restaurant Sectoral Share (%) of GDP at constant price (1995-96 base year)
68 Transport, storage and
communication Sectoral Share (%) of GDP at constant price (1995-96 base year)
69 Financial
intermediation Sectoral Share (%) of GDP at constant price (1995-96 base year)
70 Real estate, rentind and
business ser. Sectoral Share (%) of GDP at constant price (1995-96 base year)
71 Public Administration
and defense Sectoral Share (%) of GDP at constant price (1995-96 base year)
72 Education Sectoral Share (%) of GDP at constant price (1995-96 base year)
73 Health and social
services Sectoral Share (%) of GDP at constant price (1995-96 base year)
74 Community social and
personal ser. Sectoral Share (%) of GDP at constant price (1995-96 base year)
75 CPR Contraceptive Prevalence Rate
76 U5M Under 5 mortality (per 1000 live birth)
77 MMR Maternal Mortality Ratio ((per 1000 live births)
78 POPN Population (in millions)
79 NAC_foodgrain Net Availability of food grains excluding minor cereals for
consumption ('000' tons)
80 NAC_pulse Net Availability of pulse for consumption ('000' tons)
81 NAC_edibleoil Net Availability of edible oil for consumption ('000' tons)
82 Electricity_IC Electricity -Total Installed Capacity (MW)
83 Electricity_maxdemand Electricity -Maximum demand (MW)
84 Electricity_TG Electricity -Total Generation (GWH)
85 GAS_TP Total production of Gas (BCF)
86 GAS_cons. Total consumption of Gas (BCF)
87 UPL Poverty head count ratio below upper poverty line
88 LPL Poverty head count ratio below lower poverty line
89 Culti_land Cultivable land (000 acres)
90 GDP_per.cap GDP per capita at constant price (in Tk)
91 UPL_est. Estimated poverty below UPL
92 LPL_est. Estimated poverty below LPL
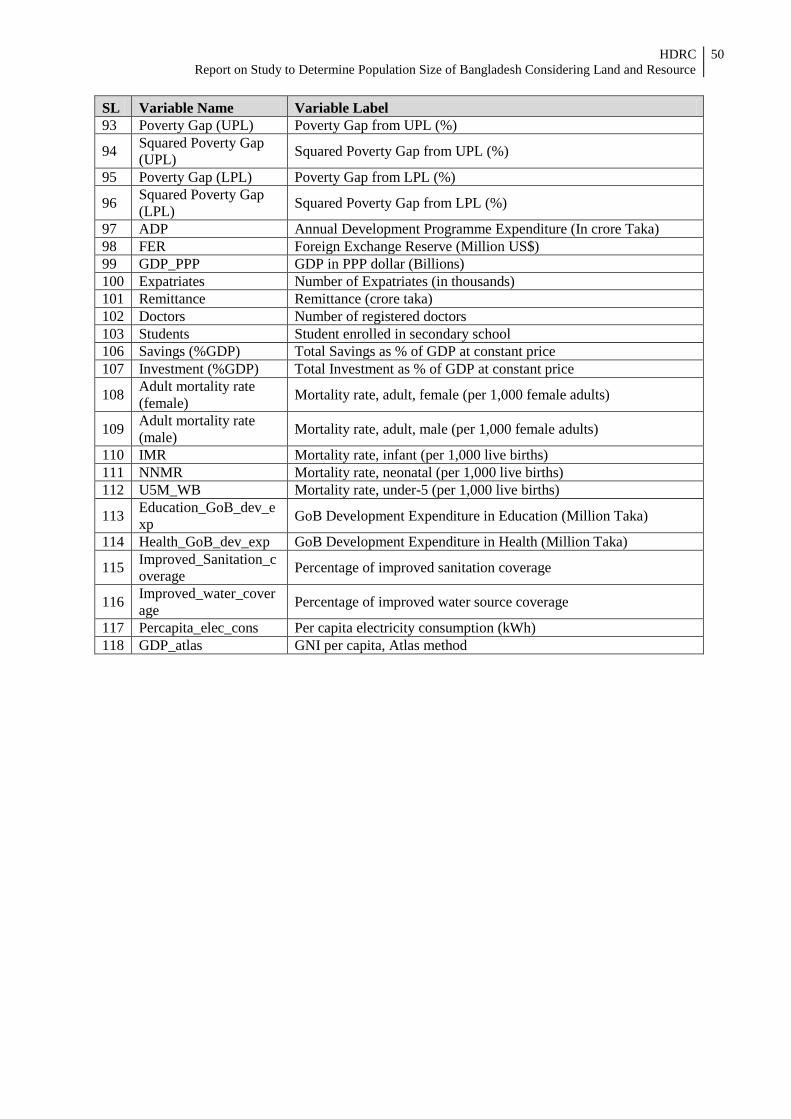
HDRC
Report on Study to Determine Population Size of Bangladesh Considering Land and Resource
50
SL Variable Name Variable Label
93 Poverty Gap (UPL) Poverty Gap from UPL (%)
94 Squared Poverty Gap
(UPL) Squared Poverty Gap from UPL (%)
95 Poverty Gap (LPL) Poverty Gap from LPL (%)
96 Squared Poverty Gap
(LPL) Squared Poverty Gap from LPL (%)
97 ADP Annual Development Programme Expenditure (In crore Taka)
98 FER Foreign Exchange Reserve (Million US$)
99 GDP_PPP GDP in PPP dollar (Billions)
100 Expatriates Number of Expatriates (in thousands)
101 Remittance Remittance (crore taka)
102 Doctors Number of registered doctors
103 Students Student enrolled in secondary school
106 Savings (%GDP) Total Savings as % of GDP at constant price
107 Investment (%GDP) Total Investment as % of GDP at constant price
108 Adult mortality rate
(female) Mortality rate, adult, female (per 1,000 female adults)
109 Adult mortality rate
(male) Mortality rate, adult, male (per 1,000 female adults)
110 IMR Mortality rate, infant (per 1,000 live births)
111 NNMR Mortality rate, neonatal (per 1,000 live births)
112 U5M_WB Mortality rate, under-5 (per 1,000 live births)
113 Education_GoB_dev_e
xp GoB Development Expenditure in Education (Million Taka)
114 Health_GoB_dev_exp GoB Development Expenditure in Health (Million Taka)
115 Improved_Sanitation_c
overage Percentage of improved sanitation coverage
116 Improved_water_cover
age Percentage of improved water source coverage
117 Percapita_elec_cons Per capita electricity consumption (kWh)
118 GDP_atlas GNI per capita, Atlas method
HDRC
Report on Study to Determine Population Size of Bangladesh Considering Land and Resource
51
REFERENCES
BANGLADESH BUREAU OF STATISTICS (2011).Population and Housing Census (2011).
[Online] March 2011. Available from: http://www.sid.gov.bd/wp-content/uploads/2013/01/
BANGLADESH-at-a-glance-Census-2011.pdf. [Accessed: 12th August 2014].
BARKAT, A. SUHRAWARDY, G. M. & OSMAN, A. (2015).Increasing Commercialization of
Agricultural Land and Contract Farming in Bangladesh: An Alternative Approach.Dhaka:
HDRC.
BARKAT, A. (2001). ManobUnnayanDarshon O BangladesherJonosankhyaSamotsha [(In English)
Human development philosophy and population problem in Bangladesh].in Swaranika of
National Convention 2001 of the BCS Family Planning Association and Bangladesh Upazila
Family Planning Officers Association, Dhaka.
BARKAT, A. et al. (1996a). Strategic Directions for the Bangladesh National Family Planning
Program: 1995-2005. Dhaka: Ministry of Health and Family Welfare.
BARKAT, A. et al. (1996b). Family Planning Unmet Need in Bangladesh: Basis for a Prototype
Family Planning Programme. Dhaka: University Research Corporation Bangladesh.
BASAK, J. K. (2012). Agriculture and Food Security in Bangladesh.In: Elusive Progress- State of
Food Security in Bangladesh 2012.Dhaka :UnnayanOnneshan.
BERLINSKI, D. (1976). On Systems analysis:An essay concerning the limitations of some
mathematical methods in the social, political, and biological sciences. Cambridge: MIT
Press.
BERNSTAM, M. S. (1991). The wealth of nations and the environment. In:Davis, K.&Bernstam M.
(eds.) Resources, environment, and population: Present knowledge, future options.Vol.
16.New York: Oxford University Press.
BONGAARTS, J. (1992). Population growth and global warming.Population and Development
Review.18 (2). p.299-319.
BOSERUP, E.(1981). Population and technological change: A study of long-term trends. Chicago:
University of Chicago Press.
BRASS, W. (1979).Note on how to improve the United Nations population projections. In Prospects
of population, methodology and assumptions. New York.
BROWN, L. R.& HAL, K. (1994).Full house: Reassessing the earth’s population
carryingcapacity.New York: W. W. Norton&Company.
BROWN, L. R., HAL, K. & AYRES, E. (1993).Vital Signs: The trends that are shaping our
future.New York: W. W. Norton & Company.
CARRYING CAPACITY NETWORK.(1992).In and out of focus.Focus: Carrying Capacity.1(2).
CASSEN, R. H. et al. (1994). Population and development: Old debates, new conclusions.U.K.:
Transaction Publishers.
CASSEN, R. H. (1993). Economic implications of demographic change.Transactions of the Royal
Society of Tropical Medicine and Hygiene .
CIPOLLA, C. M. (1974).The economic history of world population.6th Edition. England: Penguin.
CLARK, C. (1958). World population.Nature. 181. p. 1235-1236. [Reprinted in Davis Y.(ed.) (1971)
Readings in human population ecology.P.101-106. Englewood Cliffs, N.J.: Prentice-Hall].
COALE, A. J. (1974).The history of the human population.Scientific American. 231. p. 41-51.
COALE, A. J. (1970).Man and his environment.Science. 170. p. 132-36.
HDRC
Report on Study to Determine Population Size of Bangladesh Considering Land and Resource
52
COALE, A. J., and EDGAR, M. H. (1958).Population growth and economic development in low-
income countries:A case study of India’s prospects.Princeton: Princeton University Press.
COHEN, J. E. (1995). Population growth and the Earth’s human carrying capacity. Science.
COHEN, J. E. (1992). How Many People Can the Earth Hold?. New York: W.W. Norton &
Company.
COHEN, J. E. (1986). Population forecasts and confidence intervals for Sweden: A comparison of
model-based and empirical approaches.Demography.23(1).p. 26-105.
DAILY, G. C. and EHRLICH, P. R. (1992).Population, Sustainability, and Earth’s carrying capacity.
Bioscience.42 (10).
DALY, H. E. and COBB, J. B. (1989).For the common good: Redirecting the economy toward
community, the environment, and a sustainable future. Boston: Beacon Press.
DARWIN, C. G. (1952). The next million years. London: Hert-Davis. Reprint, Westport, Conn.:
Greenwood Press, 1973. Paperback, Garden City, N. Y.: Dolphin Books, Doubleday.
DASGUPTA, P. S. (1969). On the concept of optimum population.The Review of Economic
Studies.36 (3). p. 295-318.
DAVIS, K. and MIKHAIL, S. B. (eds.)(1990).Resources, environment, and population: Present
knowledge, future options. New York: Population Council, and New York / Oxford: Oxford
University Press.
DEMENY, P. (1988). Demography and the limits to growth.In: Teitelbaum, S.& Winter,
J.(eds.)Population and resources in Western intellectual traditions.
DORN, H. F. (1950). Pitfalls in population forecasts and projections.Journal of the American
Statistical Association.45 (251).
EHRLICH, P. R., EHRLICH, A. H. and DAILY, G. C. (1993).Food security, Population,
and Environment. Population and Development Review. 19 (1). p. 1-31.
EHRLICH, P. R. and EHRLICH, A. H. (1992).The value of biodiversity. Ambio. 21. p. 219-226.
EHRLICH, P. R. (1980). Variety is the key to life. Technology Review. 82 (5). p. 58-68.
EHRLICH, P. R. (1968). The population bomb.New York: Ballantine Books.
ENGELMAN, R. and LEROY, P. (1993).Sustaining water: Population and the future of renewable
water supplies.Washington, D.C.: Population and Environment Program, Population Action
International.
FEARNSIDE, P. M. (1986). Human carrying capacity of the Brazilian rainforest. New York:
Columbia University Press.
FREJKA, T. (1973).The future of population growth: Alternative paths to equilibrium.New York:
John Wiley.
GHOSH, P. K. (ed.)(1984). Population, environment and resources, and Third World
development.Vol. 5. Westport, Conn.: Greenwood Press.
GOVERNMENT OF PEOPLE’S REPUBLIC OF BANGLADESH.MINISTRY OF HEALTH AND
FAMILY WELFARE.(2012).Bangladesh Population Policy 2012.Dhaka: Ministry of Health
and Family Welfare.
GOVERNMENT OF PEOPLE’S REPUBLIC OF BANGLADESH.BANGLADESH BUREAU OF
STATISTICS. (2011). Population and Housing Census 2011, Preliminary Results.Dhaka:
Statistics Division, Ministry of Planning.
GOVERNMENT OF PEOPLE’S REPUBLIC OF BANGLADESH.BANGLADESH BUREAU OF
STATISTICS. (2010). Labor Force Survey 2005-06, 2010.Dhaka: Planning Division,
Ministry of Planning.
HDRC
Report on Study to Determine Population Size of Bangladesh Considering Land and Resource
53
GOVERNMENT OF PEOPLE’S REPUBLIC OF BANGLADESH. ECONOMIC ADVISER’S
WING .Bangladesh Economic Review.2012, 2011, 2010, 2009, 2006, 2005, 2004 and 2003.
Dhaka: Finance Division, Ministry of Finance.
GOVERNMENT OF PEOPLE’S REPUBLIC OF BANGLADESH.BANGLADESH BUREAU OF
STATISTICS. Statistical Year Book of Bangladesh. 1992, 1996, 1997, 2000, 2004-2012.
Dhaka: Statistics and Informatics Division, Ministry of Planning.
GOVERNMENT OF PEOPLE’S REPUBLIC OF BANGLADESH.BANGLADESH BUREAU OF
STATISTICS. (1994). Bangladesh Population Census, 1991, Analytical Report.Dhaka:
Planning Commission, Ministry of Planning.
GRETCHEN, C. D., EHRLICH, A. H. and EHRLICH, P. R. (1994).Optimum Human Population
Size.Population and Environment.15 (6).
HASSAN, N. et al. (2013). Trends in the availability of agricultural land in Bangladesh.Dhaka:
SRDI, NFPCSP.
HEILIG, G. K. (1994). How many people can be fed on earth? In: Lutz, W. (ed.) The future of world
population: What can we assume today. London: Earthscan.
HOMER-DIXON, T. F. (1992). Malthus in the real world: Environmental scarcity and the ingenuity
gap in development countries. Unpublished.
HUDSON, W. J. (1989). Population, food, and the economy of nations.In: David P. & Carl W. H.
(eds.) Food and natural resources. San Diego Calif.: Academic Press.
JEONG, D. and CHANG, S. (2007). Estimating Optimum Population for Sustainable Development: A
Case Study of South Korea.Environmental Health.7 (2).
KEYFITZ, N. (1991). Population and development within the ecosphere: one view of the
literature. Population Index 57, no. 1:22.
KEYFITZ, N. (1968). Introduction to the mathematics of population. Reading, Mass.: Addison-
wesley.
KING, J. (1987). Beyond economic choice: Population and sustainable development: The application
of a resource accounting method to long term development planning in the context of
population, resources and the environment.Edinburgh, Scotland: UNESCO and the
University of Edinburgh.
KIRCHNER, J. W. et al. (1985). Carrying capacity, Population growth, and sustainable
development.In: Dennis J. (ed.) Rapid population growth and human carrying capacity: Two
perspectives.Population and Development Series Number 15.Washington, D.C.: World Bank.
LUTZ, W., PRSKAWETZ, A. and SANDERSON, W.C. (eds.) (2002).Population and Environment:
Methods of Analysis.New York: The Population Council.
MALTHUS, T. R. (1960). An Essay on the Principle of Population, as it Affects the Future
Improvement of Society. New York: Modern Library.
MCNICOLL, G. (2005). Population and Sustainability.New York: The Population Council.
MEADOWS, D. H., MEADOWS, D. L. and RANDERS, J. (1992).Beyond the limits: Global collapse
or a sustainable future. London: Earthscan Publications.
MEADOWS, D. H. et al. (1974).The limits to growth: A report for the Club of Rome’s Project on the
Predicament of Mankind.2nd
Edition.. New York: Signet, New American Library.
MILLER, M. (1992).Has the United States exceeded its carrying capacity?
MUSCAT, R. (1985). Carrying capacity and rapid population growth: Definition, cases, and
consequences.In: Dennis J. (ed.) Rapid population growth and human carrying capacity: Two
perspectives.Population and Development Series Number 15.Washington, D.C.: World Bank.
HDRC
Report on Study to Determine Population Size of Bangladesh Considering Land and Resource
54
MYERS, N. (1992). Population/environment linkages: Discontinuities ahead?In: Imhoff, E.,
Themmen, e. &Willekens, F. (eds.) Population, environment and development.Amsterdam,
Netherlands/Berwyn, Penn.: Swets and Zeitlinger.
NABI, A.K.M.N. (2011). Urbanization, Environment and Population Growth.In Bangladesh
Population: Problems and prospects.Dhaka: Planning Commission.
NATIONAL ACADEMY OF SCIENCES (office of the Foreign Secretary). (1971). Rapid population
growth: Consequences and policy implications. Baltimore: Johns Hopkins Press.
NATIONAL RESEARCH COUNCIL. (1986). Population growth and economic development: Policy
questions. Washington, D.C.: National Academy Press.
NEAZ, A. A. N. (2013). Population Dynamics and Development Challenges in Bangladesh.Dhaka:
Planning Commission, Ministry of Planning.
PARSONS, J. (1977). Population Fallacies.London.
PIMENTEL, D. et al. (1994). Natural resources and an optimum human population.Population and
Environment: A Journal of Interdisciplinary Studies. 15. p. 347-69.
POSTEL, S. (1994).Carrying capacity: Earth’s bottom line. In: Brown, R. et al. ( eds.) State of the
world.New York: W. W. Norton.
SAMUELSON, P. A. and NORDHAUS, W. D. (2009).Economics: An Introductory Analysis.19th
Edition. New York: McGraw–Hill.
AUSTRALIA (SSCA). SENATE STANDING COMMITTEE. (1994). Australia: Population
‘Carrying Capacity’: One Nation, Two Ecologies. AGPS, Canberra.
SIMON, J. L. and KAHN, H. (eds.) (1984).The resourceful Earth: A response to global 2000.Oxford:
Basil Blackwell.
SINGER, S. F. (1972). A study of optimum population levels--a progress report. USA:
ProcNatlAcadSci
SINGER, S. F. (ed.) (1971). Is there an optimum level of population? New York: McGraw-hill.
SOBHAN, R. (ed.) (1991). The Decade of Stagnation. Dhaka: University Press limited.
THUROW, L. C. (1986). Why the ultimate size of the world’s population doesn’t matter. Technology
Review.
UN, DESA. (2013). World Population Prospects 2012 revision. New York: UN Population Division.