determination of trace element mineral/liquid partition coefficients in
TRANSCRIPT

Geochimica et Cosmochimica Acfa Vol. 53, pp. 31 IS-3130 Copyright 8 1989 Pergamon Press pk. Printed in U.S.A.
0016-7037/89fl3.00 + .oO
Determination of trace element mineral/liquid partition coefficients in melilite and diopside by ion and electron microprobe techniques
S. M. KUEHNER,’ J. R. LAUGHLIN,* L. GROSSMAN,’ M. L. JOHNSON,~ and D. S. BURNETT~ ‘Department of the Geophysical Sciences, University of Chicago, Chicago, IL 60637, U.S.A.
‘Department of Chemistry, University of Chicago, Chicago, IL 60637, U.S.A. ‘Department of Geological and Planetary Sciences, California Institute of Technology, Pasadena, CA 9 1125, U.S.A.
(Received February 6, 1989; accepted in revisedform September 15, 1989)
Abstract-The use of the ion microprobe for quantitative analysis of Sr, Y, Zr, La, Sm, and Yb in melilite and pyroxene is evaluated. Three trace element-doped synthetic glasses of composition Ah, Ak,, and D&AbAn were analyzed by ion microprobe (IMP) using ion yields determined from Coming glass stan- dards. IMP-determined oxide concentrations in the Di2AbAn glass agree well with electron microprobe (EMP) analyses (to within 6%), but IMP analyses of the melilite glasses deviate from EMP averages by up to 19%. The deviations are due to erroneous Si02 estimates caused by suppression of Si ion intensities by the enhanced concentrations of Ca and Al in the melilite glasses compared to the standards. Thus, in order to determine compositions of melilite, diopside, and glass from subliquidus experiments on each of the three starting compositions, we adopted a new set of ion yields such that IMP analyses of the three starting glasses reproduce the EMP average compositions. Further IMP and EMP comparisons of the subliquidus assemblages show that quantitative analyses of melilite, diopside, and glass can be obtained by IMP that are within 10% of the concentrations obtained by EMP, when ion yields determined from glass starting compositions are used. EMP-IMP comparison of crystal and glass analyses also suggests that a structural matrix effect may result in overestimation of SrO (lo-12%) in melilite by IMP.
Comparison of our data for Ak,z and Akw melilite compositions with literature results shows that melilite/liquid D-values for REE3+ determined by IMP decrease with increasing & (Akw: Db = 0.038, D Sm = 0.032, Dyb = 0.0086; Ak12: 0.67, 0.75, 0.25, respectively) while that for Sr (=Eu”) changes only slightly (0.99 to 0.78, respectively). Since &, increases with decreasing temperature for all melilite with XAk < 0.7, a progressively larger positive Eu anomaly is predicted for melilite as it crystallizes with falling temperature. Our diopside/liquid data are characterized by a large degree of scatter on most interelement correlation plots of apparent partition coefficients. The data cannot be understood in terms of simple models of boundary layer formation but require a complex surface partitioning explanation. Nevertheless, estimates of diopside/liquid D-values are in excellent agreement with literature data.
INTRODUCTION
EQUILIBRIUM PARTITIONING of trace elements between crys- tals and coexisting liquids has been used extensively to model the chemical evolution of a magma brought about by crystal fractionation processes. In favorable circumstances, differ- ences in whole-rock trace element concentrations between samples from a given magmatic center can be assessed in terms of fractionation of liquidus phase assemblages. Results of these studies may indicate, for example, a history of high pressure crystal fractionation of phases for which there may be no petrographic evidence (SHERATON et al., 1984), or pro- vide evidence for complex partial melting and magma cham- ber processes (LANGMUIR et al., 1977; PANKHURST, 1977).
Experimental studies by STOLPER (1982) and STOLPER and PAQUE (1986) show that some Ca-, Al-rich inclusions (CAIs) in carbonaceous chondrites represent closed-system, essentially total-crystallization products of partially molten droplets. With such presumably simple magmatic systems, studying the trace element evolution of the liquid during CA1 solidification should permit a sophisticated level of under- standing of the igneous processes. Alternatively, Type B CAIs originating by processes other than igneous crystallization may also be identifiable. Unlike terrestrial differentiation studies, however, separate aliquots of bulk material produced
during successive stages of crystallization inside single Type B inclusions are not available for analysis. The progressive change in liquid composition must instead be inferred by examining trace element zoning profiles within the crystal- lizing phases of the inclusion. In this case, it is necessary not only to understand quantitatively how trace elements are partitioned between crystals and liquid, as in terrestrial stud- ies, but it is also necessary to be able to obtain accurate anal- yses of trace elements at ppm concentrations from ‘spot’ lo- cations in single crystals. The purpose of this paper is to eval- uate the use of the ion microprobe in obtaining quantitative analyses of trace elements from the dominant phases in Type B CAIs, melilite and clinopyroxene. We also have utilized our results to investigate the partitioning behavior of selected elements between these phases and coexisting liquid.
Application of the ion microprobe to quantitative analysis of major and trace elements in geological samples has been evaluated in several studies, e.g. SHIMIZU et al. (1978), STEELE et al. (1981), RAY et al. (1983), and ZINNER and CROZAZ (1986). Routine quantitative chemical analyses by ion mi- croprobe have been hindered by the poorly defined roles of structural and chemical matrix effects on ion yields and by molecular ion interferences with analytical peaks of elemental ions. To evaluate these factors for eventual analysis of melilite and clinopyroxene in natural Type B inclusions, we have
3115

3116 S. M. Kuehner et al.
undertaken a combined electron probe-ion probe study of
these phases produced from synthetic CMAS and NaCMAS liquids doped with Sr, Zr, Y, La, Sm, and Yb at 0.30-1.3 oxide wt% levels. At these concentmtio~, crystals and glass can be characterized initially by electron microprobe analysis (EMP). Subsequent ion microprobe analyses (IMP) of the synthetic products can then be compared to results obtained by EMP and variables affecting the ion probe determinations adjusted, if necessary, to reproduce the compositions obtained by electron probe. In principle, identical spots can be analyzed by both techniques, eliminating possible problems associated with sample heterogeneity. The synthetic melihte and cli- nopyroxene samples can then be used as standards for ion probe analyses of the same phases in natural CAIs in which concentrations of these elements are too low for accurate analysis by the electron microprobe. Preliminary results of this study were reported by KUEANER et al. (1988).
EXPERIMENTAL
Synthetic melilite crystals were grown from two starting compo- sitions, Ak.,r, and Akso (molar), and diopside was grown from a DizAbAn (molar) composition. Minor elements were added to syn- thetic oxide mixes of each starting composition by means of a nitric acid solution and the mixtures dried in open Pt tubes at 1000°C. To ensure chemical homogeneity in the starting mixes, the dried powders were fused in sealed Pt tubes at 1310°C and finely ground in a ball mill. The fusion and grinding process was then repeated. Experiments were performed in a 1 atm furnace. In order to reduce the number of crystal nuclei in the charge and provide for growth of fewer but larger crystals more suited for IMP analysis, the general synthesis procedure (see footnotes to Table 4 for details) was first to hold the sample at a temperature slightly above the liquidus for l-2 h. The temperature was then reduced such that the charge rapidly entered the melilite + liquid or diopside + liquid phase field. Following a S- 28 h period, the charge was quenched. This type of thermal history is not optimum for partition coefficient studies due to the possibility of boundary layer development during rapid crystal growth when the charge enters the temperature regime of the two-phase field. Nev- ertheless, samples suitable for electron probe/ion probe comparison were produced. In a synthesis more suitable for partition coefficient measurements (JONES and BURNETT, 1987), the temperature in one diopside synthesis experiment, 35-5B, was dropped about 10 C” from
TABLE 1 Operetlng Condltlons for the Eleclron Microprobe
a slightly superliquidus temperature in order to produce seed crystals, then reduced slowly to a temperature 65°C below the liquidus.
Electron ~~cro~ro~e methods
Because the quality of the ion probe analyses of the synthetic run products depends on the quality of electron probe analyses, consid- erable care was taken in the setup procedures of the latter instrument. All samples and standards were analyzed using wavelength dispersive techniques on an automated CAMECA SX-50 electron microprobe at the University of Chicago. Operating conditions were 15 kV, 25 nA and 30 set peak and background counting times for major ele- ments (Na, Mg, AL Si, Ca) and 25 kV, 200 nA and 120-360 set for minor elements (Table 1). The beam diameter was fixed at 5 Frn for each routine. Step-scans of count rates were collected up to 1200 sin B units on either side of the peak position and background offsets were placed symmetrically about the peak at positions free of inter- fering spectral lines. It was not possible to locate Sr Lar, back8round positions by this method due to interference with a Si IS, satellite peak on the low sin 8 side of the Sr peak. Background counts for Sr Lot, were obtained by collecting counts at the high sin 0 position and assuming a flat background under the peak. The soundness of this approach was verified by analysis of Sr-free standards.
Amelia albite and synthetic glass standards were used in calibration of the analyzed elements (Table 1). With the exception of Na, a calibration was not accepted until analysis of the standard, as an unknown, reproduced the calibration count rate to within 1%. Because of the mobility of Na under electron bombardment, up to a 2% dif- ference in count rates was accepted for this element. Sodium migmtion under the electron beam was not specifically evaluated, but was min- imized by putting Na first in the analysis routine and by using a 5 pm wide beam. Oxide totals from Na-bearing samples and standards rule out large amounts of Na loss under these analytical conditions. The possibility of minor element mobility under the 25 kV, 200 nA conditions was only examined through replicate analysis of several spots. No consistent or significant variation in minor element con- centrations was observed.
Superliquidus quench glasses of each starting composition were analyzed in two stages with the electron microprobe. Each sample was first analyzed for major elements, and the coordinates of each point recorded. Operating conditions were then adjusted for minor element analyses and the previously stored points relocated. All other samples were analyzed using an automatic two-condition analysis routine in which major elements were determined, the current and accelerating voltage were changed, and minor elements were deter- mined before moving to the next spot. Each analytical routine au- tomatically checks, and updates if necessary, the beam current to the desired run conditions at the onset of each analysis. Beam currents
Standard StafldEKl Cont. (wt %j
Crystal Counting Sackgmund Minimum Cetenion unc.t iime(sec) Offsew ti~it## (wt %) (20)
Na20 MgO Al203 SiOz cso
Amelia Aiblte Diopside Glass Amelia Albits Amelia Albite Diopside Glass
11.67 TAP 30 600 .- 0.02 18.62 TAP 19.42 TAP :::
1000 _._ 0.09 1000 .._ 0.15
66.71 TAP/PET 900 . . 0.15 25.90 PET % 500 0.24
SrO X-Glass 0.804 PET 120 400” 0.004 0.010 y203 REE 3 4.076 PET 120 400 0.006 0010 za X-Glass %I PET 120 500 0.004 0.016 t-a203 REE 3
4:256 LIF 160 800 0.006 0.013
Sm203 REE 2 LiF 180 450 0.008 0.006 yb24 REE 2 4.259 LIF 360 550 0.001 0.004
Amelia Albte -- nature!; refz Smilh and Ribbe (1966). Dicpside Gtass --synthetic; prepared by J. aOyd. Geophysical Lab. X-Glass -- synthetic: made by Corning Glass end distributed by A. Chados at Cal Tech. REE 2. REE 3 -- synthetic glasses; ret: Drake and Weill (1972).
** Backgmund counted only on 1 side of peak, peak count5 determined by assuming a flat background.
# 105Sin6
Ye Calculated following Reed (1973); values apply to all analyzed samples.
t Typical analytical uncertainty for meMite and diopside samples based on counting statistics tar a single analysis.

Partition coefficients for melilite and diopside 3117
during a time period equivalent to one analysis ( 18 min) were found to be within 1% of the nominal value.
Ion probe methods
Ion probe analyses were obtained with a modified AEI IM-20 in- strument at the University of Chicago, using a mass filtered 160- primary beam and an accelerating voltage of 20 kV (HINTON et al., 1988). A sample current of 20 nA, which produced an elliptical beam spot of -20 X 30 pm, was used in analyses of the quenched starting glasses. Because of the increased spatial resolution required for crystal/ glass samples, the primary beam current was reduced to 10 nA for these analyses, making a spot size of 10 X 15 pm. All samples and standards were carbon coated.
A critical condition for quantitative ion probe analyses at low mass resolution (300-500) is the elimination of molecular ion interferences at the nominal masses of elemental ions. Secondary molecular ions produced from silicate matrices possess, in general, less kinetic energy than monatomic ions (SHIMIZU et al., 1978) and, consequently, mo- lecular interferences can in most cases be suppressed by making mea- surements at high ion energies. Instrument settings for this study, in which the composition of the samples was known (Table 2), were determined by first making a preliminary computer controlled mass scan from mass 200 through mass 7 on glass sample 35- 1, counting at each mass for one second. This scan identified all elements in the sample, as well as many molecular interferences. A second mass scan was then obtained using energy filtering. This resulted in the suppres- sion of molecular ion intensities by factors of 275-1000, while the intensity of monatomic ions was reduced only by factors of 20-100. On the Chicago instrument, energy filtering is produced by adjusting the voltage across a small wire located close to the beam spot. The absolute energy of transmitted ions cannot be determined by this device, but HINTON et al. (1988) estimate that it is -30 eV. The efficiency of energy filtering in eliminating molecular interferences was evaluated by comparing the ratio of count rates of different iso- topes of a particular element to the known ratio of their isotopic abundances. Of 28 isotopic ratios measured with energy filtering for 7 elements, 22 ratios were within 10% of their expected values. Of tde latter, 20 ratios were within 20 counting uncertainties of their expected values. Each of the six isotopes whose ratios differed by more than 10% was of low abundance, accounting for no more than 6% of the total natural abundance of the element. These isotopes
were not used for quantitative analyses. This comparison shows that the analytical technique used in this study was successful in reducing molecular interferences to acceptable levels. Thus, using the most intense peaks for analysis, any contribution from molecular inter- ferences is insignificant. The mono-isotopic elements Na, Al, and Y were assumed to be interference-free.
During quantitative analyses, intensities were measured at the fol- lowing masses: 1743172n, 154,152~m, 139h 94,92,91.%zr, 89y, 88.87.86sr,
40Ca, 30*2sSi, 27Al, 25,24Mg, Z3Na. Each scab cycled from mass 200 to mass 7 with two-second counts at each of the nominal mass positions of interest. Each analysis is the result of summing the counts collected from 5-10 scans through the mass spectrum. Background and dead- time were negligible. Uncertainties in IMP data due to counting sta- tistics are <2%, except for Zr in meliite where they reach a maximum of 5%.
Absolute intensities of an element in a given matrix can be highly variable, on a day-today basis, due to subtle differences in instrument tuning. Therefore, the intensities of secondary ions are typically nor- malized to a single element. As the number of Ca cations in the structural formula of melilite is constant throughout the gehlenite- akermanite solid solution series (2.000), we assumed the Ca concen- tration in melilite analyses and normalized our intensity data to 40Ca. For glass analyses, intensity data were normalized to ““Ca but no assumption of Ca content was made. All analyses were re-normalized to 100%. Relative ion yields for Ca, Al, Mg, Si, and La used in analysis of the quenched starting glasses (Table 3) were determined from Coming V-, W-, and X-glasses. Ion yields used in analysis of Sm and Yb were estimated from the ion yield of La (HINTON et al., 1988); the ion yield of Na was extrapolated from the values of Rb and K as determined from the Coming X- and V-glasses, respectively. Although adjustments to the values of the ion yields were subsequently made for analyses of crystal-bearing samples, the Coming glass standards were analyzed at the beginning of each day to check for consistency in instrument tuning: relative ion yields obtained from the standard glasses changed by <5% on a day-to-day basis.
Glasses
RESULTS
The range and mean concentration of each element oxide in the superliquidus glasses made from each starting mix as
3118 S. M. Kuehner et al.
TABLE 3 Comparison of secondary Ion yields !ra!ative to Ca)t calculated from electron prtbe average compositions of the starting glasses with Ion yields determlned from Corning glass standards.
Element Corning Glasses’
1 .oo 1 .oo 1 .oo 1 .oo 1.05 1.04 ,994 ,953
Si 460 ,484 ,415 ,385 Al 1.17 1.19 1.20 1.18 Na ,420 ,375 ___ _._
SC ,343 ,346 ,349 ,374 Y ,418 ,401 ,392 ,363 Zr ,273 266 ,249 ,239 La ,213 ,220 ,230 231 Sm 260 247 ,263 ,265 Yb ,183 ,189 ,200 ,193
t w&) (,cdCcaj where I is the ion probe count rate, C is the concentration determlned by
electmn micropmbe and X is an element other than Ca. l Ion yields for Sr. Y, Zr determined from X-glass; La from W-glass; Ca, Mg, Si, Al are
averages from V-, W- and X-glasses; see text for Na, Sm. Yb.
determined by EMP analyses are listed in Table 2 (see foot- notes to Table 2 for synthesis details). EMP data from each glass composition were collected from several automated straight-line traverses, each containing 13-20 analysis points spaced lo- 100 pm apart, depending on the size of the glass chip. For most oxides, 2~ standard deviations in each glass composition are slightly greater than typical 2a uncertainties expected from counting statistics given in Table 1. Neverthe- less, because EMP precision depends upon additional factors, all three glass compositions could be homogeneous in both major and minor elements. Moreover, the coefficient of vari- ation (cv = 100 X 2u/z) is (4% for most oxides, which is sufficient homogeneity for the purposes of this study. A com- paratively wide variation in ZrOz concentrations (cv = 10%) was obtained, however, in the D&AbAn glass (35-l). Also, in each sample, a systematic variation in SiOz was observed as a function of time during typical microprobe sessions (20 = 0.55-0.77, cv = 1.4-2.6%). Because Si counts were initially collected using a PET crystal in order to optimize spectrom- eter counting times, the range in concentration of SiOz is probably an analytical artifact and not due to sample het- erogeneity. This conclusion is based on the occurrence of the Si peak position near the end of the range of spectrometer motion for the PET crystal on the Cameca instrument. Con- sequently, the Si peak position may not be routinely repro- duced with as much precision on PET as on the more rou- tinely used TAP crystal, where the spectral position of Si lies nearer the center of the range of spectrometer motion. We do, however, consider the range in ZrOz concentration in 35-1 (0.25 wt%) a real chemical heterogeneity resulting from sample preparation. During this process, minor elements were introduced into the starting mix in the form of an acid so- lution, but drying the resulting mixture at 1000°C may have produced refractory Zr oxides which were slow to dissolve at the superliquidus temperature of 35-l (13 1 S’C). A much smaller range of ZrOz concentrations is observed in samples Ah,,- 1 and Akso- 1, consistent with the higher superliquidus run temperatures of these compositions (1526 and 14 17”C, respectively). A similar interpretation may apply to the Y203 analyses (cv = 6-8%). The variation in Na20 in sample 35- 1 (cv = 10%) is assumed to be due entirely to mobilization under the electron beam.
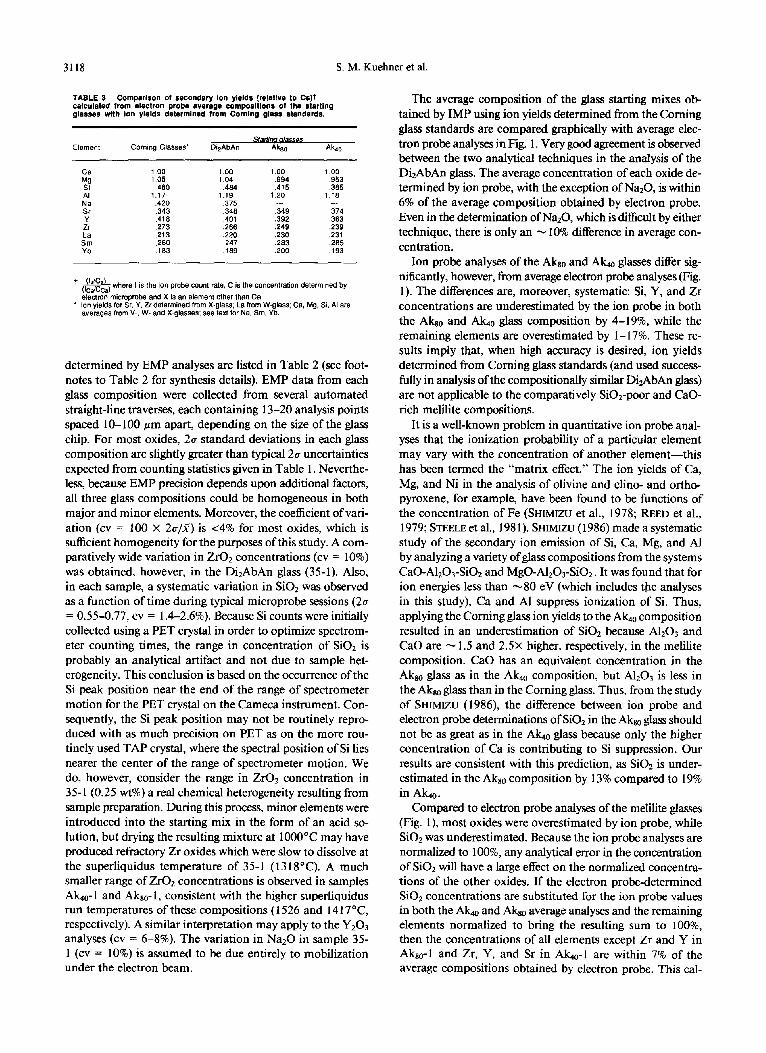
The average composition of the glass starting mixes ob- tained by IMP using ion yields determined from the Corning glass standards are compared graphically with average elec- tron probe analyses in Fig. 1. Very good agreement is observed between the two analytical techniques in the analysis of the Di*AbAn glass. The average concentration of each oxide de- termined by ion probe, with the exception of NazO, is within 6% of the average composition obtained by electron probe. Even in the determination of NazO, which is difficult by either technique, there is only an - 10% difference in average con- centration.
Ion probe analyses of the Akgo and Ab glasses differ sig- nificantly, however, from average electron probe analyses (Fig. 1). The differences are, moreover, systematic: Si, Y, and Zr concentrations are underestimated by the ion probe in both the Akso and Ah0 glass composition by 4-19%, while the remaining elements are overestimated by l-17%. These re- sults imply that, when high accuracy is desired, ion yields determined from Coming glass standards (and used success- fully in analysis of the compositionally similar DizAbAn glass) are not applicable to the comparatively SiOz-poor and CaO- rich melilite compositions.
It is a well-known problem in quantitative ion probe anal- yses that the ionization probability of a particular element may vary with the concentration of another element-this has been termed the “matrix effect.” The ion yields of Ca, Mg, and Ni in the analysis of olivine and clino- and ortho- pyroxene, for example, have been found to be functions of the concentration of Fe (SHIMIZU et al., 1978; REED et al., 1979; STEELE et al., 198 1). SHIMIZU ( 1986) made a systematic study of the secondary ion emission of Si, Ca, Mg, and Al by analyzing a variety ofglass compositions from the systems CaO-A1203-SiOz and MgO-A1203-Si02. It was found that for ion energies less than -80 eV (which includes the analyses in this study), Ca and Al suppress ionization of Si. Thus, applying the Coming glass ion yields to the Aho composition resulted in an underestimation of SiOz because A1203 and CaO are - 1.5 and 2.5X higher, respectively, in the melilite composition. CaO has an equivalent concentration in the Akso glass as in the Ab composition, but A1203 is less in the Akso glass than in the Coming glass. Thus, from the study of SHIMIZU (1986), the difference between ion probe and electron probe determinations of SiOz in the AkgO glass should not be as great as in the Ab glass because only the higher concentration of Ca is contributing to Si suppression. Our results are consistent with this prediction, as SiOz is under- estimated in the Akso composition by 13% compared to 19% in A~Q,,.
Compared to electron probe analyses of the melilite glasses (Fig. l), most oxides were overestimated by ion probe, while SiOz was underestimated. Because the ion probe analyses are normalized to 1 OO%, any analytical error in the concentration of SiOz will have a large effect on the normalized concentra- tions of the other oxides. If the electron probe-determined SiOz concentrations are substituted for the ion probe values in both the Ab and Akao average analyses and the remaining elements normalized to bring the resulting sum to lOO%, then the concentrations of all elements except Zr and Y in Akso-1 and Zr, Y, and Sr in Ak,--1 are within 7% of the average compositions obtained by electron probe. This cal-
Partition coefficients for melilite and diopside
40 1.0 - 9
La 6 F
+
h - + 3 30 : 3 0.6 0 0 t- : . 0 E
20 : x 0
0.6 - 0
Z IO : 0
l
0. 0.4 -
De 0 I I 1 0.2 I 1 I
SiO, A1203 MgO CaO Sr Y Zr La Sm Yb
3119
50
40
r 3 3o
E x 2o 0
IO
0
S102 A1203 MgO CaO
1.4
E 1.0 3 w 0.8 n
g 0.6
0.4
0.2
Sr i
I I I I
Zr La Sm Yb
20 1.6
0.
60 1.4 -
15 - 1.2 - t r
l!l*
4 i
b?
3 l 5 1.0 - 0. IO ; 0. 0. .
E n* 50 g 0.8 -
x x * 0.
05 - 0 0.6 - 0 EMP
: D12AbAn 00 0.4 - q * 0: l IMP
0 . 0.2 . I I I I I I
A’203 CaO s102 Sr Y Zr La Sm Yb
MgD Na,O
FIG. 1. Comparison of average EMP and IMP determinations of major and trace element concentrations in the synthetic starting glasses. IMP analyses were obtained using ion yields calculated from Coming glass standards. Vertical bars show the range in oxide concentrations for cases where the range is larger than the symbol. Note separate scale for SiOZ in the D&AbAn plot
culation suggests that variations in the ion yield of Si are the major cause of the erroneous ion probe results for the melilite glass compositions. We do not have an explanation for the irregularities in Sr, Y, and Zr concentrations.
According to the study of SHIMIZU (1986) matrix effects disappear in CMAS compositions when only those ions hav- ing energies > 80 eV are analyzed. Although this is a preferred analytical approach, it is not practical for the Chicago in- strument because it would result in a significant loss of ion intensity. Because the eventual purpose of our work is in analyzing natural melilite and pyroxene and not in developing analytical techniques for a wide variety of phases, we have corrected for the differences in the analysis of the D&AbAn and melilite glasses simply by adopting one set of ion yields for each of the three glasses such that ion probe analyses of each glass composition will reproduce the electron probe-
determined averages. A listing of these ion yields is given in Table 3. The new ion yields were used in the analysis of the synthetic crystal/liquid systems. Although the D&AbAn glass is compositionally different from crystalline diopside, either set of ion yields on Table 3 (Coming glass or Di,AbAn) would give the same concentrations for crystalline diopside to within 10%. The melilite glass ion yields will give accurate analyses of crystalline melilite.
Crystal/liquid systems
SEM examination of melilite crystals produced in subliq- uidus runs from Akso starting compositions shows that they are - 150 X 200 pm in size, they occur singly or in small clusters, and have stout, blocky shapes (Fig. 2). Conical, or sometimes dendritic, overgrowths, - 15 pm long, have de-

3120 S. M. Kuehner et al.
FIG. 2. Backscattered electron image of synthetic melilite grains and glass. Note the bright, trace element-rich boundary layer sur- rounding each grain and the quench crystal growth on melilite comers. Dark regions at lower right and lower left are epoxy.
veloped on all crystal corners which were in contact with the liquid during quenching. Backscattered electron (BSE) im- aging shows that, in addition, a bright fringe region in the
glass -2 pm wide, borders the outer margin of each melilite grain and grades outward into the adjacent glass. These fringe regions are enriched in the trace elements that are incom- patible in melilite (all except Sr), with concentrations up to 3X those in the homogeneous glass away from the crystals. Electron probe traverses across individual melilite grains show that they are AkW in composition and homogeneous in major elements and Sr0. Profiles of minor elements (except Sr), however, show U-shaped composition gradients across the crystals, with progressive en~chment of trace elements toward the rims. Two of these profiles are illust~t~ in Fig. 3. These profiles cannot be due to contaminating X-rays from the ad- jacent glass. The homogeneous major element concentrations and possibly the euhedral form of the melilite grains indicate that diffusion of major elements was rapid compared to crystal growth and surface equilibrium was maintained. The fringe regions in the glass, however, represent trace element-rich boundary layers which developed in the liquid adjacent to the growing melilite crystals. Assuming melilite crystal growth occurred over a small fraction of the total run time, it is surprising that such narrow boundary layers were not erased by diffusion. A possible explanation is that precipitation of submicron, incompatible element-rich phases took place in the boundary layer. The fringe regions imply that incom- patible element diffusion away from the crystal/liquid inter- face was slower than crystal growth. This resulted in the reg- ular increase of trace element concen~tions in the melilite rim in response to progressive enrichment of minor elements in the adjacent boundary layer during crystallization. As seen in Fig. 2, the boundary layers thin out and disappear around the overgrowths on melilite crystal corners. This indicates that formation of the overgrowths disrupted the boundary layers. Thus, the overgrowths formed last, probably during quenching, and the bright fringes are not quench features.
All melilite grains in the crystal/glass chips examined from Albo starting compositions are broken crystals. BSE exami- nation of crystal fragments shows that trace element-rich boundary layers also developed in these runs. Random EMP analyses indicate that the melilite grains are Aklz in com- position and homogeneous in major element content and in SrO, and that enrichment of minor elements occurs toward crystal margins.
BSE examination of diopside grains produced from D&AbAn starting compositions shows that prominent, trace element-rich boundary tayers did not form in these charges. EMP analyses of glass adjacent to diopside grains produced in both the isothermal (354A) and controlled cooling ex- periments (355B) show that of all trace elements, only ZrOz is enriched at the crystal/liquid interface relative to the glass at about 100 pm from the diopside grains, and only by 7%. Even though there was not pronounced boundary layer de- velopment in our D&AbAn runs, there is a broad range of trace element concentrations in diopside crystals produced in both cooling histories, with in~~dual trace elements varying in concentration by 20-50%. These will be discussed in detail later.
The 355B glass is relatively homogeneous, but does show small (S- 10%) correlated major element variations lying along a diopside removal trend relative to the starting liquid com- position. There are, however, large scale inhomogeneities in the “isothermal” (i.e., rapidly-cooled) sample, 35-4A. In it,
the crystais are all localized in one portion of the charge. Regions of glass 300-500 pm from the crystals have a major element composition close to the starting composition but, within about 50-100 pm of the crystals, the glass composition is within the range found for the slowly cooled sample, 355B.
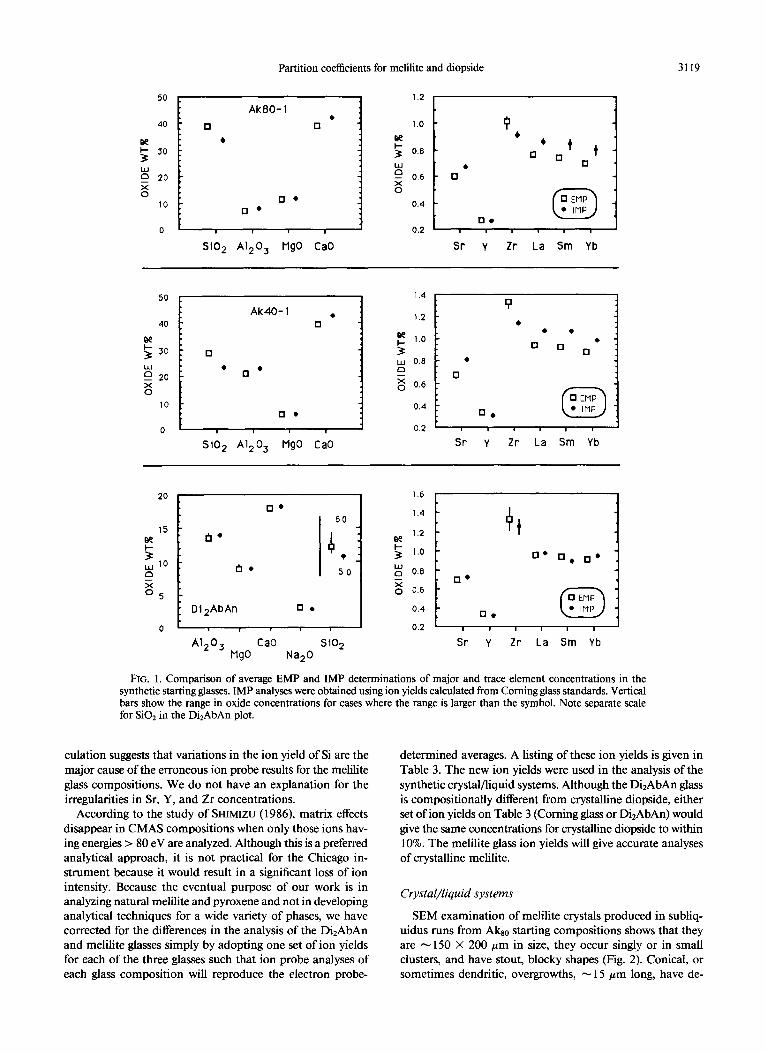
Having characterized the crystal/glass samples through detailed EMP and SEM evaluation, IMP analyses were then obtained from these samples using the ion yields calculated from the EMP averages of the starting glass com~sitions (Table 3). Specifically, the Akao glass was used as the standard for sample Akso- 12, the Akzo glass for sample Ab-SA, and the DizAbAn glass for samples 354A and 35-5B. Because of heterogeneity in the crystalline samples, the average and composition range obtained by EMP and those obtained by IMP are illustrated in Fig. 4 for both glass and crystals in each of the crystal/glass samples. As there are very few cases
Rim - Core - Rim Rim -Care - Rim
FIG. 3. EMP profiles of minor element oxides across two different synthetic crystals of Akpo. Analysis points are approximately equi- distant from one another. Left traverse is 190 pm long. Right is 220 pm long.

Partition coefficients for melilite and diopside 3121
in which the identical spot was analyzed by both techniques, the average composition determined by IMP and the average composition determined by EMP are listed for each sample in Table 4.
The comparisons show very good agreement between the averaged IMP and EMP analyses of Akr2 and Akg, melilite crystals and their coexisting glasses. For all oxides, the average IMP analysis of the Akiz melilite and coexisting glass agree to within 6% of the EMP average, except for St-0 in melilite, which agrees to within 11%. Similarly, the major element oxides in Ak% melilite, and major and trace element oxides in the coexisting glass agree to within 6% ofthe EMP average. The average trace element oxide concentrations in the Akgo melilite determined by IMP differ from the EMP average by 14% (SrO) to 56% (YbrO3). The dissimilar results for trace element oxides in Akw melilite, which was analyzed by both techniques concurrently with the coexisting glass, are very likely due only to their low concentrations in this phase, which approach the detection limits of the EMP. The 14% agreement between techniques for SrO is close to the 11% measured in the Akir melilite, which also has a similar St0 concentration (-0.6 wt%).
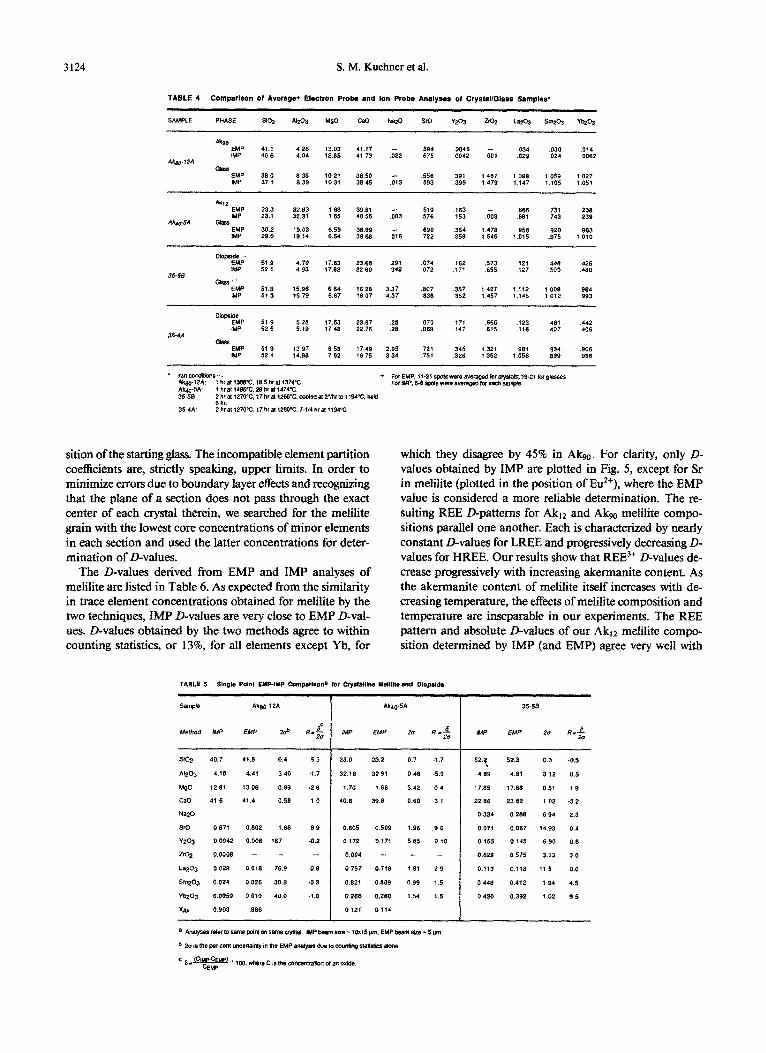
Similar conclusions to those drawn from the comparison of average IMP and EMP melilite compositions result when individual IMP and EMP analyses obtained from the same spot on a melilite grain are examined. Listed on Table 5 are two such comparisons of analyses obtained from spots on Aklz and Akw melilite crystals. In this table, 2a, the relative uncertainty in the EMP analysis due only to counting statis- tics, as well as R, the ratio of the relative difference between IMP and EMP data to 2a, are given for each oxide. Among major element oxides, when 2a < 2%, R can be as large as 3-5. When 2a is 3-S%, R < 2. This indicates that real dis- crepancies between IMP and EMP data may be present, but only at the several percent level for major element oxides. It is seen that the same holds true for minor element oxides when EMP counting statistics are good, as is the case for the relatively high concentrations found in Ak,z melilite. When EMP counting statistics for minor element oxides is poor, as in Akw , R -e 1. For both melilite compositions, this indicates excellent agreement between the two techniques for all oxides except SrO, for which the difference between techniques is many times the EMP uncertainty due to counting statistics, although the actual difference is only 15%.
Good agreement is also found between the IMP and EMP average compositions of the glasses coexisting with diopside in the DirAbAn experiments (Fig. 4; Table 4). Excluding NarO, relative composition differences are ~3% in the glass analyses from the controlled cooling sample 35-5B. Relative differences in glass analyses are slightly higher in the iso- thermal sample (35-4A), but are ~12% for all elements. The largest difference ( 11%) is for MgO, the major element oxide most affected by diopside crystallization. The next largest deviation is for La, which has the lowest D-value among the trace elements studied, thus requiring the largest amount of rehomogenization following diopside crystallization. Even though the diopside from both samples is chemically heter- ogeneous, good agreement is found between the two analytical techniques when average compositions are compared. For both experimental conditions, agreement is within 16% for
all elements and generally within 10%. Given the sample heterogeneities, these are upper limits to any systematic an- alytical errors. When IMP and EMP analyses of the same spot on a diopside crystal are compared (Table 5), only ZrOz , SmrOs, and YbzO3 differ by more than can be accounted for by EMP counting statistics, but these differences are ~8%.
One of our original reasons for characterizing the three starting glass compositions by EMP was to use them as trace element standards for IMP analyses of crystalline phases in CAIs. One aspect not yet discussed in this regard is the role of structural matrix effects in modifying ion yields. RAY and HART (1982), for example, showed that sputtering of major and trace elements was enhanced by lo-40% in clinopyroxene crystals compared to glasses of similar composition. Conse- quently, using glass standards could result in erroneous anal- yses of crystalline phases. In contrast, MUIR and BANCROFT (1987), using a similar instrument but different analytical conditions, found that ion intensities for most major and trace elements varied by less than 10% between glass and crystalline CaTiSiOS. Evaluation of IMP analyses of the mel- ilite and diopside crystals produced in this study with regard to structural matrix effects is somewhat complicated because of the chemical zoning described above. Our results show, however, that if glass standards are used to determine ion yields and if average concentrations in the crystalline phases are considered, SrO is overestimated by the IMP in both melilite compositions compared to the EMP average by 10 and 12%. Thus, enhanced ionization of Sr in crystalline mel- ilite relative to melilite glass may be indicated by our data. Other elements in melilite, and SrO in coexisting glasses (an- alyzed concurrently with the melilite crystals), show a much closer correspondence between techniques.
In terms of average compositions (Table 4) there is no indication from our data for structural matrix effects in the analysis of diopside-bearing samples using the DirAbAn glass standard. A more critical comparison can be made based on an individual IMP analysis and the corresponding point in an EMP line scan of a large, relatively homogeneous (based on EMP data) diopside crystal. Table 5 shows that, except for La, the IMP concentrations are slightly higher, by 5- 10%. This is a good comparison, especially since the DizAbAn glass used for the ion probe standard differs significantly in com- position from the crystalline diopside. Unless there have been fortuitous cancellations, our data suggest that diopside glass is an excellent IMP standard for crystalline diopside. The RAY and HART (1982) results may mean that caution should be used in generalizing this conclusion to all clinopyroxene compositions.
We conclude that by employing ion yields calculated from the average EMP analysis of the starting glass compositions, quantitative determinations of major and trace elements in melilite and diopside can be obtained by IMP techniques that are typically within 10% of those obtained by EMP. As this application of the modified ion yields resulted in quan- titative determination of trace elements in synthetic melilite crystals having compositions of Aklz and Aks,,, no difficulty is anticipated in using the ion yields for analysis of natural melilite grains in CAIs, which have a similar range in major element composition (Akc-Akso; GROSSMAN, 1980). As the most abundant pyroxene in coarse-grained CAIs is Ti-rich

3122 S. M. Kuehner et al.
60
60 35-58 Dlopside
iz” $6
q e
0. z 0.2 -
10
q * ' IJe 9' 46
n- :
0 0.0
SiO2
Al202 Mgo CaO N??O Sr Y Zr La Sm Yb
E W P E 0
sion &lo Al203 cao
40
60
60 q * 35-4A
Diopslde
40
30
04 20 q *
10 cl*
0
s102 MgO Na20
Al202 CaO
1.6
1.4 b'
&!? 1.2 !z 0. 1.0
0.0.
8 0.6 0 '
g 0.6 b EYP 0.4 q e 0 l IMP
-.- . I . . * .
Sr Y Zr La Sm Yb
0.6
0.6
Sr Y Zr La Sm Yb
60
0
s102 &IO f-J%0 A1202 CaO
1.4
1.2
1.0 -
0.6 :
0.6 -
0.4
0’
0.2 tP
Sr Y Zr La Sm Yb
FIG. 4. Comparisons of average EMP and IMP concentrations of major and trace elements in crystals and coexisting glass. Vertical bars show range in oxide concentrations for cases where the range is larger than the symbol. IMP analyses were. obtained using ion yields based on the EMP analyses of the synthetic starting glasses. Note scale change for SrO . . in the Akscr 12A mehhte analyses.

Partition coefficients for melilite and diopside 3123
40 04 0’
AkSO-12A 6 q EMP MellIlt : -
E
0.05 0 l IMP
820 w 0.50
8 B 0
- 9 .-----._-______
0.05 - 10
l 0 0.00 . , n,- a: L
Slo2 CaO Al2Q MgO Sr Y Zr La Sm Yb
40. 0.0.
AKSO-12A y
GLASS :
;P 301 5
40
8% s X” R 0 10
0
SIO, CaO Al24 MgO
0.
0.
: q * Ak40-5A : Mellllte :
f 00 SlO2 Co0 AlzQ MgO
1.4 t
0.
2.0
1.5
1.0
0.5
0.0
0.2 1 I
Sr Y Zr La Sm Yb
Sr Y Zr La Sm Yb
, 40 : 0. Ak40-5A :
Glass :
$30. 09 t
5
# 20 : ll* x 0.4 :
8 St 10 : El* 0.2 :
0 I I
S102 CaO Al203 MgO Sr Y Zr La Sm Yb
FIG. 4. (Continued)
fassaite, the diopside ion yields obtained here may be of lim- ited usefulness for CAIs.
somewhat surprisingly, reasonable crystal/liquid partition coefficients were also obtained. Because of the U-shaped trace
Melilite/liquid D-values
The purpose of our synthesis experiments was to obtain melilite crystals for IMP/EMP comparisons but, perhaps
element profiles in the melilite crystals, D-values were cal- culated using the minor element concentrations obtained from analyses of melilite cores, assuming that the cores crys- tallized in equilibrium with a liquid which had the compo-
3124 S. M. Kuehner et al.
TABLE 4 Comparison ot Average+ Electron Probe and Ion Probe Analyses ot Crystal/Glass Samples*
sition of the starting glass. The incompatible element partition coefficients are, strictly speaking, upper limits. In order to minimize errors due to boundary layer effects and recognizing that the plane of a section does not pass through the exact center of each crystal therein, we searched for the melilite grain with the lowest core concentrations of minor elements in each section and used the latter concentrations for deter- mination of D-values.
The D-values derived from EMP and IMP analyses of melilite are listed in Table 6. As expected from the similarity in trace element concentrations obtained for melilite by the two techniques, IMP D-values are very close to EMP D-val- ues. D-values obtained by the two methods agree to within counting statistics, or 13%, for all elements except Yb, for
which they disagree by 45% in Akw. For clarity, only D- values obtained by IMP are plotted in Fig. 5, except for Sr in melilite (plotted in the position of Et?), where the EMP value is considered a more reliable dete~ination. The re- sulting REE D-patterns for Akiz and AkW melilite compo- sitions parallel one another. Each is characterized by nearly constant D-values for LREE and progressively decreasing D- values for HREE. Our results show that REE3+ D-values de- crease progressively with increasing akermanite content. As the akermanite content of melilite itself increases with de- creasing temperature, the effects of melilite composition and temperature are inseparable in our experiments. The REE pattern and absolute D-values of our Alit2 mdilite compo- sition determined by IMP (and EMP) agree very well with

Partition coefficients for mdilite and diopside 3125
TABLE 6 Experimental ~liilt~Llquld Distrl~u~lon Coefficients
Akso Aki 2
Zr
La
.sm
sr
Y
Yb
EMP IMP EMP IMP
. . . .a023 _.. .OOlO
,036 ,036 .64 87
,035 ,032 .72 .75
.99 1.12 .78 .64
,015 .015 .44 .41
,019 .0066 .25 .25
INAA results of NAGASAWA et al. (1980), determined from density separates of melilite (-Aki5) and glass synthesized from a similar starting composition as we have used. Also shown in Fig. 5 are D-values determined by synchrotron ra- diation XRF analysis by WOOLUM et al. (1988) for AkJo mel- ilite synthesized from an Allende Type B CA1 bulk compo- sition. The general shape and intermediate absolute D-values are consistent with D-values determined in this study.
BECKETT et al. ( 1988) also determined melilite~iquid par- tition coefficients for several trace elements for a Type B CA1 composition, using a technique that allows destination of D-values over a broad range of melilite compositions from only a few experiments. Their results indicate a curvilinear relationship between DLa,ce,Tm and X,, over the experimental range of -AkzS-Ak70. Their fitted expression for DLa agrees well with our Akw and Aklz data and with Db for AklS (0.475) reported by NAGASAWA et al. ( 1980). Good agreement also exists between Dyb from our data, & for Ak30 (0.080) from WOOLUM et al. (1988), Dyb for Ak15 (0.222) from NAGASAWA et al. (1980), and DT~ determined from the BECKETT et al. ( 1988) relationship. The overall agreement shows that melilite composition is more important than bulk composition in dete~ining melilite p~tioning behavior in CMAS liquids and also justifies our approach in which D-values were calculated from samples that are strongly zoned in trace elements. Although the general relationships between DREE3+ and X,, defined in the study of BECKETT et al. (1988) may well be correct for melilite of intermediate composition, the relationships cannot hold true for very low X’, (sAklo) as the fitted expressions do not have Y-intercepts. Based on a linear extrapolation of DLa from our Aklz data and the AklS data of NAGASAWA et al. (1980), we estimate DLa for Ak,, = 1.35, with La becoming incompatible in melilite (DL, < 1) at -Ab. The only test of this extrapolation is provided by the m~urement of DGod in Ak2 by NAGASAWA et al. (1980). Assuming l& = DLa, expected from our Aktz data (Fig. 5), this value (1.2) lies directly on the extrapolated line.
In addition to emphasizing the strong effect of melilite composition on partitioning of REE3+, our study of near endmember Akll and Akw melilite, analyzed under identical conditions, also reconciles the somewhat conflicting results on the extent of Eu anomalies in melilite found in the data of RINGWOOD (1975), NAGASAWA et al. (1980), and WOOLUM et al. (1988). Both RINGWOOD (1975) and WOOLUM et al. (1988) conclude from the large D~J&~~J+ ratio of their respective AkTo and AksO melilite compositions
that under reducing conditions melilite should show a large, positive Eu anomaly (assuming Dsr = DE,,z+). NAGASAWA et al. (1980) indicate, however, that only a slight positive Eu anomaly should exist, based on analyses of -Akls melilite. In fact, all these results are consistent with one another. As our results show, Dsr varies only slightly over a broad range of X,, (Fig. 5), whereas hEE3+ fall by factors of 18-28 from Aklz to AkVO. As a result, Dsr/Dsm changes from - 1.04 at
Akt5 to -31 at Akw. Thus, it is expected that progressive crystallization of melilite will lead to an increasingly larger positive Eu anomaly when conditions are sufficiently reducing that all Eu is divalent.
Although the present experiments were carried out for the purpose of IMP-EMP comparisons, the observed incompat- ible element partitioning in diopside displays some surprising features which, although not completely understood, deserve discussion.
We have systematically examined the EMP data in terms of interelement correlations of “apparent partition coefi- cients” (C/Co, where C is the concentration of an element at a given spot on a diopside crystal and Co is the initial liquid concentmtion). The interelement variations of Sm, Y, and Yb display good linear correlations and are consistent with constant partition coefficient ratios: D(E)/D(Yb) = 1 .OO and 1.05 for Sm and Y, respectively. All other interelement cor- relation plots, however, are dominated by scatter (e.g., Figs. 6 and 7). Our diopside synthesis experiments represent about 16% crystallization. If partition coefficients were constant, this amount of fractional crystallization would correspond to at most 16% variation in apparent partition coefficient for the incompatible elements. As illustrated in Figs. 6 and 7, however, all minor and trace elements show much larger variations. These variations show no obvious correlation with crystal location or with clinopyroxene major element com- ~sition (e.g., % Tschermak’s molecule).
Beyond the predictable effects of fractional crystallization, there are several factors, both equilibrium and kinetic, which can produce both intra- and inter-crystal variations. These include ( 1) change of partition coefficients with temperature, (2) change in partition coefficients due to the changes in liquid composition that result from progressive crystallization, (3) enhanced incompatible trace element concentrations in the
, ,,, , La SmSr Y Yb
FIG. 5. Melilite/liquid partition coefficients determined in this study, compared to previous studies. Points for Ak12 and Akm from this study; line segments for AkE5 from NAGASAWA et al. (1980); line segments for Ak30 from W~~LUM et al. ( 1988).

3126 S. M. Kuehner et al.
I I I I I
0 2 OC/hr DlYb)/~La)~ 4.1/ 1
z z
0
0.3 - I I I
0.10 0.(5 0.20
c/co (La1
FIG. 6. Correlation plot of apparent diopside/liquid partition coef- ficients for Yb and La. The error bars represent 20 uncertainties due to counting statistics for the EMP analysis. The bar labelled fractional crystallization indicates the spread of values expected for this process, assuming constant partition coefficients. The observed variations are much larger. Points from slow- and fast-cooled experiments are in- distinguishable. Assuming that the REE partition coefficient pattern does not change with temperature, the line of constant relative par- tition coefficient, 4.1, can be interpreted as representing crystal regions that grew at interface equilibrium. Points below and to the right of this line could be interpreted as regions whose growth was affected by boundary layers at the crystal-liquid interface. Each dashed line is an illustrative calculation at constant temperature for a region having a varying crystal growth rate. Because every point on the interface equilibrium line is the origin of a boundary layer curve, a scatter of points can be generated. The resultant classification of equilibrium and non-equilibrium points breaks down, however, when data for other elements are compared, casting doubt on boundary layer formation as the origin of the observed scatter.
liquid boundary layer adjacent to the crystal, and (4) anom- alous partitioning onto surface sites which do not re-equili- brate once complete coordination is achieved. A special case of (4) is sector zoning, where the surface partition coefficient varies systematically in different crystallographic directions. These mechanisms are not mutually exclusive and might show combined effects, e.g., for (2) and (3). Since the equi- librium liquid composition is itself a function of temperature, we shall regard “temperature” effects to include both mech- anisms (1) and (2).
Allowing for the variation of partition coefficients with temperature and assuming interface equilibrium, we expect smooth covariations of apparent partition coefficients among different minor and trace elements. In the special case where the percentage changes in partition coefficient with temper- ature are the same for a group of elements, straight line plots with constant relative partition coefficient are obtained, as we observe for Sm, Y, and Yb. We interpret the absence of smooth trends as indicative of kinetic effects in partitioning, although smooth interelement correlations do not guarantee interface equilibrium. For example, even if boundary layer effects were important in the partitioning of Sm, Y, and Yb, the observed linear correlations probably would have been preserved, provided that both the partition and diffusion coef- ficients of these elements are very similar.
Kinetic effects would not have been surprising in the rap- idly cooled sample, but it was reasonable to expect that in- terface equilibrium would be maintained in the slowly cooled sample. Previous fractional crystallization studies have been consistent with this expectation (BENJAMIN et al., 1980, 1983; JONES and BURNETT, 1987; BECKETT et al., 1988).
The 100 micron scale variations in major element com- position observed in the glasses of this study are typical for the D&AbAn system for the same thermal history (deg/hr cooling rates) as used for sample 35-4A (JONES and BURNETT, 1987; JOHNSON and BURNETT, 1987). The chemical varia- tions indicate that some boundary layer formation did occur during diopside crystallization, although trace element-en- riched boundary layers within - 10 pm of the diopside crys- tals were not observed. In the absence of strong composition effects on partitioning, it is not obvious that boundary layers have a major effect on trace element partitioning. As proposed by LINDSTROM (1983), formation of such a boundary layer will slow, possibly stop, crystal growth until the boundary layer is at least partially removed by diffusion of major con- stituents to the growing interface. Crystal growth and trace element partitioning would then occur only when the boundary layer disappears. Large scale (> 100 micron) gra- dients in glass composition could persist but, as we have ob- served, there would be no obvious trace element-enriched boundary layers in glass adjacent to crystals.
We now show that it is difficult to explain the observed variability (Figs. 6 and 7) by the presence of boundary layers. If all REE behaved coherently in our experiments, then con- stant relative partition coefficients would be observed. As discussed above, this is true for Sm, Y, and Yb, but not true (cf. Fig. 6) for La relative to any of the heavier REE; i.e., differences in the diopside REE pattern occur within a single experiment. This incoherence also shows that slow cooling does not guarantee interface equilibrium. Conversely, not all slow cooling experiments show interface disequilibrium. For the same type of cooling history, for example, a linear &,-
0.60
t
0 2'Clhr .
n 104"C/hr
0.55 c
+ Typm em,
.
.
._
I . I I
0.30 0.35 0.40 C/Co(Al)
FIG. 7. Correlation plot of apparent diopside/liquid partition coef- ficients for Sm and Al, analogous to FIG. 6, except that, here, Al partition coefficients are systematically higher for the rapidly cooled sample. A boundary layer interpretation of this plot that would be consistent with FIG. 6 is not possible, suggesting that the scatter in all such correlation plots represents complex surface partitioning processes.

Partition coefficients for melilite and diopside 3127
Dsm correlation was obtained by JONES and BURNETT ( 1987) while the same data (JONES, 1981) show a respectable DA,- Ds, correlation, unlike that found here (Fig. 7).
One possible interpretation of the La data is that, because the partition coefficient of Ia is significantly lower than any heavy REE, it is much more susceptible to boundary layer formation. Based on the theory of BURTON et al. (1953; cf. JONES and BURNETT, 1987), the apparent partition coefficient depends on the true partition coefficient (for interface equi- librium) and a dimensionless parameter, DEL = vd/D*, where v is the crystal growth rate, d is the boundary layer thickness, and D* is the diffusion coefficient. The BURTON et al. (19.53) equations are not strictly applicable to these experiments because they assume an infinite reservoir and a steady state but should be adequate to illustrate qualitative systematics. Values for DELs and true partition coefficients define a single point on a correlation plot such as Fig. 6. With variations in crystal growth rate for constant true partition and diffusion coefficients, curved trends of the type illustrated on Fig. 6 result. Recognizing, more realistically, that partition and diffusion coefficients, as well as crystal growth rates, vary with temperature, we can explain a scatter of points, such as that observed in Fig. 6. Predictions of systematic can be made, however, which can be tested with other interelement correlations. Thus, a plausible interpretation of Fig. 6 is that those points which lie on the 4.1: 1 correlation line correspond to materials grown at interface equilibrium but at different temperatures. According to this interpretation, those points lying below and to the right of this line have been affected by boundary layer formation.
For a correlation plot using any other pair of elements, an analogous boundary layer interpretation can be developed. The difficulty is that a consistent set of points representing intertace equilibrium and points affected by boundary layers cannot be obtained for all elements, even taking liberties with assumed absolute and relative diffusion coefficients. The value of having high precision multielement partitioning data is clear. As a specific example, many of the points defining the 4.1: 1 line on Fig. 6 lie in the middle of the clustering of points on Fig. 7. Thus, lack of systematics in the overall data set casts doubt on boundary layers as a general interpretation of the partitioning data presented herein.
We now consider the possibility that our data are domi- nated by surface partitioning effects (mechanism (4) above). One possible clue is the comparison of the results of the slow (35-5B) and rapidly cooled (35-4A) experiment. Figure 7 shows that the apparent partition coefficients for Al are sys- tematically higher for 35-4A than 35-SB, but those for Sm, La, and Yb are approximately the same in the two experi- ments (e.g., Fig. 6). Zr is the only other element measured whose apparent partition coefficients are systematically higher in 35-414 than in 35-SB. Of the elements studied, Zr and Al have the highest values of zfr2 (z = ionic charge, r = ionic radius), the parameter proposed by DOWTY ( 1976) and SHIMIZU ( 198 1) to govern the chemical differences in sector zoning. It is necessary to assume that systemati~ly different and, presumably, faster-growing sectors grew in the rapidly cooled sample but that the range of local partition coefficients was the same for all minor and trace elements other than Al and Zr. Simple sector zoning models, however, in which a
different set of constant relative partition coefficients is used for each of two sectors (SHIMIZU, 198 l), can be ruled out on the basis of our data. Even if the anomalously high La point on Fig. 6 is arbitrarily excluded, at least three separate constant D(Yb)/D(La) lines would be required to account for the ob- served variations. If surface ~tioning is regarded, however, as a complex interplay between adsorption and desorption, varying with local crystal-melt boundary conditions, then al- most any scatter of points might result (SHIMIZU, 1983). We have no better model at present. It is obvious, however, that more appropriate experiments can be done to test these in- terpretations.
Other workers have observed similar effects in experimental diopside pa~i~o~ng studies. In a detailed study of the A1203 content of clinopyroxene in the DiAn system for a wide va- riety of thermal histories TSUCHIYAMA (1985) demonstrated large increases in Al partition coefficient with cooling rate, qualitatively similar to what we observed. All of his results are interpreted in terms of general “kinetic effects” on par- titioning, rather than in terms of any specific mechanism. Detailed EMP contouring of a large crystal showed no obvious Al sector zoning. In contrast, clear sector zoning effects on Al pa~itioning in diopsidic clinopyroxene grown in the sys- tem CaMgSizOs-CaTiAlzOs were observed by KOUCHI et al. (1983).
Alternatively, the general scatter in trace element corre- lations that is unique to our work may be due to the high concentrations of “trace” elements employed (about 4% by weight in starting materials). Conceivably, small grains of complex oxides of variable composition might precipitate in association with boundary layer formation and be incorpo- rated as inclusions with subsequent crystal growth. These samples, however, have been well characterized by SEM ex- amination and 1 micron grains of such high atomic number should have been seen. Consequently, we prefer the sector zoning interpretation, although additional experiments would be required to rule out the oxide precipitation hypothesis entirely.
If the qualitative considemtions above are correct, we should be able to select those analyses from these complex samples that should best represent equilibrium partitioning and that should be comparable with other diopside partition coefficient measurements in the literature. We now show that this is possible, but the major point is the existence of the kinetic effects, as discussed above.
Because the kinetic effects enhance apparent partition coef- ficients, the lowest measured con~ntrations should come from the slow-cooled sample and should yield the best esti- mates of the partition coefficients at the higher temperature end (1250-1265°C) of the slow cooling stage. An analysis from the central region of a large euhedral crystal (“point 11”) gives the lowest concentrations of all elements, except for Sr, whose concentration at point 11 is among the higher measured values. In general, the trend of Sr concentration variations seems to be opposite those of all other incompatibIe elements. The Sr partition coefficient may be temperature independent or actually decrease with decreasing temperature, consistent with the data of RAY et al. (1983). Partition coef- ficients based on point 11 and the initial glass composition (D,in) are shown on Fig. 8 and listed on Table 7.

3128 S. M. Kuehner et al.
An alternative approach is to use rim/glass concentration ratios from the slow-cooled sample to represent partition coefficients appropriate to the low temperature end of the cooling cycle (around 1200°C). The diopside analysis ob- tained closest to any crystal edge (point 10, 10-l 5 firn from the crystal-glass interface) defines the partition coefficients labelled “rim” on Fig. 8 and Table 7. The rim partition coef- ficients are higher than Dmin for most elements (Zr-65%, REE-SO%, Al-lo%), but slightly lower than Dmin for Sr. The principal cause of the rim-&i, differences is probably the change in D with temperature, although kinetic effects could also be present.
Our bulk composition is intermediate in the DiAbAn ter- nary system to the A and B compositions of GRUTZECK et al. (1974), and, except for Sm, our Dmin for each REE is intermediate between the partition coefficients for the A and B compositions obtained by those authors at a similar tem- perature. Our D,,(Sm) is in reasonable accord with com- parable D from RAY et al. (1983) and JONES and BURNETT (1987) (as shown in Fig. 8, inset). akin is within 4 and 20% of those of the similar compositions (C2 and C3, re- spectively) of DUNN and MCCALLUM f 1982) which were synthesized at similar temperatures to ours.
Our Dm,(Al) is 70% higher than that of JONES and BUR- NETT (1987). This may indicate that there are residual kinetic effects on Dmin in our experiments and that these are more important for Al than for REE. Alternatively, the difference
1.0 , I I I I I I
0.6 - Rim
A
This work a +
Jones 8 Burnelf A
Grutzeck et 01. l 0.02
t
SiTI _I Roy et 01. T
Dunn Ii McColium *
I I I I I I I I
Lo SmSr Y Yb Zr Al
FtG. 8. Diopside partition coefficient patterns for the REE, Zr, and Al. The curve labelled D,i” is our best estimate of the equilibrium partition coefficient pattern at 1250-1265°C. The curve lab&led “rim” is based on crystal rim/glass concentration ratios and is our estimate of partition coefficients at around 1200°C. Except for comparison with DA, from JONES and BuRNE’~~ ( 1987), there is reasonable agree- ment between our partition coefficients and literature values for comparable bulk compositions and temperatures. Two different compositions from GRUTZECK et al. (1974) are shown. Our com- position is intermediate. The reported Ds,,, of RAY et al. (1983) has heen corrected by a factor of 1.4 for IMP matrix effects, as recom- mended by those authors. 4, of DUNN and MCCALLUM (I 982) is from their compositions C2 and C3.
TABLE 7 Diopside/Llquld Partition Coefficients Estimated In this Work
Tf?mpe?afure (“C)
Al
Sr
Y
Zr
La
Sm
Yb
&I$” Rtm
f250- 1265 12ff0
.28 .31
.ll .I0
.36 53
.27 .44
,084 .13
.34 .53
.34 .53
* Based on analysfs of the point with lowest concentrations in the central region of a euhedrat crystal and the initial liquid composition.
** Eased on analysis of the point closest to the edge of a crystal and the coexisting glass.
in &,(A]) between the two studies may reflect a Henry’s law deviation in the sense discussed by BENJAM~ et al. ( 1983). When nominal trace elements, e.g. REE, are at per cent con- centrations, as in the present experiments, the necessity of charge balance associated with coupled substitution of the REE MgAISiOs component requires that, in general, the par- tition coefficients for both Al and REE cannot be the same as when the REE are at ppm levels, as was the case in the JONES and BURNETT (1987) experiments. It appears, in our experiments, that D,i,(Al) has increased, with ~~i~(Sm~ re- maining constant relative to the JONES and BURNETT (1987) work.
SUMMARY AND OVERVIEW
The focus of this study has been to evaluate use of the Chicago ion probe in obtaining quantitative analyses of minor elements in the major phases that are present in natural CAIs. By examining three trace element-doped glasses whose com- positions were determined by EMP analyses, we have found that it is not possible to obtain precise quantitative analyses by IMP if there are large differences in SiOz content between the standards used to derive the ion yields and the unknowns. Thus, ion yields determined from the three starting glass compositions were used for analysis of synthetic diopside and melilitefglass systems from which ~s~~iq~d D-values were obtained for trace elements. With the exception of the trace elements in Ak% meliiite and SrO in Aki2 melilite, resulting IMP analyses using the new ion yields agree with EMP anal- yses of melilite and coexisting glasses to within 6%. The wider disagreement for trace elements in Akw melilite is probably due to poor accuracy and precision in the EMP analyses at the low trace element concentrations in this phase. SrG was overestimated by IMP, compared to EMP, in both Ak12 and Akw com~sitions. This may be the result of a st~ctu~ matrix effect, as IMP analyses of glass coexisting with diopside agreed to within 3% of the EMP analyses. The somewhat larger deviation between techniques (2 to 16%) found for the diopside analyses may be due to chemical inhomogeneity of the synthetic pyroxene. Thus, IMP techniques used here can be used to acquire quantitative major and trace element analyses of meliiite and diopside in natural CA&.

Partition coefficients for melilite and diopside 3129
Taking an extreme point of view, it can be argued that, because the samples discussed herein were not produced at equilibrium, the partitioning results should simply be dis- carded. There are two questions that have to be answered to evaluate this point of view. First, allowing for the fact that most rocks are not i~the~aily equ~ibmted systems, are the experimental conditions and compositions relevant to natural samples? Second, is there anything new in our results? Ad- dressing the second point first, we regard the degree of in- coherence between the lithophile trace elements in a slow- cooled sample such as 355B as a surprising and interesting result. The fact that we are able to select individual diopside analyses that yield partition coefficients in accord with pre- vious literature values, as shown on Fig. 8, is of lesser im- portance than the scatter of points on Figs. 6 and 7. It would not have been a particularly interesting result if we had ob- served linear correlations with the same relative partition coefficients as previously reported in the literature for diop- side. The interesting point about the melilite results (Fig. 5) is again not the partition coefficients per se, but that, using common sense in data selection, even from relatively patho- logical samples, quite reasonable partition coefficients can be obtained relative to those reported in the literature for more- appropriately synthesized samples. It should be emphasized that, in the absence of the literature data, we would have been hesitant to report partition coefficients from these mel- ilite data.
With respect to the first point, we believe that the incom- patible element incoherence shown by our diopside quite possibly indicates that significant kinetic effects on trace ele- ment poisoning in clinopyroxene can occur at cooling rates that are not excessively high compared to those for some natural samples. For example, our data indicate that the cli- nopyroxene REE partition coefficient pattern, as measured by Yb/La, could vary by at least 30% due to kinetic effects. Some qualification of this conclusion is required due to the high levels of incompatible lithophile elements in these ex- periments.
More generally, with the incr~sing availabiIity of in situ trace element microanalytical data, e.g., from ion probes, there is an increasing need to worry about processes leading to inter- and intracrystal variations of trace element contents.
Acknowledgments-We are grateful to I. M. Steele and A. M. Davis for guidance in the operation of the electron and ion microprobes, respectively, and also for their discussions of our results. We thank John Beckett for the melilite starting materials and for helpful dis- cussions, and Astrid Howard for help with synthesis ex~~rnen~. We profited from discussions with E. Stolper and from reviews by R. Hervig, N. Shim& and D. Lindstrom. This work was supported by funds from the National Aeronautics and Space Administration through grants NAG 9-54 (to L. Grossman), NAG 9-94 (to D. S. Burnett), and NAG 9-5 1 (to R. N. Clayton).
Editorial handling: F. A. Frey
REFERENCE
BECKET~ J. R., SPIVACK A. J., HUTCHEON 1. D., WASS~RBURG G. J., and STOJ_PER E. M. ( 1988) The partitioning of trace elements between melilite and liquid: An experimental study with appli- cations to type B CAIs (abstr.). In Lunar Planet. Sci. XIX, 49-50. Lunar and Planetary Institute.
BENJAMIN T. M., HEUSER W. R., BURNETT D. S., and SEITZ M. G.
(1980) Actinide crystal-liquid partitioning for clinopyroxene and Cas(PO&. Geochim. Cosmochim. Acta 44, 1251-1264.
BENJAMIN T. M., JONES J. H., HEUSER W. R., and BURNETT D. S. ( 1983) Laboratory actinide partitioning: Whitlockite/liquid and intl uence of actinide concentration levels. Geochim. Cosmochim. Acta 47, 1695-1705.
BURTON J. A., PRIM R. C., and SLIGHTER W. P. (1953) The distri- bution of solutes in crystals grown from the melt. Part 1. Theor. J. Chem. Phys. 21, 1987-1991.
Dowry E. (1976) Crystal structure and crystal growth: II. Sector zoning in minerals. Amer. Mineral. 61,460-469.
DRAKE M. J. and WEILL D. F. (1972) New rare earth element stan- dards for electron microprobe analyses. Chem. Geology 10, 179- 181.
DUNN T. and MCCALLUM I. S. (1982) The partitioning of Zr and Nb between diopside and melts in the system diopside-albite-an- orthite. G~h~rn. Cosm~h~m. Acta 46,623-629.
GROSSMAN L. (1980) Refractory inclusions in the Allende meteorite. Ann. Rev. Earth Planer. Sci. 8, 559-608.
GRUTZECK M., KRIDELBAUGH S., and WEILL D. (1974) The distri- bution of Sr and REE between diopside and silicate liquid. Geop/zyf. Rex Lett. 1, 273-276.
HINTON R. W., DAVIS A. M., SCATENA-WACHEL D. E., GROSSMAN L., and DRAUS R. J. (1988) A chemical and isotopic study of hibonite-rich refractory inclusions in primitive meteorites. Geo- chim. Cosmochim. Acta 52,2573-2589.
JOHNSON M. L. and BURNETT D. S. (1987) Henry’s Law is obeyed for Tm rationing into diopside at low con~n~ation (abstr.). Eos 68, 1543.
JON= J. H. (198 1) Studies of the geochemical similarity of plutonium and samarium and their implications for the abundance of 244Pu in the early solar system. Ph.D. thesis, Calif. Inst. Tech.
JONES J. H. and BURNETT D. S. (1987) Experimental geochemistry of Pu and Sm and the thermodynamics of trace element parti- tioning. Geochim. Cosmochim. Acta 51, 769-782.
KOUCHI A., SUGAWARA Y., KASHIMA K., and SUNAGAWA I. (1983) Laboratory growth of sector-zoned clinopyroxen~ in the system CaMgSi~O~-Ca~~l*O~ . Contrib. mineral. Petrol. 83, 177- 184.
KUEHNER S. M., LAUGHLIN J. R., GROSSMAN L., JOHNSON M. L., and BURNETT D. S. (1988) Electron probe and ion probe deter- mination of melilite/liquid and clinopyroxene/liquid partition coefficients of trace elements in CMAS and NaCMAS (abstr.). In Lunar Planet. Sci. XIX, 653-654. Lunar and Planetary Institute.
LANGMUIR C. H., BENDER J. F., BENCE A. E., HANSON G. N., and TAYLOR S. R. (1977) Petrogenesis of basalts from the FAMOUS area, Mid-Atlantic Ridge. Earth Planet. Sci. Lett. 36, 133- 156.
LINDSTROM D. J. (1983) Kinetic effects on trace element partitioning. Geochim. Cosm~h~m. Acta 47,6 17-622.
MUIR I. M. and BANCROFT G. M. (1987) A comparison of conven- tional and specimen isolation filtering techniques for the SXMS analyses of geologic materials. Intl. J. Mass Spectr. Ion Proc. 75, 159-170.
NAGASAWA H., SCHREIBER H. D., and MORRIS R. V. (1980) Ex- perimental mineral/liquid partition coefficients of the rare earth elements (REE), Sc and Sr for perovskite, spine1 and melilite. Earth Planet. Sci. Lett. 46,431-437.
PAN~URST R. J. (1977) Open system crystal fmctionation and in- compatible element variation in basalts. Naiure 268,36-38.
RAY G. and HART S. R. (1982) Quantitative analyses of silicates by ion microprobe. Intl. J. Mass Specir. Ion Proc. 44,23 l-25 5.
RAY G. L., SHIMIZU N., and HART S. R. (1983) An ion microprobe study of the partitioning of trace elements between clinopyroxene and liquid in the system diopside-albite-anorthite. Geochim. Cos- mochim. Acta47,2131-2140.
REED S. J. B. (1973) Principles of X-ray generation and quantitative analysis with the electron microprobe. In microprobe A~u~ys~s (ed. C. A. ANDERSON), pp. 53-81. Wiley.
REED S. J. B., Scorr E. R. D., and LONG J. V. P. (1979) Ion mi- croprobe analysis of olivine in pallasite meteorites for nickel. Earth Planet. Sci. Lett. 43, 5-12.
BNGWOOD A. E. (1975) Some aspects ofthe minor element chemistry of lunar mare basalts. The Moon 12, 127-157.

3130 S. M. Kuehner et al.
SHERATON J. W., ELLIS D. J., and KUEHNER S. M. (1984) Ram- earth element geochemistry of Archaean orthogneisses and evo- lution of the East Antarctic Shield. BMR J. Australian Geol. Geo- phys. 9,207-2 18.
SHIMIZU N. (1981) Trace element incorporation into growing augite phenocryst. Nature 289,575-577.
SHIMIZU N. (I 983) Interface kinetics and trace element distribution
SHIMIZU N. ( 1986) Silicon-induced enhancement in secondary ion emission from silicates. Intl. J. Mass Spectr. Ion Proc. 69, 325-
between phenocrysts and magma. In The Significance of Trace
338.
Elements in Solving Petrogenetic Problems and Controversies (ed. S. S. AUGUSTITHIS). DD. 175-195. Theouhrastus Publications.
,I _.
SHIMIZU N., SEMET M. P., and ALLEGRE C. J. (1978) Geochemical applications of quantitative ion-probe analyses. Geochim. Cos- mochim. Acta 42, 1321-1334.
SMITH J. V. and RIBBE P. H. (I 966) X-ray-emission microanalysis of rock-forming minerals III. Alkali feldspar. 3. Geology 74, 197- 216.
STEELE I. M., HERVIG R. L., HUTCHEON I. D., and SMITH J. V.
STOLPER E. M. and PAQUE J. M. (1986) Crystallization sequences
( 198 1) Ion microprobe techniques and analyses of olivine and low- Ca pyroxene. Amer. Mineral. 66, 526-546.
STOLPER E. M. ( 1982) Crystallization sequences of Ca-Al-rich inclu-
of &Al-rich inclusions from Allende: The effects of cooling rate
sions from Allende: An experimental study. Geochim. Cosmochim. Acta 46,2 159-2 180.
and maximum temperature. Geochim. Cosmochim. Acta 50,1785- 1806.
TSUCHIYAMA A. (1985) Crystallization kinetics in the system CaMgSizO&a41&Or,: development of zoning and kinetic effects on element partitioning. Amer. Mineral. 70,474-486.
WOOLUM D. S., JOHNSON M. L., and BURNETT D. S. (1988) Re- fractory lithophile partitioning in type B CA1 minerals (abst). In Lunar Planet. Sci. XIX, 1294-1295. Lunar and Planetary Institute.
ZINNER E. and CROZAZ G. (1986) A method for the quantitative measurement of rare earth elements in the ion microprobe. Intl. J. Mass Spectr. Ion Proc. 69, 17-38.