determination of the microbiological quality of feed city ... · athens journal of sciences june...
TRANSCRIPT

Athens Journal of Sciences June 2017
143
Determination of the Microbiological Quality of
Feed City Water to Pharmaceutical Facility:
Distribution Study and Statistical Analysis
By Mostafa Essam Eissa
Supplying feeding water to pharmaceutical plant is critical both for industrial or
human consumption purposes. Assessment of microbiological quality and stability is
needed to determine the suitability of income city water for human application and
other processing in pharmaceutical manufacturing. In the current study statistical
analysis and Shewhart charts were used to determine the degree of compliance of the
raw city water to the standard microbiological specifications. Although all sampling
points of the distribution system met the acceptance criteria, they showed variable
degrees of out-of-control states at chronologically non-identical parts of the control
charts. The performance of each monitored compartment could be measured by a
bioburden level which might provide indication for the disinfection efficacy. The
overall capability of the process (Ppk) for each segment of the distribution system was
found in the following descending order: water station (2.30), restaurant (2.25),
laboratory locker (2.08) and production locker (1.86). Despite the presence of
residual chlorine level, the distribution system showed variable degrees of biological
instability. Thus, disinfection of feed water cannot be used as a sole measure for
protection of aged distribution network and further investigation is required to
improve the system quality and maintenance in demand of delivering
microbiologically high quality and safe water.
Keywords: Chlorine, City water, Out-of-control, Pharmaceutical plant, Shewhart
charts.
Introduction
The objective of the open drinking water system network is to create water
of acceptable tangible and hygienic properties and to keep up that quality all
the way through transfer network till the location of use. From a
microbiological point of view, the desired properties of the produced water can
decay as an after effect of extensive bacterial proliferation. This microbial
growth can prompt issues, for example, a marked impairment of water quality
(e.g. taste, scent, turbidity, staining) and additionally objectionable microbes
multiplication (Bartram et al., 2004; Boe-Hansen et al., 2002; Hammes et al., 2008;
Juhna et al., 2007; Vital et al., 2010; Vital et al., 2008, Pharmaguideline.com,
2016).
Drinking water (potable) is classified under Type II class of water that is
required to satisfy the necessities of the Environmental Protection Agency
(EPA) for quality. It originates from a particular supply or city source that has
Head, Microbiology Section, HIKMA Pharma, Egypt.

Vol. 4, No. 2 Eissa: Determination of the Microbiological Quality…
144
different levels of hardness and included chlorine for microbial control as
described by Vincent, 2003. Drinking water ought to be supplied under
constant positive pressure in a pipes framework free of any anomalies that
could prompt tainting of infrastructures of the system with consequent
deterioration of water quality. Drinking water is unchanged with the exception
of constrained treatment of the water supplied from a natural or storage area.
Examples of normal sources of water comprise springs, wells, streams, lakes,
ocean and sea. The state of the source water will manage the treatment required
to render it within acceptable and safe standard limits for human utilization
(drinking). Processing of water includes desalinization, removal of hardness,
removing certain ions, reduction of particulate matter and disinfection (WHO,
2003).
Water for human consumption is acquired mainly from a local water
network yet might likewise be drawn from wells, waterways, or lakes. Pipes
system network deformities might bring about the pollution of clean feeding
water. As a result of this probability, inspection of the use points by sampling
is crucial to monitor water quality. Drawing the sample in such case will be
representative for water that flows through the distribution framework. In
addition, Microbial pollution of oral fluid and topical medication items keeps
on being a critical issue, and is generally originated from the utilization of
contaminated water. In spite of the fact that there are no supreme microbial
measures for water (other than water proposed to be sterile), the cGMP
regulations require that suitable criteria should be built up and observed. The
criteria must consider the dedicated utilization of the water (FDA, 2016).
Another study in the same line has shown the influence of the microbial
quality of raw water on the final purified water of the pharmaceutical facility
that is produced from the water treatment station loop for medicinal products
manufacturing. The investigation conducted by Eissa, 2016 demonstrated that
the income water microbiological count may affect the final product water
quality although there are barriers for the passage of microbial cells during
processing stages of drinking water.
Due to the previously mentioned challenges, the current study aimed to
perform long term inspection on the microbiological quality of feeding potable
water to a pharmaceutical facility for manufacturing of non-sterile medicinal
products. The work focused on providing a simple system for monitoring and
evaluating the microbiological stability of supply city water. The supply in turn
is used for general human consumption purposes and preparation of purified
water for pharmaceutical uses specifically. The study covered three different
terminal supply lines from the main old (aged) water station that feeds the firm
with city water using process control charts and statistical analysis.
Materials and Methods
Principally, the present study was performed using standard methods in
water sampling and testing using a conventional culture technique. The output
data generated from the microbiology laboratory were then trended and

Athens Journal of Sciences June 2017
145
subjected to a statistical analysis using commercial statistical software package.
After processing the results, not only the microbiological efficiency of the
distribution system could be evaluated, but also its state of biological stability
could be assessed. Accordingly, any corrective, maintenance and/or
improvement plans, after that, should be investigated based on the outcome of
the analysis. Microbiological samples of city water small framework system -
feeding pharmaceutical plant for non-sterile medicinal products - were sampled
over 38 months excluding shutdowns, weekends and maintenance periods. The
study was conducted in the industrial zone at 6th
of October city, Egypt. The
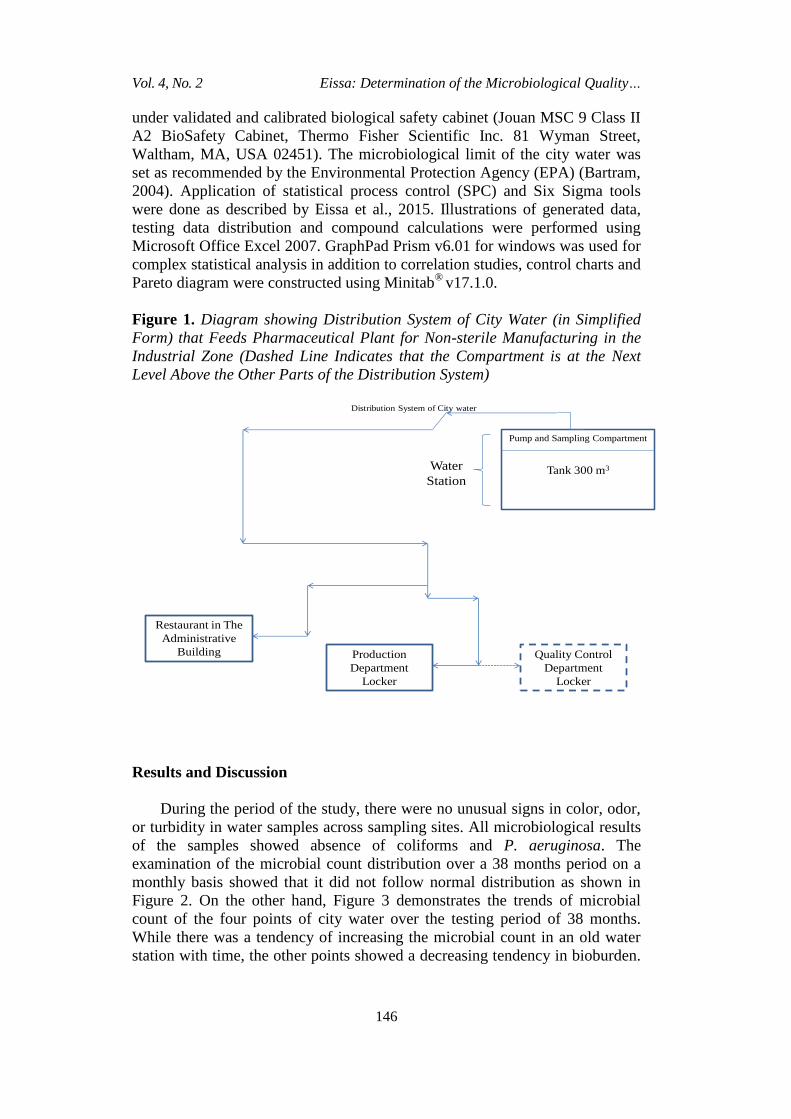
diagram of the city water distribution system is shown in Figure 1. The small
plant for city water is aged over 25 years with its associated network pipes that
supply the manufacturing plant with chlorinated feed water. An old water
station comprises a 300 m3 tank that pumped water to the distribution system
that supplies the restaurant, production locker and laboratory locker.
Environmental monitoring (EM) samples - during testing under laminar air
flow (LAF) unit, water sampling and testing were done according to Ashour et
al. 2011. All microbiological culture media for microbial processing and
chemicals were purchased from OXOID (Basingstoke, Hampshire) and Sigma-
Alrich (St. Louis, MO 63103), respectively. Plastic 9 mm sterile plates were
bought from Sterilin Limited (solaar house, 19 mercers row, Cambridge, UK).
Enumeration of colonies after incubation was conducted with the aid of digital
colony counter (Digital Colony Counter Model: 361, Laxman Mahtre Rd.
Navagaon, Dahisar West, Mumbai). All culture media were sterilized by
autoclaving in a steam sterilizer (FEDEGARI FOB3, Fedegari Autoclavi SpA,
SS 235 km 8, 27010 Albuzzano (PV), Italy). All pH measurements and
weighing of media and reagents were performed using Mettler-Toledo S20
SevenEasy™ pH Meter and XPE Analytical Balance, respectively (Mettler-
Toledo, LLC 1900 Polaris Parkway Columbus, OH 43240). Incubation of
media plates and tubes was done in BD 115 incubator (BINDER GmbH,
ImMittlerenÖsch 5 D-78532 Tuttlingen) and Hotpack incubator (incubator 175
series, model 417532, Hotpack, Dutton Rd., Philadelphia, USA). For
microscopic examination, a microscope with oil immersion lens (ACCU-
SCOPE #A3000, Mel Sobel Microscopes Ltd., USA) was used. Timer (HX-
175B, Shenzhen Heng Teng Fa Electronics Co., Ltd., Shenzhen/Guangdong,
China) was used during monitoring and testing to control time. Microbiological
culture media used in the current study were all subjected to the growth
promotion test as described in the compendial guideline (Clontz, 2008).
Negative control plates were prepared and incubated in parallel with the test
plates to ensure sterility of the culture media and aseptic processing
monitoring. The identification of the suspect waterborne isolates for coliforms
and/or Pseudomonas aeruginosa was conducted using diminutive biochemical
identifications kits BBL™ Crystal™ enteric/non fermenter (E/NF) and Gram-
positive (GP) Identification System Identification System and Gram stain
reagents purchased from BD (Becton Dickinson Microbiology Systems,
Cockeysville, Md.). The identification procedure was done as detailed in the
manual of the kit. All microbiological processing and handling were made
Vol. 4, No. 2 Eissa: Determination of the Microbiological Quality…
146
under validated and calibrated biological safety cabinet (Jouan MSC 9 Class II
A2 BioSafety Cabinet, Thermo Fisher Scientific Inc. 81 Wyman Street,
Waltham, MA, USA 02451). The microbiological limit of the city water was
set as recommended by the Environmental Protection Agency (EPA) (Bartram,
2004). Application of statistical process control (SPC) and Six Sigma tools
were done as described by Eissa et al., 2015. Illustrations of generated data,
testing data distribution and compound calculations were performed using
Microsoft Office Excel 2007. GraphPad Prism v6.01 for windows was used for
complex statistical analysis in addition to correlation studies, control charts and
Pareto diagram were constructed using Minitab®
v17.1.0.
Figure 1. Diagram showing Distribution System of City Water (in Simplified
Form) that Feeds Pharmaceutical Plant for Non-sterile Manufacturing in the
Industrial Zone (Dashed Line Indicates that the Compartment is at the Next
Level Above the Other Parts of the Distribution System)
Distribution System of City water
Tank 300 m3 Water
Station
Pump and Sampling Compartment
Restaurant in The
Administrative
Building Production
Department
Locker
Quality Control
Department
Locker
Results and Discussion
During the period of the study, there were no unusual signs in color, odor,
or turbidity in water samples across sampling sites. All microbiological results
of the samples showed absence of coliforms and P. aeruginosa. The
examination of the microbial count distribution over a 38 months period on a
monthly basis showed that it did not follow normal distribution as shown in
Figure 2. On the other hand, Figure 3 demonstrates the trends of microbial
count of the four points of city water over the testing period of 38 months.
While there was a tendency of increasing the microbial count in an old water
station with time, the other points showed a decreasing tendency in bioburden.

Athens Journal of Sciences June 2017
147
This finding requires further investigation to elucidate the reason for this
difference in the trend of microbial count through the same distribution water
system. The original data profile did not fit any type of discrete distribution.
However, they were closest to geometric-type of distribution (Englehardt et al.,
2009).
Figure 2. Histogram of Raw Data (Without Transformation) Showing the Non-
Gaussian Microbial Count Distribution in City Water from Four Sampling
Locations in the Pharmaceutical Plant
30
5
01
51
02
52
03
53
0 05 001 051 002 052 003 05
D
ycn
eu
qer
F
ata
O
elbairaV
rekcoL yrotarobaL
rekcoL noitcudorP
tnaruatseR
noitatS retaW dl
H L yrotarobaL ;L noitcudorP ;tnaruatseR ;tS retaW dlO fo margotsi
Figure 3. Bioburden Trend in City Water from Four Points of Analysis through
38 Months Period of Monitoring Excluding the Shutdown Periods

Vol. 4, No. 2 Eissa: Determination of the Microbiological Quality…
148
Statistical analysis of the raw untransformed data is demonstrated in Table
1. All microbiological results of the four sampling points did not show
tendency to the normal distribution pattern. While all points had the same
minimum value of zero, the median values of the lockers were higher than that
of restaurant and old water station. The pattern of data and its descriptive
outcome indicated distorted accumulation of the distribution towards the
lowest microbial counts. Interestingly, Table 2 shows the effect of logarithmic
transformation on the data distribution and its effect on improving
normalization and approaching a Gaussian distribution pattern. It should be
noted that the mean of all points was significantly higher than zero CFU/100
ml but old water station and restaurant mean values were significantly lower
than nine CFU/100 ml at α = 0.05. Table 3 summarizes One-Way ANOVA test
results showing that the means of the microbiological counts of the four points
were not significantly different at α = 0.05. Box and plot diagram in Figure 3
demonstrates the pattern of microbial distribution for each point before and
after log10 (CFU + 1) transformation with notably elimination of most outliers
except one from the laboratory locker.
Table 1. Descriptive Statistics, Confidence Intervals (CI), Normality Test and
Inferences of Untransformed Microbiological Data
Column Statistics Old Water
Station Restaurant
Production
Locker
Laboratory
Locker
Minimum 0.0 0.0 0.0 0.0
25% Percentile 1.0 0.0 1.0 2.0
Median 3.0 3.0 5.5 5.5
75% Percentile 13 8.0 23 12
Maximum 180 196 162 358
10% Percentile 0.0 0.0 0.0 0.0
90% Percentile 36 33 86 51
Mean 13 11 23 22
Std. Deviation 30 32 38 60
Std. Error of Mean 4.9 5.3 6.2 9.7
Lower 95% CI of mean 3.1 0.83 11 2.1
Upper 95% CI of mean 23 22 35 41
Lower 95% CI of median 1.0 0.0 2.0 3.0
Upper 95% CI of median 11 6.0 12 9.0
D'Agostino & Pearson
omnibus normality test
K2 74 79 28 77
P value < 0.0001 < 0.0001 < 0.0001 < 0.0001
Passed normality test (α =
0.05)? No No No No
P value summary **** **** **** ****
Skewness 4.9 5.3 2.1 5.2
Kurtosis 27 30 4.3 29
Sum 493 436 875 824

Athens Journal of Sciences June 2017
149
Table 2. Descriptive Statistics, Confidence Intervals (CI), Normality Test and
Inferences of Logarithmically Transformed Microbiological Results
Column Statistics Old Water
Station Restaurant
Production
Locker
Laboratory
Locker
Minimum 0.0 0.0 0.0 0.0
25% Percentile 0.30 0.0 0.30 0.48
Median 0.60 0.60 0.81 0.81
75% Percentile 1.2 0.95 1.4 1.1
Maximum 2.3 2.3 2.2 2.6
10% Percentile 0.0 0.0 0.0 0.0
90% Percentile 1.6 1.5 1.9 1.7
Mean 0.72 0.57 0.88 0.83
Std. Deviation 0.58 0.61 0.68 0.62
Std. Error of Mean 0.093 0.099 0.11 0.10
Lower 95% CI of mean 0.53 0.37 0.66 0.63
Upper 95% CI of mean 0.91 0.78 1.1 1.0
Lower 95% CI of median 0.30 0.0 0.48 0.60
Upper 95% CI of median 1.1 0.85 1.1 1.0
D'Agostino & Pearson
omnibus normality test
K2 2.5 4.4 4.8 2.9
P value 0.2824 0.1117 0.0900 0.2309
Passed normality test
(alpha=0.05)? Yes Yes Yes Yes
P value summary* ns ns ns ns
One sample t test
Theoretical mean 0.0 0.0 0.0 0.0
Actual mean 0.72 0.57 0.88 0.83
Discrepancy -0.72 -0.57 -0.88 -0.83
95% CI of discrepancy 0.53 to 0.91 0.37 to 0.78 0.66 to 1.1 0.63 to 1.0
t, df t=7.7 df=37 t=5.8 df=37 t=8.0 df=37 t=8.3 df=37
P value (two tailed) < 0.0001 < 0.0001 < 0.0001 < 0.0001
Significant ( α = 0.05)? Yes Yes Yes Yes
Skewness 0.60 0.81 0.34 0.58
Kurtosis -0.25 0.029 -1.0 0.41
Sum 27 22 34 32 ns = Not Significant

Vol. 4, No. 2 Eissa: Determination of the Microbiological Quality…
150
Table 3. One-Way ANOVA Test using Tukey's Multiple Comparisons Test
Performed on Microbiological Results from Four Sampling Points of City
Water Distribution System Number of families 1
Number of comparisons per
family 6
α 0.05
Tukey's multiple comparisons test Mean
Diff.
95% CI of
diff.
Significance of mean
difference
Summar
y*
Old Water Station vs. Restaurant 0.14 -0.23 to 0.51 No ns
Old Water Station vs. Production
Locker -0.17 -0.54 to 0.21 No ns
Old Water Station vs. Laboratory
Locker -0.11 -0.49 to 0.26 No ns
Restaurant vs. Production Locker -0.31 -0.68 to
0.064 No ns
Restaurant vs. Laboratory Locker -0.26 -0.63 to 0.12 No ns
Production Locker vs. Laboratory
Locker 0.052 -0.32 to 0.42 No ns
Test details SE of diff. q DF
Old Water Station vs. Restaurant 0.14 1.4 148
Old Water Station vs. Production
Locker 0.14 1.6 148
Old Water Station vs. Laboratory
Locker 0.14 1.1 148
Restaurant vs. Production Locker 0.14 3.0 148
Restaurant vs. Laboratory Locker 0.14 2.5 148
Production Locker vs. Laboratory
Locker 0.14 0.51 148
ns = Not Significant
Pearson correlation at 95% confidence interval (CI) and two-tailed P
showed significant relation between the distributions of data for the four points.
This finding was demonstrated clearly in Table 4.
Table 4. Pearson Correlation (r) Matrix between Every Pair of Data Set for the
Water Sampling Points at 95 % Confidence Interval (CI) (* = Significant Correlation)
Pearson Correlation Matrix of City
Water Samples
Correlation (r) (P values)
Old Water
Station Restaurant
Production
Locker
Laboratory
Locker
Old Water Station
0.252*
(0.127)
0.014
(0.933)
0.118
(0.479)
Restaurant 0.252*
(0.127)
0.205
(0.217)
0.508*
(0.001)
Production Locker 0.014
(0.933)
0.205
(0.217)
0.480*
(0.002)
Laboratory Locker 0.118
(0.479)
0.508*
(0.001)
0.480*
(0.002)

Athens Journal of Sciences June 2017
151
Shewhart control charts for each sampling point of the pharmaceutical
distribution system for the city water were illustrated using Individual-moving
Range (I-MR) charts as shown in Figures 5-8. Special-cause variations were
present at least once during the testing period - with the exception of the
production locker - which could be attributed to external factors not related to
the normal process. Nevertheless, the overall capability of the process (Ppk) for
each segment of the distribution system was found in the following descending
order: old water station (2.30), restaurant (2.25), laboratory locker (2.08) and
production locker (1.86) which exceeded the benchmark value of 1.33
(Support.Minitab.com, 2016). Strangely, persistent but fluctuating levels of
chlorine were observed at points-of-use by an online monitoring system. The
decrease in the efficacy with distance could be attributed partially to what was
observed by some researchers. While Chlorination of potable water is an
effective treatment for microbial removal as demonstrated by FDA 2016, this
antimicrobial interacts not only with bacteria, but it also get consumed by
natural organic substances, piping surface material and particulate matters in
the distribution network, which in turn leads to the production of assimilable
organic carbon (AOC) (LeChevallier et al., 1996; Polanska et al., 2005;
Ramseier et al., 2011; Van der Kooij, 1990; Weinrich et al., 2010). AOC can
readily be used by bacteria, and hence can be viewed as a major source for
what is called "biological instability". In addition, the decomposition of
chlorine in the distribution system adversely impacts its antimicrobial
properties at the far ends of the network (Niquette et al., 2001). The average
performance of the feed water distribution system is shown in Figure 9. The
average Ppk was 2.33 with one point in the last section of the MR chart
unusually unstable process variation due to freak or extraneous factor(s).
However, the upper control limit (UCL) of the water station, restaurant,
production and the laboratory lockers was approximately 216, 94, 548 and 163
CFU/100 ml, respectively. Since CL provides a measure of dispersion in
control charts for specific inspected quality characteristic (Berardinelli, 2016),
it was applied for comparison between different segments of distributing the
system of city water. By using UCL as a measure for microbiological quality,
the Pareto chart was constructed as shown in Figure 10 to demonstrate the
segment of the system with the highest risk of microbial count fluctuation. In
such condition, this approach may be an advantage over measuring defects as
part per million (PPM) because the later could not reveal any significant
difference as the three points showed 0.00 PPM and the production locker 0.01
PPM. Transformation improved normalization of the distribution by
minimizing over dispersion as shown in Figure 4.

Vol. 4, No. 2 Eissa: Determination of the Microbiological Quality…
152
Figure 4. Box Whisker Plot Showing Bioburden Distribution Pattern and
Outliers (Demonstrated by Asterisks) of Untransformed (Upper Graph) and
Transformed (Lower Graph)
Laboratory LockerProduction LockerRestaurantOld Water Station
400
300
200
100
0
CF
U/1
00 m
l
Boxplot of Old Water St; Restaurant; Production L; Laboratory L
Laboratory LockerProduction LockerRestaurantOld Water Station
2.5
2.0
1.5
1.0
0.5
0.0
log (
CF
U+
1)/
10
0 m
l
Boxplot of Old Water St; Restaurant; Production L; Laboratory L

Athens Journal of Sciences June 2017
153
Figure 5. Shewhart Chart of the Pharmaceutical City Water Station Sampling
Port Covering a Period of 38 Months of Microbiological Sampling and Testing
37332925211713951
2
1
0
-1
Obs erv at ion
Ind
ivid
ua
l V
alu
e
_X=0.717
UCL=2.336
LCL=-0.903
37332925211713951
2.0
1.5
1.0
0.5
0.0
Obs erv at ion
Mo
vin
g R
an
ge
__MR=0.609
UCL=1.990
LCL=0
11
I-MR Chart of Old Water Station
Figure 6. Shewhart Chart of the Restaurant City Water Point for the
Employees and Workers Covering a Period of 38 Months of Microbiological
Sampling and Testing
37332925211713951
2
1
0
-1
Obs erv at ion
Ind
ivid
ua
l V
alu
e
_X=0.575
UCL=1.974
LCL=-0.825
37332925211713951
1.6
1.2
0.8
0.4
0.0
Obs erv at ion
Mo
vin
g R
an
ge
__MR=0.526
UCL=1.719
LCL=0
1
I-MR Chart of Restaurant

Vol. 4, No. 2 Eissa: Determination of the Microbiological Quality…
154
Figure 7. Shewhart Chart of the Production Locker City Water Point Covering
a Period of 38 Months of Microbiological Sampling and Testing
37332925211713951
3
2
1
0
-1
Obs erv at ion
Ind
ivid
ua
l V
alu
e
_
X=0.883
UCL=2.739
LCL=-0.972
37332925211713951
2.0
1.5
1.0
0.5
0.0
Obs erv at ion
Mo
vin
g R
an
ge
__MR=0.698
UCL=2.279
LCL=0
I-MR Chart of Production Locker
Figure 8. Shewhart Chart of the Laboratory Locker City Water Point Covering
a Period of 38 Months of Microbiological Sampling and Testing
37332925211713951
3
2
1
0
-1
Obs erv at ion
Ind
ivid
ua
l V
alu
e
_X=0.831
UCL=2.213
LCL=-0.551
37332925211713951
1.6
1.2
0.8
0.4
0.0
Obs erv at ion
Mo
vin
g R
an
ge
__MR=0.520
UCL=1.698
LCL=0
1
1
I-MR Chart of Laboratory Locker

Athens Journal of Sciences June 2017
155
Figure 9. Shewhart Chart of the Average Microbiological Quality of the City
Water Distribution System in the Pharmaceutical Plant Covering a Period of
38 Months of Microbiological Sampling and Testing
37332925211713951
2.4
1.8
1.2
0.6
0.0
Obs erv at ion
Ind
ivid
ua
l V
alu
e
_
X=0.984
UCL=2.309
LCL=-0.341
37332925211713951
1.6
1.2
0.8
0.4
0.0
Obs erv at ion
Mo
vin
g R
an
ge
__
MR=0.498
UCL=1.628
LCL=0
1
I-MR Chart of Average
Figure 10. Pareto Diagram Showing the Main City Water Line at the Highest
Risk of Microbiological Failure based on the Upper Control Limits (UCL)

Vol. 4, No. 2 Eissa: Determination of the Microbiological Quality…
156
The theory of biological stability and its influence on a system's
microbiology has been studied extensively in the structure of non-chlorinated
drinking water distribution systems (Hammes et al., 2010a; Van Der Kooij,
2000; Lautenschlager et al., 2013; Rittmann and Snoeyink, 1984; Van der
Wielen and Van der Kooij, 2010; Vital et al., 2012). Nevertheless, numerous
water processing stations globally deploy a terminal sanitization procedure to
ensure destroying viable microbial cells before entering the distribution
framework. The sanitization process is frequently accomplished by oxidative
cleansing, typically by chlorination (LeChevallier and Au, 2004). Chlorinated
water is distributed from the tank to the distribution pipe system to the terminal
points-of-use as illustrated in the diagram of Figure 1. Amid chlorination, one
can expect that impressive portions of microscopic organisms in the water are
inactivated or destroyed, while some lingering chlorine might stay in the water.
This could be obvious through various microbial observing techniques. For
instance, the quantity of cultivable microorganisms, determined in agar plates,
would lessen drastically (Delahaye et al., 2003). Taking after beginning
sanitization, leftover chlorine may incite undesirable changes amid drinking
water conveyance. When considering all variables that influence the water
distribution system, the proximity and availability of nutrient for microbial
growth, the presence of low level of competing bioburden and the absence of
constant-level supply of disinfectant would increase the risk of biological
instability of the distribution water framework. It was obvious from the control
charts - in Figure 5-8 - and when excluding extraneous points that the water
distribution section of restaurant followed by laboratory locker showed
different spots of out-of-control conditions. Other than the significance of
supplementing nutrient materials, the degree of bacterial development will be
affected by various elements. For instance, expanded water temperature can
quicken chlorine decomposition and support microscopic organisms
development (Van der Wielen and Van der Kooij, 2010; Jjemba et al., 2010),
while changes in hydraulic conditions may modify the nutrient availability to
microorganisms in biofilms and/or bacteria separation from the pipe
surfaces (Lehtola et al., 2006; Manuel et al., 2007). Moreover, the nature of
materials in contact with drinking water, and in addition the vicinity of residue
and sediments, can both influence the general microbial nature of the water
(Liu et al., 2013; Bucheli-Witschel et al., 2012; Douterelo et al., 2014).
Previous analyses that were done by several researchers showed that when
water stream was accelerated, the processes of both bacterial detachment from
biofilms and re-suspension of sediments could be induced. Consequently,
bacterial cell density would be significantly increased as demonstrated at a
research facilities scale. (Lehtola et al., 2006; Manuel et al., 2007; Tsai, 2005).
In addition, it is possible that lower water consumption overnight resulted in
considerably reduced flow rates, and consequently a faster decay of chlorine
and increased bacterial growth (Prévost et al., 1998; Srinivasan et al., 2008).
Although a culture technique for water samples has been described by
several guidelines, the observed low recovery of microbes from the
conventional plate count agar may not show the full picture of the water quality

Athens Journal of Sciences June 2017
157
as other techniques (Berney et al., 2008; Siebel et al., 2008). This could be
explained in view of the finding of other researchers for the very low recovery
of microbes from the commonly used culture methods (Siebel et al., 2008;
Hammes et al., 2010b). Moreover, Mezule et al., 2013 demonstrated cases in
which bacterial cells from both potable water and biofilms sources – sampled
from investigated distribution water systems - were in viable-but-not-cultivable
(VNBC) state. Under such circumstances, the microbial particles may be
skipped without being detected on/in conventional culture media.
Shewhart control charts showed in general the instability and out-of-
control variations in the microbiological quality of city water which may be
originated from external and/or intrinsic root-causes. Interestingly, all tested
samples have met the acceptance criteria of microbiological testing and quality
(Ppk). However, the bioburden instability finding revealed by control charts is
supported by data demonstrated by Nescerecka et al., 2014, that clearly showed
the state of biological instability and variability throughout the distribution
system. The researchers demonstrated that in any case, in spite of the relative
simplicity of the idea, an intricate interchange of chemical, physical and
biological parameters and water driven conditions should be considered in
identifying each specific situation of the instability.
Conclusions
The reliance on conventional microbiological testing of potable water
requires review. The need for more sensitive techniques or technologies is
required even if proper neutralization of biocidal agents in water - for
subsequent culture on agar media - was achieved. Control charts were useful in
identifying out-of-control states even if the process met the specification limits.
The state of biological instability of the city water distribution system could be
spotted using a Statistical process control (SPC) either in a single line or
between different segements in the same distribution system. Thus, appropriate
maintenance is required to improve microbiological stability of the system and
minimize fluctuations in water quality. Accordingly, further investigation is
required to elucidate areas of defects in view of different discussed possible
factors, either alone or in combination. These contributing parameters can
influence the microbiological behavior of each studied segment of the drinking
water system and hence its safety for consumption.
Acknowledgments
This work was supported partially financially by HIKMA Pharma
pharmaceutical company – 2nd Industrial zone - 6th of October city. The
practical part of all experiments was performed in the microbiology laboratory
in the quality control department. Data gathering and issuing was performed by

Vol. 4, No. 2 Eissa: Determination of the Microbiological Quality…
158
the HIKMA microbiology laboratory team. Reference and writing style review
was performed by Dr. Engy Refaat Rashed.
References
Ashour, M. S., Mansy, M. S. and Eissa, M. E., 2011. Microbiological environmental
monitoring in pharmaceutical facility. Egypt. Academic J. Biol. Sci, 3(1):63-74.
Bartram, J., Cotruvo, J., Exner, M., Fricker, C. and Glasmacher, A. 2004.
Heterotrophic plate count measurement in drinking water safety management.
International Journal of Food Microbiology, 92(3): 241-247.
Berardinelli, C. (2016). A Guide to Control Charts. [online] Isixsigma.com. Available
at: http://bit.ly/2fxXxxM [Accessed 27 October 2016].
Berney, M., Vital, M., Hülshoff, I., Weilenmann, H., Egli, T. and Hammes, F. 2008.
Rapid, cultivation-independent assessment of microbial viability in drinking
water. Water Research, 42(14): 4010-4018.
Boe-Hansen, R., Albrechtsen, H., Arvin, E. and Jørgensen, C. 2002. Bulk water phase
and biofilm growth in drinking water at low nutrient conditions. Water Research,
36(18): 4477-4486.
Bucheli-Witschel, M., Kötzsch, S., Darr, S., Widler, R. and Egli, T. 2012. A new
method to assess the influence of migration from polymeric materials on the
biostability of drinking water. Water Research, 46(13): 4246-4260.
Clontz, L. (2008). Microbial Limit and Bioburden Tests. Hoboken: Taylor & Francis
Ltd.
Delahaye, E., Welté, B., Levi, Y., Leblon, G. and Montiel, A. 2003. An ATP-based
method for monitoring the microbiological drinking water quality in a
distribution network. Water Research, 37(15): 3689-3696.
Douterelo, I., Husband, S. and Boxall, J. 2014. The bacteriological composition of
biomass recovered by flushing an operational drinking water distribution system.
Water Research, 54: 100-114.
Eissa, M., Seif, M. and Fares, M., 2015. Assessment of purified water quality in
pharmaceutical facility using six sigma tools. Int. J. Qual. Assur,6(2): 54-72.
Eissa, M. 2016. Shewhart Control Chart in Microbiological Quality Control of
Purified Water and its Use in Quantitative Risk Evaluation. UK Journal of
Pharmaceutical Biosciences, 4(1).
Englehardt, J., Swartout, J. and Loewenstine, C. 2009. A new theoretical discrete
growth distribution with verification for microbial counts in water. Risk
Analysis. 29(6): 841-856.
Fda.gov. Water for Pharmaceutical Use [Internet]. 2016 [cited 1 February 2016].
Available from: http://bit.ly/2fhycF5.
Hammes, F., Berney, M., Wang, Y., Vital, M., Köster, O. and Egli, T., 2008. Flow-
cytometric total bacterial cell counts as a descriptive microbiological parameter
for drinking water treatment processes. Water Research, 42(1): 269-277.
Hammes, F., Berger, C., Köster, O. and Egli, T. 2010a. Assessing biological stability
of drinking water without disinfectant residuals in a full-scale water supply
system. Journal of Water Supply: Research and Technology—AQUA, 59(1): 31.
Hammes, F., Goldschmidt, F., Vital, M., Wang, Y. and Egli, T. 2010b. Measurement
and interpretation of microbial adenosine tri-phosphate (ATP) in aquatic
environments. Water Research, 44(13): 3915-3923.

Athens Journal of Sciences June 2017
159
Jjemba P, Weinrich L, Cheng W, Giraldo E, LeChevallier MW. Guidance document
on the microbiological quality and Biostability of reclaimed water following
storage and distribution. WateReuse Research Foundation. 2010.
Juhna, T., Birzniece, D., Larsson, S., Zulenkovs, D., Sharipo, A., Azevedo, N.,
Menard-Szczebara, F., Castagnet, S., Feliers, C. and Keevil, C. 2007. Detection
of Escherichia coli in Biofilms from Pipe Samples and Coupons in Drinking
Water Distribution Networks. Applied and Environmental Microbiology, 73(22):
7456-7464.
Lautenschlager, K., Hwang, C., Liu, W., Boon, N., Köster, O., Vrouwenvelder, H.,
Egli, T. and Hammes, F. 2013. A microbiology-based multi-parametric approach
towards assessing biological stability in drinking water distribution networks.
Water Research, 47(9): 3015-3025.
LeChevallier, M. and Au, K. 2004. Water treatment and pathogen control. London:
IWA Publishing, pp. 136.
LeChevallier, M. W., Welch, N. J. and Smith, D. B., 1996. Full-scale studies of factors
related to coliform regrowth in drinking water. Applied and Environmental
Microbiology, 62(7): 2201-2211.
Lehtola, M., Laxander, M., Miettinen, I., Hirvonen, A., Vartiainen, T. and
Martikainen, P. 2006. The effects of changing water flow velocity on the
formation of biofilms and water quality in pilot distribution system consisting of
copper or polyethylene pipes. Water Research, 40(11): 2151-2160.
Liu, G., Lut, M., Verberk, J. and Van Dijk, J. 2013. A comparison of additional
treatment processes to limit particle accumulation and microbial growth during
drinking water distribution. Water Research, 47(8): 2719-2728.
Manuel, C., Nunes, O. and Melo, L. 2007. Dynamics of drinking water biofilm in
flow/non-flow conditions. Water Research, 41(3): 551-562.
Mezule, L., Larsson, S. and Juhna, T., 2013. Application of DVC-FISH method in
tracking Escherichia coli in drinking water distribution networks .Drinking Water
Engineering and Science, 6(1): 25-31.
Nescerecka, A., Rubulis, J., Vital, M., Juhna, T. and Hammes, F., 2014. Biological
instability in a chlorinated drinking water distribution network. PloS one, 9(5):
e96354.
Niquette, P., Servais, P. and Savoir, R., 2001. Bacterial dynamics in the drinking water
distribution system of Brussels. Water research, 35(3): 675-682.
Pharmaguideline.com, (2016). Growth Promotion Test (GPT) for Culture Media.
[online] Available at: http://bit.ly/2eCBJw6 [Accessed 11 Feb. 2016].
Polanska, M., Huysman, K. and van Keer, C. 2005. Investigation of assimilable
organic carbon (AOC) in flemish drinking water. Water Research, 39(11): 2259-
2266.
Prévost, M., Rompré, A., Coallier, J., Servais, P., Laurent, P., Clément, B. and
Lafrance, P. 1998. Suspended bacterial biomass and activity in full-scale drinking
water distribution systems: Impact of water treatment. Water Research, 32(5):
1393-1406.
Ramseier, M., Peter, A., Traber, J. and von Gunten, U. 2011. Formation of assimilable
organic carbon during oxidation of natural waters with ozone, chlorine dioxide,
chlorine, permanganate, and ferrate. Water Research, 45(5): 2002-2010.
Rittmann, B. E., Snoeyink, V. L. 1984. Achieving biologically stable drinking
water. Journal of the American Water Works Association, 76(10): 106-14.
Siebel, E., Wang, Y., Egli, T. and Hammes, F. 2008. Correlations between total cell
concentration, total adenosine tri-phosphate concentration and heterotrophic plate
Vol. 4, No. 2 Eissa: Determination of the Microbiological Quality…
160
counts during microbial monitoring of drinking water. Drink. Water Eng. Sci.
Discuss., 1(1): 71-86.
Srinivasan, S., Harrington, G., Xagoraraki, I. and Goel, R. 2008. Factors affecting
bulk to total bacteria ratio in drinking water distribution systems. Water
Research, 42(13): 3393-3404.
Support.minitab.com. (2016). Ppk, PPU, PPL, and Cpm: Measures of overall process
capability - Minitab. [online] Available at: http://bit.ly/2fhto2s [Accessed 30 Oct.
2016].
Tsai, Y. 2005. Impact of flow velocity on the dynamic behaviour of biofilm bacteria.
Biofouling, 21(5-6): 267-277.
Van der Kooij, D., 1990. Assimilable organic carbon (AOC) in drinking water.
In Drinking water microbiology (pp. 57-87). Springer New York.
Van Der Kooij, D., 2000. Biological stability: a multidimensional quality aspect of
treated water. Water, air, and soil pollution, 123(1-4): 25-34.
Van der Wielen, P. W. and Van der Kooij, D., 2010. Effect of water composition,
distance and season on the adenosine triphosphate concentration in unchlorinated
drinking water in the Netherlands. Water Research, 44(17): 4860-4867.
Vincent, D. W., 2003. Qualification of purified water systems. Journal of validation
technology, 10(1): 50-61.
Vital, M., Hammes, F. and Egli, T. 2008. Escherichia coli O157 can grow in natural
freshwater at low carbon concentrations. Environmental Microbiology, 10(9):
2387-2396.
Vital, M., Stucki, D., Egli, T. and Hammes, F. 2010. Evaluating the Growth Potential
of Pathogenic Bacteria in Water. Applied and Environmental Microbiology,
76(19): 6477-6484.
Vital, M., Dignum, M., Magic-Knezev, A., Ross, P., Rietveld, L. and Hammes, F.
2012. Flow cytometry and adenosine tri-phosphate analysis: Alternative
possibilities to evaluate major bacteriological changes in drinking water treatment
and distribution systems. Water Research, 46(15): 4665-4676.
Weinrich, L., Jjemba, P., Giraldo, E. and LeChevallier, M. 2010. Implications of
organic carbon in the deterioration of water quality in reclaimed water
distribution systems. Water Research, 44(18): 5367-5375.
WHO Guidelines for Drinking-Water Quality, 3rd
edition. Geneva, World Health
Organization, 2003.