determination of the joint uncertainty domain of rate ...yju/1st-workshop summary and...
TRANSCRIPT

Determination of the joint uncertainty domain of rate parameters:
The case study of hydrogen combustion
T. Turányi, T. Nagy, I.Gy. Zsély, T. Varga,
R. Pálvölgyi, I. Sedyó, C. Olm, H. J. Curran
Laboratory for Chemical KineticsInstitute of Chemistry, Eötvös University (ELTE),
Budapest, Hungary

Uncertainty of rate coefficients
( ) ( ) ( )( ) ( ) ( )( )TkTkTkTkTf0max
10min0
10 loglog ==
Definition of uncertainty factor f:
( ) fk3
10lnln =σ
Calculation of the variance of ln k from uncertainty factor f(assuming 3σ deviation between ln k0 and ln kmax):
The databases of evaluated combustion kinetic rate parameterse.g. Baulch et al., 2005
- recommended temperature independent (constant) uncertainty(usually selected from values f = 0.1, 0.3, 0.5, 0.7, and 1.0)
OR
- uncertainty is defined at some temperatures (or temperature intervals)
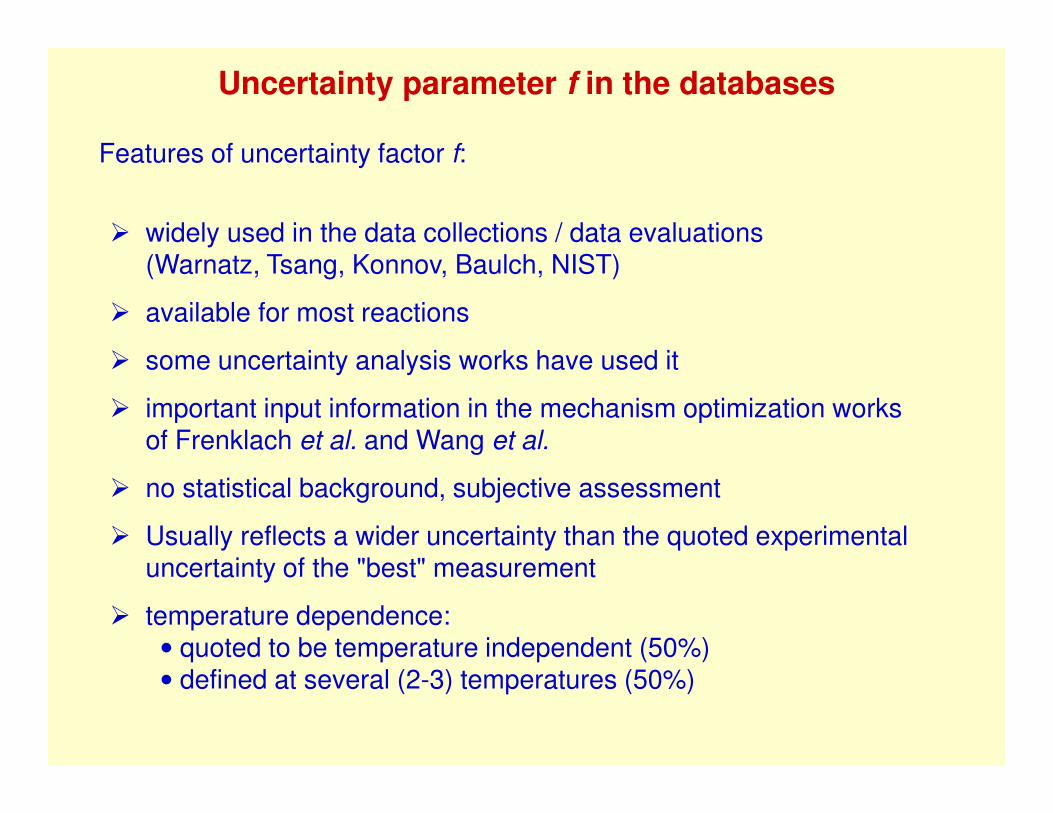
Uncertainty parameter f in the databases
Features of uncertainty factor f:
� widely used in the data collections / data evaluations(Warnatz, Tsang, Konnov, Baulch, NIST)
� available for most reactions
� some uncertainty analysis works have used it
� important input information in the mechanism optimization worksof Frenklach et al. and Wang et al.
� no statistical background, subjective assessment
� Usually reflects a wider uncertainty than the quoted experimentaluncertainty of the "best" measurement
� temperature dependence:• quoted to be temperature independent (50%)• defined at several (2-3) temperatures (50%)
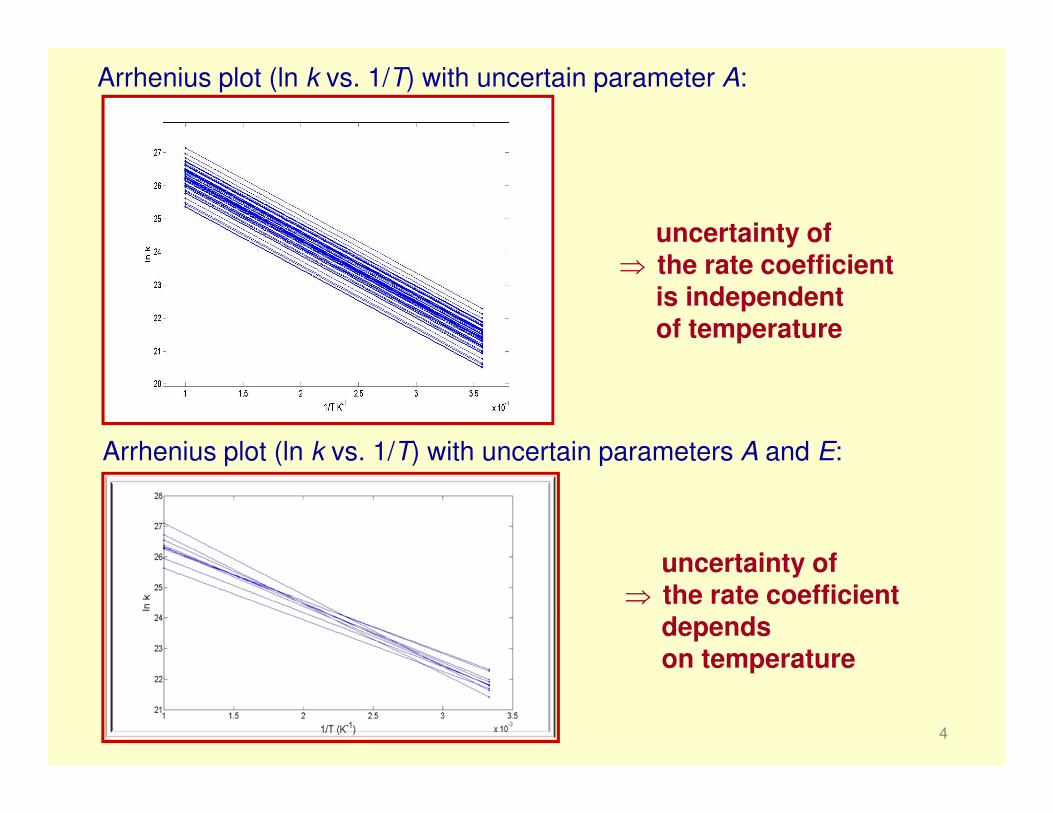
Arrhenius plot (ln k vs. 1/T) with uncertain parameter A:
4
uncertainty of ⇒ the rate coefficient
is independentof temperature
Arrhenius plot (ln k vs. 1/T) with uncertain parameters A and E:
uncertainty of ⇒ the rate coefficient
dependson temperature

• Matrix-vector form of the linearized Arrhenius equation:
• The covariance matrix of the Arrhenius parameters andits relation to the uncertainty of the rate coefficient:
⇒⇒⇒⇒ the temperature dependent standard deviation of kcan be calculated from a quadratic form. 5
extended Arrhenius expression:
linearized form:
( ) θpT
=θκ[ ]εnα=:Tp [ ]1T ln1: −
−= TTθ
( ) θΣθ p
T=θσ
κ
( )( )
=−−=2
2
2
εεεεααε
εεαα
εααεααα
σσσσσ
σσσσσ
σσσσσ
nn
nnnnn
nn
rr
rr
rrT
p ppppΣ
( ) ( )RTEATTkn /exp −=
( ){ } { } { { }{
{ } { }{
1lnlnln
−
⋅−⋅+=
θεθαθκ
TRET
n
nATk32132143421
6
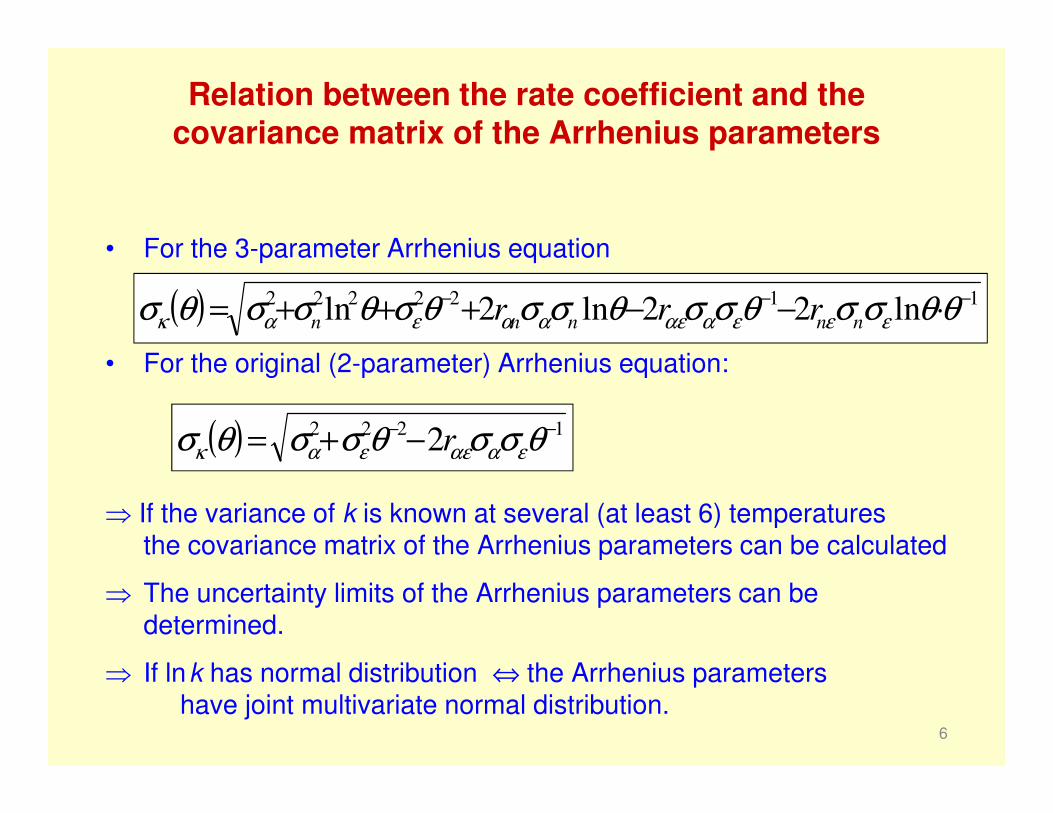
Relation between the rate coefficient and thecovariance matrix of the Arrhenius parameters
• For the 3-parameter Arrhenius equation
• For the original (2-parameter) Arrhenius equation:
⇒ If the variance of k is known at several (at least 6) temperaturesthe covariance matrix of the Arrhenius parameters can be calculated
⇒ The uncertainty limits of the Arrhenius parameters can be determined.
⇒ If lnk has normal distribution ⇔ the Arrhenius parametershave joint multivariate normal distribution.
( ) 1122222 ln22ln2ln −−−⋅−−+++= θθσσθσσθσσθσθσσθσ εεεααεααεακ nnnnn rrr
( ) 1222 2 −−−+= θσσθσσθσ εααεεακ r

Reaction O + N2O → NO + NOtemperature dependence of the uncertainty of the
rate coefficient (1000K−−−−4000K)
7
9045,0
885
355,0
=
=
=
αε
ε
α
σ
σ
r
( ) ( )
( )
13930
32,134
/exp
1
=
=
⋅−=
−=
−
ε
α
θθ εακ
RTEATk

Reaction O + N2O → NO + NO
8
Temperature dependent1D normal
probability density function (pdf) of the rate coefficient
(1000 K – 4000 K)
( ) 1222 2 −−−+= θσσθσσθσ εααεεακ r
Temperature independentmultivariate joint normal
probability density function (pdf)of the Arrhenius parameters

Estimation of the temperature dependent uncertainty
Reassessment of the f(T) functions is needed!
Example:
H + O2 = OH + O
For most of the reactions the data evaluations define
- temperature independent f ( constant f(T) function)OR
- a verbally defined f(T) function”f = 0.1 at 800 K raising to 0.2 at 2000 K ”

0,0000 0,0002 0,0004 0,0006 0,0008 0,0010 0,0012 0,00148
9
10
11
12
13
14lg
(k /
cm3 m
ol-1
s-1)
(1 / T) / K-1
Reaction H + O2 → O + OH
800 K3000 K
All experimental and theoretical (TST) results from the NIST database
Baulch et al., 2005
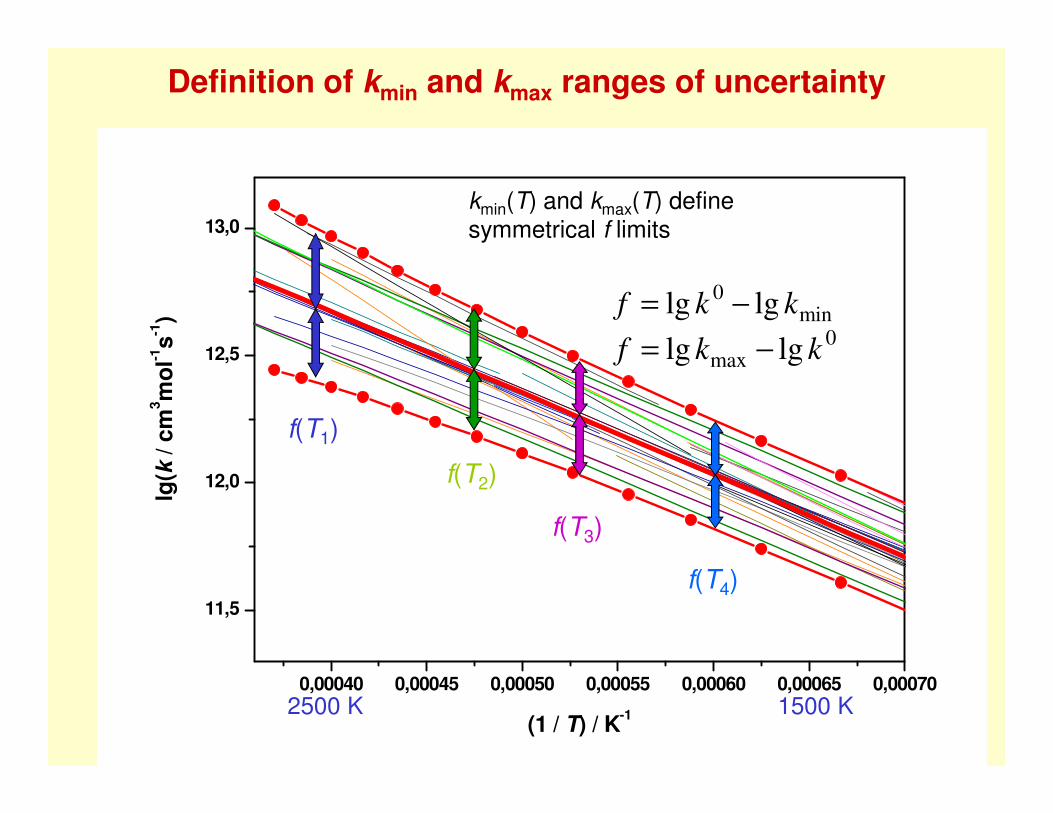
0,00040 0,00045 0,00050 0,00055 0,00060 0,00065 0,00070
11,5
12,0
12,5
13,0
lg(k
/ cm
3 mo
l-1s-1
)
(1 / T) / K-1
Definition of kmin and kmax ranges of uncertainty
f(T1)
f(T2)
f(T3)
f(T4)
kmin(T) and kmax(T) define symmetrical f limits
min0 lglg kkf −=
0max lglg kkf −=
2500 K 1500 K

500 1000 1500 2000 2500 30000,20
0,22
0,24
0,26
0,28
0,30
0,32
0,34
f
T / K
Empirical f(T) points and fitted f(T) function
TrTTrTrTTTf nnnnn ln2ln22ln10ln
3)( 1122222
σσ+σσ−σσ−σ+σ+σ= αα
−
εε
−
εααε
−
εα
empirical f(T) points
fitted f(T) function
Nagy, T.; Turányi, T. Uncertainty of Arrhenius parametersInt. J. Chem. Kinet., 43, 359-378(2011)

Temperature dependence of the uncertainty of the rate coefficients of the most important H/O reactions
The procedure above was repetead for several H/O reactions
Sedyó, I; Nagy, T; Zsély, I; Turányi, T Uncertainty of the Arrhenius parameters of important elementary reactions of thehydrogen-oxygen systemProceedings of the ECM, 2011
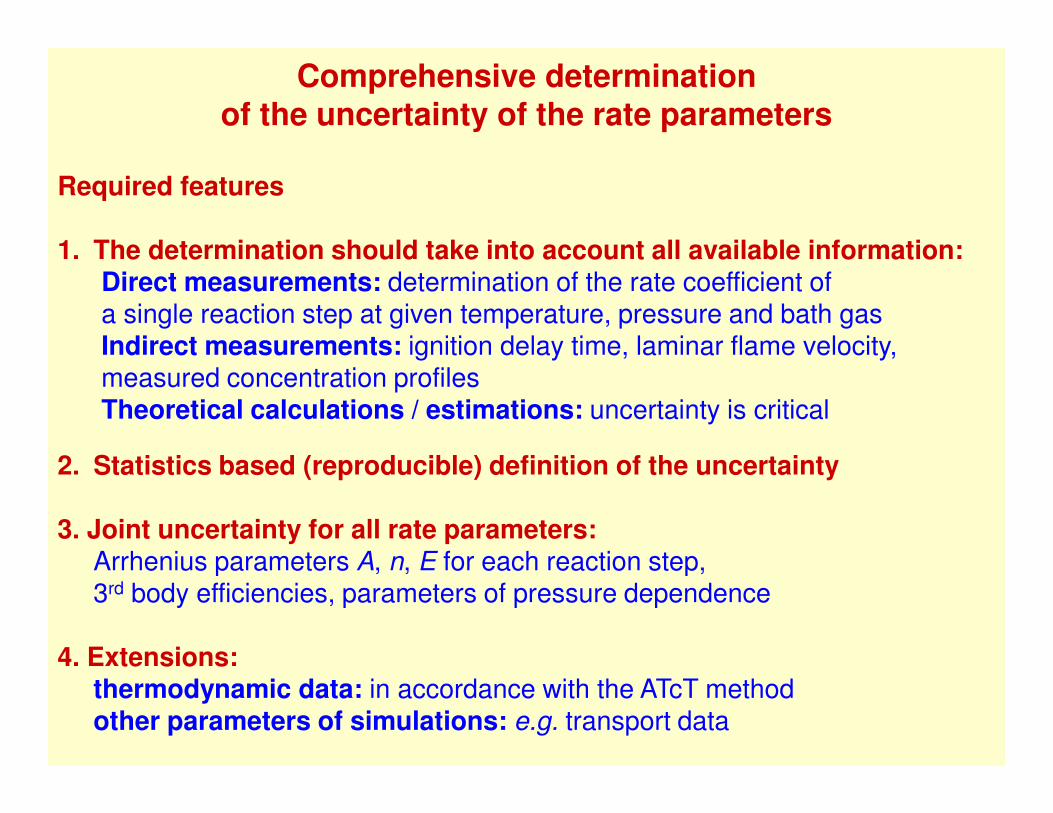
Required features
1. The determination should take into account all available information:Direct measurements: determination of the rate coefficient of a single reaction step at given temperature, pressure and bath gasIndirect measurements: ignition delay time, laminar flame velocity,measured concentration profilesTheoretical calculations / estimations: uncertainty is critical
2. Statistics based (reproducible) definition of the uncertainty
3. Joint uncertainty for all rate parameters:Arrhenius parameters A, n, E for each reaction step,3rd body efficiencies, parameters of pressure dependence
4. Extensions:thermodynamic data: in accordance with the ATcT methodother parameters of simulations: e.g. transport data
Comprehensive determinationof the uncertainty of the rate parameters

Step 1: Collection of large amount of indirect measurements
Aim: collection of all direct and indirect measurement, ever measured,related to hydrogen combustion
Reality: pre-selection was needed, many obsolate measurements(before about 1950) were not considered
� ignition delay time measurements in shock tubes: 796 data points in 55 dataseries from 17 publications
� ignition delay time measurements in rapid compression machines (RCMs): 623 data points in 44 data series from one publication
� Laminar flame velocity measurements: 622 data points in 64 data series from23 publications
� concentrations measured in PSRs: 152 data points in 9 data series from onepublication
� concentration−−−−distance profiles in turbulent flow reactors: 214 data points in16 data series from one publication
Total: 2407 data points in 188 data series from 43 publications.
All experimental data were encoded in PrIMe XML data format.

PrIMe database
PrIMe (Process Informatics Model) database of Michael Frenklach:
www.primekinetics.org
Open database that contains the description of several hundred indirect combustion measurements.
Special XML data format: defines all experimental conditions and measurement data.
We have created computer codes for
- encoding literature data OR other experimental data in PrIMe XML format
- carrying out simulations based on a PrIMe datafile(ignition in shock tube, laminar stationary flame, tubular reactor)
- calculating the deviations betweenthe experimental and simulated data

<commonProperties><property description="pressure behind reflected shock waves"
label="P5" name="pressure" units="atm"><value>64</value> <uncertainty bound="plusminus" kind="relative" transformation="1">0.01</uncertainty>
</property><property name="initial composition">
<component><speciesLink preferredKey="H2" primeID="s00009809" /> <amount units="mole fraction">0.0033</amount>
</component><component>
<speciesLink preferredKey="O2" primeID="s00010295" /> <amount units="mole fraction">0.00167</amount>
</component><component>
<speciesLink preferredKey="Ar" primeID="s00000049" /> <amount units="mole fraction">0.99503</amount>
</component></property>
</commonProperties>
PrIMe-format encoding of a shock tube experiment

Step 2: Cross testing of mechanisms vs. dataMechanisms:
Group 1: hydrogen combustion mechanisms�Ó Conaire 2004: 10 species, 21 reactions
Ó Conaire, M.; Curran, H. J.; Simmie, J. M.; Pitz, W. J.; Westbrook, C. K. Int. J. Chem. Kinet. 2004, 36, 603-622.�Konnov 2008: 10 species, 33 reactions
Konnov, A. A. Combust. Flame 2008, 152, 507-528.�Hong 2011: 10 species, 31 reactions
Hong, Z.; Davidson, D. F.; Hanson, R. K. Combust. Flame 2011, 158, 633-644.
�Burke 2012: 11 species, 27 reactionsBurke, M. P.; Chaos, M.; Ju, Y.; Dryer, F. L.; Klippenstein, S. J. Int. J. Chem. Kinet. 2012, 44, 444-474.
Group 2: originally developed for wet CO combustion�Zsély 2005: 10 species, 32 reactions
Zsély, I. G.; Zádor, J.; Turányi, T. Proc. Combust. Instit. 2005, 30/1, 1273-1281.�Sun 2007: 11 species, 32 reactions
H. Sun, S.I. Yang, G. Jomaas, C.K. Law, Proc. Comb. Inst. 2007, 31, 439-446.�CRECK 2012: 11 species, 21 reactions
Frassoldati, A.; Ranzi, E.; Faravelli, T. CRECK modeling Group Hydrogen/CO mechanism version 1201.http://creckmodeling.chem.polimi.it/kinetic.html
�Rasmussen 2008: 10 species, 30 reactionsC. L. Rasmussen; J. Hansen; P. Marshall; P. Glarborg, Int. J. Chem. Kinet. 2008, 40, 454-480.
�Keromnes 2012: 12 species, 33 reactionsA. Keromnes, W. K. Metcalfe, K. A. Heufer, N. Donohoe, A. K. Das, C. J. Sung, J. Herzler, C. Naumann, P. Griebel, O. Mathieu,M. C. Krejci, E. L. Petersen, W. J. Pitz, H. J. Curran, Combust. Flame (submitted)
Group 3: originally developed for hydrocarbon combustion�GRI 3.0: 10 species, 29 reactions
Smith, G P; Golden, D M; Frenklach, M; Moriary, N W; Eiteneer, B; Goldenberg, M; Bowman, C T; Hanson, R K;Song, S; Gardiner, W C; Lissianski, V V; Qin, Z GRI-Mech 3.0 http://www.me.berkeley.edu/gri_mech/ 23/11/2011/
�Li 2007: 11 species, 25 reactionsLi, J.; Zhao, Z.; Kazakov, A.; Chaos, M.; Dryer, F. L.; Scire, J. J. J. Int. J. Chem. Kinet. 2007, 39, 109-136.
�USC 2007: 10 species, 28 reactionsH. Wang; X. You; A. V. Joshi; S. G. Davis; A. Laskin; F. Egolfopoulos; C. K. Law USC Mech Version II.High-Temperature Combustion Reaction Model of H2/CO/C1-C4 Compounds. http://ignis.usc.edu/USC_Mech_II.htm(May 2007)
�San Diego 2011: 11 species, 21 reactionsSan Diego Mechanism, version 2011-11-22. http://combustion.ucsd.edu
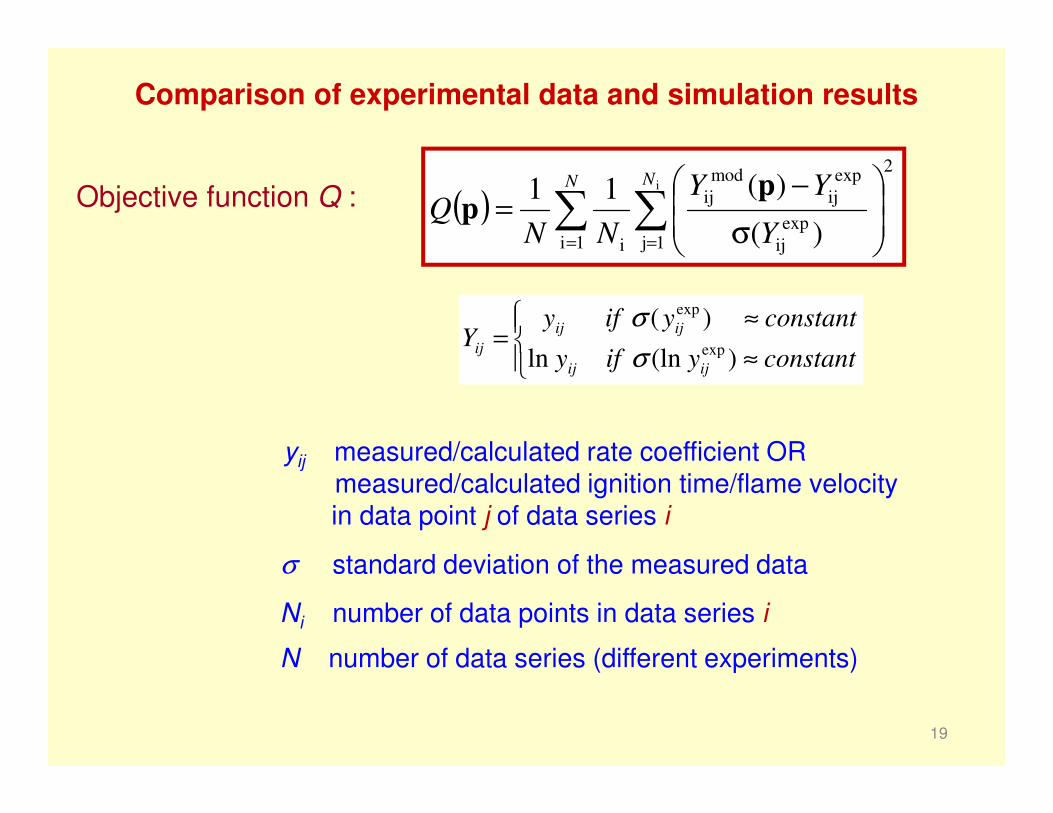
Comparison of experimental data and simulation results
19
Objective function Q :
yij measured/calculated rate coefficient ORmeasured/calculated ignition time/flame velocityin data point j of data series i
( ) ∑ ∑= =
σ
−=
N N
Y
YY
NNQ
1i 1j
2
exp
ij
exp
ij
mod
ij
i
i
)(
)(11 pp
Ni number of data points in data series i
N number of data series (different experiments)
σ standard deviation of the measured data
≈
≈=
constanty ify
constant y ifyY
ijij
ijij
ij)(lnln
)(exp
exp
σ
σ
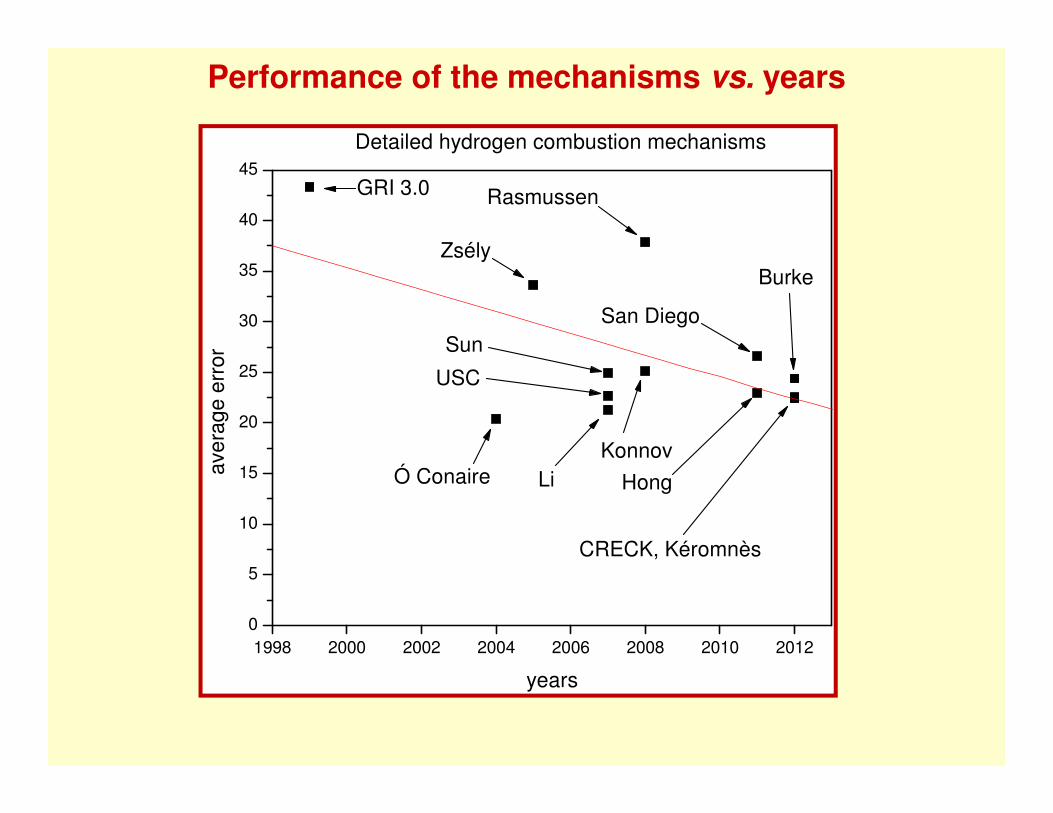
Performance of the mechanisms vs. years
1998 2000 2002 2004 2006 2008 2010 20120
5
10
15
20
25
30
35
40
45
LiÓ Conaireaver
age
erro
r
years
Detailed hydrogen combustion mechanisms
GRI 3.0
Konnov
USC
Rasmussen
Zsély
San Diego
Hong
CRECK, Kéromnès
Burke
Sun

Results of cross testing
Some indirect experimental data series are presumably wrong and thesewere excluded from the optimization and mechanism testing.
example: T. Asaba, W.C. Gardiner, R.F. Stubbelman, Proc. Combust. Inst., 10, 295-302(1965)
average of error function values
MechanismIgnition delays
PSR flame Overall performanceAsaba et al. (1965)
only
48.13 26.34 32.67 43.34 GRI 3.0 1999 184.31
13.89 49.40 30.80 20.42 Ó Conaire 2004 122.88
21.87 83.19 54.34 33.64 Zsély 2005 143.30
14.00 54.57 32.32 21.31 Li 2007 154.69
17.87 65.83 29.27 24.94 Sun 2007 159.96
16.33 51.98 32.06 22.70 USC 2007 Version II 161.65
15.12 82.59 31.52 25.12 Konnov 2008 153.68
31.55 82.11 36.14 37.87 Rasmussen 2008 152.07
16.80 54.48 29.78 22.97 Hong 2011 165.11
20.77 55.60 33.65 26.61 San Diego 2011 181.05
18.69 52.15 31.66 24.39 Burke 2012 171.97
11.88 57.08 48.03 22.43 CRECK 2012 157.02
14.39 65.39 30.74 22.56 Kéromnès 2012 163.74
634 136 200 970 No. data points 37
53 8 19 80 No. datasets 3
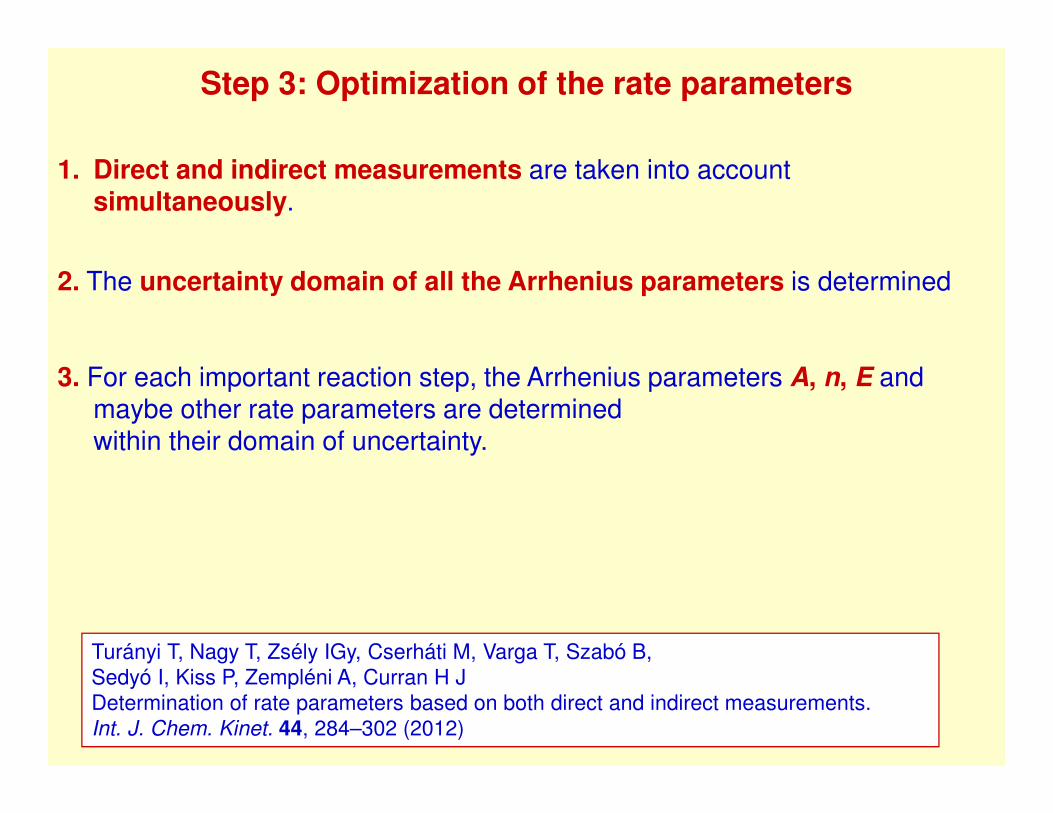
1. Direct and indirect measurements are taken into account simultaneously.
2. The uncertainty domain of all the Arrhenius parameters is determined
3. For each important reaction step, the Arrhenius parameters A, n, E and maybe other rate parameters are determinedwithin their domain of uncertainty.
Step 3: Optimization of the rate parameters
Turányi T, Nagy T, Zsély IGy, Cserháti M, Varga T, Szabó B, Sedyó I, Kiss P, Zempléni A, Curran H JDetermination of rate parameters based on both direct and indirect measurements.Int. J. Chem. Kinet. 44, 284–302 (2012)
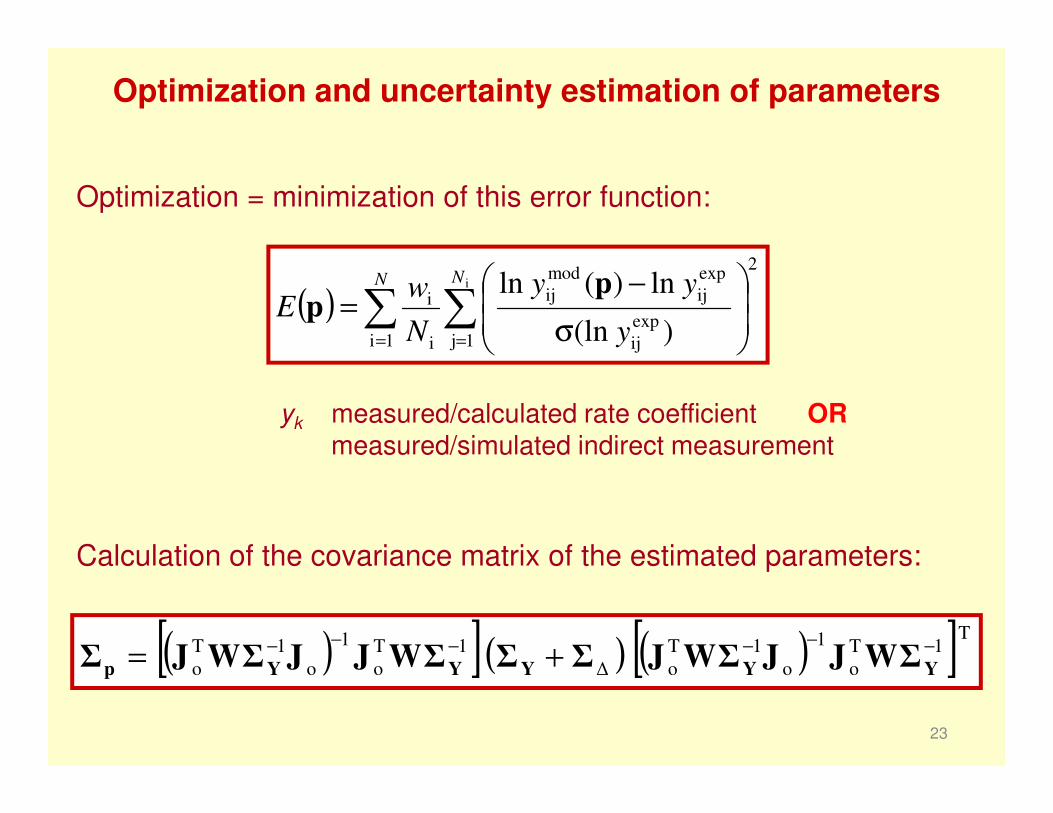
Optimization and uncertainty estimation of parameters
23
Calculation of the covariance matrix of the estimated parameters:
Optimization = minimization of this error function:
yk measured/calculated rate coefficient ORmeasured/simulated indirect measurement
( ) ∑ ∑= =
σ
−=
N N
y
yy
N
wE
1i 1j
2
exp
ij
exp
ij
mod
ij
i
ii
)(ln
ln)(ln pp
( )[ ]( ) ( )[ ]T 1T
o
1
o
1T
o∆
1T
o
1
o
1T
o
−−−−−−+= YYYYYp WΣJJWΣJΣΣWΣJJWΣJΣ

Transformation of the covariance matrix of parametersto „traditional” gas kinetics measures of uncertainty
covariance matrix of ln k → correlation r between the ln k values
( ) ( )( ) ΘΣΘΘ)pp)(pp(Θ))T()T())(T()T((T,Tcovji p,p
TT
jjii
T
jjiiji =−−=κ−κκ−κ=κκ
covariance matrix of Arrhenius parameters → covariance matrix of ln k
( )( ) ( )( )
)T()T(
T,TcovTr
ji
ji
ji
,
κκ
κκσσ
κκ=
( ) ( ) ( )Tfm
10lnklog10lnkln
f
10 =σ=σ
[ ]1T ln1:θ−
θ−θ=

Strategy for optimization
expe
rimen
t
num
ber
of d
atap
oint
s
H+
O2=
O+
OH
LPH
+O
2(+
M)=
HO
2(+
M)
O+
H2=
H+
OH
OH
+H
2=H
+H
2O
H2O
2+H
=H
2+H
O2
HO
2+H
=2O
H
HO
2+H
=H
2+O
2
HO
2+O
H<
=>
H2O
+O
2
Herzler et al. (2009a) 9 O OFujimoto and Suzuki (1967) 9 O OZhang et. al. (2012a) 7 O ONaumann et. al. (2011a) 19 O ONaumann et. al. (2011b) 26 O OPetersen et al. (2003a) 9 O OCheng and Oppenheim (1984a) 58 O OPetersen et al. (2003b) 24 O OPetersen et al. (2003c) 4 O OPetersen et al. (1996a) 16 O O OPetersen et al. (1996b) 6 O O OSlack (1977) 12 O O OBhaskaran et al. (1973) 14 O O OWang et al. (2003a) 12 O O ONaumann et. al. (2011c) 13 O O OChaumeix et al. (2007a) 5 O O OChaumeix et al. (2007b) 7 O O OChaumeix et al. (2007c) 5 O O OCohen et. al. (1967) 21 O O OCheng and Oppenheim (1984b) 56 O O O ONaumann et. al. (2011d) 19 O O O ONaumann et. al. (2011e) 19 O O O O
STEP1
STEP2
STEP3
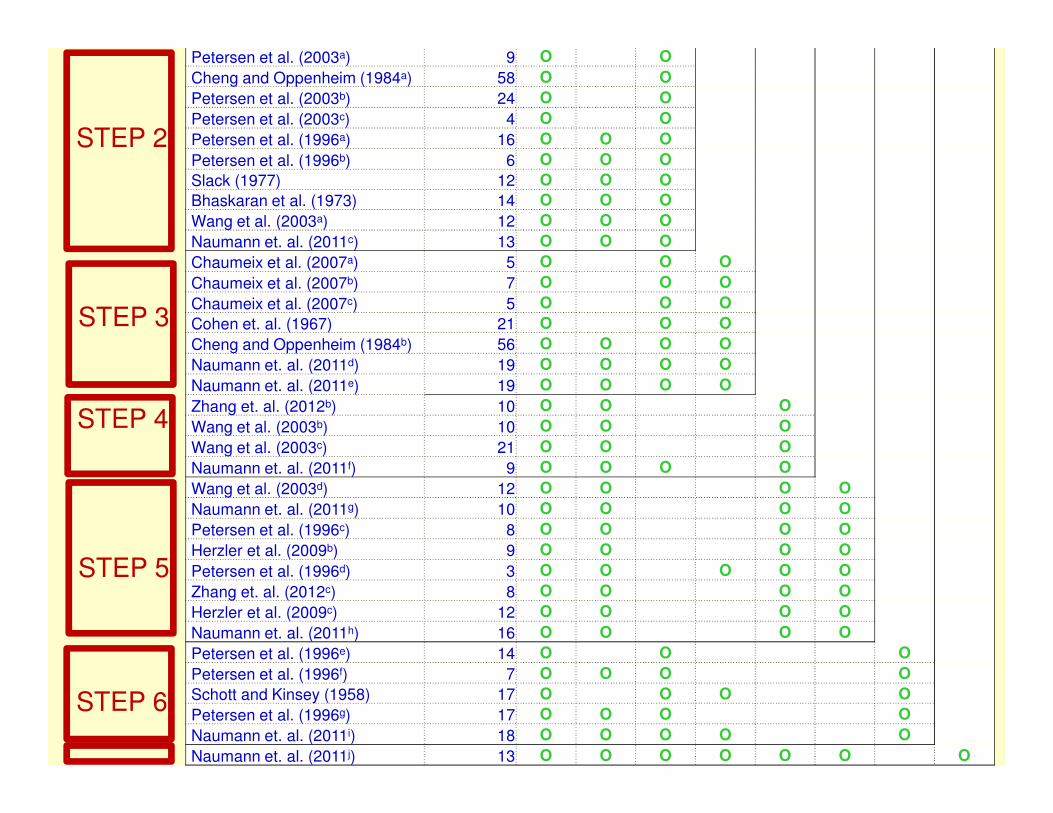
Petersen et al. (2003a) 9 O OCheng and Oppenheim (1984a) 58 O OPetersen et al. (2003b) 24 O OPetersen et al. (2003c) 4 O OPetersen et al. (1996a) 16 O O OPetersen et al. (1996b) 6 O O OSlack (1977) 12 O O OBhaskaran et al. (1973) 14 O O OWang et al. (2003a) 12 O O ONaumann et. al. (2011c) 13 O O OChaumeix et al. (2007a) 5 O O OChaumeix et al. (2007b) 7 O O OChaumeix et al. (2007c) 5 O O OCohen et. al. (1967) 21 O O OCheng and Oppenheim (1984b) 56 O O O ONaumann et. al. (2011d) 19 O O O ONaumann et. al. (2011e) 19 O O O OZhang et. al. (2012b) 10 O O OWang et al. (2003b) 10 O O OWang et al. (2003c) 21 O O ONaumann et. al. (2011f) 9 O O O OWang et al. (2003d) 12 O O O ONaumann et. al. (2011g) 10 O O O OPetersen et al. (1996c) 8 O O O OHerzler et al. (2009b) 9 O O O OPetersen et al. (1996d) 3 O O O O OZhang et. al. (2012c) 8 O O O OHerzler et al. (2009c) 12 O O O ONaumann et. al. (2011h) 16 O O O OPetersen et al. (1996e) 14 O O OPetersen et al. (1996f) 7 O O O OSchott and Kinsey (1958) 17 O O O OPetersen et al. (1996g) 17 O O O ONaumann et. al. (2011i) 18 O O O O ONaumann et. al. (2011j) 13 O O O O O O O
STEP 4
STEP 2
STEP 3
STEP 5
STEP 6

Results of optimization
• A new set of optimized rate parameters(in this case: 26 optimized parameters (23 Arrhenius parameters of 8 reactions
3 third body efficiencies)
• Covariance matrix of all optimized parametersCONVERTED TO
• f(T) uncertainty function for each rate coefficient• r(T) correlation function of pairs of rate coefficients
reaction OH+H2=H2O+H:
0,4 0,6 0,8 1,0
12,0
12,5
13,0
13,5
log
(k /
(cm
3 mol
-1s-1
))
1000 K / T
10001200140020002400
_____ literature k value- - - - - literature k uncertainty
_____ optimized k value- - - - - optimized k uncertainty

Step 4: Testing the optimized mechanism againstother mechanisms
0.90 0.92 0.94 0.96 0.98 1.0010-4
10-3
10-2
log
(τ /
s)
1000 K / T
exp. GRI 3.0 1999Conaire 2004 س Zsély 2005 Li 2007 Sun 2007 USC 2007 II Konnov 2008 Rasmussen 2008 Hong 2011 San Diego 2011 Burke 2012 CRECK 2012 Keromnes 2012 optimized mechanism
The optimization code created figures onthe agreement of the simulation results and the experimental points.
experiments: Pang, G.A., Davison, D.F., Hanson, R.K., Proc. Combust. Inst., 32, 181-188(2009)Fig. 3., full square; 4% H2 / 2% O2 / Ar, Pt=0 = 3.5 atm

Testing the optimized mechanism against other mechanisms
mechanisms set #1GRI 3.0 1999 43.63Ó Conaire 2004 11.01Zsély 2005 16.64Li 2007 11.47Sun 2007 15.72USC 2007 II 14.31Konnov 2008 12.42Rasmussen 2008 28.58Hong 2011 14.44San Diego 2011 18.18Burke 2012 16.49CRECK 2012 9.28Kéromnès 2012 11.94optimized mechanism 8.25
set #1: Ignition time experiments used at the optimization
error function values (smaller is better)

Testing the optimized mechanism against other mechanisms
mechanisms set #1 set#2GRI 3.0 1999 43.63 48.13Ó Conaire 2004 11.01 13.89Zsély 2005 16.64 21.87Li 2007 11.47 14.00Sun 2007 15.72 17.87USC 2007 II 14.31 16.33Konnov 2008 12.42 15.12Rasmussen 2008 28.58 31.55Hong 2011 14.44 16.80San Diego 2011 18.18 20.77Burke 2012 16.49 18.69CRECK 2012 9.28 11.88Kéromnès 2012 11.94 14.39optimized mechanism 8.25 11.59
set #1: Ignition time experiments used at the optimization
set #2: All available ignition time experiments

Testing the optimized mechanism against other mechanisms
mechanisms set #1 set#2 set#3GRI 3.0 1999 43.63 48.13 43.34Ó Conaire 2004 11.01 13.89 20.42Zsély 2005 16.64 21.87 33.64Li 2007 11.47 14.00 21.31Sun 2007 15.72 17.87 24.94USC 2007 II 14.31 16.33 22.70Konnov 2008 12.42 15.12 25.12Rasmussen 2008 28.58 31.55 37.87Hong 2011 14.44 16.80 22.97San Diego 2011 18.18 20.77 26.61Burke 2012 16.49 18.69 24.39CRECK 2012 9.28 11.88 22.43Kéromnès 2012 11.94 14.39 22.56optimized mechanism 8.25 11.59 19.35
set #1: Ignition time experiments used at the optimization
set #2: All available ignition time experiments
set #3: All types of data (ignition time, PSR, laminar flame velocity)

Testing the optimized mechanism against other mechanisms
mechanisms set #1 set#2 set#3GRI 3.0 1999 43.63 48.13 43.34Ó Conaire 2004 11.01 13.89 20.42Zsély 2005 16.64 21.87 33.64Li 2007 11.47 14.00 21.31Sun 2007 15.72 17.87 24.94USC 2007 II 14.31 16.33 22.70Konnov 2008 12.42 15.12 25.12Rasmussen 2008 28.58 31.55 37.87Hong 2011 14.44 16.80 22.97San Diego 2011 18.18 20.77 26.61Burke 2012 16.49 18.69 24.39CRECK 2012 9.28 11.88 22.43Kéromnès 2012 11.94 14.39 22.56optimized mechanism 8.25 11.59 19.35
1998 2000 2002 2004 2006 2008 2010 20120
5
10
15
20
25
30
35
40
45
LiÓ Conaireaver
age
erro
r
years
Detailed hydrogen combustion mechanisms
GRI 3.0
Konnov
USC
Rasmussen
Zsély
San Diego
Hong
optimized
CRECK, Kéromnès
Burke
Sun
set #1: Ignition time experiments used at the optimization
set #2: All available ignition time experiments
set #3: All types of data (ignition time, PSR, laminar flame velocity)
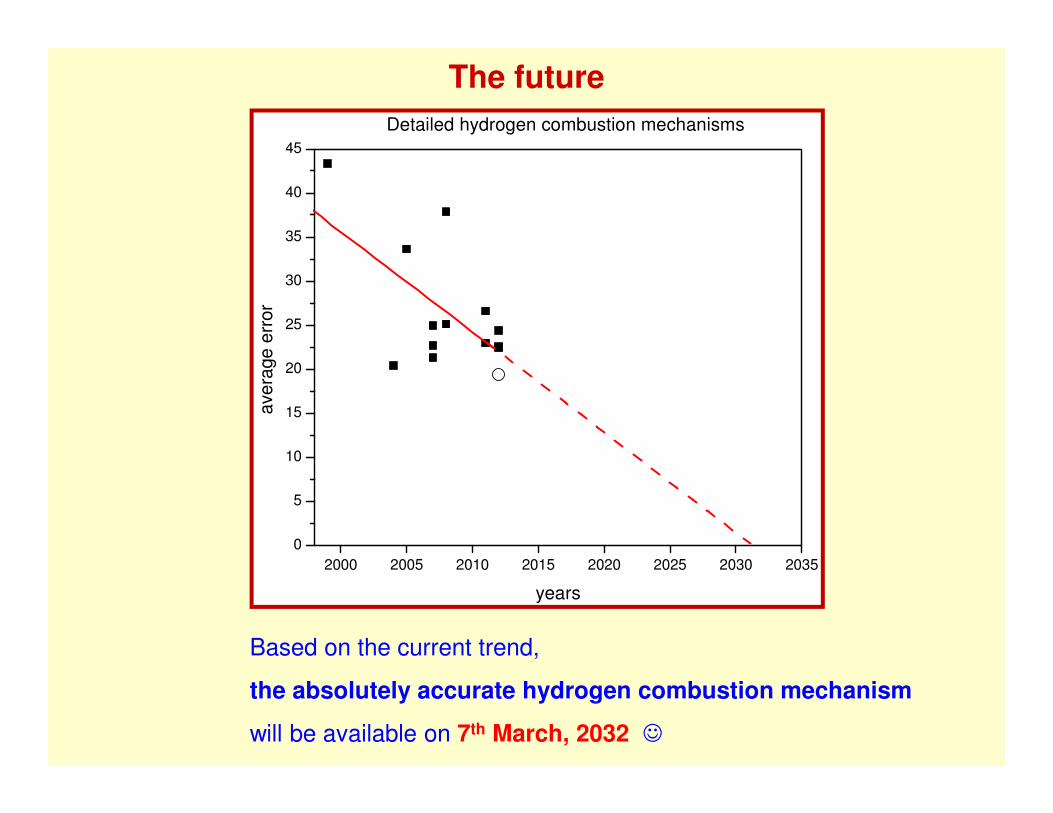
The future
Based on the current trend,
the absolutely accurate hydrogen combustion mechanism
will be available on 7th March, 2032 ☺
2000 2005 2010 2015 2020 2025 2030 20350
5
10
15
20
25
30
35
40
45
aver
age
erro
r
years
Detailed hydrogen combustion mechanisms

Summary
1 The f(T) uncertainty parameters available from the data collectionsare realistic, but have several shortcomings, like itrefers to the uncertainty of k only.Needed: a joint uncertainty of the rate parameters.
2 Assessment of the joint uncertainty domain of theArrhenius parameters of a selected reaction stepbased on all direct measurements and TST calculations.
• upper estimation of the uncertainty• no information about the correlation of two k values
3 Comprehensive evaluation of the uncertainty of all rate parameters:For a given chemical kinetic system,all direct, indirect and theoretical results are collectedassessment of the uncertainty of input data⇒⇒⇒⇒ new, physically meaningful rate parameters⇒⇒⇒⇒ information about the joint uncertainty of rate parameters
⇒⇒⇒⇒ better simulation results⇒⇒⇒⇒ quantification of the uncertainty of the simulation results

Acknowledgement
For the helpful discussions
Mike J. Pilling, Judit Zádor, János Tóth
Financial support
ERA Chemistry (NN100523)
TÁMOP 4.2.1/B-09/1/KMR-2010-0003
COST CM0901 Detailed Chemical Models for Cleaner Combustion
OTKA T68256, OTKA K84054

ThankThankThankThank youyouyouyou allallallall
forforforfor youryouryouryour attentionattentionattentionattention!!!!