determination of the fuel wood properties of …
TRANSCRIPT
GSJ: VOLUME 6, ISSUE 7, July 2018 1019
GSJ© 2018
www.globalscientificjournal.com
GSJ: Volume 6, Issue 7, July 2018, Online: ISSN 2320-9186
www.globalscientificjournal.com
DETERMINATION OF THE FUEL WOOD PROPERTIES
OF SELECTED NIGERIAN WOOD TREES Evbuomwan B.O and Okorji C.J
Department of Chemical Engineering, University of Port Harcourt, Port Harcourt, Nigeria
Abstract
Wood has originally and primarily been the source of energy for many industrial and domestic processes. Certain properties of wood such as moisture content, density, ash content, fuel value index and calorific value determine the fuel value of each wood tree species. In this research , fuel wood properties for six selected Nigerian wood trees were determined; Peltophorum pterocarpum, Terminalia catappa, Psidium guajava, Azadirachta indica, Gmelina arborea and Mangifera indica. Standard empirical procedures were used to determine the moisture content, density, ash content and volatile content while net calorific value and fuel value index were determined by using analytical calculations. The results obtained for moisture content, density, volatile content, ash content, net calorific value and Fuel value index are as follows: Peltophorum pterocarpum 66.97%, 0.4108 g/cm3, 67 %, 4.5 %, 4.4765 KJ/g and 40.86 , Terminalia catappa, 69.37%, 0.3263 g/cm3, 65%, 4%, 3.9739 KJ/g and 32.41, I Psidium guajava, 42.21%, 0.6491g/cm3, 69%, 7%, 9.6612KJ/g and 89.59, Azadirachta indica, 40.99%, 0.6813g/cm3, 52%, 10.5%, 9.9167KJ/g and 64.35, Gmelina arborea, 36.62%, 0.44 g/cm3, 68%, 2.5%, 10.8318 KJ/g and 190.64 and Mangifera indica ,36.02%, 0.6652g/cm3, 59%, 5.5%, 10.9574KJ/g and 132.53 respectively. Gmelina arborea produces the best fuel value index irrespective of its low density because of its low ash content and moisture content while Peltophorum pterocarpum has the least. Kendall tau shows strong similarity in rank between net calorific value and the fuel value index (Kendall tau = 0.7333, p-value = 0.0388 ).
Keywords: Wood trees, Fuel wood Fuel value index, Rank coefficient, Net calorific value
GSJ: VOLUME 6, ISSUE 7, July 2018 1020
GSJ© 2018
www.globalscientificjournal.com
Introduction
Wood fuels have always played an important role in the sourcing of energy by mankind. It is an
ageless energy source known for its ergonomics. It has been at the forefront for combustible
fuels because of its availability, renewability and ease of conversion into energy (Tillman, 1978).
Mankind’s utilization of heat from wood fires to cook and keep warm was one of the early
applications of wood fuels in human history. Although the uses of wood have expanded as
science and technology grows, its main application in the world today is as a fuel for both
domestic and industrial heating. Wood is used as a building and construction material for houses
and bridges. It is used as a raw material for producing equipment, weapons, tools and
implements like bows, arrows, shovels, spears, hoes, wheel barrows etc. It can be used for
making clothing materials and can be even used as food. Yet amongst all these use cases, wood
fuels make up more than half of the consumption of wood in the world according to the Food and
Agricultural Organization of the United Nations (Trossero, 2002).
The use of wood as a fuel has been in decline for years now because of the oil boom of the 20th
century (Tillman, 1978). However, it has seen a recent resurgence because of the issues facing
fossil fuels today. Also, the environmental consequences have been an additional concern in the
fossil fuel energy discourse today. Fossil fuels are not recyclable. They produce waste products
like carbon dioxide which they do not take back. Oil spills and entire cities enveloped in smog
are not making the situation look good at all, both in real life and on paper. Wood, on the other
hand is making a comeback because of its availability. Wood is also cheap. It is the primary
energy source in developing countries today. Even developed countries are working around the
inefficiencies of wood fuels by building more robust combustion systems for energy recovery.
Trees, the primary source of wood, are known for their carbon sequestration. Trees soak up tons
of carbon dioxide from the atmosphere and trap carbon in their tissues. Wood burning is just a
part of the self-recycling process. Biodegradability of wood and wood products makes it an
excellent choice as fuel (Krajnc, 2015). Unused wood, partially combusted wood and charcoal
are all biodegradable organic materials.
The importance of wood as a fuel today has driven research into ways to better select wood fuel
species and optimize the entire combustion process for maximal release of energy. Wood
properties such as moisture content, calorific value, ash content, density and specific gravity
have been obtained mostly by empirical means in order to possess better knowledge to decipher
which wood species make better fuels. Some properties such as fuel value index and combustion
efficiency have been developed with the aid of numerical calculations to help in ranking these
species. The fuel value index incorporates multiple properties considering the fact whether each
property is a negative or positive factor. There are some characteristics that define the choice of
a species for wood and these includes: the kind of flame, the length of the flame, the amount and
duration of coal, the type of smoke produced, the ease of ignition, the flavor to food and the
quantity of ash left.
The Pearson correlation coefficient, spearman’s rank correlation coefficient and the one way
ANOVA has been primarily been used to determine the correlation, interrelation and
disassociation of the studied wood properties by most wood fuel researchers. These calculations
have been done manually or with software, such as SPSS. These techniques perform excellently
well but little or no work is found using alternate techniques like the Kendall tau rank
GSJ: VOLUME 6, ISSUE 7, July 2018 1021
GSJ© 2018
www.globalscientificjournal.com
coefficient. . Most of the contemporary works done on the fuel wood properties of Nigerian
wood trees are quite few and most of the wood trees in Nigeria are yet to be studied. Estimation
and prediction models for the wood fuel properties have rarely been documented algorithmically
The aim of this paper is to determine the fuel wood properties of selected Nigerian wood trees
and to develop a representative estimation model for wood sample properties using linear
regression techniques.
Materials and Methods
Wood sample collection and preparation
The wood samples for this research were obtained from the Niger Delta region specifically,
Choba, Port Harcourt ,Nigeria (4.8933650N, 6.908341
0E) and its environs. These wood fuel
species are well distributed all over Nigeria. Hence, they are representative of the wood tree
biosphere in Nigeria.
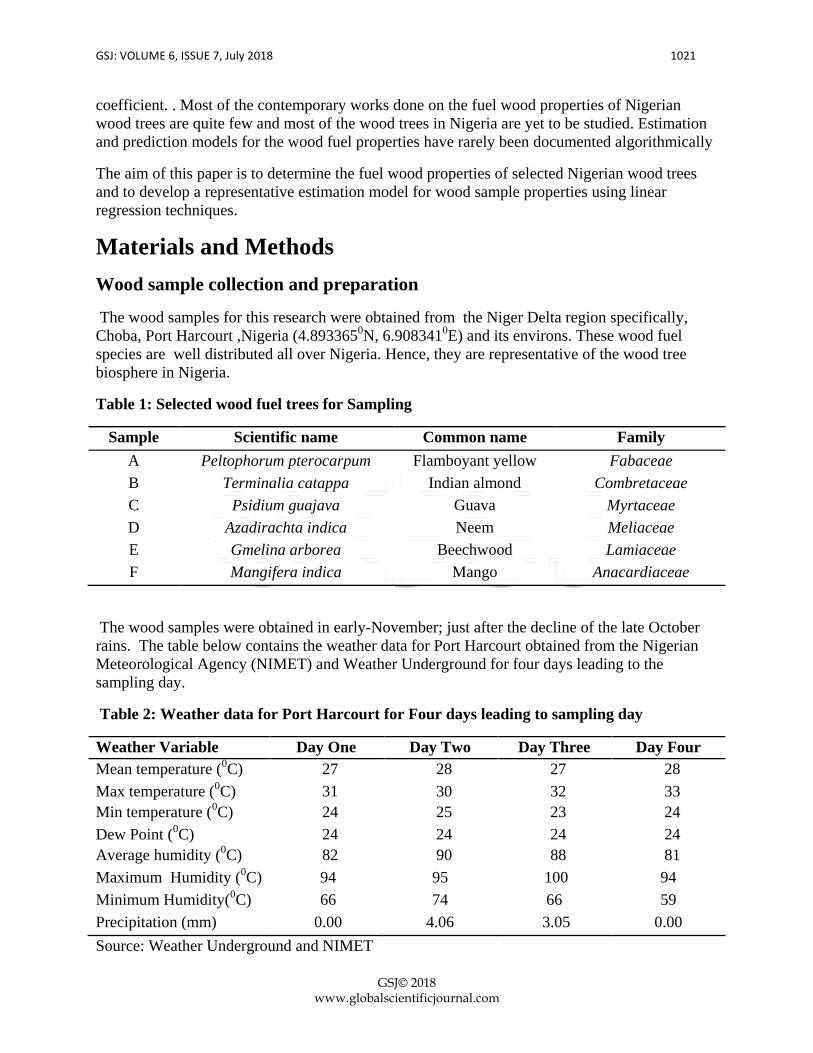
Table 1: Selected wood fuel trees for Sampling
Sample Scientific name Common name Family
A Peltophorum pterocarpum Flamboyant yellow Fabaceae
B Terminalia catappa Indian almond Combretaceae
C Psidium guajava Guava Myrtaceae
D Azadirachta indica Neem Meliaceae
E Gmelina arborea Beechwood Lamiaceae
F Mangifera indica Mango Anacardiaceae
The wood samples were obtained in early-November; just after the decline of the late October
rains. The table below contains the weather data for Port Harcourt obtained from the Nigerian
Meteorological Agency (NIMET) and Weather Underground for four days leading to the
sampling day.
Table 2: Weather data for Port Harcourt for Four days leading to sampling day
Weather Variable Day One Day Two Day Three Day Four
Mean temperature (0C) 27 28 27 28
Max temperature (0C) 31 30 32 33
Min temperature (0C) 24 25 23 24
Dew Point (0C) 24 24 24 24
Average humidity (0C) 82 90 88 81
Maximum Humidity (0C) 94 95 100 94
Minimum Humidity(0C) 66 74 66 59
Precipitation (mm) 0.00 4.06 3.05 0.00
Source: Weather Underground and NIMET
GSJ: VOLUME 6, ISSUE 7, July 2018 1022
GSJ© 2018
www.globalscientificjournal.com
The collected wood samples from each species were sawed to about 140 grams each with the aid
of a paring knife the entire inner and outer bark was removed exposing the inner living sapwood.
The branches had relatively few growth rings and hence, were young compared to their
respective trees. When all the bark was removed, the stripping continued until 100 grams non-
uniform cylindrical wood samples were obtained.
Determination of moisture content
The procedure for determination of the moisture content of the wood fuel samples was obtained
from “Standard Test Methods for Direct Moisture Content Measurement of Wood and Wood-
Base Materials” (ASTM D4442-92, 1992).
Procedure: 100 milligram samples were immediately dried on the trays of the forced convection
oven maintained at 1050C. The end point is reached when the mass loss in a 3 hour drying
interval is equal to or twice the analytical balance sensitivity (10 milligram).
Calculations: Moisture content was calculated as follows:
(1)
(2)
Where: A = original mass, g and B = oven-dry mass, g
Determination of density/specific gravity
The procedure for determination of the specific gravity of the wood fuel samples was obtained
from “Standard Test Methods for Specific Gravity of Wood and Wood-Based Materials” (ASTM
D2395-07, 2007). The sample was cut and weight determined with the aid of the analytical
balance. The specimen was treated by dipping in a solution of paraffin wax in carbon
tetrachloride (1 gram of paraffin wax in 150 cubic centimeter of carbon tetrachloride). Before
immersion, the carbon tetrachloride was allowed to evaporate for a few minutes. The gain in
weight due to the thin film of wax is negligible. The water level in the tube was read to an even
graduation mark before immersion. The specimen was immersed and kept submerged with a
slender pointed wire and the water level determined again. The difference in water level is equal
to the volume of the specimen.
Calculations: The specific gravity is calculated as follows:
(3)
GSJ: VOLUME 6, ISSUE 7, July 2018 1023
GSJ© 2018
www.globalscientificjournal.com
Where K = constant whose value is determined by the units used to measure weight and volume
(1 for gram and cubic centimeter, 1000 for gram and cubic millimeter), W = weight of oven-dry
specimen, V = volume of oven-dry specimen.
Determination of ash content
The procedure for determination of the ash content of the wood fuel samples was obtained from
“Standard Test Methods for Ash in Wood” (ASTM D1102-84, 1984). Calculations: The
percentage of ash for oven-dry wood was calculated as follows:
(4)
Where: W1 = weight of ash, and W2 = weight of oven-dry sample
Determination of volatile content
The procedure for determination of the ash content of the wood fuel samples was obtained
“Standard Test Methods for Volatile Matter in the Analysis of Particulate Wood Fuels” (ASTM
E872-82, 1982).
Calculations: The volatile matter percentage was calculated as follows:
(5)
Where Wc = weight of crucible and cover, g, Wi = initial weight, g and Wf = final weight, g.
Determination of net calorific value
The net calorific value of each wood fuel sample was calculated analytically using the following
formula (Valter Francescato, 2008):
( )
(6)
With NCV0 = 18.5 KJ/g (the oven-dry calorific value of different wood species varies within a
very narrow interval; 18.5 -19 KJ/g) (Valter Francescato, 2008)
GSJ: VOLUME 6, ISSUE 7, July 2018 1024
GSJ© 2018
www.globalscientificjournal.com
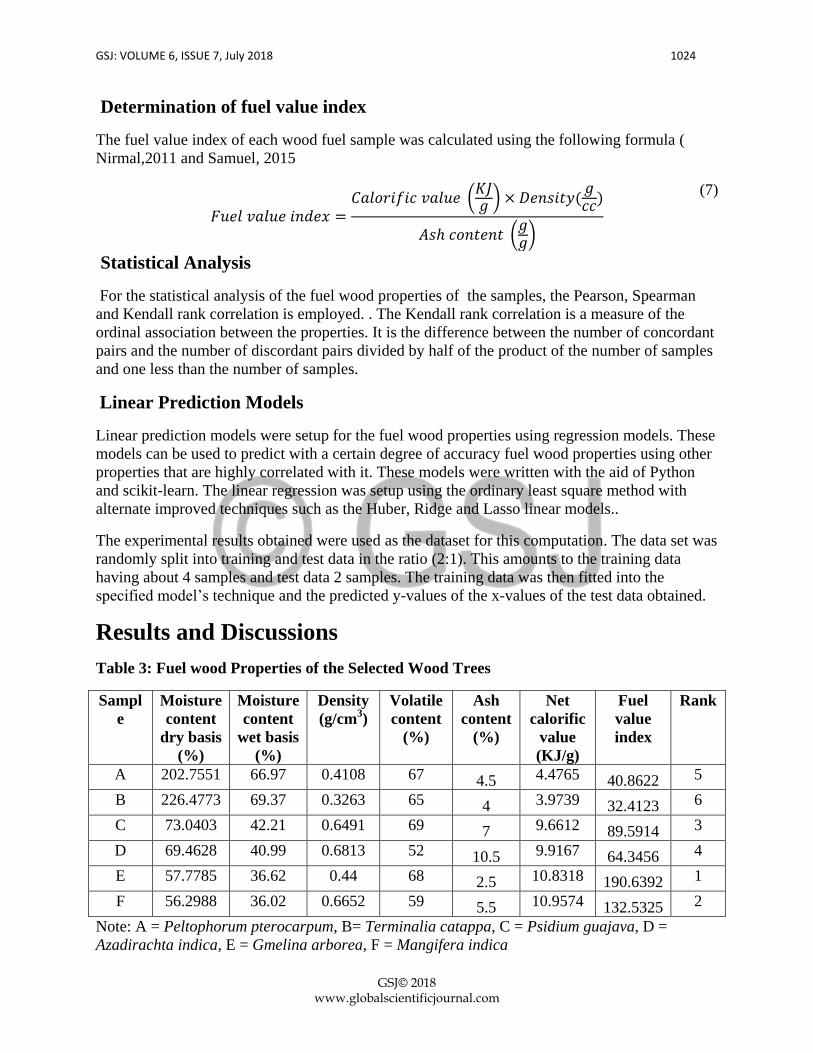
Determination of fuel value index
The fuel value index of each wood fuel sample was calculated using the following formula (
Nirmal,2011 and Samuel, 2015
(
) (
)
( )
(7)
Statistical Analysis
For the statistical analysis of the fuel wood properties of the samples, the Pearson, Spearman
and Kendall rank correlation is employed. . The Kendall rank correlation is a measure of the
ordinal association between the properties. It is the difference between the number of concordant
pairs and the number of discordant pairs divided by half of the product of the number of samples
and one less than the number of samples.
Linear Prediction Models
Linear prediction models were setup for the fuel wood properties using regression models. These
models can be used to predict with a certain degree of accuracy fuel wood properties using other
properties that are highly correlated with it. These models were written with the aid of Python
and scikit-learn. The linear regression was setup using the ordinary least square method with
alternate improved techniques such as the Huber, Ridge and Lasso linear models..
The experimental results obtained were used as the dataset for this computation. The data set was
randomly split into training and test data in the ratio (2:1). This amounts to the training data
having about 4 samples and test data 2 samples. The training data was then fitted into the
specified model’s technique and the predicted y-values of the x-values of the test data obtained.
Results and Discussions
Table 3: Fuel wood Properties of the Selected Wood Trees
Sampl
e
Moisture
content
dry basis
(%)
Moisture
content
wet basis
(%)
Density
(g/cm3)
Volatile
content
(%)
Ash
content
(%)
Net
calorific
value
(KJ/g)
Fuel
value
index
Rank
A 202.7551 66.97 0.4108 67 4.5 4.4765 40.8622 5
B 226.4773 69.37 0.3263 65 4 3.9739 32.4123 6
C 73.0403 42.21 0.6491 69 7 9.6612 89.5914 3
D 69.4628 40.99 0.6813 52 10.5 9.9167 64.3456 4
E 57.7785 36.62 0.44 68 2.5 10.8318 190.6392 1
F 56.2988 36.02 0.6652 59 5.5 10.9574 132.5325 2
Note: A = Peltophorum pterocarpum, B= Terminalia catappa, C = Psidium guajava, D =
Azadirachta indica, E = Gmelina arborea, F = Mangifera indica
GSJ: VOLUME 6, ISSUE 7, July 2018 1025
GSJ© 2018
www.globalscientificjournal.com
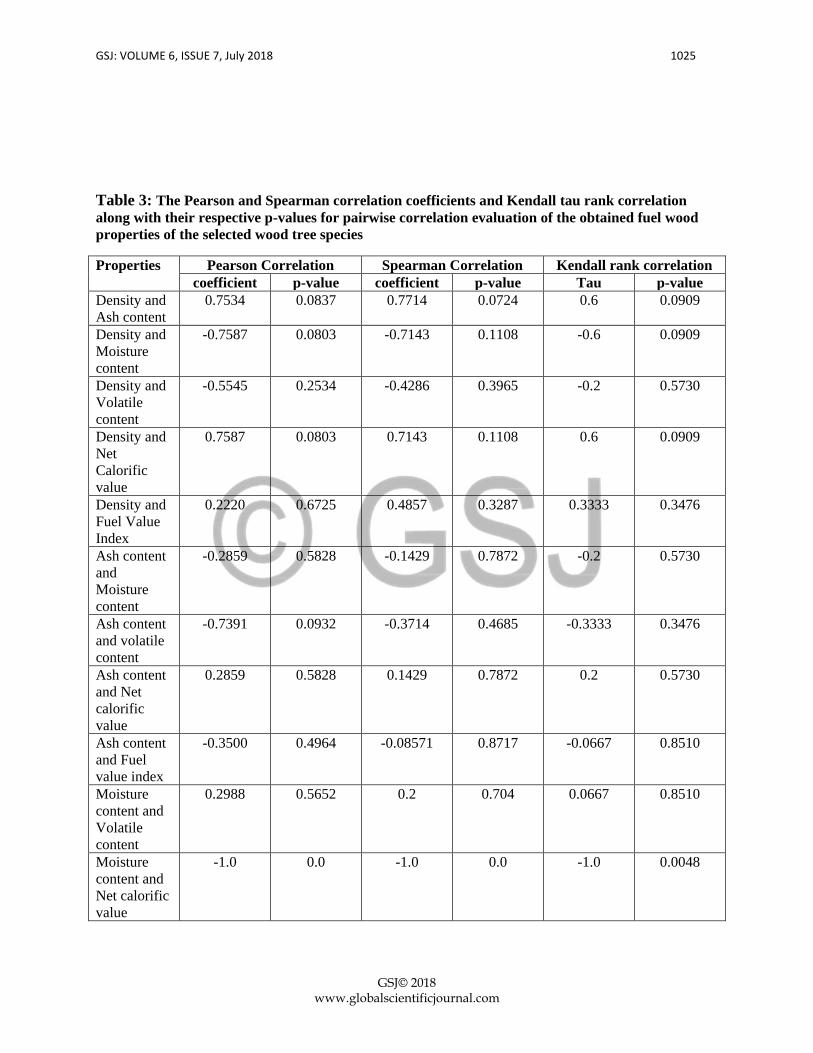
Table 3: The Pearson and Spearman correlation coefficients and Kendall tau rank correlation
along with their respective p-values for pairwise correlation evaluation of the obtained fuel wood
properties of the selected wood tree species
Properties Pearson Correlation Spearman Correlation Kendall rank correlation
coefficient p-value coefficient p-value Tau p-value
Density and
Ash content
0.7534 0.0837 0.7714 0.0724 0.6 0.0909
Density and
Moisture
content
-0.7587 0.0803 -0.7143 0.1108 -0.6 0.0909
Density and
Volatile
content
-0.5545 0.2534 -0.4286 0.3965 -0.2 0.5730
Density and
Net
Calorific
value
0.7587 0.0803 0.7143 0.1108 0.6 0.0909
Density and
Fuel Value
Index
0.2220
0.6725 0.4857 0.3287 0.3333 0.3476
Ash content
and
Moisture
content
-0.2859 0.5828 -0.1429 0.7872 -0.2 0.5730
Ash content
and volatile
content
-0.7391 0.0932 -0.3714 0.4685 -0.3333 0.3476
Ash content
and Net
calorific
value
0.2859 0.5828 0.1429 0.7872 0.2 0.5730
Ash content
and Fuel
value index
-0.3500 0.4964 -0.08571 0.8717 -0.0667 0.8510
Moisture
content and
Volatile
content
0.2988 0.5652 0.2 0.704 0.0667 0.8510
Moisture
content and
Net calorific
value
-1.0 0.0 -1.0 0.0 -1.0 0.0048

GSJ: VOLUME 6, ISSUE 7, July 2018 1026
GSJ© 2018
www.globalscientificjournal.com
Moisture
content and
Fuel value
index
-0.7873 0.06307 -0.8857 0.0188 -0.7333 0.0388
Volatile
content and
Net calorific
value
-0.2988 0.5652 -0.2 0.704 -0.0667 0.8510
Volatile
content and
Fuel value
index
0.1492 0.7779 0.2571 0.6228 0.2 0.5730
Net calorific
value and
Fuel value
index
0.7873 0.06307 0.8857 0.0188 0.7333 0.0388
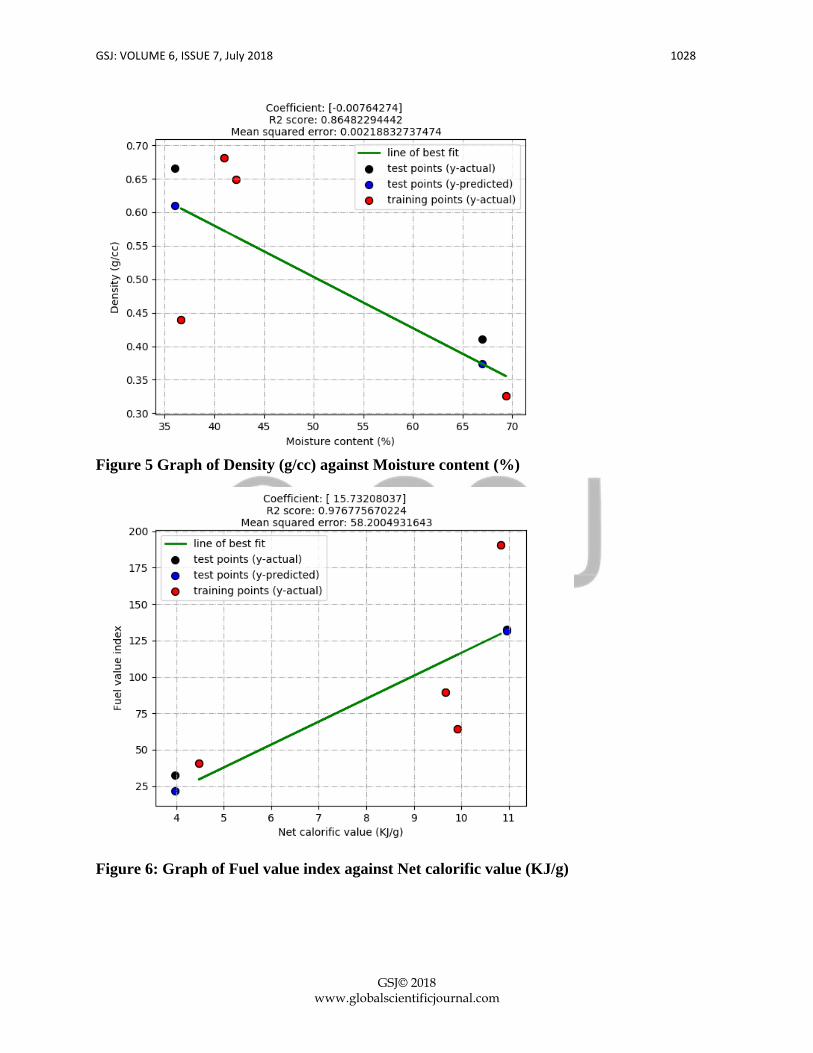
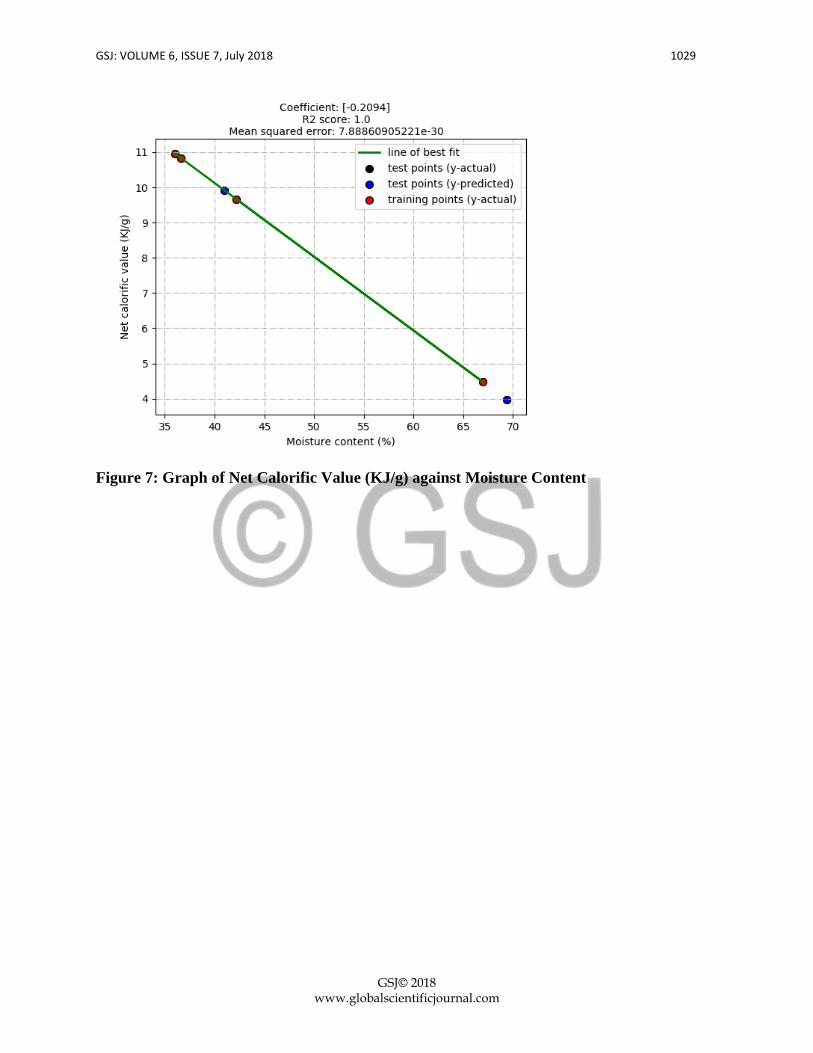
The moisture content, density, volatile content ash content, net calorific value and fuel value
index of the selected fuel wood properties are presented in table 1. The moisture content varies
from 36.62% (gamelina arborea) to 69.37% (terminalia catappa), density, 0.3263 g/cm3 (
terminalia catappa) to 0.6813g/cm3
( azadirachta indica), volatile content, 52% ( azadirachta
indica ) to 69% (psidium guajava), ash content, 2.50 % (gmelina arborea) to 10.5%
(azadirachta indica), net calorific value, 3.9739 KJ/g (terminalia catappa) to 10.9574KJ/g
(magifera indica) and fuel value index 32.4123 (terminalia catappa) to 190.6392(gamelina
arborea) .
Moisture content is the amount of water present in wood sample. All other wood properties are
greatly dependent on water content; hence water content affects the choice of wood fuels and
industrial applications of wood .The moisture content of freshly cut wood varies between species
and also between portions of the tree. Wood density is dependent on a multiple of growth and
physiological factors such as age, height and tree diameter. The density also plays an important
role in the determination of fuel properties. The results shows that terminalia catappa is
suspected to have higher energy per unit volume when compared to other species. A higher wood
density increases the calorific value and tends to slow the burning rate (Abbot and Hofi, 1997).
Volatile content is the amount of volatile matter produced upon carbonization. As carbonization
is prolonged, more volatile matter is produced. The high volatile content of a biomass material
indicates that during combustion, most of it will volatize and burn as gas in the cookstove
(Akowuah, et al, 2012). Ash content is the remaining inorganic part of wood fuels that cannot be
combusted. Wood fuels in with high ash content are less desirable as fuel because a considerable
amount of the wood matter cannot be converted to energy (Joseph and Shadrach, 1985). The
high ash content of (azadirachta indica ) indicates that the species has high mineral matter. The
value index fuel is a composite parameter that is based on certain properties of wood that helps
determine how much fuel value the wood has. The results from the six examined wood fuel
species shows that Gmelina arborea provided the best wood fuel value. Although it has a
relatively low density when compared with others, it compensates with low moisture content
and ash content.
GSJ: VOLUME 6, ISSUE 7, July 2018 1027
GSJ© 2018
www.globalscientificjournal.com
Net calorific value decreased linearly and significantly with increase in moisture content as
expected (Pearson r = -1.0, p = 0.0). A coefficient of -1.0 was expected as net calorific value was
calculated from a formula with moisture content being the singular variable involved. Density
showed strong negative correlation with moisture content (Pearson r = -0.7587, p= 0.0803) and
strong positive net calorific value (Pearson r = 0.7587, p = 0.0803). The p-values showed strong
significance just shy of less than 0.05. Density and Ash content showed a strongly positive
correlation (Pearson r = 0.7534) just like net calorific value and fuel value index which is
moderate (Pearson r =0.7873) with p-values relatively small. Volatile content showed little
correlation with fuel value index (Pearson r = 0.1492); though with a relatively high p- value
(0.7779). This shows the likelihood of a true null
Fuel value index has a strongly monotonic relationship with net calorific value and moisture
content (Spearman r = 0.8857 and r= -0.8557 respectively, p = 0.0188) irrespective of its weaker
linear relationship. Volatile content has a weak monotonic relationship with the rest of the other
properties (Spearman r ranging from -0.4286 to 0.2571)
Kendal tau test shows dissimilarity in rank between moisture content and net calorific value
(Kendall tau = -1.0, p-value = 0.0048) and also strong similarity in rank between the net calorific
value and the fuel value index (Kendall tau = 0.7333, p-value = 0.0388). Volatile content shows
an absence of association with moisture content and net calorific value (Kendall tau = 0.0667 and
-0.0667 respectively)
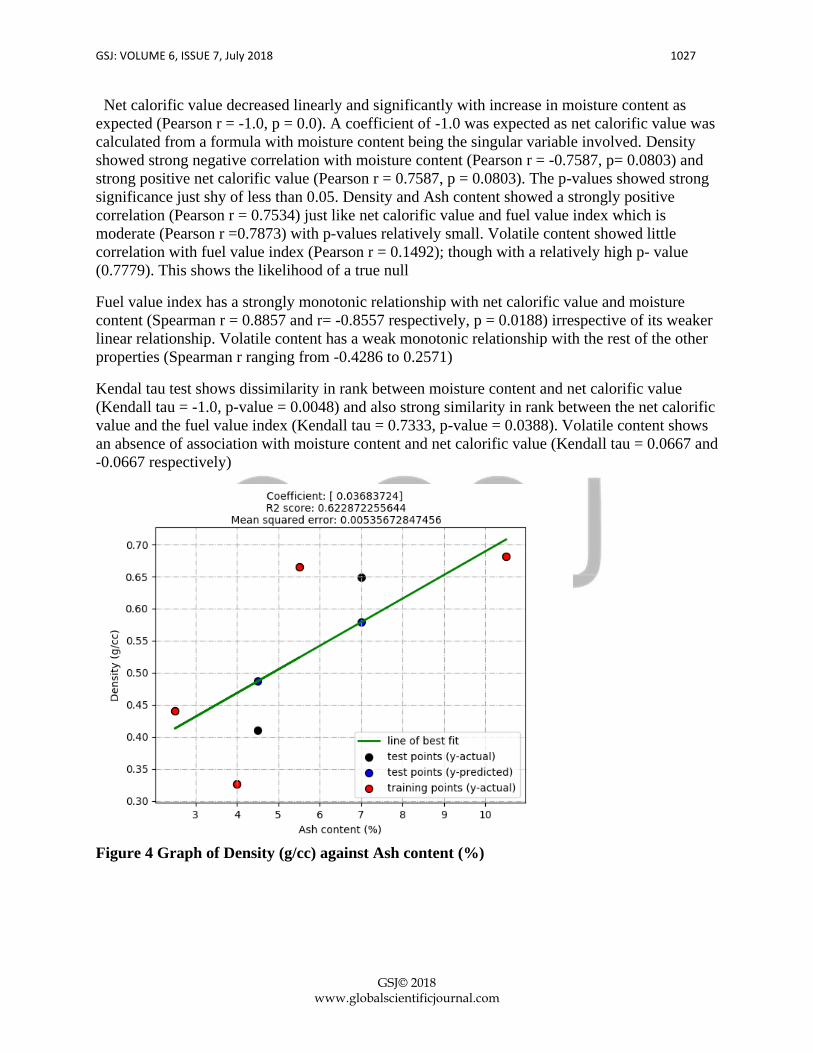
Figure 4 Graph of Density (g/cc) against Ash content (%)
GSJ: VOLUME 6, ISSUE 7, July 2018 1028
GSJ© 2018
www.globalscientificjournal.com
Figure 5 Graph of Density (g/cc) against Moisture content (%)
Figure 6: Graph of Fuel value index against Net calorific value (KJ/g)
GSJ: VOLUME 6, ISSUE 7, July 2018 1029
GSJ© 2018
www.globalscientificjournal.com
Figure 7: Graph of Net Calorific Value (KJ/g) against Moisture Content

GSJ: VOLUME 6, ISSUE 7, July 2018 1030
GSJ© 2018
www.globalscientificjournal.com
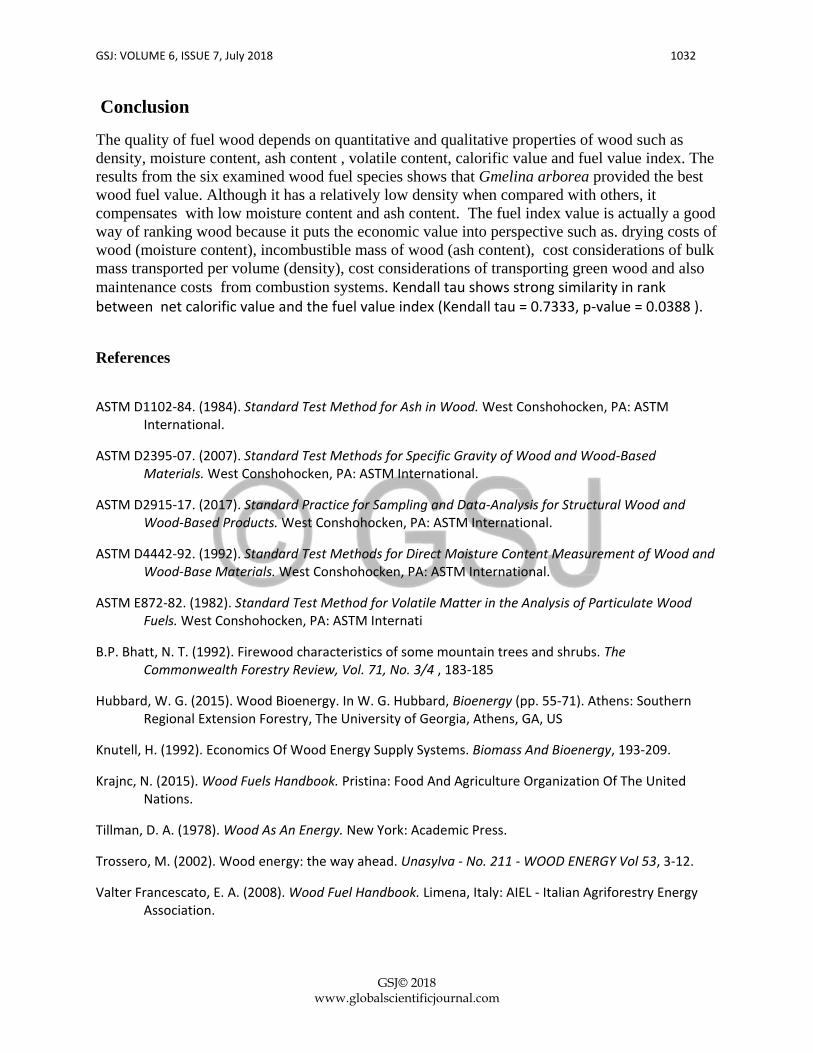
PYTHON IMPLEMENTATION FOR STATISTICAL ANALYSIS AND REGRESSION
GSJ: VOLUME 6, ISSUE 7, July 2018 1031
GSJ© 2018
www.globalscientificjournal.com
GSJ: VOLUME 6, ISSUE 7, July 2018 1032
GSJ© 2018
www.globalscientificjournal.com
Conclusion
The quality of fuel wood depends on quantitative and qualitative properties of wood such as
density, moisture content, ash content , volatile content, calorific value and fuel value index. The
results from the six examined wood fuel species shows that Gmelina arborea provided the best
wood fuel value. Although it has a relatively low density when compared with others, it
compensates with low moisture content and ash content. The fuel index value is actually a good
way of ranking wood because it puts the economic value into perspective such as. drying costs of
wood (moisture content), incombustible mass of wood (ash content), cost considerations of bulk
mass transported per volume (density), cost considerations of transporting green wood and also
maintenance costs from combustion systems. Kendall tau shows strong similarity in rank between net calorific value and the fuel value index (Kendall tau = 0.7333, p-value = 0.0388 ).
References
ASTM D1102-84. (1984). Standard Test Method for Ash in Wood. West Conshohocken, PA: ASTM International.
ASTM D2395-07. (2007). Standard Test Methods for Specific Gravity of Wood and Wood-Based Materials. West Conshohocken, PA: ASTM International.
ASTM D2915-17. (2017). Standard Practice for Sampling and Data-Analysis for Structural Wood and Wood-Based Products. West Conshohocken, PA: ASTM International.
ASTM D4442-92. (1992). Standard Test Methods for Direct Moisture Content Measurement of Wood and Wood-Base Materials. West Conshohocken, PA: ASTM International.
ASTM E872-82. (1982). Standard Test Method for Volatile Matter in the Analysis of Particulate Wood Fuels. West Conshohocken, PA: ASTM Internati
B.P. Bhatt, N. T. (1992). Firewood characteristics of some mountain trees and shrubs. The Commonwealth Forestry Review, Vol. 71, No. 3/4 , 183-185
Hubbard, W. G. (2015). Wood Bioenergy. In W. G. Hubbard, Bioenergy (pp. 55-71). Athens: Southern Regional Extension Forestry, The University of Georgia, Athens, GA, US
Knutell, H. (1992). Economics Of Wood Energy Supply Systems. Biomass And Bioenergy, 193-209.
Krajnc, N. (2015). Wood Fuels Handbook. Pristina: Food And Agriculture Organization Of The United Nations.
Tillman, D. A. (1978). Wood As An Energy. New York: Academic Press.
Trossero, M. (2002). Wood energy: the way ahead. Unasylva - No. 211 - WOOD ENERGY Vol 53, 3-12.
Valter Francescato, E. A. (2008). Wood Fuel Handbook. Limena, Italy: AIEL - Italian Agriforestry Energy Association.

GSJ: VOLUME 6, ISSUE 7, July 2018 1033
GSJ© 2018
www.globalscientificjournal.com
.I. Nirmal Kumar, K. P. (2011). An evaluation of fuelwood properties of some Aravally mountain tree and
shrub species of Western India. Biomass & Bioenergy, 411-414.
Samuel Ojelel, T. O. (2015). Fuel value indices of selected woodfuel species used in Masindi and Nebbi
districts of Uganda. Energy, Sustainability and Society, 5:14.
Abbort P, Lowore J, Hofi C, Warren M (1997): Defining firewood quality, comparism of quantitative and
rapid appraisal techniques to evaluate firewood species from a Southern African savannah, Biomas and
Bioenergy; 12(6): 37-429
Joseph AF, Shaddrach OA(1985): Biomass yield and energy value of some fast growing multipurpose
trees1in Nigeria. Biomas and Bioenergy: 12:6-101
Akowuah, J.O, kemausuor, F, and Mitchual,S.J (2012): Physico-chemical characteristics and Market
potential of sawdust charcoal briquettes. International journal of Energy and Environmental
Engineering, 3, 6p
1