determination of the effective point of measurement for
TRANSCRIPT

Master Thesis
zur Erlangung des akademischen Grades Master of Science
Determination of the e�ective point of measurement
for parallel plate and cylindrical ionization chambers
in clinical electron beams using Monte Carlo
simulations
vorgelegt von
Philip von Voigts-Rhetz
aus Starnberg
eingereicht an derTechnischen Hochschule Mittelhessen - University of Applied Sciences
im Fachbereich Krankenhaus- und Medizintechnik, Umwelt- und Biotechnologieam Insitut für Medizinische Physik und Strahlenschutz
1. August 2013
Referent: Prof. Dr. rer. nat. K. ZinkKorreferent: D. Czarnecki M. Sc.

�Das, wobei unsere Berechnungen versagen, nen-nen wir Zufall.�Albert Einstein (1879-1955)
II

Danksagung
Mein erster Dank gilt Herrn Prof. Dr. Klemens Zink für das Thema dieser Master-Thesis,
für seine Geduld und Ermutigung mit Rat und Tat.
Des Weiteren geht ein Dank an Herrn Dr. Mathias Anton für die besonders gute Zusam-
menarbeit mit der Physikalisch-Technischen Bundesanstalt und die daraus entstandenen
Ergebnisse.
Anschlieÿend möchte ich Petar Penechv, Damian Czarnecki und allen Angehörigen des
Instituts für Medizinische Physik und Strahlenschutz für ihre Unterstützung danken.
Weiterhin bedanke ich mich bei allen Personen, die mir durch ihre Beteiligung geholfen
haben, diese Arbeit zu erstellen.
III

Inhaltsverzeichnis
1 Einleitung . . . . . . . . . . . . . . . . . . . . . . . . . . . . . . . . . . 1
2 Physikalische Grundlagen . . . . . . . . . . . . . . . . . . . . . . . . . 5
2.1 Hohlraumtheorie in hochenergetischen Photonen- oder Elektronenstrahlung 5
2.2 Störfaktoren . . . . . . . . . . . . . . . . . . . . . . . . . . . . . . . . . . 8
2.3 Dosiemetrie unter Referenzbedingungen . . . . . . . . . . . . . . . . . . . 8
2.4 Der e�ektive Messort . . . . . . . . . . . . . . . . . . . . . . . . . . . . . 10
2.5 Monte-Carlo-Verfahren . . . . . . . . . . . . . . . . . . . . . . . . . . . . 11
3 Material und Methoden . . . . . . . . . . . . . . . . . . . . . . . . . . 12
3.1 Der e�ektive Messort . . . . . . . . . . . . . . . . . . . . . . . . . . . . . 12
3.2 Monte-Carlo-Verfahren . . . . . . . . . . . . . . . . . . . . . . . . . . . . 14
4 Manuskript . . . . . . . . . . . . . . . . . . . . . . . . . . . . . . . . . . 17
5 Di�erence in the relative response of the alanine dosimeter to mega-
voltage x-ray and electron beams . . . . . . . . . . . . . . . . . . . . . 43
Literaturverzeichnis . . . . . . . . . . . . . . . . . . . . . . . . . . . . . . 68
Einverständniserklärung . . . . . . . . . . . . . . . . . . . . . . . . . . . . 76
IV
Abbildungsverzeichnis
1 Beschränkte Massen-Stoÿbremsvermögen . . . . . . . . . . . . . . . . . . 7
2 Verschiebung in den e�ektiven Messort . . . . . . . . . . . . . . . . . . . 10
3 Quadratische Minimierung . . . . . . . . . . . . . . . . . . . . . . . . . . 13
4 Varianzreduktionsverfahren . . . . . . . . . . . . . . . . . . . . . . . . . 15
V

Tabellenverzeichnis
1 Bezugsbedingungen . . . . . . . . . . . . . . . . . . . . . . . . . . . . . . 9
2 Referenzbedingungen . . . . . . . . . . . . . . . . . . . . . . . . . . . . . 9
VI

Determination of the e�ective point of measurement for parallel
plate and cylindrical ionization chambers in clinical electron
beams using Monte Carlo simulations
Philip von Voigts-Rhetz
Technische Hochschule MittelhessenInsitut für Medizinische Physik und Strahlenschutz
Gieÿen, Deutschland2013
ABSTRACT
I. I.
Introduction Einführung
The presence of an air �lled ionization Das Vorhandensein einer Luft gefüllten
chamber in a surrounding medium in- Ionisationskammer in einem Umgebungs-
troduces several �uence perturbations in material führt zu verschieden Fluenzstö-
high energy photon and electron beams rungen der hochenergetischen Photonen
which have to be accounted for. One of und Elektronenstrahlung. Eine dieser Stö-
these perturbations, the displacement ef- rungen, der Verdrängungse�ekt, kann auf
fect, may be corrected in two di�erent zwei Arten korrigiert werden: mit einem
ways: by a correction factor pdis or by the Korrekturfaktor pdis oder eine Verschie-
application of the concept of the e�ecti- bung in den e�ektiven Messort (EPOM).
ve point of measurement (EPOM). The Dies bedeutet dass die über das sensitive
latter means, that the volume averaged Volumen der Kammer gemittelten Ionisa-
ionization within the chamber is not re- tionen nicht dem Referenzpunkt sondern
ported to the chambers reference point dem sogenannten e�ektiven Messort zu-
but to a di�erent point, the so called ef- geordnet werden.
VII

fective point of measurement.
Method Methoden
Within this study the EPOM was deter- Im Rahmen dieser Studie wurde der
mined for four di�erent parallel plates EPOM für vier verschiedene Flachkam-
and two cylindrical chambers in megavol- mern und zwei zylindrische Ionisations-
tage electron beams using Monte Carlo kammern in hochenergetischer Elektro-
simulations. nenstrahlung mittels Monte-Carlo Simu-
lationen bestimmt.
Results Ergebnisse
The positioning of the chambers with Die Positionierung der Kammern mit dem
this EPOM at the depth of measurement EPOM in der Messtiefe einen verbleiben-
results in a largely depth independent den Korrektionsfaktor, der weitgehend
residual perturbation correction. For all tiefenunabhängig ist. Für alle Flachkam-
parallel plate chambers the EPOM is al- mern wurde der EPOM für den gesam-
most independent on the energy of the ten Bereich klinischer Elektronenenergi-
primary electrons. Whereas for the Ad- en bestimmt. Während für die Advan-
vanced Markus chamber the position of ced Markus Kammer die Position des
the EPOM coincides with the chambers EPOM mit dem Referenzpunkt der Kam-
reference point, it is shifted for the other mern übereinstimmt, müssen die anderen
parallel plate chambers several tenths of Flachkammern mehrere Zehntel Millime-
millimeters downstream the beam direc- ter in Strahlrichtung verschoben werden.
tion into the air �lled cavity. For the Für die zylindrischen Kammern ist ei-
cylindrical chambers there is an increa- ne zunehmende Verschiebung des EPOM
sing shift of the EPOM with increasing mit ansteigender Elektronenenergie anzu-
VIII

electron energy. This shift is in upstream wenden. Diese Verschiebung ist entgegen
direction, i.e. away from the chambers der Strahlenrichtung, d.h. von dem Be-
reference point toward the focus. For the zugspunkt der Kammern in Richtung des
highest electron energy the position of Fokus. Für die höchste Elektronenener-
the calculated EPOM is in fairly good gie im Rahmen der Untersuchung ist die
agreement with the recommendation gi- ermittelte Verschiebung des EPOM in
ven in common dosimetry protocols, for guter Übereinstimmung mit der Empfeh-
the smallest energy the calculated EPOM lung gültiger Dosimetrieprotokolle. Für
positions deviates about 30% from this re- die kleinste Energie zeigt sich eine Ab-
commendation. weichung von etwa 30% zu diesen Emp-
fehlungen.
Conclusions Diskussion
Besides the determination of the EPOM, Neben der Bestimmung des EPOM wur-
the residual perturbation correction for de der verbleibende Korrektionsfaktor zur
all investigated chambers for the entire Berechnung der Wasserenergiedosis Dw
range of clinical used electron energies für alle untersuchten Kammern über den
was calculated. The application of the gesamten Bereich der klinischen verwen-
proposed e�ective point of measurement deten Elektronenenergien berechnet. Die
will increase the accuracy of calculating Anwendung der vorgeschlagenen e�ekti-
depth dose data from measured depth ven Messorte führt zu einer Erhöhung der
ionization curves, especially for depth Genauigkeit bei der Messung von Tiefen-
beyond the reference depth. dosiskurven mittels Ionisationskammern.
II. II.
In addition, the response of alanine do- Darüber hinaus wurde das Ansprechver-
IX

simeter were determined. Measurements mögen für Alanindosimeter bestimmt.
and simulations were performed for the Messungen und Simulationen wurden für
radiation qualities Q of 4, 6, 8, 10, 15 and die Strahlenqualitäten Q von 4, 6, 8, 10,
25 MV. It has shown that with increasing 15 und 25 MV durchgeführt. Es wird ge-
radiation quality a decreases the realti- zeigt das mit zunehmender Strahlenqua-
ve response 0.996 (4-6 MV) to 0.989 (at lität das Ansprechvermögen von 0.996
25 MV) appears. (4-6 MV) zu 0.989 (bei 25 MV) abnimmt.
X

Kapitel 1
Einleitung
Eine erfolgreiche Strahlentherapie impliziert eine möglichst genaue Bestimmung der Pa-
tientendosis. Ein wesentlicher Punkt dabei ist die Kalibrierung und Veri�kation des Li-
nearbeschleunigers unter de�nierten Bedingungen. In der perkutanen Strahlentherapie
wird dies durch Dosimetrie mittels Ionisationskammerdosimetrie realisiert. Verschiede-
nen nationalen (DIN 6800-2 [1], The American Association of Physicists in Medicine
- Task Group (AAPM TG) 51 [2]) und internationalen Dosiemetrieprotokollen (In-
ternational Atomic Energy Agency - Technical Reports Series (IAEA TRS) 398 [3])
beschrieben die Grundlagen dazu. Die im AAPM Report Nr. 85 geforderte Erhöhung
der Genauigkeit der applizierten Dosis in der Strahlentherapie lässt unter anderem die
Forderung nach neuen und überarbeiteten Messmethoden aufkommen [4].
Der Dosimetrie mit luftgefüllten Ionisationskammern liegt die Hohlraumtheorie nach
Spencer und Attix [5, 6] zugrunde. Danach müssen verschiedene von der Bauart abhän-
gige Korrektionsfaktoren berücksichtigt werden. Der Ein�uss der Kammerwand pwall,
der Mittelelektrode pstem, der Fluenzstörung pcav (pfl nach AAPM TG -51 [2]) und eine
Korrektur durch das Einbringen der luftgefüllten Kavität pdis (pgr nach AAPM TG -51
[2]) selbst müssen für den endlichen nicht wasseräquivalenten Detektor berücksichtigt
werden. Der Ein�uss durch das Einbringen eines nicht dichteäquivalenten Detektors (pdis
pgr), kann über zwei unterschiedliche Ansätze gelöst werden. Die Verwendungen eines
Korrektionsfaktors oder die Verschiebung der Ionisationskammer vom Referenzpunkt in
den sogenannten e�ektiven Messort (e�ective point of measurement, EPOM).
1

Erstmals wurde das Konzept des e�ektiven Messorts 1949 von L. S. Skaggs bei der
Untersuchung von Elektronenstrahlung beschrieben [7]. Das vorgestellte Verfahren ver-
wendeten die Brüder Dutreix [8] im Jahre 1966, als Sie verschiedene Ionisationskammern
bei 10 und 20 MeV Photonenstrahlung studierten. Tiefergehende Untersuchungen wur-
den von Hettinger et al. [9] 1967 und Johansson et al. [10] 1978 durchgeführt. Dieser
Ansatz wurde in das internationale Dosimetrieprotokoll TRS 277 [11] aufgenommen und
�ndet heutzutage Anwendung in der Realtivdosimetrie (AAMP TG-51 [2]), bei Elektro-
nendosimetrie (IAEA TRS 398 [3, 12]) und dient als Ersatzkonzept für den Störfaktor
pdis in der DIN 6800-2 [1].
Neuere Publikationen diskutieren die Genauigkeit der Positionierung des EPOM für
Photonen und Elektronenstrahlung. Kawrakow legte die Grundlagen für die Bestim-
mung des EPOM mittels Monte-Carlo Simulation [13]. Weitere Untersuchungen ver-
schiedener Arbeitsgruppen für zylindrische (M. McEwen, L. L. W. Wang, P. Andreo, Y.
Huang, F. Tessier und C. Legrand [14, 15, 16, 17, 18, 19, 20]) und Flachkammern (M.
Roos, L. L. W. Wang, K. Zink und F. Lacroix [21, 22, 23, 24]) folgten. Kürzlich verö�ent-
lichte Experimente von H. K. Looe et al. [25] bestätigten die zuvor durch Simulationen
erhaltenen Ergebnisse für die Positionierung unterschiedlicher Ionisationskammern.
DIN 6800-2 gibt für zylindrische Ionisationskammern eine Verschiebung vom Referenz-
punkt in den e�ektiven Messort um den halben Radius der Kavität an. Die Ergebnisse
verschiedener Untersuchungen von zylindrischen Ionisationskammern weichen von dieser
Empfehlung ab [13, 18, 19, 20]. Für Flachkammern soll nach DIN keine Verschiebung
vorgenommen werden. Untersuchungen der Roos und der Markus Kammer empfehlen
jedoch eine Verschiebung [22, 23, 24].
2

In der vorliegenden Arbeit wird die EPOM-Verschiebung für alle gängigen Flachkam-
mern in Elektronenstrahlung untersucht. Das Ziel ist eine Übersicht mit Abweichungen
für die verschiedenen Kammern zur DIN zu erhalten. Daraus könnte für zukünftig neue
Empfehlungen eine individuelle Verschiebung ausgesprochen werden.
Im Kapitel 4 wird das Manuskript der Verö�entlichung �Determination of the e�ective
point of measurement for parallel plate and cylindrical ionization chambers in clinical
electron beams using Monte Carlo simulations� vorgestellt, das bei der Zeitschrift für
Medizinische Physik (ZMP) am 30. Juli 2013 eingereicht wurde.
Im zweiten Teil der Arbeit wird das relative Ansprechvermögen von Alanin als Fest-
körperdosimeter bestimmt (ab 5). Alanin ist eine nicht toxische Aminosäure welche
für Festkörperdetektoren zu einem Alanin-Para�n-Gemisch verbunden wird. Der klei-
ne Festkörperdetektor kann an beliebiger Stelle für die dosimetrische Überwachungen
angebracht werden. International werden Alanindosimeter bereits als Referenz in der
Strahlentherapie eingesetzt (National Physical Laboratory, UK und Danmarks nationa-
le måletekniske institut, DK). Verschiedene Untersuchung des relativen Ansprechvermö-
gens wurden von Sharpe, Bergstrand et al., Zeng et al. und Anton et al. [26, 27, 28, 29]
durchgeführt. Sie berichten von einer Energieabhängigkeit von weniger als 1 %. Ziel
dieser Arbeit war eine genauere Untersuchen des relativen Ansprechvermögens mittels
Messungen und Monte-Carlo Simulationen.
Die daraus resultierende Verö�entlichung wurde in Kooperation mit der Physikalisch-
Technischen Bundesanstalt (PTW) angefertigt. Die Arbeit wurde am 24. Oktober 2012
bei der Fachzeitschrift Physics in Medicine and Biology (PMB) eingereicht und am 24.
April 2013 verö�entlicht. Die PTW übernahm die messtechnische und statistische Aus-
wertung der Daten. Die Simulationen wurden von dem Autor durchgeführt und sind
3

Bestandteil dieser Arbeit. Zielsetzung dieser Studie ist die Überprüfung des Ansprech-
vermögens von Alanindetektoren in hochenergetischer Photonenstrahlung.
Das Manuskript und die Verö�entlichung sind in englischer Sprache verfasst. Beide Aus-
führungen haben eine separate Seitennummerierung, Literaturliste sowie eigenständige
Unterteilung in Einleitung, Methoden, Ergebnisse und Diskussion.
4

Kapitel 2
Physikalische Grundlagen
2.1 Hohlraumtheorie in hochenergetischen Photonen-
oder Elektronenstrahlung
Der für die Bestimmung der Energiedosis eingebrachte Detektor unterscheidet sich meist
von dem Umgebungsmaterial. Die daraus entstehende Störung des Strahlenfeldes stellt
ein Problem da. Die Folgen wurden theoretisch (Bragg 1912 [30]) und empirisch (Fricke
et al. 1925 [31]) untersucht. Das Konzept für die Energiedeposition geladener Teilchen,
die sogenannte Hohlraumtheorie, stammt von Bragg and Gray [32, 33] (vgl. Reich [34]).
Bragg-Gray-Theorie
Attix [35] beschreibt das Stoÿbremsvermögen nach der Bragg-Gray Hohlraumtheorie
(BG) sBGm,a als das Verhältnis der deponierten Energiedosis im Material Dm zur Energie-
dosis im Hohlraum Da.
sBGm,a =Dm
Da
(1)
Für die BG-Theorie wird vorausgesetzt, dass der eingebrachte Hohlraum so klein ist,
das die Energie�uenz der geladenen Teilchen nicht beein�usst wird. Daraus folgt das
Photonen und Neutronen im Hohlraum keine Wechselwirkungen zufolge haben. Dies ist
ab einer Energie von etwa 0.6 MeV Photonenstrahlung realisierbar.
Aus den Forderungen der BG-Theorie und nach Gleichung 1 lässt sich das Bremsver-
5

mögensverhältnis sBGm,a wie folgt bestimmen.
sBGm,a =Dm
Da
=
∫ Emax
0φ1.E,m(scol/ρ)m dE
∫ Emax
0φ1.E,m(scol/ρ)a dE
(2)
Im ICRU Report 35 [36] wird dies als Bragg-Gray-Näherung betitelt. Die spektrale
Fluenz der Elektronen der ersten Genration φ1.E,m gemittelt am Messort im Medium m
besteht im Umgebungsmedium sowie im Hohlraum und erscheint deshalb in beiden Inte-
gralen [37]. Emax ist die maximale Elektronenenergie. Das Massen-Stoÿbremsvermögen
im Medium m und Luft a wird mit scol/ρ beschrieben (vgl. Reich[34]).
Hohlraumtheorie nach Spencer und Attix
EineWeiterentwicklung der Bragg-Gray-Theorie, unter Berücksichtigung der δ-Elektronen
(siehe Abbildung 1), wurde von Spencer und Attix (SA) 1955 [6] vorgeschlagen und von
Bielajew 1986 [36, 38] realisiert. Sie unterteilt die geladenen Teilchen aller Generationen
aus dem Energiespektrum φE,m in E < ∆ oder E ≥ ∆. Die Energiegrenze wird als
∆ beschrieben. Geladene Teilchen mit der Energie unterhalb ∆ sind nicht mehr Be-
standteil des Spektrums und werden als lokal deponiert angesehen. Für Teilchen der
Energien gröÿer als ∆ wird das Massen-Bremsvermögen durch das beschränkte Massen-
Stoÿbremsvermögen (Lρ)∆ ersetzt und angenommen das die Teilchen den Hohlraum wei-
ter durchqueren. Das Bremsvermögensverhältnis in Spencer-Attix-Näherung wird als
sSAm,a dargestellt.
sSAm,a =Dm
Da
=
∫ Emax
∆φE,m(L
ρ)∆,m dE
∫ Emax
∆φE,m(L
ρ)∆,a dE
(3)
Nahum überarbeitet die Hohlraumtheorie von Spencer und Attix 1978 [39]. Er fügte dem
SA-Stoÿbremsvermögen sSAm,a die zuvor nicht berücksichtigten Energiebeiträge geladener
Teilchen mit einer Energie unterhalb von ∆ hinzu. Die sogenannten track ends sind de-
6

ponierten Energiebeiträge der δ-Elektronen im Hohlraum unterhalb der Energieschwelle.
s∆w,a ist das Stoÿbremsvermögen von Wasser w zu Luft a einer Ionisationskammer. Die
Abbildung 1: Bahnspur eines geladenen Teilchens (gestrichelte Linie) die Materie undeinen Hohlraum (gestrichelter Keis) durchläuft. Die auf seinem Weg entstandenenδ-Elektronen werden rot dargestellt. Die nach Nahum [39] einstanden δ-Elektronenwelche auÿerhalb des Hohlraumes entstehen und innerhalb enden sind als �trackend� grün dargestellt. Die Breite der Bahnspur entspricht dem beschränkte Massen-Stoÿbremsvermögen (L
ρ)∆.
in den nationalen und internationalen Dosimetrieprotokollen gewählte Energiegrenze ∆
beträgt 10 keV. Das entspricht der Reichweite eines Elektrons in Luft von etwas 2 mm,
was der Gröÿenordnung der luftgefüllten Kavität von typischen Ionisationskammern
entspricht [40].
s∆w,a =
Dw
Da
=
∫ Emax
∆φE,w(L
ρ)∆,w dE + (trackend)w
∫ Emax
∆φE,w(L
ρ)∆,a dE + (trackend)a
(4)
7

2.2 Störfaktoren
Der Hohlraumtheorie liegt ein idealer Detektor zugrunde, welche nur aus dem sensitiven
gasgefüllten Volumen und einem Umgebungsmaterial besteht. Da eine reale Ionisations-
kammer Ddet durch ihre Bauteile (Kammerwand, Elektroden, ...) im Vergleich zu einem
idealen Bragg-Gray-Kavität Da Fluenzstörungen hervorruft, ist der kammerabhängige
Gesamtstörfaktor p nach Gleichung 5 und 6 zu berücksichtigen.
Dw
Ddet
= s∆w,a · p (5)
Der Gesamtstörfaktor p ergibt sich aus dem Produkt der verschieden Einzelstörfaktoren:
p = pwall · pcell · pstem · pcav · pdis (6)
� Veränderung der Fluenz durch die Kammerwand pwall
� Veränderung der Fluenz durch die Mittelelektrode pcell
� Veränderung der Fluenz durch den Kammerstiel pstem
� Störung der Fluenz durch das unterschiedliche Streuverhalten von Wasser und
Luft pcav
� Verminderung der Wechselwirkungen in der Luft gefüllten Kavität pdis
2.3 Dosiemetrie unter Referenzbedingungen
Für die Anwendung der Dosimetrie in der klinischen Routine wurden nationale [1, 2]
und internationalisierte [3] Protokolle erstellt. Nach DIN 6800-2 [1] werden Ionisations-
kammern für die Bestimmung der Wasser-Energiedosis DW unter Referenzbedingungen
8

nach Gleichung 7 eingesetzt. Vor dem Einsatz wird jede Kammer unter den Bezugsbe-
dingungen (siehe Tabelle 1) kalibriert.
Tabelle 1: Bezugsbedingungen der Kalibrierung von Ionisationskammern nach DIN 6800-2 [1].
Ein�ussgröÿe Bezugsbedingung
Strahlungsqualität 60Co-Gammastrahlung
Phantommaterial Wasser
Messtiefe 5 cm
Temperatur 293.5 K
Druck 101.325 kPa
Positionierung der Ionisationskammer Bezugspunkt in 5 cm Tiefe
Abstand Quelle - Messort 100 cm
Feldgröÿe in 5 cm Tiefe 10x 10 cm
Der so erhaltene kammerabhängige Kalibrierfaktor N eliminiert unter anderem die Un-
genauigkeit des sensitiven Volumens und stellt eine Abhängigkeit zwischen dem ange-
zeigten Messsignal M und der dazugehörigen Wasser-Energiedosis DW da.
DW = (M −M0) ·N ·n∏
i=1
ki (7)
Das UntergrundsignalM0 wird von dem MesswertM der Ionisationskammer abgezogen.
Für die Bestimmung der Wasser-Energiedosis unter Referenzbedingungen (nach Tabelle
2) ist das Produkt der Korrektionsfaktoren in Gleichung 7, als∏n
i=1 ki dargestellt, zu
berücksichtigen. Die Korrektion beinhaltet die Veränderungen der Luftdichte kρ, der
Tabelle 2: Referenzbedingungen für Ionisationskammern nach DIN 6800-2 [1].
Strahlungsart Messtiefe Feldgröÿe an der Ober�äche Fokus-Ober�ächen-Abstand
Photonenstrahlung 10 cm 10 x 10 cm2 100 cm
Elektronenstrahlung zref 20 x 20 cm2 100 cm
Luftfeuchte kh, der Strahlenqualität kQ (für Elektronen kE) und weitere Ein�üsse zu
den Bezugsbedingungen der Ionisationskammer in 60Co Gammastrahlung (Q0).
9

2.4 Der e�ektive Messort
Der Abstand vom Bezugspunkt zum e�ektiven Messort wird mit ∆z beschrieben. Für zy-
lindrische Ionisationskammern be�ndet sich der Bezugspunkt P auf der Symmetrieachse
der Ionisationskammer. Bei der Messung wird der e�ektive Messort durch Verschieben
der Kammer um den Wert −∆z in die Messtiefe z gebracht (siehe Abbildung 2 links).
Die Verschiebung wird in DIN 6800-2 mit −∆z/r als Vielfaches des Radius, der luftge-
füllten Kavität r angegeben. Für Flachkammern liegt der Bezugspunkt an der Oberseite
der Kavität. Nach den Ergebnissen dieser Arbeit ist die Kammer um den Betrag ∆z
in Strahlenrichtung zu verschieben, d.h. der e�ektive Messort liegt in der luftgefüllten
Kavität (siehe in Abbildung 2 rechts).
Abbildung 2: Verschiebung des Bezugspunktes P in den e�ektiven Messort Peff um denWert ∆z in Richtung des Fokus der Strahlenquelle. Links sind zylindrische und rechtsFlachkammern abgebildet.
10

2.5 Monte-Carlo-Verfahren
Die Monte-Carlo-Simulation ist heutzutage in der Medizinischen Physik ein unverzicht-
bares Hilfsmittel für Dosisberechnungen. Die ersten Untersuchungen wurden 1777 von
Georges-Louis Leclerc de Bu�on als mathematisches Experiment durchgeführt. Die Wei-
terentenwicklung für heutige Anwendungen wurde federführend von den Physikern und
Mathematikern Enrico Fermi, Stan Ulam, John von Neumann, Nick Metropolis und
Edward Teller am Los Alamos National Laboratory vorangetrieben [41].
Durch die stetige Verbesserung der Computertechnologie und der daraus resultierenden
erhöhten Genauigkeit wurden Monte-Carlo Methoden in den täglichem Routinebetrieb
eingebunden. Über Zufallsereignisse kann mit Hilfe des Gesetzes der groÿen Zahlen für
bekannten Modelle beliebig genaue Ereignisse �erwürfelt� werden [42]. Die Varianz σ der
berechneten Dosisgröÿe ist dabei indirekt proportional zu Wurzel der Stichprobenanzahl
N .
σ ∝√
1
N(8)
11

Kapitel 3
Material und Methoden
3.1 Der e�ektive Messort
Der e�ektive Messort wurde in der vorliegenden Untersuchung mittels quadratischer
Minimierung nach der Methode von Wang und Rogers [22] mit Monte-Carlo-Simulation
in drei Schritten bestimmt:
� Berechnung der Wasser-Energiedosis DW (z) als Funktion der Tiefe z im Wasser-
phantom. Anschlieÿend erfolgt eine Interpolation durch eine Splinefunktion für
einen kontinuierlichen Verlauf der Tiefendosiskurve.
� Berechnung einer hochaufgelösten Tiefendosiskurve der über das Detektorvolumen
gemittelten Dosis Ddet(z) wird, wobei die Ionisationskammer mit ihrem Referenz-
punkt in der Tiefe z positioniert ist.
� Verschiebung der Tiefendosiskurve der Wasser-Energiedosis DW (z) auf die Tiefen-
dosiskurve der Ionisationskammer Ddet(z) nach Gleichung 9 [22]. Aus dem Mini-
mum der root mean square deviation (rms) ergibt sich die optimale Verschiebung
∆z.
rms2 =1
n·∑
i
(Diw(z + ∆z)− s∆
w,a(z) ·Di
det(z))2
(9)
12

Abbildung 3: Bestimmung des EPOM einer ROOS Kammer bei 6 MeV Elektronen-strahlung durch anwendung von Gleichung 9. Die optimale Verschiebung ∆z, ist dasMinimum der dargestellten Kurve. Die Unsicherheit der Stützstellen, werden aus denMaximalenfehlern der zugrunde liegenden Tiefendosiskurven bestimmt.
Das Minimum des resultierenden Polygons 2. Grades wird dem für diese Kammer idea-
len ∆z zugeordnet (vgl. Abbildung 3). Dieser Vorgang wird für jede Ionisationskammer
und den unterschiedlichen Energien wiederholt.
Unsicherheitsbestimmung
Für jede Stützstelle des ∆z Werts, bestimmt mit der mittleren quadratischen Abwei-
chung, lässt sich der jeweilige Fehler aus der Tiefendosiskurve der Wasser-Energiedosis
DW und der Dosis des Detektor Ddet berechnen. Aufgrund des Ein�usses der Tiefen-
dosiskurve bis zur praktischen Reichweite RP wird von jeder Kurve der Maximalfehler
verwendet (siehe Abbildung 3).
13

Nach Gleichung 10 werden die voneinander unabhängigen Ereignisse zu einem Gesam-
tunsicherheit u(rms(∆z)) zusammengefügt.
u(rms(∆z))2) =
√√√√ 1
n·
n∑
1
(u(Dw)2 + u(Ddet)2) (10)
3.2 Monte-Carlo-Verfahren
Das für diese Arbeit eingesetzte Programmpaket EGSnrc [43] besteht aus unterschiedli-
chen user codes. Für die Simulationen der Ionisationskammern wurde der egs_chamber
code [44] aufgrund seiner E�zienzsteigung bei der Simulation mit hochenergetischen
Energien eingesetzt. Das Stoÿbremsvermögen wurde mit dem code SPRRZnrc berech-
net [45]. EGSnrc wurde aufgrund seiner Einsatzmöglichkeit [46] und in der Literatur
beschriebenen hohen Genauigkeit gewählt [47, 48, 49, 50].
Varianzreduktion
Verschiedene varianzreduzierende Verfahren werden verwendet um die E�zienz der Si-
mulationen zu steigern. In dieser Arbeit wurden mehrere Verfahren kombiniert.
Das Intermediate Phase-Space Scoring (IPSS) [44] speichert simulierte Teilchen an einer
im Phantom de�nierten Geometrie (siehe Abbildung 4). Innerhalb dieses Bereiches kön-
nen voreinander unabhängige Simulationen mit den in der IPSS Geometrie gespeicherten
Teilchen als Strahlenquelle weiter gerechnet werden. Die Technik des russian roulette
[51] verwirft mit einer vorgegeben Wahrscheinlichkeit Elektronen, welche das de�nier-
te sensitive Volumen nicht mehr erreichen können, erhöht jedoch die Gewichtung der
überlebenden Elektronen um den gleichen Wert. Das Verfahren der condensed-history
[52, 53] fasst mehrere Streuereignisse und Energieänderungen von Elektronen zu einem
14

Abbildung 4: Links wird das IPSS Volumen (gestrichelte Linie) dargestellt. Alle Photo-nen (blaue Linien) und Elektronen (grüne Linien) die diese Geometrie erreichen werdengespeichert und anschlieÿend für unterschiedliche Simulationen, z.B. eine Ionisations-kammer in verschieden Tiefen, innerhalb des IPSS wieder verwendet. In der rechtenAbbildung wird um das sensitive Volumen eine russian roulette Geometrie (gepunkteteLinie) gelegt. Elektronen welche diese Geometrie nicht mehr erreichen (rot) werden miteiner de�nierten Wahrscheinlichkeit verworfen.
gemittelten zusammen.
Die für Photonen gängigen Varianzreduktionsverfahren des photon splitting [51] und
cross-section enhancement [44] wurden auf Grund der verwendeten Elektronenstrahlung
nicht angewandt.
Simulationsparameter
Für alle Simulationen wurde unabhängig von dem eingesetztem user code, egs_chamber
oder SPRRZnrc, die gleichen Transportparameter verwendet. Die untere Grenzener-
gie, ab welcher die deponierte Energie als lokal angesehen wird, wurde für Photonen
auf PCUT = 10keV und für Elektronen auf ECUT = 521keV festgelegt. Eigene
15

Untersuchungen für kleinere cut-o� Energien erbrachte keine Erhöhung der Simulati-
onsgenauigkeit. Für die Berechnung der einzelnen Elektronenwechselwirkungen wurde
der PRESTA-II Algorithmus eingesetzt [49, 50]. Für die Erzeugung von Bremsstrahlen
wurden die Wechselwirkungswahrscheinlichkeiten nach Bethe und Heitler angewendet
[54]. Für alle weiteren Einstellungen wurde der von EGSnrc vorgegebene Default-Wert
eingestellt.
Bei alle Simulationen wurden Spektren eines Varian Clinac 2100C Linearbeschleunigers
[55] mit der nominellen Energie von 6, 9, 12 und 18 MeV verwendet. Die Strahlen-
quelle wurde als Punktquelle de�niert und durch Kollimation auf eine Feldgröÿe von
10 x 10 cm2 an der Phantomober�äche angepasst. Die Abmessungen des Wasserphan-
toms betrugen 30 x 30 x 30 cm3 und der Fokus-Ober�ächenabstand lag bei 100 cm. Das
für die Bestimmung der Wasser-Energiedosis verwendete Voxel hatte einen Radius von
0.5 cm und eine Höhe von 0.02 cm.
16

Kapitel 4
Manuskript
Im folgenden Kapitel ist das Manuskript mit dem Titel �Determination of the e�ective
point of measurement for parallel plate and cylindrical ionization chambers in clinical
electron beams using Monte Carlo simulations� eingebunden. Das Manuskript wurde
bei der Zeitschrift für Medizinische Physik am 30.07.2013 eingereicht.
Dieser Beitrag wurde unter Mithilfe des Co-Autoren Prof. Dr. K. Zink erstellt. Das
Manuskript enthält umfangreiche Ergebnisse, welche teilweise auf der Tagung der Deut-
schen Gesellschaft für Medizinische Physik im September 2012 in Jena [56] präsentiert
wurden. Anschlieÿend wurden weitere Ergebnisse dieser Arbeit auf dem internationalen
Meeting der European Society for Therapeutic Radiology and Oncology im April 2013
in Genf [57] als Poster vorgestellt.
17
Effective point of measurement for parallel plate and1
cylindrical ion chambers in megavoltage electron beams2
P von Voigts-Rhetza, D Czarneckia, K Zinka,b3
aInstitut fur Medizinische Physik und Strahlenschutz – IMPS University of Applied4
Sciences, Giessen, Germany5
bUniversity hospital Marburg, Department of radiotherapy and radiation oncology,6
Philipps-University, Marburg, Germany7
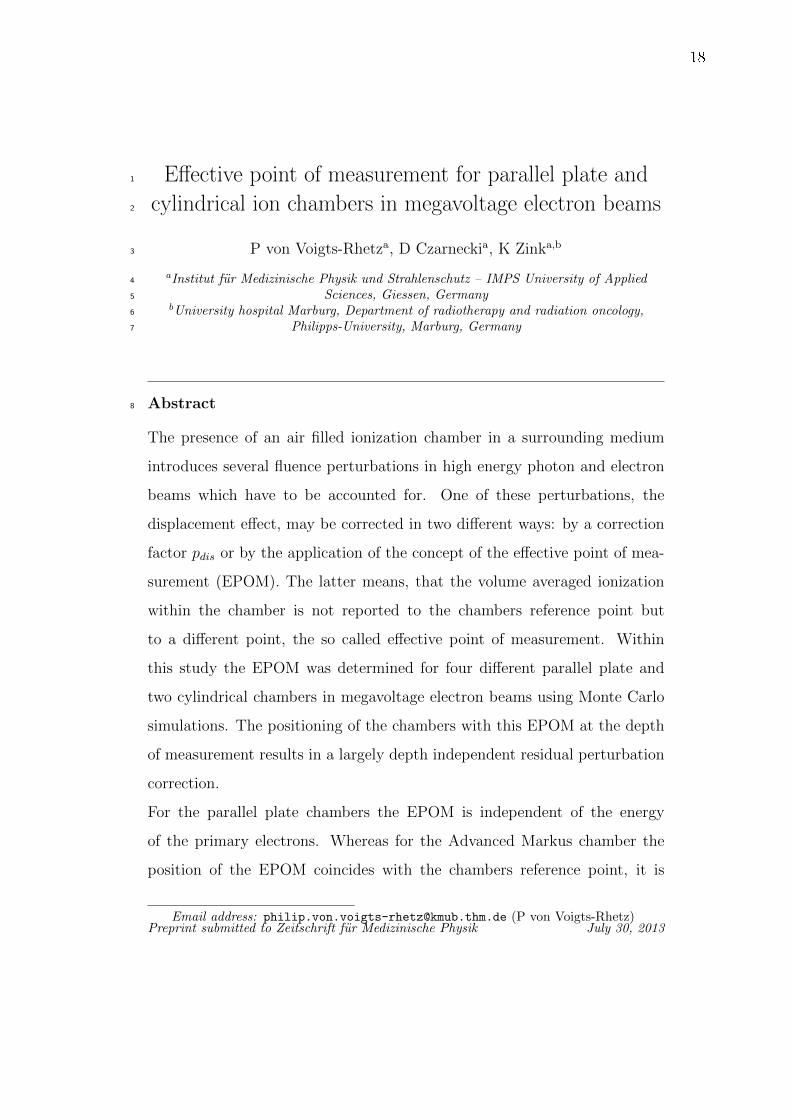
Abstract8
The presence of an air filled ionization chamber in a surrounding medium
introduces several fluence perturbations in high energy photon and electron
beams which have to be accounted for. One of these perturbations, the
displacement effect, may be corrected in two different ways: by a correction
factor pdis or by the application of the concept of the effective point of mea-
surement (EPOM). The latter means, that the volume averaged ionization
within the chamber is not reported to the chambers reference point but
to a different point, the so called effective point of measurement. Within
this study the EPOM was determined for four different parallel plate and
two cylindrical chambers in megavoltage electron beams using Monte Carlo
simulations. The positioning of the chambers with this EPOM at the depth
of measurement results in a largely depth independent residual perturbation
correction.
For the parallel plate chambers the EPOM is independent of the energy
of the primary electrons. Whereas for the Advanced Markus chamber the
position of the EPOM coincides with the chambers reference point, it is
Email address: [email protected] (P von Voigts-Rhetz)Preprint submitted to Zeitschrift fur Medizinische Physik July 30, 2013
18

shifted for the other parallel plate chambers several tenths of millimeters
downstream the beam direction into the air filled cavity. For the cylindrical
chambers there is an increasing shift of the EPOM with increasing electron
energy. This shift is in upstream direction, i.e. away from the chambers ref-
erence point toward the focus. For the highest electron energy the position of
the calculated EPOM is in fairly good agreement with the recommendation
given in common dosimetry protocols, for the smallest energy the calculated
EPOM positions deviates about 30% from this recommendation. Besides
the determination of the EPOM, the residual perturbation correction for
all investigated chambers for the whole range of clinical used electron en-
ergies was calculated. The application of the proposed effective point of
measurement will increase the accuracy of calculating depth dose data from
measured depth ionization curves, especially for depth beyond the reference
depth.
Das Vorhandensein einer Luft gefullten Ionisationskammer in einem Umge-
bungsmaterial fuhrt zu verschieden Fluenzstorungen der hochenergetis-
chen Photonen und Elektronenstrahlung. Eine dieser Storungen, der
Verdrangungseffekt, kann auf zwei Arten korrigiert werden: mit einem Kor-
rekturfaktor pdis oder eine Verschiebung in den effektiven Messort (EPOM).
Dies bedeutet dass die uber das sensitive Volumen der Kammer gemittelten
Ionisationen nicht dem Referenzpunkt sondern dem sogenannten effektiven
Messort zugeordnet werden. Im Rahmen dieser Studie wurde der EPOM fur
vier verschiedene Flachkammern und zwei zylindrische Ionisationskammern
2
19

in hochenergetischer Elektronenstrahlung mittels Monte-Carlo Simulationen
bestimmt. Die Positionierung der Kammern mit dem EPOM in der Messtiefe
einen verbleibenden Korrektionsfaktor, der weitgehend tiefenunabhangig ist.
Fur alle Flachkammern wurde der EPOM fur den gesamten Bereich klin-
ischer Elektronenenergien bestimmt. Wahrend fur die Advanced Markus
Kammer die Position des EPOM mit dem Referenzpunkt der Kammern
ubereinstimmt, mussen die anderen Flachkammern mehrere Zehntel Millime-
ter in Strahlrichtung verschoben werden. Fur die zylindrischen Kammern ist
eine zunehmende Verschiebung des EPOM mit ansteigender Elektronenen-
ergie anzuwenden. Diese Verschiebung ist entgegen der Strahlenrichtung,
d.h. von dem Bezugspunkt der Kammern in Richtung des Fokus. Fur die
hochste Elektronenenergie im Rahmen der Untersuchung ist die ermittelte
Verschiebung des EPOM in guter Ubereinstimmung mit der Empfehlung
gultiger Dosimetrieprotokolle. Fur die kleinste Energie zeigt sich eine Ab-
weichung von etwa 30% zu diesen Empfehlungen. Neben der Bestimmung
des EPOM wurde der verbleibende Korrektionsfaktor zur Berechnung der
Wasserenergiedosis Dw fur alle untersuchten Kammern uber den gesamten
Bereich der klinischen verwendeten Elektronenenergien berechnet. Die An-
wendung der vorgeschlagenen effektiven Messorte fuhrt zu einer Erhohung
der Genauigkeit bei der Messung von Tiefendosiskurven mittels Ionisation-
skammern.
Keywords:9
Monte Carlo simulations, electron dosimetry, effective point of10
measurement, ionization chambers11
3
20

1. INTRODUCTION12
Clinical dosimetry in megavoltage electron and photon beams requires the13
use of air filled ionization chambers. The determination of the quantity dose14
to water from the detector signal is based on cavity theory [1, 2], according15
to which several chamber and energy dependent perturbation corrections p16
are necessary to calculate the dose to water at a point ~r in the absence of the17
detector. The reason for these perturbation corrections are fluence perturba-18
tions induced by the finite volume of the detector, the non-water equivalent19
materials of the chamber etc., resulting in deviations of the detector signal20
in comparison to an ideal Bragg-Gray detector. One of these perturbations,21
the so called displacement correction, which comes from the displacement of22
the surrounding material water by the detector, may be accounted for in two23
different ways: by a factor commonly denoted as pdis [3] or pgr [4] or by a24
small chamber shift, to position not the chambers reference point, but the25
so called effective point of measurement (EPOM) at the point of interest ~r26
within the water phantom [5]. By definition, the reference point for cylin-27
drical chambers is placed on the chambers symmetry axis, for parallel plate28
chambers it is at the center of the entrance surface of the air filled cavity.29
The EPOM concept was first introduced by Skaggs [6] for the measure-30
ment of depth dose curves in high energy electron beams and was further de-31
veloped and also applied to high energy photon beams especially by Dutreix32
[7] and Johansson et al. [8]. Former dosimetry protocols [9] did apply this33
concept for reference dosimetry as well as for the measurement of depth ion-34
ization curves in high energy photon and electron beams. Today the EPOM35
concept is still applied for relative dose measurements [4] and for electron36
4
21

dosimetry [3, 10]. For reference dosimetry in clinical photon beams most37
dosimetry protocols recommend the application of a perturbation correction38
pdis; only the German protocol DIN 6800-2 [11] still applies the EPOM con-39
cept for all types of measurements.40
Several newer publications again launched the discussion about the ef-41
fective point of measurement, not only for thimble chambers in high energy42
photon beams [12, 13, 14, 15, 16, 17, 18, 19], but also in case of electron43
dosimetry. Monte Carlo calculations performed by Wang and Rogers [20]44
showed, that the EPOM of parallel plate chambers in high energie electron45
beams may not coincide with the chambers reference point and that for cylin-46
drical chambers the upstream distance ∆z from the reference point to the47
EPOM given in the common dosimetry protocols may be to small. Looe48
et al. obtained similar results in their experimental investigations including49
several parallel-plate and cylindrical chambers.50
The purpose of this paper is a detailed Monte Carlo study to determine51
the EPOM for several ionization chambers for the whole range of clinical52
used electron energies. The EPOM in the approach of this study is charac-53
terized by the fact, that the resulting overall perturbation correction p is as54
depth independent as possible. The numerical data of the correction p are55
calculated.56
2. Fundamentals57
According to cavity theory the dose to water Dw at the depth z in a58
water phantom in the absence of the detector is related to the mean dose59
5
22

Ddet imparted to the air filled volume of the detector [1, 3]:60
Dw(z) = p · s∆w,a(z) ·Ddet (1)
where s∆w,a denotes the ratio of restricted mass collision stopping powers of61
the materials water and air and p perturbation factor accounting for the62
different electron fluence perturbations due to the presence of the detector.63
It is generally assumed, that the perturbation factor p may be factorized [3]:64
pwall: change of electron fluence due to the non-water equivalence of the cham-65
ber wall and any waterproofing material;66
pcel: change of electron fluence due to the central electrode;67
pcav: change of electron fluence related to the air cavity, predominantly the68
in-scattering of electrons (pfl according to AAPM TG-51 [4]);69
pdis: accounts for the effect of replacing a volume of water with the detector70
cavity when the reference point of the chamber is positioned at the71
depth of measurement (pgr according to AAPM TG-51). If the EPOM72
concept is applied, pdis = 173
The ICRU [21] concept of reporting absorbed dose at a point in a phantom74
as described in equation (1) is a very clear and useful concept from the phys-75
ical or mathematical point of view. But, as every energy deposition, hence76
every dose measurement implies a finite volume it is a priori not known, to77
which point within the detector the dose has to be reported. Due to the78
finite volume of every detector a fluence and also a dose gradient within the79
detector is present, even if the detector is positioned at the dose maximum80
6
23

of a depth dose curve [22]. For reference dosimetry in high energy photon81
beams most present codes of practice [3, 4] report the measured dose value to82
the chambers reference point, which is by definition for cylindrical chambers83
a point on the symmetry axis and for parallel plate chambers the center of84
the entrance surface of the air filled cavity. In that case the displacement85
effect is corrected by the factor pdis. For relative dose measurements gen-86
erally the EPOM concept is applied, i.e. the measured dose is reported to87
a different point within the chamber, the so called effective point of mea-88
surement (EPOM) and no displacement correction is necessary. According89
to the IAEA and the AAPM protocol, the EPOM for cylindrical chambers90
for photon beams is at a distance ∆z = −0.6 · r away from the reference91
point in upstream direction and ∆z = −0.5 · r for electrons. Within these92
equations r is the radius of the air filled cavity. The German protocol uses93
a value ∆z = −0.5 · r for both radiation types. For parallel plate chambers94
in high energy electron beams ∆z = 0 is assumed in all dosimetry protocols,95
but some protocols [3, 10, 11] account for the non-water equivalence of the96
entrance window of parallel plate chambers, i.e. the chambers reference point97
has to be positioned at the water equivalent depth z, not at the geometrical98
depth z.99
In a very systematic and comprehensive Monte Carlo study Kawrakow100
[12] has shown, that the EPOM shift ∆z for cylindrical chambers in photon101
beams is not only a function of the cavity radius, but also depends in a102
complex way on all other construction details as the cavity length, the central103
electrode, the chamber walls and also on the energy of the photon beam.104
That means, the EPOM has to be determined for each individual chamber105
7
24

Table 1: Volume V and radius r of the active volume of used ionization chambers. For
the parallel plate chambers additionally the thickness of the entrance window d is given,
i.e. the distance from the chambers surface to the reference point.
chamber type V in cm3 r in cm d in cm
Roos parallel 0.350 0.780 0.112
PTW-34001
Markus parallel 0.055 0.265 0.13
PTW-23343
Adv. Markus parallel 0.020 0.250 0.13
PTW-34045
NACP-02 parallel 0.160 0.825 0.06
Semiflex cylindrical 0.125 0.275
PTW - 31010
PinPoint cylindrical 0.015 0.100
PTW-31014
8
25
type as a function of energy. For a large number of cylindrical chambers in106
megavoltage photon beams this was performed by Tessier and Kawrakow in107
a recent publication [16].108
Regarding clinical electron dosimetry, several authors [23, 24, 25] have109
demonstrated, that there is a strong depth dependence of the overall per-110
turbation correction p. Moreover, Zink and Wulff [26, 27] have shown, that111
the different perturbation corrections mentioned above obey different depth112
dependences and the overall perturbation p strongly depends on the position-113
ing of the chamber, i.e. on the choice of the effective point of measurement114
within the chamber. For practical clinical purposes it would be of great ad-115
vantage, to find a chamber positioning, i.e. an effective point of measurement116
within the chamber, resulting in a depth independent overall perturbation117
correction p, which could be applied for all depths of the depth ionization118
curve to calculate dose to water (see eq. (1)).119
3. Methods and Material120
3.1. EPOM determination in clinical electron beams121
Following Wang and Rogers [20] the effective point of measurement was122
determined as follows: (i): a depth dose curve Dw(z) with sufficient depth123
resolution and small statistical uncertainty was calculated in a water phan-124
tom. To get a continuous function of depth z a spline interpolation of the125
depth dose curve was performed; (ii) the depth ionization curve of the ion-126
ization chamber was calculated within the water phantom, positioned with127
its reference point at the depth of measurement z; (iii) the depth dose curve128
Dw(z) was shifted an amount ∆z until the root mean square deviation:129
9
26

(rms(∆z))2 =1
n·∑
i
(Di
w(z +∆z)− s∆w,a(z) ·Di
det(z))2
(2)
reaches a minimum. Within equation (2), n is the number of data points130
of the depth ionization and depth dose curve. The resulting shift ∆z corre-131
sponds to the (negative) distance from the chambers reference point to the132
effective point of measurement (EPOM). Positioning the EPOM at the depth133
of measurement will result in a perturbation correction p, which is as depth134
independent as possible.135
3.2. Monte Carlo simulations136
All Monte Carlo simulations were performed with the EGSnrc code sys-137
tem [28] applying the user code egs chamber [29] for dose calculations and138
SPRRZnrc [30] for the calculation of stopping power ratios necessary to deter-139
mine the overall perturbation correction p in equation (1). In all simulations140
the particle production thresholds and transport cut-off energies are AE =141
ECUT = 521 keV and AP = PCUT = 10 keV for electrons and photons, re-142
spectively. In preliminary calculations it was ensured, that a further decrease143
of these energy thresholds will give same results within statistical uncertain-144
ties of typical 0.1%. To increase the calculation efficiency variance reduction145
methods like photon splitting and russian roulette were applied [31].146
The EPOM was calculated for four different parallel-plate chambers and147
two cylindrical chambers (see tab.(1)). They were modeled in detail accord-148
ing to the information provided by the manufacturer using the EGSnrc C++149
class library [32]. The chambers were positioned in a water phantom di-150
mensioned 30 x 30 x 30 cm3, the source to surface distance was set to 100151
10
27

Table 2: Characteristics of used electron fluence spectra and resulting depth dose curves
[33]
nom. energy in MeV R50 zref Rp
in g · cm2
6 2.63 1.48 3.11
9 4.00 2.30 4.85
12 5.18 3.01 6.35
18 7.72 4.53 9.58
cm in all simulations and the field size at the water phantom surface was152
10 x 10 cm2. The energy deposition was calculated within the active volume153
of the chambers. The dose to water was calculated within a small water voxel154
with a radius of 0.5 cm and a height of 0.02 cm. This voxel size was also155
used for the calculation of the mass stopping power ratio water to air.156
As electron source several fluence spectra of a Varian Clinac 2100C ac-157
celerator [33] covering the whole range of clinical applications were applied.158
The nominal electron energies and depth dose characteristics of these spectra159
are summarized in table (2).160
4. Results and discussion161
4.1. EPOM of parallel plate chambers162
In preliminary calculations the dependence of the minimization result163
(eq. (2)) on the range of the depth dose data included in the minimization164
process to determine the EPOM was investigated. As shown in figure 1, there165
is a clear dependence of the effective point of measurement on the considered166
11
28

0.6 0.8 1.0 1.2 1.4considered z/R
50 in cm
0.00
0.01
0.02
0.03
0.04
0.05
0.06
z /
cm
this work
Zink et al 2009 Looe at al 2011
exp. uncertainty by Looe et al
Figure 1: Dependence of the EPOM on the considered part of the depth dose curve.
Results are given for a Roos chamber in a 6 MeV electron beam. The solid line displays
the results from Looe et al. [18] and Zink et al.[26]. The dashed lines are the experimental
uncertainties given by Looe. The error bars indicate the statistical uncertainties of the
Monte Carlo simulations (1σ).
depth dose range. Based on these results it was decided, to include the depth167
dose data from the surface (z = 0.1 cm) down to the practical range Rp for168
each electron energy.169
Table (3) summarizes the results for the plane parallel chambers examined170
in this study. The table gives the position of the EPOM in relation to the171
reference point of each chamber. As can be seen is the position of the EPOM172
within the chamber mostly independent from electron energy. The data are173
in good agreement with the experimental data from Looe et al.; for the Roos174
and Markus chamber the authors published a value of ∆z =(0.04±0.01) cm.175
They do also agree within ±0.01 cm with the Monte Carlo data published176
by Wang and Rogers [20] for the NACP and Markus chamber. According to177
all dosimetry protocols the reference point should coincide with the effective178
point of measurement. Looking at table (3) it is clear, that this statement179
12
29

0.2 0.4 0.6 0.8 1.0z/R
50 in cm
0.96
0.98
1.00
1.02
p
6 MeV z = 0.027 cm
12 MeV z = 0.031 cm
18 MeV z = 0.014 cm
zref
Markus
0.2 0.4 0.6 0.8 1.0z/R
50 in cm
0.96
0.98
1.00
1.02
p6 MeV z = 0.060 cm
12 MeV z = 0.068 cm
18 MeV z = 0.059 cm
zref
NACP
0.2 0.4 0.6 0.8 1.0z/R
50 in cm
0.96
0.98
1.00
1.02
p
6 MeV z = -0.006 cm
12 MeV z = 0.003 cm
18 MeV z = -0.005 cm
zref
Adv. Markus
0.2 0.4 0.6 0.8 1.0z/R
50 in cm
0.96
0.98
1.00
1.02
p
6 MeV z = 0.043 cm
12 MeV z = 0.050 cm
18 MeV z = 0.043 cm
zref
Roos
Figure 2: Overall correction factor p = Dw(z)/(D
EPOM
det (z) · s∆w,a(z))
as a function of
depth in a water phantom for four parallel plate chambers. The chambers are positioned
with their EPOM at the depth of measurement z. The error bars indicate the statistical
uncertainty of the Monte Carlo results (1σ).
13
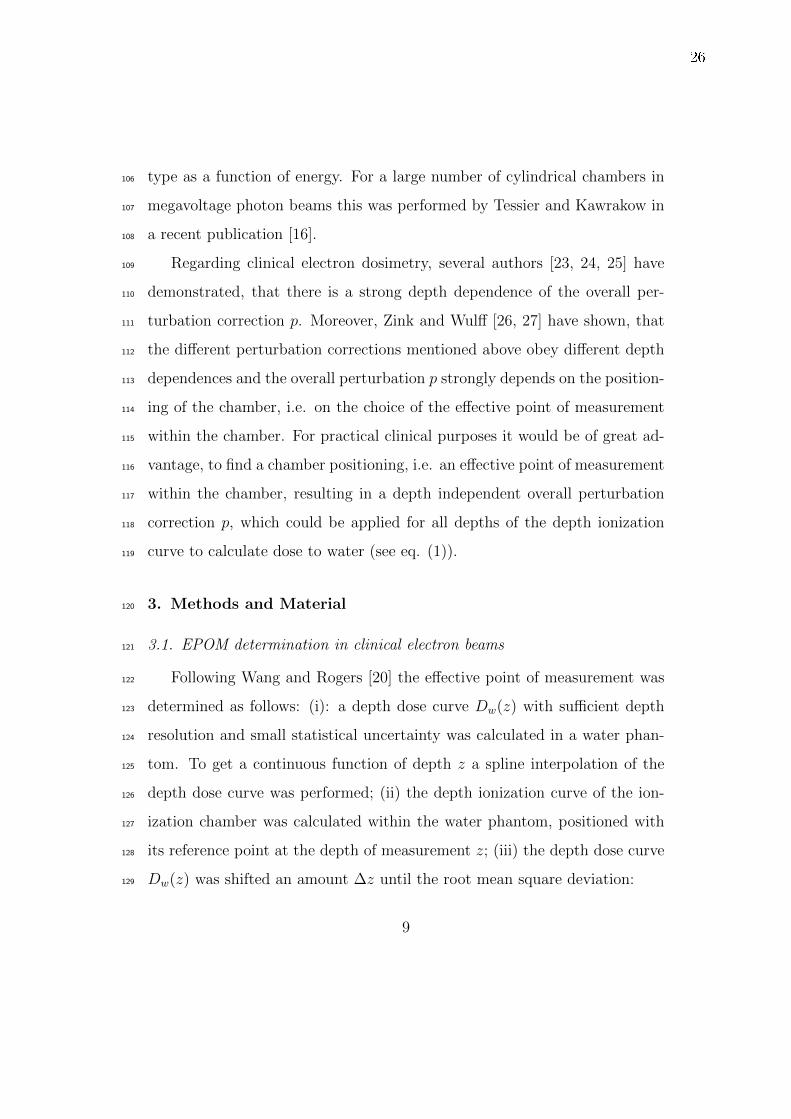
30
Table 3: Calculated EPOM for different parallel plate chambers as a function of the elec-
tron energy. A positive shift ∆z indicates, that the effective point of measurement is
downstream the chambers reference point, i.e. away from the focus. The numbers in
brackets represent the standard deviation statistical uncertainty in the last digit. Litera-
ture data for the Roos, Markus and NACP-02 chamber are taken from [26] and [20].
chamber EPOM shift ∆z relative
to the reference point in cm
6 MeV 9 MeV 12 MeV 18 MeV ∆z literature
Roos 0.040(4) 0.048(4) 0.050(4) 0.043(4) 0.045(4) 0.04±0.01
Markus 0.027(4) 0.031(4) 0.031(4) 0.014(4) 0.026(4) 0.02±0.01
Adv. Markus 0.007(4) -0.004(4) 0.003(4) -0.005(4) 0.000(4) -
NACP-02 0.060(4) 0.065(4) 0.068(4) 0.059(4) 0.065(4) 0.06±0.01
holds only for the Advanced Markus chamber. For all other chambers the180
EPOM is shifted several tenth of millimeters into the air filled cavity. Even181
if the non-water equivalence of the entrance window is accounted for [3, 10],182
the EPOM shifts for these chambers are larger.183
The resulting depth dependence of the overall correction factor p(z) cal-184
culated according to equation (1) is displayed in figure (2). The diagrams185
clearly show, that the depth dependence of p mostly vanish, if the chamber186
is positioned with the EPOM given in table (3) at the depth of measurement187
z. Up to the half value depth R50 the variation of p is within 1% for all188
chambers and energies. Beyond this depth the deviations increase and may189
reach 3% or more at the practical range Rp. A compilation of the numerical190
data of the perturbation corrections p is given in table (5).191
14
31

2.0 3.0 4.0 5.0 6.0 7.0 8.0z/R
50 in cm
-0.55
-0.50
-0.45
-0.40
-0.35
-0.30
z /
r
PTW 31010
PTW 31014
Figure 3: Energy dependence of the EPOM for the cylindrical chambers used in this
study. The EPOM shift ∆z is given in units of the chambers cavity radius r. The error
bars indicate the statistical uncertainties of the Monte Carlo simulations (1σ).
4.2. EPOM of cylindrical chambers192
As may be expected from literature data [20], the EPOM shift for cylin-193
drical chambers varies with energy. In agreement with the mentioned publi-194
cation our simulations give a progressively movement of the EPOM toward195
the focus with increasing electron energy (see tab.(4) and fig. (3)). For196
the highest electron energy within this study, the calculated EPOM shift for197
both chambers is close to the recommended value ∆z/r = −0.5 (see sec.198
(2)), whereas for the lowest energy the EPOM shift ∆z/r deviates by more199
than 30% from this value.200
Figure (4) displays the resulting overall perturbation corrections p for201
the investigated cylindrical chambers. As can be seen, the application of the202
calculated EPOM shift results in a mostly depth independent perturbation203
correction p for the Pinpoint chamber with variations < 1% down to a depth204
of z/R50 ≈ 1.1. In contrast to this, the depth dependence of the larger205
chamber, PTW 31010, is much more pronounced even if the optimal EPOM206
15
32

Table 4: Calculated EPOM for two cylindrical chambers as a function of the electron
energy. A negative shift ∆z indicates, that the effective point of measurement is upstream
the chambers reference point, i.e. toward the focus. The numbers in brackets represent
the standard deviation statistical uncertainty in the last digit.
chamber EPOM shift ∆z normalized to the cavity radius r
6 MeV 9 MeV 12 MeV 18 MeV fit
PTW 31010 -0.335(4) -0.391(4) -0.407(4) -0.499(4) −∆z/r = 0.032 * R50 + 0.25
PTW 31014 -0.334(4) -0.428(4) -0.426(4) -0.564(4) −∆z/r = 0.043 * R50 + 0.23
0.2 0.4 0.6 0.8 1.0z/R
50 in cm
0.96
0.98
1.00
1.02
p
6 MeV z = 0.33 * r
12 MeV z = 0.41 * r
18 MeV z = 0.50 * r
zref
PTW 31010
0.2 0.4 0.6 0.8 1.0z/R
50 in cm
0.96
0.98
1.00
1.02
p
6 MeV z = 0.33 * r
12 MeV z = 0.43 * r
18 MeV z = 0.56 * r
zref
PTW 31014
Figure 4: Overall correction factor p = Dw(z)/(D
EPOM
det (z) · s∆w,a(z))
as a function of
depth in a water phantom for two cylindrical chambers. The chambers are positioned
with their EPOM at the depth of measurement z. Error bars indicate the statistical
uncertainties of the Monte Carlo simulations.
16
33

Table 5: Calculated overall perturbation correction p for the chambers investigated in this
study; p is calculated for the reference depth zref and is also given as a mean value p over
depth z with its standard deviation ∆p. The depth range calculating the mean value was
z/R50 = 0 to 1 for parallel plate and z/R50 = 0 to 0.8 for cylindrical ion chambers.
chamber energie MeV ∆z p(zref) |∆p(zref)| p ∆p
Roos 6, 12, 18 0.045 1.005 0.003 1.005 0.003
Markus 6, 12, 18 0.026 1.000 0.003 1.004 0.004
Adv. Markus 6, 12, 18 0.000 1.005 0.002 1.006 0.003
NACP-02 6, 12, 18 0.067 1.005 0.003 1.007 0.005
6 -0.335 0.975 0.004 0.971 0.009
PTW 31010 12 -0.391 0.980 0.004 0.982 0.005
18 -0.499 0.990 0.004 0.988 0.005
6 -0.334 0.990 0.004 0.991 0.003
PTW 31014 12 -0.428 0.990 0.004 0.992 0.004
18 -0.564 0.995 0.004 0.998 0.008
is chosen. Beyond a depth z/R50 ≈ 0.8 there is an increase of p for all207
energies. For the smallest energy (6 MeV), the variation ∆p is already in the208
range of 3% concerning the depth range from the surface to the half value209
depth R50. For the higher energies this variation is within 2%. The numerical210
data for the perturbation corrections are summarized in table (5).211
5. Summary and conclusion212
The well known displacement effect of air filled ion chambers in clinical213
electron beams may be accounted for in two different ways: by a factor pdis [4]214
or by applying the concept of the effective point of measurement [3, 10, 11]. In215
the first case the chamber is positioned with its reference point at the depth216
17
34

of measurement z. According to present dosimetry protocols the position of217
the EPOM for cylindrical chambers in clinical electron beams is assumed to218
be at a distance ∆z = −0.5 · r away from the reference point in upstream219
direction. For parallel plate chambers a shift ∆z = 0 between the chambers220
reference point and the EPOM is assumed in all dosimetry protocols.221
Former publications have shown, that the overall perturbation correction222
p for parallel plate chambers in clinical electron beams strongly depend on223
the depth of measurement and on the chambers positioning, i.e. on the choice224
of the EPOM [23, 24, 25, 26]. From this point on it is straightforward to225
look for an EPOM within the chambers minimizing the depth dependence226
of p. This was done experimentally by Looe et al. [18], comparing depth227
dose measurements of several detectors with calibrated films, which where228
assumed to act as perturbation free detectors. In this study the effective point229
of measurement for four parallel plate chambers and two cylindrical chambers230
in clinical electron beams was investigated by Monte Carlo simulations using231
a comparable approach as Kawrakow [12] and Wang and Rogers [20]. Our232
results confirm the experimental data from Looe et al. and were extended233
to the whole range of clinical relevant electron energies and include not only234
parallel plate chambers but also cylindrical chambers. Moreover, the Monte235
Carlo calculations did allow the calculation of the perturbation correction236
p necessary to determine the dose to water from measured depth ionization237
curves.238
Concerning the Markus chamber, the determined EPOM from the exper-239
imental study of Looe et al. [18] deviates somewhat from the data given240
there (0.4 mm vs. 0.26mm). The reason for this is obviously based on the241
18
35

different method in the determination of the EPOM for the Markus chamber242
in both studies. According to the German dosimetry protocol [11] the depth243
dependent perturbation correction pcav has to be applied for the guardless244
Markus chamber to correct the in-scattering of electrons into the Markus245
chamber (see ICRU- 35 [34]). This depth dependent correction was applied246
by Looe et al. before determining the EPOM. Our own Monte-Carlo sim-247
ulations, which will be published elsewhere [35], show, that the correction248
pcav(z) given in the DIN protocol may be wrong, i.e. it was not applied here;249
this may explain the different EPOMs in both studies.250
Our results have shown that for all parallel plate chambers there is an251
effective point of measurement within the air filled cavity that the result-252
ing depth dependence of the overall perturbation correction is largely depth253
independent. The variation of p with depth is no more than 1% down to254
depths of z/R50 ≈ 1. Moreover, the EPOM for these chambers is mostly in-255
dependent of the energy of the primary electrons. Except for the Advanced256
Markus chamber the EPOM differs markedly from the chambers reference257
point. Regarding cylindrical chambers the EPOM shift is energy dependent.258
For large electron energies its value ∆z/r is close to the recommended value259
|∆z/r| = 0.5 and decreases by more than 30% for the lowest energy consid-260
ered in this study (6 MeV). Applying the EPOM shift, the small Pinpoint261
chamber exhibit a depth independent overall perturbation correction p over a262
comparable range of the depth dose curve as the parallel plate chambers. For263
the larger Semiflex chamber PTW 31010 this range is reduced to z/R50 ≈ 0.8,264
i.e. if cylindrical chambers are applied for electron dosimetry small volumed265
chambers like the Pinpoint chamber should be preferred.266
19
36

Applying the proposed EPOM shift from this study would increase the267
accuracy of depth dose measurements in high energy electron beams, as for268
the conversion from depth ionization data to depth dose data only the stop-269
ping power ratios have to be applied, which may simply be calculated from270
the fit given by Burns et al. [36]. This is especially of great importance if271
modern dose calculation algorithms like Monte Carlo based algorithms are272
compared with measurements. Reference dosimetry can be performed with273
the same chamber positioning, if the proposed perturbation correction p at274
the reference depth zref is applied, i.e. clinical electron dosimetry will be275
simplified.276
Acknowledgments277
The authors thank Dr. E. Schule of PTW-Freiburg for providing blueprints278
of the chambers used in this study. Valuable discussions with the members279
of German working group DIN 6800-2 are also acknowledged.280
References281
[1] L. V. Spencer, F. H. Attix, A theory of cavity ionization, Radiat Res282
3 (3) (1955) 239–254.283
[2] L. V. Spencer, F. H. Attix, A cavity ionization theory including the284
effects of energetic secondary electrons, Radiology 64 (1) (1955) 113.285
[3] P Andreo, D T Burns, K Hohlfeld, M S Huq, T Kanai, F Laitano,286
V Smyth, S Vynckier, Absorbed dose determination in external beam287
radiotherapy. an international code of practice for dosimetry based on288
20
37

standards of absorbed dose to water, Technical Reports Series TRS-398289
(Vienna: International Atomic Energy Agency).290
[4] P. R. Almond, P. J. Biggs, B. M. Coursey, W. F. Hanson, M. S. Huq,291
R. Nath, D. W. Rogers, Aapm’s tg-51 protocol for clinical reference292
dosimetry of high-energy photon and electron beams, Med Phys 26 (9)293
(1999) 1847–1870.294
[5] P Andreo, A Nahum, Supplementary details on codes of practice for295
absolute dose determination: Handbook of radiotherapy physics, Taylor296
& Francis, 2007.297
[6] L. S. Skaggs, Depth dose of electrons from the betatron, Radiology 53 (6)298
(1949) 868–874. doi:10.1148/53.6.868.299
[7] J. Dutreix, A. Dutreix, Comparative study of a series of ionization cham-300
bers within 20 and 10 mev electron fluxes, Biophysik 3 (3) (1966) 249–301
258.302
[8] K A Johansson, L O Mattsson, L Lindborg, H Svensson, Absorbed-dose303
determination with ionization chambers in electron and photon beams304
having energies between 1 and 50 mev, National and International Stan-305
dardization of Radiation Dosimetry, IAEA Proceedings Series, Vienna306
2 (1978) 243–270.307
[9] IAEA, Absorbed dose determination in photon and electron beams. iaea308
technical report series 277 (2nd edn in 1997) (1987).309
[10] D. I. Thwaites, A. R. DuSautoy, T. Jordan, M. R. McEwen, A. Nisbet,310
A. E. Nahum, W. G. Pitchford, I. P. E. M. Working Party, The ipem311
21
38

code of practice for electron dosimetry for radiotherapy beams of initial312
energy from 4 to 25 mev based on an absorbed dose to water calibration,313
Phys Med Biol 48 (18) (2003) 2929–2970.314
[11] DIN6800-2, Procedures of dosimetry with probe-type detectors for pho-315
ton and electron radiation - part 2: Ionization chamber dosimetry of316
high energy photon and electron radiation (2008).317
[12] Iwan Kawrakow, On the effective point of measurement in mega-318
voltage photon beams, Med Phys 33 (6) (2006) 1829–1839.319
doi:10.1118/1.2201147.320
[13] M. R. McEwen, I. Kawrakow, C. K. Ross, The effective point of mea-321
surement of ionization chambers and the build-up anomaly in mv x-ray322
beams, Med Phys 35 (3) (2008) 950–958. doi:10.1118/1.2839329.323
[14] L. L W Wang, D. W O Rogers, The replacement correction factors for324
cylindrical chambers in high-energy photon beams, Phys Med Biol 54 (6)325
(2009) 1609–1620. doi:10.1088/0031-9155/54/6/014.326
[15] Pedro Andreo, On the p(dis) correction factor for cylindrical cham-327
bers, Phys Med Biol 55 (5) (2010) L9–16; author reply L17–9.328
doi:10.1088/0031-9155/55/5/L01.329
[16] F. Tessier, I. Kawrakow, Effective point of measurement of thimble ion330
chambers in megavoltage photon beams, Medical Physics 37 (1) (2010)331
96. doi:10.1118/1.3266750.332
[17] F. Tessier, B. D. Hooten, M. R. McEwen, Zero-shift thimble ionization333
chamber, Medical Physics 37 (3) (2010) 1161. doi:10.1118/1.3314072.334
22
39
[18] Hui Khee Looe, Dietrich Harder, Bjorn Poppe, Experimental determi-335
nation of the effective point of measurement for various detectors used336
in photon and electron beam dosimetry, Phys Med Biol 56 (14) (2011)337
4267–4290. doi:10.1088/0031-9155/56/14/005.338
[19] C. Legrand, G. H. Hartmann, C. P. Karger, Experimental determination339
of the effective point of measurement for cylindrical ionization chambers340
in 60co gamma radiation, Phys Med Biol 57 (11) (2012) 3463–3475.341
doi:10.1088/0031-9155/57/11/3463.342
[20] L. L. W. Wang, D. W. O. Rogers, Study of the effective point of mea-343
surement for ion chambers in electron beams by monte carlo simulation,344
Medical Physics 36 (6) (2009) 2034. doi:10.1118/1.3121490.345
[21] ICRU-33, ICRU Report 33: Radiation Quantities and Units, ICRU,346
Bethesda / USA, 1980.347
[22] B. E. Bjarngard, K. R. Kase, Replacement correction factors for photon348
and electron dose measurements, Med Phys 12 (6) (1985) 785–787.349
[23] Lesley A Buckley, D. W O Rogers, Wall correction factors, p wall, for350
parallel-plate ionization chambers, Med Phys 33 (6) (2006) 1788–1796.351
[24] F. Verhaegen, R. Zakikhani, A. Dusautoy, H. Palmans, G. Bostock,352
D. Shipley, J. Seuntjens, Perturbation correction factors for the nacp-353
02 plane-parallel ionization chamber in water in high-energy electron354
beams, Phys Med Biol 51 (5) (2006) 1221–1235. doi:10.1088/0031-355
9155/51/5/012.356
23
40

[25] F Araki, Monte carlo calculations of correction factors for plane-parallel357
ionization chambers in clinical electron dosimetry, Med Phys 35 (2008)358
4033–4040.359
[26] K. Zink, J. Wulff, Positioning of a plane-parallel ionization chamber in360
clinical electron beams and the impact on perturbation factors, Phys361
Med Biol 54 (8) (2009) 2421–2435. doi:10.1088/0031-9155/54/8/011.362
[27] K. Zink, J. Wulff, On the wall perturbation correction for a parallel-plate363
nacp-02 chamber in clinical electron beams, Med Phys 38 (2) (2011)364
1045–1054.365
[28] I. Kawrakow, D. W. O. Rogers, The egsnrc code system: Monte carlo366
simulation of electron and photon transport; nrcc report pirs-701, Na-367
tional Research Council of Canada.368
[29] J. Wulff, K. Zink, I. Kawrakow, Efficiency improvements for ion chamber369
calculations in high energy photon beams, Med Phys 35 (4) (2008) 1328–370
1336. doi:10.1118/1.2874554.371
[30] D. W. O. Rogers, J. P. S. I. Kawrakow, B. R. B. Walters, E. Mainegra-372
Hing, Nrc user codes for egsnrc, National Research Council of Canada373
Report PIRS-702.374
[31] I. Kawrakow, M. Fippel, Investigation of variance reduction techniques375
for monte carlo photon dose calculation using xvmc, Phys Med Biol376
45 (8) (2000) 2163–2183. doi:10.1088/0031-9155/45/8/308.377
[32] I. Kawrakow, E. Mainegra-Hing, F. Tessier, B.R.B. Walter, The egsnrc378
c++ class library, NRC Report PIRS-898 (rev A), Ottawa, Canada.379
24
41

[33] G. X. Ding, D. W. O. Rogers, T. R. Mackie, Calculation of stopping-380
power ratios using realistic clinical electron beams, Med Phys 22 (5)381
(1995) 489–501. doi:10.1118/1.597581.382
[34] ICRU-35, ICRU Report 35: Radiation Dosimetry: Electron Beams with383
Energies Between 1 and 50 MeV, Vol. 12, ICRU, Bethesda / USA, 1985.384
doi:10.1118/1.595780.385
[35] K. Zink, P. v. Voigts-Rhetz, About the cavity and gradient perturba-386
tion correction for parallel plate chambers in clinical electron beams,387
submitted to Med. Phys. (Medical Physics).388
[36] D. T. Burns, G. X. Ding, D. W. O. Rogers, R50 as a beam quality speci-389
fier for selecting stopping-power ratios and reference depths for electron390
dosimetry, Med Phys 23 (3) (1996) 383–388.391
25
42

Kapitel 5
Di�erence in the relative response of
the alanine dosimeter to megavoltage
x-ray and electron beams
Das in Kooperation mit der Physikalisch-Technische Bundesanstalt erstellte Paper mit
dem Titel �Di�erence in the relative response of the alanine dosimeter to megavoltage
x-ray and electron beams� [58] wurde in der wissenschaftlichen Zeitschrift Physics in
Medicine and Biology Nr. 58 (3259-3282) publiziert. Es wird darauf hingewiesen das Dr.
Mathias Anton der Hauptautor ist. Der Auto dieser Masterthesis wird demzufolge nur
als Co-Autor aufgeführt.
Weitere Autoren sind:
� Dr. Ralf-Peter Kapsch - Physikalisch-Technische Bundesanstalt, Braunschweig
� Dr. Achim Krauss - Physikalisch-Technische Bundesanstalt, Braunschweig
� Prof. Dr. Klemens Zink - Technische Hochschule Mittelhessen Institut für Medi-
zinische Physik und Strahlenschutz, Giessen
� Dr. Malcolm McEwen - Ionizing Radiation Standards, National Research Council,
Ottawa
Die Teile der Arbeit die durch den Autor für diese Verö�entlichung erarbeitet wurden,
sind in dem Kapitel �4. Monte Carlo simulations� zu �nden.
43

IOP PUBLISHING PHYSICS IN MEDICINE AND BIOLOGY
Phys. Med. Biol. 58 (2013) 3259–3282 doi:10.1088/0031-9155/58/10/3259
Difference in the relative response of the alaninedosimeter to megavoltage x-ray and electron beams
M Anton1, R-P Kapsch1, A Krauss1, P von Voigts-Rhetz2, K Zink2
and M McEwen3
1 Physikalisch-Technische Bundesanstalt, Bundesallee 100, D-38116 Braunschweig, Germany2 Institut fur Medizinische Physik und Strahlenschutz (IMPS), University of Applied SciencesGiessen-Friedberg, Wiesenstr 14, D-35390 Giessen, Germany3 Ionizing Radiation Standards, National Research Council, Ottawa, Canada
E-mail: [email protected]
Received 24 October 2012, in final form 14 March 2013Published 24 April 2013Online at stacks.iop.org/PMB/58/3259
AbstractIn order to increase the usefulness of the alanine dosimeter as a tool for qualityassurance measurements in radiotherapy using MV x-rays, the response withrespect to the dose to water needs to be known accurately. This quantity isdetermined experimentally relative to 60Co for 4, 6, 8, 10, 15 and 25 MVx-rays from two clinical accelerators. For the calibration, kQ factors forionization chambers with an uncertainty of 0.31% obtained from calorimetricmeasurements were used. The results, although not inconsistent with a constantdifference in response for all MV x-ray qualities compared to 60Co, suggest aslow decrease from approximately 0.996 at low energies (4–6 MV) to 0.989 atthe highest energy, 25 MV. The relative uncertainty achieved for the relativeresponse varies between 0.35% and 0.41%. The results are confirmed by revisedexperimental data from the NRC as well as by Monte Carlo simulations usinga density correction for crystalline alanine. By comparison with simulatedand measured data, also for MeV electrons, it is demonstrated that the weakenergy dependence can be explained by a transition of the alanine dosimeter(with increasing MV values) from a photon detector to an electron detector.An in-depth description of the calculation of the results and the correspondinguncertainty components is presented in an appendix for the interested reader.With respect to previous publications, the uncertainty budget had to be modifieddue to new evidence and to changes of the measurement and analysis methodused at PTB for alanine/ESR.
1. Introduction
Dosimetry using alanine with read-out via electron spin resonance (ESR) is a convenienttool for quality assurance measurements for radiotherapy. The main reasons are the good
0031-9155/13/103259+24$33.00 © 2013 Institute of Physics and Engineering in Medicine Printed in the UK & the USA 3259
44

3260 M Anton et al
water-equivalence of alanine, the weak dependence on the irradiation quality, non-destructiveread-out (different from thermoluminescence detectors) and the small size of the detectors.
Irradiation induces free radicals in the amino acid alanine. The radicals are stable: if thedetectors are stored in a dry environment, the fading, i.e. the loss of radicals, is only of theorder of a few parts in 103 per year, which makes them suitable for mailed dosimetry. Theread-out is usually performed by ESR. Since the reading is not absolute, the ESR amplitudehas to be calibrated.
Since the 1980s, alanine dosimetry has been used for (mailed) dosimetry for radiationprocessing, since the mid-nineties, the National Physical Laboratory (NPL, UK) (Sharpe et al1996) and others (De Angelis et al 2005, Onori et al 2006) also have used alanine for maileddosimetry in the therapy dose range, i.e. with doses lower than 10 Gy. Recently, advancedtherapy modalities such as intensity modulated radiotherapy or the Cyberknife have beenchecked using alanine dosimetry (Budgell et al 2011, Garcia et al 2011). A large fraction ofthe Belgian therapy centres participated in a dosimetry audit using alanine/ESR (Schaekenet al 2011).
Several publications deal with the response of the alanine dosimeter to high-energy x-raysand megavoltage electrons, which are the radiation qualities for which the alanine dosimeter isbest suited. The energy dependence is very weak. Between 60Co (average photon energy 1.25MeV) and 25 MV x-rays, the relative response of the alanine dosimeter varies by less than 1%(Sharpe 2003, Bergstrand et al 2003, Zeng et al 2004, Anton et al 2008). None of the listedpublications gave evidence of a significant energy dependence for MV x-rays, which is whySharpe (2003, 2006) from NPL suggested to use a common relative response of 0.994 for allMV qualities4. There were no contradictory results reported so far.
For electrons, the situation is similar, the most accurate measurements were published bythe National Research Council (NRC, Canada) (Zeng et al 2004) and by the Swiss metrologyinstitute METAS in cooperation with PTB (Voros et al 2012). The results presented in thesetwo publications agree (on average) within 0.1% and indicate that a common relative responseof 0.988 for all megavoltage electron qualities will be appropriate, with an uncertainty ofapproximately 1%.
In spite of this apparent consensus situation we used the new electron accelerator facilitiesat PTB to determine the relative response of the alanine dosimeter for six qualities, namely4, 6, 8, 10, 15 and 25 MV x-rays. The motivation for the new measurements was that moreaccurate values for the quality correction factor kQ for ionization chambers are now availablefrom measurements with the PTB water calorimeter, the uncertainty of the kQ is 0.31% forall listed qualities. Due to the comparatively large number of measurements made and hencea small statistical uncertainty, a weak energy dependence, i.e. a small drop of the relativeresponse for qualities with an accelerating voltage between 8 and 15 MV, could be identified.
In addition, data for 8 and 16 MV that had been published previously (Anton et al 2008)had to be revised. For 8 MV, there was no change apart from a slight increase of the uncertainty.The 16 MV value had to be corrected due to a wrong conversion factor that had been applied tothe old data. A comparison between NRC and PTB is also reported; alanine dosimeter probeswere irradiated at NRC and analysed at PTB. This was prompted by apparent discrepanciesbetween the 25 MV results published by NRC (Zeng et al 2004) and our new data.
Monte Carlo simulations were carried out in order to find out whether the observedbehaviour of the alanine dosimeter could be reproduced by the calculations. Zeng et al (2005)showed that it was necessary to use the density effect correction for crystalline alanine instead of
4 This means that the dose determined by an alanine dosimeter—with a calibration using 60Co—has to be multipliedby 1.006 in order to yield the correct dose. The uncertainty of Sharpe’s data is 0.6%.
45

Difference in the relative response of the alanine dosimeter to megavoltage x-ray and electron beams 3261
Table 1. Properties of the Harwell alanine pellets used.
Batch Average mass (mg) Diameter (mm) Height (mm) Density (g cm−3) CV (%)
AF594 59.4 ± 0.2 4.82 ± 0.01 2.8 ± 0.1 1.16 0.4AJ598 59.8 ± 0.2 4.82 ± 0.01 2.7 ± 0.1 1.21 0.4AL595 59.5 ± 0.2 4.82 ± 0.01 2.6 ± 0.1 1.25 0.3
a density effect correction for the alanine/paraffin mixture with the bulk density of the pellet inorder to reproduce the relative response for high energy electrons. Therefore, calculations withthe different density corrections were compared for the MV x-ray qualities under investigation.Additional simulations were made to determine some parameters of interest such as stoppingpower ratios, the mean secondary electron energy and electron ranges, which helped to explainthe new results.
In an appendix, the uncertainty budget is detailed. This appeared necessary due to newevidence as well as to a slightly modified measurement and analysis method. Using the dose-normalized amplitude directly instead of a complete calibration curve saves several hoursof measurement time per day and leads only to a moderate, but acceptable increase of theoverall uncertainty. Details of the experimental results are also only given in the appendix.This will facilitate the reading of the main text, but will provide the interested reader with allthe information necessary to follow the calculation of the results and their uncertainties. Alluncertainties are standard uncertainties (coverage factor k = 1) and are determined accordingto the terms of reference stated in the GUM, the Guide to the expression of uncertainty inmeasurement (JCGM100 2008).
For the sake of simplicity, dose or D is to be understood as absorbed dose to water in thefollowing, unless otherwise stated.
2. Materials and methods
2.1. Dosimeter probes
Alanine pellets with an addition of approximately 9% of paraffin as a binder, supplied byHarwell, were used. Their parameters are listed in table 1. The leftmost column lists the nameof the batch. The following columns are the average mass in mg and the dimensions in mm.The rightmost column, denoted as CV (= coefficient of variation), quantifies the uncertainty ofthe intrinsic response, i.e. the signal per mass if the same dose is applied to different pellets ofthe same batch. This is due to variations of the composition. The CV value is usually specifiedby the supplier. An experimental verification for batch AL595 yielded the same CV of 0.3%.The uncertainty for an individual mass is estimated as 60 μg and takes the loss of materialdue to handling for up to ten handling processes into account (see Anton 2005). Test pellets(irradiated in MV x-ray fields) and calibration pellets (irradiated in the 60Co reference field)were always taken from the same batch.
One detector consists of a stack of four alanine pellets that has to be protected from thesurrounding water. All detectors that were used for the determination of the relative responsewere irradiated in a polymethylmethacrylate (PMMA) holder fitting inside a watertight PMMAsleeve for a NE 2571 (Farmer) ionization chamber (see Anton 2006). A small additional setof detectors shrink-wrapped in polyethylene (PE) was irradiated. The detectors together withtheir holder are referred to as probes.
The two different probes are shown as schematic drawings (to scale) in figure 1. Panel (a)shows the detector with a Farmer holder and sleeve with a total PMMA wall thickness of 2 mm.
46
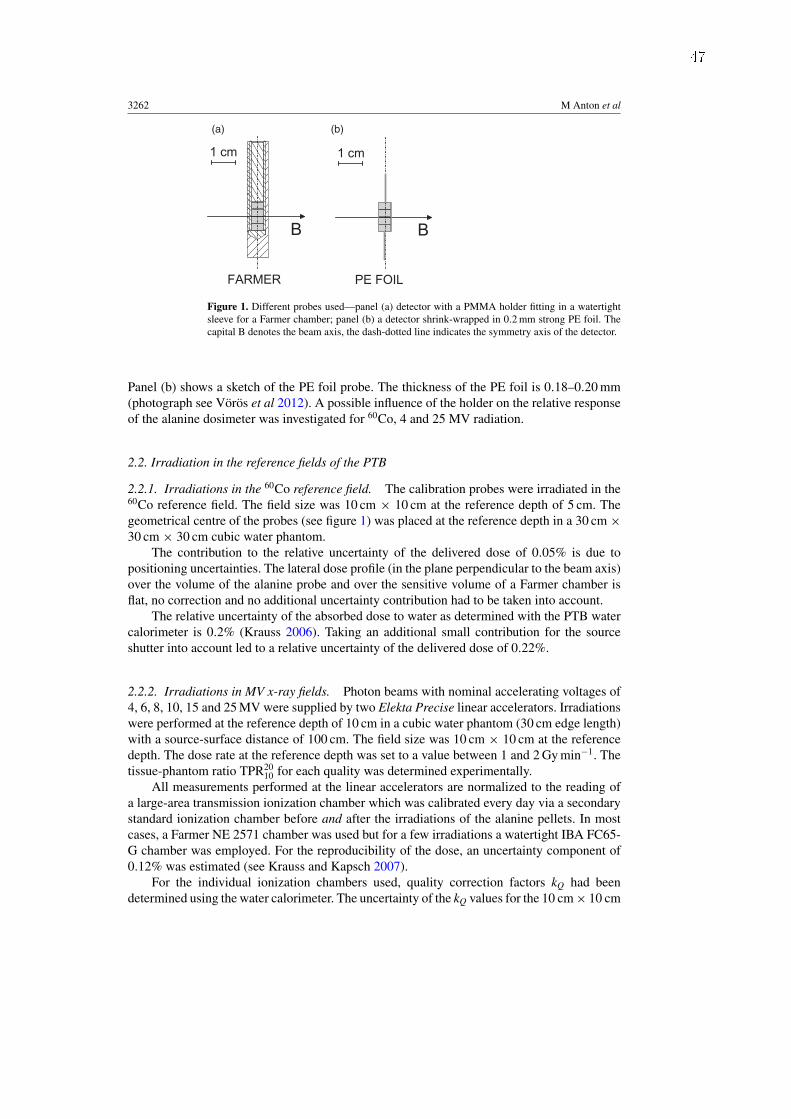
3262 M Anton et al
(b)(a)
Figure 1. Different probes used—panel (a) detector with a PMMA holder fitting in a watertightsleeve for a Farmer chamber; panel (b) a detector shrink-wrapped in 0.2 mm strong PE foil. Thecapital B denotes the beam axis, the dash-dotted line indicates the symmetry axis of the detector.
Panel (b) shows a sketch of the PE foil probe. The thickness of the PE foil is 0.18–0.20 mm(photograph see Voros et al 2012). A possible influence of the holder on the relative responseof the alanine dosimeter was investigated for 60Co, 4 and 25 MV radiation.
2.2. Irradiation in the reference fields of the PTB
2.2.1. Irradiations in the 60Co reference field. The calibration probes were irradiated in the60Co reference field. The field size was 10 cm × 10 cm at the reference depth of 5 cm. Thegeometrical centre of the probes (see figure 1) was placed at the reference depth in a 30 cm ×30 cm × 30 cm cubic water phantom.
The contribution to the relative uncertainty of the delivered dose of 0.05% is due topositioning uncertainties. The lateral dose profile (in the plane perpendicular to the beam axis)over the volume of the alanine probe and over the sensitive volume of a Farmer chamber isflat, no correction and no additional uncertainty contribution had to be taken into account.
The relative uncertainty of the absorbed dose to water as determined with the PTB watercalorimeter is 0.2% (Krauss 2006). Taking an additional small contribution for the sourceshutter into account led to a relative uncertainty of the delivered dose of 0.22%.
2.2.2. Irradiations in MV x-ray fields. Photon beams with nominal accelerating voltages of4, 6, 8, 10, 15 and 25 MV were supplied by two Elekta Precise linear accelerators. Irradiationswere performed at the reference depth of 10 cm in a cubic water phantom (30 cm edge length)with a source-surface distance of 100 cm. The field size was 10 cm × 10 cm at the referencedepth. The dose rate at the reference depth was set to a value between 1 and 2 Gy min−1. Thetissue-phantom ratio TPR20
10 for each quality was determined experimentally.All measurements performed at the linear accelerators are normalized to the reading of
a large-area transmission ionization chamber which was calibrated every day via a secondarystandard ionization chamber before and after the irradiations of the alanine pellets. In mostcases, a Farmer NE 2571 chamber was used but for a few irradiations a watertight IBA FC65-G chamber was employed. For the reproducibility of the dose, an uncertainty component of0.12% was estimated (see Krauss and Kapsch 2007).
For the individual ionization chambers used, quality correction factors kQ had beendetermined using the water calorimeter. The uncertainty of the kQ values for the 10 cm × 10 cm
47

Difference in the relative response of the alanine dosimeter to megavoltage x-ray and electron beams 3263
Table 2. Non-uniformity correction: ratio of dose averaged over the volume of the four alaninepellets to the dose averaged over the volume of a Farmer chamber.
MV Ddet/Dic u uindep
4 1.0009 0.0001 0.00096 1.0002 0.0003 0.00088 1.0008 0.0001 0.0009
10 0.9980 0.0002 0.001315 1.0000 0.0001 0.000825 0.9984 0.0002 0.0010
field is 0.31%5. The uncertainty of the 60Co calibration coefficient for the reference ionchambers NE 2571 and FC65-G is 0.25%.
For all MV beams used, the dose distribution in the reference depth in a plane verticalto the beam axis was measured. From these distributions, non-uniformity corrections werecalculated by numerical integration over the sensitive volume of the ionization chamber andthe alanine detector. The ratio Ddet/Dic of the dose integrated over the alanine detector Ddet
and over the ionization chamber Dic is listed in table 2. The absorbed dose as determined bythe ionization chamber has to be multiplied by that ratio in order to obtain the absorbed dosefor the alanine detector.
The uncertainty of this correction, due to positioning uncertainties of the probes, wasdetermined using Monte Carlo methods. A positioning uncertainty of 1 mm in both directionsperpendicular to the beam axis was assumed. The column u lists the resulting uncertainty ofDdet/Dic for the usual case when both chamber and alanine were irradiated in the same sleeve.The column uindep is required for the single case (15 MV, hl15 of 2012-01-26 in table A4)when ionization chamber and alanine were positioned independently, hence the index indep.
The uncertainty contribution from the depth determination was comparable to the one forthe 60Co field due to similar gradients of the depth dose curves.
2.2.3. Irradiation temperature. The irradiation temperature is an important influence quantityfor alanine dosimetry and was registered with an uncertainty of 0.1 ◦C. Since it was onlypossible to measure the temperature of the surrounding water, a time delay of 10 min isusually inserted between the placing of the detector in the water and the beginning of theirradiation. For the measurements in the cobalt reference field and at the accelerators twodifferent sensors were used.
2.3. ESR measurements and analysis
ESR measurements were performed usually one or two weeks after irradiation, using a BrukerEMX 1327 ESR spectrometer, with an 8′′ magnet and an X-band microwave bridge. Thehigh-sensitivity resonator ER 4119 HS was used throughout. The measurement parametersare listed in a previous publication (Anton 2006), which also contains a detailed descriptionof the hardware and the evaluation method.
To a measured spectrum—which contains the signal contributions from both the irradiatedalanine (ala) and from a reference substance (ref)—two base functions are fitted, therebyyielding the corresponding coefficients Aala and Aref. The base functions, one containing
5 These results remain to be published in a separate paper. A similar uncertainty budget is detailed in the publicationcited above (Krauss and Kapsch 2007), but for the kQ-factors determined at the PTB’s former linear accelerator.
48
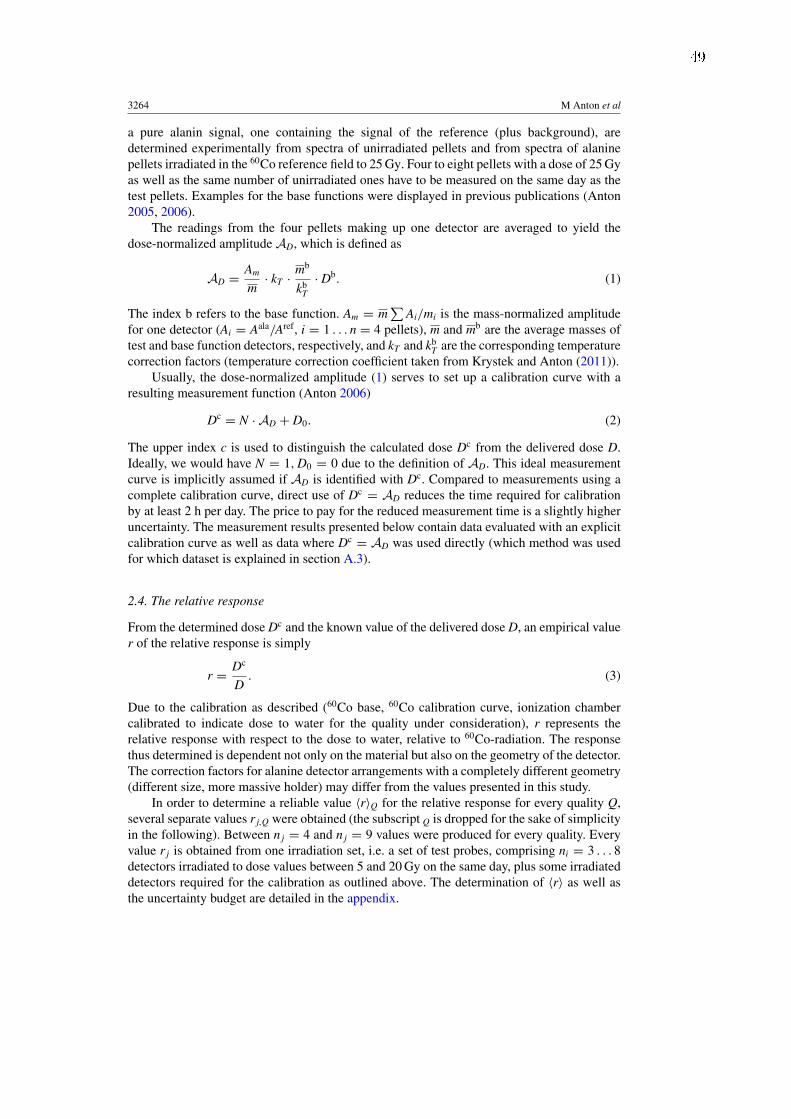
3264 M Anton et al
a pure alanin signal, one containing the signal of the reference (plus background), aredetermined experimentally from spectra of unirradiated pellets and from spectra of alaninepellets irradiated in the 60Co reference field to 25 Gy. Four to eight pellets with a dose of 25 Gyas well as the same number of unirradiated ones have to be measured on the same day as thetest pellets. Examples for the base functions were displayed in previous publications (Anton2005, 2006).
The readings from the four pellets making up one detector are averaged to yield thedose-normalized amplitude AD, which is defined as
AD = Am
m· kT · mb
kbT
· Db. (1)
The index b refers to the base function. Am = m∑
Ai/mi is the mass-normalized amplitudefor one detector (Ai = Aala/Aref, i = 1 . . . n = 4 pellets), m and mb are the average masses oftest and base function detectors, respectively, and kT and kb
T are the corresponding temperaturecorrection factors (temperature correction coefficient taken from Krystek and Anton (2011)).
Usually, the dose-normalized amplitude (1) serves to set up a calibration curve with aresulting measurement function (Anton 2006)
Dc = N · AD + D0. (2)
The upper index c is used to distinguish the calculated dose Dc from the delivered dose D.Ideally, we would have N = 1, D0 = 0 due to the definition of AD. This ideal measurementcurve is implicitly assumed if AD is identified with Dc. Compared to measurements using acomplete calibration curve, direct use of Dc = AD reduces the time required for calibrationby at least 2 h per day. The price to pay for the reduced measurement time is a slightly higheruncertainty. The measurement results presented below contain data evaluated with an explicitcalibration curve as well as data where Dc = AD was used directly (which method was usedfor which dataset is explained in section A.3).
2.4. The relative response
From the determined dose Dc and the known value of the delivered dose D, an empirical valuer of the relative response is simply
r = Dc
D. (3)
Due to the calibration as described (60Co base, 60Co calibration curve, ionization chambercalibrated to indicate dose to water for the quality under consideration), r represents therelative response with respect to the dose to water, relative to 60Co-radiation. The responsethus determined is dependent not only on the material but also on the geometry of the detector.The correction factors for alanine detector arrangements with a completely different geometry(different size, more massive holder) may differ from the values presented in this study.
In order to determine a reliable value 〈r〉Q for the relative response for every quality Q,several separate values r j,Q were obtained (the subscript Q is dropped for the sake of simplicityin the following). Between n j = 4 and n j = 9 values were produced for every quality. Everyvalue r j is obtained from one irradiation set, i.e. a set of test probes, comprising ni = 3 . . . 8detectors irradiated to dose values between 5 and 20 Gy on the same day, plus some irradiateddetectors required for the calibration as outlined above. The determination of 〈r〉 as well asthe uncertainty budget are detailed in the appendix.
49

Difference in the relative response of the alanine dosimeter to megavoltage x-ray and electron beams 3265
Table 3. Relative response of alanine to MV x-rays. Columns from left to right: nominal acceleratingvoltage in MV; tissue-phantom ratio TPR20
10; dose-to-water response relative to 60Co-radiation 〈r〉;the uncertainty component u or umod from (A.1) or (A.6) (see appendix), the combined uncertaintyu(〈r〉 ) including the uncertainties of the calibration factor and kQ for the ionization chambers;square sum of residuals q2 from (A.5); number of datasets n j; finally whether the q2 criterion wassatisfied.
MV TPR2010 〈r〉 u or umod u(〈r〉) q2 nj q2 < nj − 1?
4 0.638 0.9953 0.0010 0.0036 2 4 y6 0.683 0.9970 0.0007 0.0035 6.5 9 y8 0.714 0.9958 0.0022 0.0041 9.8 5 n
(2008 rev.) 8 0.716 0.9959 0.0022 0.0041 4.8 4 n10 0.733 0.9940 0.0011 0.0036 10.0 8 n15 0.760 0.9890 0.0011 0.0036 2.9 6 y
(2008 rev.) 16 0.762 0.9908 0.0010 0.0035 0.1 4 y25 0.799 0.9893 0.0012 0.0036 7.9 7 n
3. Results and discussion
3.1. Experimental results
The results of each individual irradiation and measurement set j are listed in tables A3 andA4 of section A.3. The final result 〈r〉, the relative response averaged over all n j data setsobtained for a specific quality, is shown in table 3. The leftmost column lists the nominalaccelerating voltage in MV, the following column represents the tissue-phantom ratio TPR20
10.The third column contains 〈r〉, the following column lists u or umod according to equations(A.4) and (A.6), respectively. The combined uncertainty u(〈r〉) contains also the uncertainty ofthe calibration of the ionization chamber and the uncertainty of the quality correction factorskQ for each quality. The values of the parameter q2 (A.5) and the number of datasets n j aredisplayed in the following columns, the rightmost column indicates whether the consistencycriterion according to (A.5) was satisfied (y) or not (n). If not, umod according to equation(A.6) was used instead of u from (A.4) as the uncertainty of the weighted mean, which wasthe case for 8, 10 and 25 MV6. Only for 8 MV umod was significantly larger than u. However,the effect is not dramatic for the overall uncertainty u(〈r〉).
In addition to the new measurements, the results that had been published earlier (Antonet al 2008) had to be revised. They are also contained in table 3 and labelled (2008 rev.). Thereis no change in the old 8 MV data, the published value was 0.9959 which is identical to therevised result. The uncertainty turned out to be higher than previously published, the new valueis 0.0041 whereas the published value was 0.0028. One of the main reasons for this increase isthat the uncertainty contributions from the intrabatch homogeneity and the calibration factorof the ionization chamber had been erroneously omitted. The situation is more dramatic for the16 MV data, the response changed from the published value 0.9967 ± 0.0027 to the revisedvalue of 0.9908 ± 0.0035. The value of the published 16 MV response was in error, due to anincorrect conversion factor that had been used. The reasons for the modified uncertainty arethe same as for the 8 MV value.
The data from table 3 are displayed in figure 2 as a function of the tissue-phantom ratio.The reference, 60Co-radiation, is represented by the filled circle. Filled triangles indicate the
6 This was already the case for the 8 MV data published earlier (Anton et al 2008). There is still no evidence as towhich of the uncertainty components might be underestimated. A significant amount of work was invested in testingdifferent options. Reporting all these attempts to identify the unknown source(s) would be outside the scope of thispublication.
50

3266 M Anton et al
0.55 0.6 0.65 0.7 0.75 0.8 0.850.98
0.985
0.99
0.995
1
1.005
TPR1020
< r
>
60−CoPTB fitPTB newPTB 2008 rev
Figure 2. The relative response 〈r〉 and its uncertainty as a function of TPR2010. The reference 60Co
is indicated by the filled circle, the new data are represented by the filled triangles. The revisedvalues of our 2008 data are added as open triangles. The fit curve is only shown to guide the eyeand for later comparisons.
Table 4. Mean ratio RPE,Farmer as defined in (4) and its uncertainty for three different radiationqualities Q.
Q RPE,Farmer u(RPE,Farmer)
60Co 0.9997 0.00164 MV 0.9993 0.001925 MV 1.0014 0.0018
new values, open triangles represent the revised 2008 data. The error bars correspond tou(〈r〉) according to table 3. A parabolic curve which was obtained by a least-squares fit tothe data is also shown, only to guide the eye. For the lower energies, the response valuesare consistent with the recommendation of Sharpe while the value for the highest energy isinterestingly similar to the value obtained for the response to high-energy (MeV) electrons(Voros et al 2012).
3.2. Comparison of different holders
For three qualities, namely 60Co, 4 and 25 MV, several detectors were irradiated with dosesbetween 10 Gy and 25 Gy, but in two different holders. One was the Farmer holder with a wallthickness of 2 mm, the other one was a shrink-wrapping with 0.2 mm PE (see figure 1). Aweighted mean 〈 AD/D〉 was calculated for three to four detectors per holder and quality. Theuncertainties have been estimated as described in the appendix. The results are summarized intable 4: for each quality the mean ratio
RPE,Farmer = 〈AD/D〉PE
〈AD/D〉Farmer(4)
and its uncertainty are given for the three qualities under consideration.
51

Difference in the relative response of the alanine dosimeter to megavoltage x-ray and electron beams 3267
0.55 0.6 0.65 0.7 0.75 0.8 0.850.98
0.985
0.99
0.995
1
1.005
TPR1020
< r
>
60−CoPTB fitSharpe 2006Bergstrand 2003Zeng 2004
Figure 3. The relative response and its uncertainty as a function of TPR2010. The reference 60Co is
indicated by the filled circle. For the sake of clarity, the new PTB data are represented by the fitcurve only. Open triangles: NPL, Sharpe (2006) with only approximate TPR values; filled triangles:Bergstrand et al (2003); open squares: Zeng et al (2004).
Within the limits of uncertainty, no influence of the holder can be discerned. Since the PEfoil probe is a very good approximation to using the alanine detector without any holder at all,we concluded that it would be justified to neglect the holder in the Monte Carlo simulations(see section 4). This conclusion may not be valid if a more massive holder (i.e. wall thickness>2 mm) were to be used, although McEwen et al (2006) showed that no holder effect wasseen in MeV electron fields for sleeve thicknesses up to 4 mm .
3.3. Comparison to other experimental data
For the sake of clarity, the fit curve shown in figure 2 is also used to compare the new resultsto the results of other authors. In figure 3, published data by Bergstrand et al (2003), Zenget al (2004) and by Sharpe (2006) are displayed.
The data from Bergstrand et al, which are indicated by the filled triangles, show a trendwhich is just the inverse of what our new measurements seem to indicate, albeit with thelargest uncertainties. The NRC data from Zeng et al which are indicated by the open squaresand the NPL data which are represented by the open triangles are consistent with the proposalby Sharpe (2006) to use a constant, energy independent response of 0.994 for the whole rangeof MV therapy qualities.
3.4. NRC—new data and revised results
The systematic nature of the deviation between the new PTB data and those presented in theliterature—increasing to ≈0.6% at 25 MV—is grounds for further investigation. Therefore,alanine pellets were irradiated by NRC in the spring of 2012 and evaluated by PTB. The dataset comprised four sets of test detectors, one for 60Co-irradiation and one for each of the threenominal voltages of 6, 10 and 25 MV that are available at the NRC’s Elekta Precise accelerator.Irradiations at NRC were carried out in a similar way as at PTB using a watertight PMMAsleeve for the detector, i.e. a stack of four pellets. For each quality, ni = 3 to ni = 4 detectors
52

3268 M Anton et al
0.55 0.6 0.65 0.7 0.75 0.8 0.850.98
0.985
0.99
0.995
1
1.005
1.01
TPR1020
< r
>
60−CoPTBZeng 2004 revNRC 2012
Figure 4. The relative response and its uncertainty as a function of TPR2010. The reference 60Co is
indicated by the filled circle. The PTB data are represented by the open triangles. The data obtainedusing probes irradiated at NRC and evaluated at PTB are represented by the open squares. Therevised data from Zeng et al (2004) are shown as filled triangles. Error bars indicate the standarduncertainties including the primary standard(s).
Table 5. Relative response values for alanine detectors irradiated at NRC in May 2012 and analysedat PTB.
Quality TPR2010 ni nc r j u(r j)
60Co 0.572 4 5 0.9999 0.00476 MV 0.681 4 5 0.9901 0.004810 MV 0.730 3 5 0.9901 0.004825 MV 0.796 3 5 0.9830 0.0048
were irradiated with doses of approximately 10, 15 and 20 Gy. Doses were derived from areference ionization chamber calibrated against the NRC primary standard water calorimeter.
Evaluation and analysis were carried out as outlined above. The results are summarizedin table 5. The leftmost column lists the quality. In the next column, the tissue-phantom ratiois given, and ni and nc are the number of test- and calibration detectors. The uncertaintieswere determined as explained in the appendix. They are slightly higher than for the data whereirradiation and analysis were both carried out at PTB because two different primary standardsare now involved.
From the key comparison BIPM.RI(I)-K4 (absorbed dose to water, primary standards) itwas expected that the 60Co-irradiated probes would exhibit a slightly lower signal if evaluatedwith calibration probes irradiated at PTB (to be precise, a difference of 0.19% was expected).Indeed, the dose ratio (r j = 0.9999) was consistent with this value within the combinedstandard uncertainty of 0.47%.
The MV data tabulated in table 5 are displayed in figure 4 as open squares. All responsevalues lie below the PTB data for the corresponding qualities which are displayed as opentriangles. There is no significant contradiction in view of the uncertainties. If the data in table 5are compared to the corresponding data in tables A3 and A4, only for 6 MV, the measuredvalue is outside the range of observations at PTB, but still within the limits of uncertainty.Surprisingly the NRC value of r j is now less than the PTB value at all energies.
53

Difference in the relative response of the alanine dosimeter to megavoltage x-ray and electron beams 3269
Table 6. Relative response for alanine, values as published by Zeng et al (2004) and revised valuesusing new kQ corrections and uncertainties.
Published Revised
Quality TPR2010 〈r〉 ur in % 〈r〉 ur in %
60Co 0.572 1 16 MV 0.681 0.996 0.45 0.993 0.3010 MV 0.730 0.992 0.65 0.991 0.3025 MV 0.796 0.995 0.48 0.988 0.30
Due to this unexpected result, the data published by Zeng et al (2004) was revisited andit was found that different kQ data had been used for the reference ion chamber than had beenused for the 2012 irradiations. The high-precision kQ data presented in McEwen (2010) wasnot available at the time of the Zeng et al irradiations. The revised data are listed along with thepublished ones in table 6 and displayed as filled triangles in figure 4 (compare figure 3). Therevised values are shifted to slightly lower values. The most pronounced change is observed forthe 25 MV response which now agrees very well with the new PTB data. In summary, NRC andPTB data appear to agree better than expected from the published data alone. The somewhathigher deviation of the new set of measurements can not be considered a severe problem sincethe data are equivalent to just one r j measurement (according to the nomenclature defined inthe appendix) whereas the revised published data as well as the measurements presented inthis paper represent weighted averages 〈r〉 over at least 4 r j-values.
To complete this discussion, one should also consider the potential differences betweenthe NRC and PTB standards in high-energy linac beams, which could speak to the apparentdifference between the two laboratories indicated in figure 4. In the both the PTB and NRCirradiations, a calibrated NE2571 ion chamber was used to determine the dose delivered tothe alanine pellets and therefore there are a number of sources we can refer to in determiningthe NRC/PTB dose ratio. Aalbers et al (2008) collated kQ data from a larger number ofinvestigations (but not PTB) and showed that the NRC data were consistent with an unweightedfit of all data at the 0.2% level for 6, 10, and 25 MV beams. Muir et al (2011) analysedunpublished data from a large inter-laboratory comparison (including PTB) and showed againthat the NRC results were consistent with the global fit (figure 1 of that paper). Although theother lab’s results were anonymous it can be seen that there are no significant outliers andtherefore one can conclude that the PTB and NRC results are consistent at the 0.3% level.A final comparison is possible through the recently-initiated BIPM.RI(I)-K6 program, whereeach laboratory’s dose standard is compared directly with the BIPM graphite calorimeter.Results for both NRC and PTB are available (Picard et al 2010, 2011) and these indicateagreement between the two laboratories within the stated uncertainties. Combining theseresults one can conclude that the data represented in figure 4 are not sensitive at the 0.3% levelto the specific primary standards operated at the two laboratories.
4. Monte Carlo simulations
The apparent decrease in the relative response of alanine for TPR2010 > 0.72 was unexpected
and the literature, based on either Monte Carlo or experimental results (Zeng et al 2004, Anton2006), provided no satisfactory explanation. However, the fact that the asymptotic value of theresponse for higher energies approaches the one observed for electrons gave a hint towards a
54

3270 M Anton et al
possible explanation: Zeng et al (2005) stated in their publication on the relative response ofalanine to MeV electron radiation that it was necessary to take the density correction for thecrystalline alanine into account. This is justified by the fact that the interactions which producethe free radicals necessarily take place within the alanine microcrystals. In the publication byVoros et al (2012), the density correction for crystalline alanine was also successfully appliedbut was not explicitly mentioned.
The simulations presented in this work were carried out at the Institut fur MedizinischePhysik und Strahlenschutz-IMPS (University of Applied Sciences Giessen-Friedberg,Germany) using the EGSnrc package with the user code DOSRZnrc (Kawrakow 2000,Kawrakow et al 2010). With DOSRZnrc, the geometry is simplified assuming cylindricalsymmetry about the beam axis. The dose scoring volume with a radius and a depth of 5 mm,representing the alanine detector, was placed inside a cylindrical water phantom with a radiusof 20 cm and a depth of 30 cm. The geometrical centre of the scoring volume was placed 5 cmbehind the phantom surface for the 60Co simulations and 10 cm behind the surface for the MVx-rays. Parallel beams were assumed for the simulation.
For the 60Co reference field, the spectrum was obtained from a MC simulation, taking therealistic geometry of the irradiation source and its surroundings into account. A BEAMnrc(Rogers et al 2004) simulation carried out at PTB of one of the Elekta accelerators providedthe spectra for 6 and 10 MV. For 8 and 16 MV, published spectra had been modified toreproduce the experimental depth dose curves (see Anton et al 2008). For the 25 MV beam, aspectrum published by Sheikh-Bagheri and Rogers (2002) was used. For 4 MV, no spectrumwas available.
4.1. Simulation of the relative response
For each of the qualities 60Co, 6, 8, 10, 16 and 25 MV, the calculation was carried out threetimes: the first one for a dose scoring volume made of water to obtain DW; the second and thirdone with a dose scoring volume consisting of a homogeneous mixture of the atomic constituentsof the alanine/paraffin pellets, in order to obtain Dala. Two separate sets for Dala were obtained,one taking the density correction for crystalline alanine into account, the other one usinga density correction for the bulk density of the pellets. The calculations were performedwith threshold/cut-off energies for the particle transport set to ECUT = AE = 521 keV andPCUT = AP = 1 keV and continued until a preselected statistical uncertainty was achieved.For the other parameters of the simulation, the default settings of DOSRZnrc were used. Foreach quality, the ratio(s) Dala/DW were then calculated and referred to the corresponding ratiofor 60Co, i.e. rMC
Q , the simulated dose-to water response for the quality Q, relative to 60Co, isgiven as
rMCQ = (Dala/DW)Q
(Dala/DW)Co. (5)
The results are displayed in figure 5 along with the previously-shown fit curve to thenew PTB data. The results of the DOSRZnrc simulation with the density correction for thebulk density are represented by the open circles whereas the results obtained using the densitycorrection for the crystalline alanine are displayed as filled squares. The error bars indicate thestatistical uncertainties. TPR20
10 values were obtained from simulated depth-dose curves. Thedata obtained using the bulk density correction are approximately unity and inconsistent withany published experimental results. Within the limits of uncertainty, simulated data using thecrystalline alanine density corrections and measured data agree very well. Although this hadbeen pointed out by Zeng et al (2005) for MeV electrons already, this finding is new for MVx-rays.
55

Difference in the relative response of the alanine dosimeter to megavoltage x-ray and electron beams 3271
0.55 0.6 0.65 0.7 0.75 0.8 0.850.98
0.985
0.99
0.995
1
1.005
TPR1020
< r
>
60−CoPTB fitDOSRZnrc bulkDOSRZnrc crys
Figure 5. The relative response and its uncertainty as a function of TPR2010. The reference 60Co is
indicated by the filled circle. The measured data are represented by the continuous fit curve. MCresults obtained using the bulk density correction are shown as open circles, the results obtainedusing the density correction for crystalline alanine are indicated by the filled squares. The errorbars represent the statistical uncertainties.
4.2. Further considerations concerning the possible energy dependence
With the aim to understand the apparent decrease of the relative response of the alaninedosimeter with increasing photon energy, further investigations were made using the MCmethod.
From the photon spectra that were used for the MC simulations, the spectra in 5 cmdepth (Co) and in 10 cm depth (MV x-rays) were calculated using the absorption coefficientscompiled and published by the National Institute of Standards and Technology (NIST,USA) based on the publications by Seltzer (1993) and Hubbell (1982). From the attenuatedspectra, the average mass energy absorption ratios for alanine and water were determined.The (μen/ρ)ala,W -ratio is listed in table 8 and displayed in figure 6 as a function of TPR20
10(filled circles). With the help of the user codes SPRRZnrc and FLURZnrc from the EGSnrcpackage, the stopping power ratios sala,W and the mean electron energies Eav in water werealso calculated. In table 8 and figure 6, two sets of data for sala,W are supplied, one using thedensity correction for the crystalline alanine (designated by crystal) the second one using thebulk density of the pellets (designated by bulk). The latter are indicated by the open trianglesin figure 6, the former are displayed as filled triangles. From the mean secondary electronenergy Eav listed in table 8, the corresponding electron ranges in the continuous slowing downapproximation (CSDA) for the medium water and for alanine (using the same value for themean energy) were obtained using the NIST/ESTAR database (Berger et al 2005) available atthe web site of NIST7. The CSDA ranges are also given in table 8, converted from g cm−2 tocm using the density of water and of alanine (1 and 1.4 g cm−3, respectively).
Finally, we repeated the DOSRZnrc calculation with alanine (crystalline densitycorrection) and with water as a detector material, but with the parameter ECUT set to a valuelarger than the maximal photon energy outside the detector volume. This means all electrons
7 The stopping powers obtained from the NIST/ESTAR database as well as the density corrections in the EGSnrcsoftware are calculated according to ICRU Report 37 (ICRU 1984).
56

3272 M Anton et al
0.55 0.6 0.65 0.7 0.75 0.80.94
0.95
0.96
0.97
0.98
0.99
1
TPR1020
ratio
(μen
/ρ)ala,W
sala,W
crys
sala,W
bulk
Figure 6. Ratios of mass-energy-absorption coefficients and stopping power ratios for alanine andwater. Filled circles: (μen/ρ)ala,W ; filled triangles: sala,W , density correction for crystalline alanine;open triangles: sala,W , density correction for bulk density of the pellet. Lines are shown to guidethe eye.
generated outside are not transported and therefore cannot enter the detector volume. We thencalculated the ratio of the absorbed dose inside the scoring volume with ECUT = 521 keVinside and with ECUT larger than the maximal photon energy on the outside to the absorbeddose with ECUT = 521 keV everywhere (see the results from the previous section). Thisyielded the fraction of the absorbed dose which is due to the secondary electrons generatedby photon interactions inside the detector. This fraction is denoted as fγ in table 8. The valueslisted are average values for alanine and water as a detector material. For 60Co-radiation,76% of the dose to the detector are due to secondary electrons that were generated by photonabsorption inside the detector volume whereas for the highest energies about 80% of the doseare due to secondary electrons generated outside the detector volume. Speaking in terms ofBragg–Gray theory, the alanine probe becomes an electron probe for the highest voltages.Thus, for the higher energies the relative response should be determined almost exclusivelyby the stopping power ratio sala,W and it should approach the value for electrons, which is thecase for the experimental data as well as for the simulated ones.
In addition to the photon qualities investigated, the corresponding relevant parameterswere also determined for two electron beams with maximum energies of 6 MeV and 18 MeV,using spectra published by Ding et al (1995). The parameters obtained for the two electronbeams confirm the transition to an electron detector for the higher photon energies as mentionedabove, as can be seen by comparing the data in table 8 and in figure 7.
However, it is important to keep in mind that the response thus determined is dependentnot only on the material but also on the geometry of the detector. The correction factors foralanine detector arrangements with a completely different geometry (e.g. for much largerdetectors or for alanine film dosimeters) may differ from the values presented in this study.
From figure 6 two important facts can be immediately deduced: first, both the (μen/ρ)ala,W -ratio as well as the stopping power ratio sala,W for the crystalline alanine density correctiondecrease by approximately 1% between 60Co and 25 MV. Therefore, the observed decreaseof the relative response should not be so surprising after all. Second, if we take the ratio as
57

Difference in the relative response of the alanine dosimeter to megavoltage x-ray and electron beams 3273
0 1 2 3 40.975
0.98
0.985
0.99
0.995
1
1.005
CSDA range (alanine) in cm
r
exp γexp e−MC cryss
ala,w crys
Figure 7. Relative response as a function of the CSDA range in alanine with a density of 1.4 g cm−3,in cm. Filled circles with error bars: experimental data, this work; open circles with error bars: Voroset al (2012) for electrons; filled triangles: MC simulation with density correction for crystallinealanine; open triangles: stopping power ratios sala,W relative to cobalt, density correction forcrystalline alanine.
Table 7. Monte Carlo simulation using DOSRZnrc: for each quality Q the tissue-phantom ratioTPR20
10 is given along with the simulation results, the ratio Dala/DW of the dose to alanine to thedose to water, its relative (statistical) uncertainty and the resulting value of rMC
Q . The left block ofdata was obtained using the density of crystalline alanine for the density correction, the right blockwas obtained using the bulk density of the pellets.
Density of crystalline alanine Density of pellet bulk
Q TPR2010 Dala/DW ur in % rMC
Q u(rMCQ ) Dala/DW ur in % rMC
Q u(rMCQ )
60Co 0.567 0.9735 0.14 0.9749 0.146 MV 0.660 0.9684 0.30 0.9948 0.0032 0.9760 0.30 1.0011 0.00338 MV 0.716 0.9675 0.25 0.9938 0.0029 0.9779 0.26 1.0030 0.002910 MV 0.733 0.9649 0.23 0.9911 0.0027 0.9739 0.23 0.9989 0.002716 MV 0.762 0.9643 0.21 0.9906 0.0024 0.9737 0.21 0.9988 0.002525 MV 0.793 0.9625 0.18 0.9888 0.0022 0.9759 0.18 1.0010 0.0022
approximations to Dala/Dw, both (μen/ρ)ala,W and sala,W values for cobalt are very close tothe Dala/Dw from the MC simulation, as can be seen from table 7. The stopping power ratioobtained using the bulk density correction is more than 2% too high, furthermore the decreasewith increasing energy is weaker than for the crystalline density correction. This underlinesthe conclusion from the previous section that for simulations of the response of the alaninedosimeter to MV x-rays, the use of the density correction for crystalline alanine is absolutelyessential.
In figure 7 the relative response is displayed as a function of the CSDA range (in alanine)from table 8. Experimental photon data are represented by filled circles with error bars. Twovalues for electrons have been added, the experimental data are from Voros et al (2012): the6 MeV point was directly measured, the 18 MeV point is interpolated between the 16 MeVand the 20 MeV measurements from the cited paper. The experimental electron data are shownas open circles with error bars. The results of the MC simulation are represented by the filled
58

3274 M Anton et al
Table 8. Some parameters for the simulated radiation qualities: ratio of mass-energy absorptioncoefficients (μen/ρ)ala,W ; stopping power ratios sala,W obtained from SPRRZnrc using the twodifferent density corrections (pellet bulk density and density of crystalline alanine); mean energyEav of the secondary electrons obtained from the electron fluence spectrum using FLURZnrc anda water detector; the CSDA range in water and alanine for the given mean energies; finally thefraction fγ of the dose due to photon interactions inside the detector volume.
CSDA rangesala,W sala,W Eav water ala
Q TPR2010 ( μen
ρ)ala,W crystal bulk MeV in cm fγ
60Co 0.572 0.971 0.980 0.996 0.4 0.13 0.09 0.766 MV 0.683 0.968 0.975 0.993 1.0 0.44 0.32 0.468 MV 0.716 0.967 0.974 0.993 1.3 0.60 0.44 0.3810 MV 0.733 0.966 0.973 0.993 1.5 0.71 0.52 0.3416 MV 0.762 0.962 0.972 0.992 2.0 0.98 0.73 0.2725 MV 0.799 0.958 0.971 0.992 2.8 1.41 1.04 0.19
6 MeV – – 0.969 0.991 2.7 1.35 1.00 –18 MeV – – 0.969 0.990 6.6 3.35 2.49 –
triangles, the data are the same as in the previous section, with the crystalline alanine densitycorrection. In addition, the stopping power ratio sala,W relative to its value for 60Co radiationis also shown.
If the CSDA range is greater than two to three times the depth of the detector which isapproximately 0.5 cm, the relative response remains constant. The ratio of the stopping powerratios for both electron energies to the stopping power ratio for cobalt radiation is 0.988 (fromtable 8), which is identical to the average value for the relative response published by Voroset al (2012).
As a conclusion, it may be stated that the energy dependence of the alanine dosimeter canbe understood from the well known ratios of the mass energy absorption coefficients and thestopping power ratios for alanine and water, provided the density correction for the crystallinealanine is taken into account.
5. Summary and outlook
In order to increase the usefulness of the alanine dosimeter as a tool for quality assurancemeasurements in radiotherapy using MV x-rays, the response with respect to the dose towater needs to be known accurately. This quantity was determined relative to the referencequality 60Co for six different qualities, namely 4, 6, 8, 10, 15 and 25 MV x-rays from clinicalaccelerators. The measurement series was motivated by the availability of new kQ factors forionization chambers with an uncertainty of 0.31% obtained from calorimetric measurements.
The measurement results seem to favour a slow decrease of the relative response fromapproximately 0.996 for the lower energies to 0.989 for the highest energy, 25 MV. Therelative uncertainty achieved varies between 0.35% and 0.41%. The modified uncertaintybudget, necessitated by new evidence as well as by a slight change in methodology is detailedin the appendix. The measured data and their uncertainties would be consistent with theassumption of an energy independent relative response of 0.993, which is in accordance withthe results published by other authors. However, there are some arguments in favour of a slowdecrease as observed.
59

Difference in the relative response of the alanine dosimeter to megavoltage x-ray and electron beams 3275
Published data from NRC (Zeng et al 2004) have been revised using more recentlyavailable new kQ values determined at the NRC with a lower uncertainty (McEwen 2010). Therevised results agree very well with the measurement results from PTB, i.e. they also exhibita slow decrease with increasing energy instead of remaining constant.
Monte Carlo simulations using a density correction for crystalline alanine yielded verygood agreement between measured and simulated response data. This is not the case if thedensity correction for the bulk density of the pellet is used, as was demonstrated previouslyby Zeng et al (2005) for MeV electron radiation and confirmed by the results of Voros et al(2012). This is a new result for megavoltage x-rays.
The relative response for 25 MV agrees within 0.1% with the measured and the simulatedvalue of 0.988 for MeV electrons (Voros et al 2012). This appears logical if one considersthat the fraction of the dose due to secondary electrons generated within the detector volumedecreases from 76% for 60Co to 19% for 25 MV x-rays, i.e. the alanine dosimeter is moreof a photon probe for 60Co but mainly an electron probe for 25 MV, speaking in terms ofBragg–Gray theory. The fraction was also determined using Monte Carlo simulation.
In fact two different quantities are contrasted if rMCQ is compared directly to the
experimental data 〈r〉: the MC simulation yields a ratio of absorbed dose values whereasthe experimental data are ratios of (detected) free radical concentrations. The ratios are equalif the free radical yield, i.e. the number of free radicals generated per absorbed dose, is equalfor all qualities under consideration. One could potentially combine the experimental and MCdata to determine a value for the free radical yield but the overall combined uncertainty wouldbe too large to make this a worthwhile exercise.
In summary, one may state that both the measured and the simulated data suggest thatthe dose-to-water response of the alanine dosimeter relative to 60Co radiation decreases from≈0.996 for the MV x-ray qualities with the lowest energies to a value almost equal to the relativeresponse to MeV electrons for the highest voltages. This behaviour is well understood in termsof the stopping power ratios or the ranges of the secondary electrons, provided the densitycorrection for the crystalline alanine is taken into account. Although, a pragmatic approachwould be to use an energy-independent correction factor of 1.007 for the difference between60Co and MV photons this discards the theoretical insight that there is a slow transition from aphoton detector to an electron detector. As noted earlier, for significantly different geometriesof detector this transition could be very different with no ‘simple’ offset observed.
While bridging the gap between MV photons and MeV electrons is a very interestingresult, some work remains to be done, especially concerning the response of the alaninedosimeter for the small fields employed in modern radiotherapy: the change of the radiationquality with field size may have an influence, as well as the material of the surroundings, ifone aims at the verification of treatment plans in anthropomorphic phantoms. However, thiswill be the subject of future studies.
Acknowledgments
We wish to thank T Hackel, D-M Boche, C Makowski, K-H Muhlbradt, M Schrader and OTappe (PTB) for their help during preparation, irradiation and measurements. We also thankJ Illemann (PTB) for providing the BEAM-simulations for the Elekta accelerator. Thanks aredue to M Krystek (PTB) for many helpful discussions as well as for having a critical eye onthe uncertainty budget. Thanks are also due to P Sharpe (NPL) for providing the NPL responsedata as well as for helpful discussions. Inspiring discussions with V Nagy (AFRRI, USA) arealso gratefully acknowledged. A part of the research presented here has received funding from
60

3276 M Anton et al
the European Commission (EC) according to the EC grant agreement no. 217257 from theSeventh Framework Programme, ERA-NET Plus.
Appendix. Uncertainty budgets and details on the experimental data
A.1. Definitions
For each specific irradiation set, a value r j is obtained using
r j =ni∑
i=1
w ji · r ji (A.1)
where r ji is the response obtained from the determined dose Dcji for one detector and the
corresponding delivered dose Dji according to (3). r j is the weighted mean (compare theappendix of Anton et al 2008) of the individual r ji. The weights are determined by theiruncertainties u(r ji), given by
w ji =(
u j
u(r ji)
)2
where u j =(
ni∑i=1
1
u2(r ji)
)−1/2
. (A.2)
From these data, 〈r〉 is obtained in a similar manner:
〈r〉 =n j∑
j=1
w jr j (A.3)
where r j is obtained from (A.1) and (A.2) and
w j =(
u
u(r j)
)2
and u =⎛⎝ n j∑
j=1
1
u2(r j)
⎞⎠
−1/2
. (A.4)
If the consistency criterion (see Anton et al 2008, Weise and Woger 1993)
q2 < n j − 1 where q2 =n j∑
j=1
(r j − 〈r〉
u(r j)
)2
(A.5)
is violated, e.g. if the uncertainties u(r j) are too small compared to the scatter of the individualvalues r j, a modified value umod has to be calculated. According to Dose (2003), umod is
u2mod = 〈 r2〉 − 〈r〉2
n j − 3, where 〈 r2〉 =
n j∑j=1
w jr2j , (A.6)
and w j given by (A.4). In case (A.5) is not fulfilled, umod replaces u as the uncertainty of theweighted mean < r > in the following uncertainty calculations. It has to be stressed that uj isonly a component of the combined uncertainty u(r j) and u or umod are only a component ofthe combined overall uncertainty of the final result.
A.2. Uncertainty budget
A.2.1. Uncertainty of the determined dose. At least three effects contribute to the uncertaintyof the mass normalized amplitude Am: the first one is the repeatability of the amplitudedetermination. For the chosen parameters and Db = 25 Gy, this corresponds to 40 mGy(= u(Ai) · Db) for a single pellet or 20 mGy for an average over 4 pellets (= u(Am) · Db). Thisvalue of u(Am) is independent of dose between 2 and 25 Gy. The second part is the variation of
61

Difference in the relative response of the alanine dosimeter to megavoltage x-ray and electron beams 3277
Table A1. Example uncertainty budget for Dc = AD for one test detector (four pellets) irradiated toa dose of 10 Gy. The left column contains a label which is referred to in the text, the middle columndescribes the source of the uncertainty, the right column lists the relative standard uncertaintycomponent in per cent.
Label Component ur in %
From test detector (n = 4 pellets):1a Am. Amplitude repeatability 0.202a Am. Individual background 0.103a Am. Intrabatch homogeneity 0.154 kT . Irradiation temperature 0.055 m. Average mass of n probes 0.05
Subtotal test detector 0.28
From base function (n = 4 pellets):1b Am. Amplitude repeatability 0.082b Am. Individual background 0.043b Am. Intrabatch homogeneity 0.156 kb
T . Irradiation temperature 0.057 mb. Average mass of n probes 0.05
Subtotal 0.198 Systematic component 0.15
Subtotal base function 0.24
9 Db. Repeatability of irradiation 0.05Db. Primary standard 0.22
Total 0.43
the individual background signal which amounts to approximately 20 mGy for a single pellet(Anton 2005). The third part is the intrabatch homogeneity, i.e. the variation of the alaninecontent within a certain batch (see column CV in table 1). The same estimates apply to thebase function amplitudes.
In table A1, an example of an uncertainty budget is given for one detector (4 pellets),irradiated to a dose of 10 Gy in the 60Co reference field and is valid for the case when nocalibration curve is constructed, i.e. assuming Dc = AD. The base functions were constructedfrom the spectra of one detector irradiated to 25 Gy and four unirradiated pellets as outlinedabove. For the higher doses, the relative uncertainty due to amplitude readout repeatabilitydecreases, u(Am) being constant. The limiting components are the intrabatch homogeneityand an additional systematic component of 0.15%. The latter was deduced from repetitivemeasurements of calibration and test data sets, where the dose calculated with and withoutusing a calibration line was compared to the known delivered dose. The non-systematiccomponent (subtotal) for the single base of 0.19% agrees very well with type A estimatesthat were used in previous publications (Anton 2006). If the base is constructed from spectraof two irradiated detectors and eight unirradiated pellets (double base), the subtotal for thenon-systematic part reduces from 0.19% to 0.14%.
Due to the time delay of less than one week between the irradiation of the calibrationprobes and the test probes, in all but one case fading corrections were negligible (see Anton2006, 2008).
The uncertainty of Dc determined with a calibration curve is calculated only from 1a, 2a,3a, 4 and 5 from table A1 using equation (16) from Anton (2006): all uncertainty components
62

3278 M Anton et al
5 10 15 200
0.5
1
1.5
D in Gy
u r in %
Dc = N ⋅ AD
+ D0
Dc = AD
Figure A1. Relative uncertainty of the determined dose Dc—excluding the primary standard—with(dash-dotted curve) and without using a calibration curve (continuous curve). The data are validfor a 25 Gy base, 60Co -irradiated detectors and a calibration line determined from four detectorswith doses of 5, 10, 15 and 20 Gy.
associated to the base function cancel if the same set of base functions is used to determine theamplitude for the test- and the calibration detectors. Different from earlier work, the parametersof the calibration curve are now obtained from a linear weighted total least squares fit (Krystekand Anton 2007) to nc data pairs (D,AD) (calibration data set).
The uncertainties with and without using a calibration curve, but excluding the primarystandard, are shown as a function of the delivered dose in the range between 2 Gy and 20 Gyin figure A1. The data for Dc = AD are represented by the continuous curve, the uncertaintyfor the determined dose using a calibration curve is displayed by the dash-dotted curve. Thedata are obtained using Db = 25 Gy and a calibration curve constructed from the amplitudesfor four detectors irradiated with doses of 5, 10, 15 and 20 Gy. All irradiations are assumed tobe carried out in the 60Co reference field.
It is notable that the uncertainty for Dc = AD is lower at the low-dose end of the doserange shown. The scatter of data points at the lower end of the calibration data set may lead tolarger variations of the slope and the y-axis intersection than the simple assumption of an idealcalibration curve with intersection zero and slope unity. This is still true within the range of thecalibration curve (D � 5 Gy). However, for D > 7 Gy, the results obtained using a calibrationcurve are more accurate.
A.2.2. Uncertainty of the relative response values r j. The variance u2(r ji) = u2(Dcji) +
u2(Dji) for each individual dose is obtained as follows: for Dcji, components 1a, 2a, 3a, 4
and 5 from table A1 have to be taken into account. For the delivered dose Dji, only thereproducibility for opening/closing the shutter (60Co) and the stability of the monitor (MVx-rays) are relevant at this stage. Using these components, the weighted mean values r j andthe uncertainty component uj are obtained.
An example is given in table A2 for ni = 4 (Dji ≈ 10, 12.5, 15 and 17.5 Gy). In the upperpart of the table, the left column shows the uncertainties u(r ji) in case no calibration curveis used (Dc = AD) whereas the right column shows the corresponding components in case a
63

Difference in the relative response of the alanine dosimeter to megavoltage x-ray and electron beams 3279
Table A2. Uncertainty budget for r j for a typical irradiation set j. Here, ni = 4 test doses ofapproximately 10, 12.5, 15 and 17.5 Gy were chosen. The budgets for an evaluation with Dc = AD
(left) and using a calibration curve (right) with data points at 5, 10, 15 and 20 Gy are compared.The subtotal u j/r j is obtained from (A.1) and (A.2).
Component ur in %
Dc = AD Calibration liner j1 (Dj1 ≈ 10 Gy) 0.28 0.32r j2 (Dj2 ≈ 12.5 Gy) 0.24 0.27r j3 (Dj3 ≈ 15 Gy) 0.22 0.25r j4 (Dj4 ≈ 17.5 Gy) 0.21 0.24
subtotal uj/r j 0.12 0.13
Base function 0.24 –Reproducibility DMV = Dji 0.12Reproducibility DCo 0.05kT (systematic part) 0.04
u(rj)/rj 0.30 0.19
calibration curve is used. In this example, a 60Co calibration curve with data points at 5, 10,15 and 20 Gy was used. The resulting relative value uj/r j from equations (A.1) and (A.2) isgiven for both cases (subtotal, printed in bold).
Where a calibration curve is not used, the uncertainty components for the base (1b, 2b,3b, 6, 7 and 8 from table A1) have to be included after the calculation of the weighted meanr j which yield another 0.24%.
For each irradiation set j, the positioning of the sleeve in the phantom which containsthe pellets and the ionization chamber for the irradiation of the test probes was made onlyonce, therefore this component for the uncertainty of Dji has to be added after calculating theweighted mean r j. A similar component associated with the reproducibility of the irradiationof calibration and base probes is also added after calculating the weighted mean becausethe whole set is usually irradiated without moving the sleeve. An uncertainty component forthe temperature correction due to a possible systematic deviation of 0.1 K between the twodifferent temperature sensors used at the Cobalt irradiation source and at the accelerator isincluded as well. Other components such as the uncertainty of the 60Co calibration factor ofthe ionization chamber have to be added only after calculating the weighted mean 〈r〉 (seenext section).
The example presented in table A2 is typical in the sense that the relative uncertainty ofr j is approximately 0.2% if a calibration curve is used and 0.3% for Dc = AD. Actual valuesvary slightly due to different sizes of test and calibration data sets. All results r j and theircorresponding uncertainties u(r j) are shown below in tables A3 and A4.
A.2.3. Uncertainty of the final result 〈r〉. The weighted mean values 〈r〉 were calculatedfrom n j = 4 up to n j = 9 values r j using (A.3) and (A.4). The values u(r j) listed in tablesA3 and A4 served to calculate the weights according to (A.4). In addition to the uncertaintycomponents u from equation (A.4) or umod from equation (A.6), the contributions from the60Co calibration of the ionization chamber and the kQ-factors have to be taken into account.The uncertainty of the primary standard of 0.2% cancels because the calibration factor for theionization chamber, the dose rate of the 60Co reference field and the kQ values were determinedusing the same calorimeter. The contributions to be added are finally ur(IC) = 0.15% for the
64

3280 M Anton et al
Table A3. Relative response r j for the irradiation sets investigated, 4 to 8 MV. Columns from leftto right: nominal accelerating voltage in MV, irradiation set label, date of measurement, numberof test detectors ni (1 detector = 4 pellets); number of calibration detectors nc; number of basedetectors nb; r j using equations (A.1) and (A.2); the uncertainty u(r j ), see section A.2.2 and theexample in table A2.
MV Set j Date ni nc nb r j u(r j)4 hl22 2012-03-22 4 4 1 0.9970 0.00204 hl22 2012-03-29 4 4 1 0.9959 0.00204 hl28 2012-06-26 4 5 1 0.9951 0.00204 hl31 2012-07-12 4 5 1 0.9931 0.0020
6 hf34 2008-06-11 5 5 1 0.9973 0.00196 hf37 2008-11-19 5 5 1 0.9974 0.00196 hj03 2009-01-30 5 5 1 0.9988 0.00196 hj05 2009-02-13 5 5 1 0.9988 0.00196 hj33 2010-10-05 6 – 2 0.9932 0.00336 hj37 2010-11-02 4 5 1 0.9938 0.00216 hj38 2010-11-18 4 – 2 0.9942 0.00306 hj45 2011-03-23 4 4 2 0.9967 0.00306 hj45 2011-03-31 4 5 1 0.9978 0.0021
8 hj31 2010-09-15 6 – 1 0.9908 0.00338 hj39 2010-12-14 8 – 1 0.9910 0.00338 hj49 2011-05-18 5 6 1 0.9954 0.00198 hl01 2011-06-22 5 6 1 0.9952 0.00188 hl22 2012-03-29 4 4 1 1.0004 0.0020
Table A4. Relative response r j for the irradiation sets investigated, 10 to 25 MV. Columns from leftto right: nominal accelerating voltage in MV, irradiation set label, date of measurement, numberof test detectors ni (1 detector = 4 pellets); number of calibration detectors nc; number of basedetectors nb; r j using equations (A.1) and (A.2); the uncertainty u(r j ), see section A.2.2 and theexample in table A2.
MV Set j Date ni nc nb r j u(r j)
10 hf34 2008-05-29 4 4 1 0.9943 0.002110 hf36 2008-07-22 5 5 1 0.9954 0.005210 hf37 2008-11-13 5 5 1 0.9939 0.001910 hj03 2008-12-16 5 5 1 0.9929 0.001910 hj07 2009-03-12 6 5 1 0.9937 0.001910 hj41 2011-01-06 4 5 1 0.9897 0.002110 hj45 2011-03-23 4 – 2 0.9958 0.003010 hj45 2011-03-30 4 6 1 0.9987 0.0021
15 hl15 2012-01-24 6 – 2 0.9915 0.002715 hl15 2012-01-26 3 – 2 0.9900 0.002815 hl15 2012-01-26 3 – 2 0.9899 0.002915 hl16 2012-02-09 6 – 1 0.9880 0.002915 hl16 2012-02-14 6 – 1 0.9901 0.003015 hl20 2012-03-02 3 4 1 0.9864 0.0021
25 hj29 2010-08-18 6 – 2 0.9860 0.002925 hj32 2010-09-29 8 – 1 0.9921 0.003325 hj34 2010-10-13 8 – 1 0.9935 0.003325 hj49 2011-05-17 5 6 1 0.9918 0.001925 hl01 2011-06-17 5 6 1 0.9867 0.001825 hl03 2011-08-09 4 6 1 0.9883 0.001925 hl09 2011-11-02 3 – 2 0.9906 0.0028
65

Difference in the relative response of the alanine dosimeter to megavoltage x-ray and electron beams 3281
calibration factors and ur(kQ) = 0.31% for the quality correction factors of the ionizationchamber(s).
A.3. Details of the experimental results
The results of each individual irradiation and measurement set j are listed in tables A3 andA4. The first column lists the nominal accelerating voltage in MV, the second one a labelattached to each irradiation set8 and the third column contains the date of measurement. Thefollowing three columns describe the size of the dataset: ni is the number of test detectorsirradiated in the MV x-ray field. Their doses are always interspersed between the lowest andthe highest dose of the calibration set. The latter consisted of nc probes with doses between 5and 25 Gy. nb is the number of base detectors. nb = 2 means that there were spectra from twoirradiated detectors and eight unirradiated pellets used to construct the base functions. Theindividual relative response values r j are listed in the following column and were obtainedusing equations (A.1) and (A.2). The uncertainties of these values are denoted as u(r j) and arelisted in the rightmost column. The calculation of these values is described in section A.2.2,an example is given in table A2.
With a calibration curve, the uncertainty of the individual values is approximately 0.2%whereas the quicker evaluation without a calibration curve leads to a higher uncertainty ofapproximately 0.3%. For the latter case, it appears to be insignificant whether a single (nb = 1)or a double (nb = 2) set of pellets was used for the construction of the base functions. Thereappears to be no correlation between the value of r j and whether or not a calibration curve wasemployed. The uncertainties are in general slightly smaller if the data sets are bigger, whichis no surprise. However, a small set of test data (ni = 3) evaluated with a calibration curveyields more accurate results than a large set (ni = 8) evaluated without. The higher value ofu(r j) for the 10 MV set hf36 is due to a fading correction and its associated uncertainty.
References
Aalbers A H L, Hoornaert M-T, Minken A, Palmans H, Pieksma M W H, de Prez L A, Reynaert N, Vynckier Sand Wittkamper F W 2008 Code of practice for the absorbed dose determination in high energy photon andelectron beams NCS Report18 Nederlandse Commissie voor Stralingsbescherming
Anton M 2005 Development of a secondary standard for the absorbed dose to water based on the alanine EPRdosimetry system Appl. Radiat. Isot. 62 779–95
Anton M 2006 Uncertainties in alanine/ESR dosimetry at PTB Phys. Med. Biol. 51 5419–40Anton M 2008 Postirradiation effects in alanine dosimeter probes of two different suppliers Phys. Med. Biol.
53 1241–58Anton M, Kapsch R P, Krystek M and Renner F 2008 Response of the alanine/ESR dosimetry system to MV x-rays
relative to 60Co radiation Phys. Med. Biol. 53 2753–70Berger M, Coursey J S, Zucker M A and Chang J 2005 ESTAR, PSTAR, and ASTAR: computer
programs for calculating stopping-power and range tables for electrons, protons, and Helium ions(version 1.2.3) Technical Report (Gaithersburg, MD: National Institute of Standards and Technology)http://www.nist.gov/pml/data/star/index.cfm
Bergstrand E S, Shortt K R, Ross C K and Hole E O 2003 An investigation of the photon energy dependence of theEPR alanine dosimetry system Phys. Med. Biol. 48 1753–71
Budgell G, Berresford J, Trainer M, Bradshaw E, Sharpe P and Williams P 2011 A national dosimetric audit of IMRTRadiother. Oncol. 99 246–52
De Angelis C, De Coste V, Fattibene P, Onori S and Petetti E 2005 Use of alanine for dosimetry intercomparisonsamong italian radiotherapy centers Appl. Radiat. Isot. 62 261–5
Ding G X, Rogers D W O and Mackie T R 1995 Calculation of stopping-power ratios using realistic clinical electronbeams Med. Phys. 22 489–501
8 hf: from batch AF594, hj: from batch AJ598, hl: from batch AL595.
66

3282 M Anton et al
Dose V 2003 Bayesian inference in physics: case studies Rep. Prog. Phys. 66 1421–61Garcia T, Lacornerie T, Popoff R, Lourenco V and Bordy J-M 2011 Dose verification and calibration of the
cyberknife R© by EPR/alanine dosimetry Radiat. Meas. 46 952–7Hubbell J H 1982 Photon mass attenuation and energy-absorption coefficients from 1 keV to 20 MeV Appl. Radiat.
Isot. 33 1269–90ICRU 1984 Stopping powers for electrons and positrons ICRU Report No. 37 (Washington, DC: ICRU)JCGM100 2008 Evaluation of measurement data—guide to the expression of uncertainty in measurement. GUM
1995 with minor corrections Technical Report JCGM 100, Working Group 1 of the Joint Committee for Guidesin Metrology JCGM/WG 1
Kawrakow I 2000 Accurate condensed history Monte Carlo simulation of electron transport: I. EGSnrc, the newEGS4 version Med. Phys. 27 485–98
Kawrakow I, Mainegra-Hing E, Rogers D W O, Tessier F and B Walters B R 2010 The EGSnrc code system: MonteCarlo simulation of electron and photon transport NRC Report PIRS-701 (Ottawa, Canada: NRCC)
Krauss A 2006 The PTB water calorimeter for the absolute determination of absorbed dose to water in 60Co radiationMetrologia 43 259–72
Krauss A and Kapsch R-P 2007 Calorimetric determination of kQ factors for NE 2561 and NE2571 ionizationchambers in 5 cm × 5 cm and 10 cm × 10 cm radiotherapy beams of 8 MV and 16 MV photons Phys. Med.Biol. 52 6243–59
Krystek M and Anton M 2007 A weighted total least-squares algorithm for fitting a straight line Meas. Sci.Technol. 18 1–5
Krystek M and Anton M 2011 A least-squares algorithm for fitting data points with mutually correlated coordinatesto a straight line Meas. Sci. Technol. 22 1–9
McEwen M R 2010 Measurement of ionization chamber absorbed dose kQ factors in megavoltage photon beams Med.Phys. 37 2179–93
McEwen M, Sephton J and Sharpe P 2006 Alanine dosimetry for clinical applications Technical Report PTB-Dos-51,Physikalisch-Technische Bundesanstalt pp 9–14
Muir B, McEwen M R and Rogers D W O 2011 Monte Carlo calculations of the beam quality conversion factor kQ
for cylindrical ionization chambers: comparison with published data Med. Phys. 38 4600–9Onori S, Bortolin E, Calicchia A, Carosi A, De Angelis C and Grande S 2006 Use of commercial alanine and TL
dosemeters for dosimetry intercomparisons among italian radiotherapy centres Radiat. Prot. Dosim. 120 226–9Picard S, Burns D T, Roger P, Allisy-Roberts P J, Kapsch R-P and Krauss A 2011 Key comparison BIPM.RI(I)-K6
of the standards for absorbed dose to water of the PTB, Germany and BIPM in accelerator photon beamsMetrologia 48 06020
Picard S, Burns D T, Roger P, Allisy-Roberts P J, McEwen M R, Cojocaru C D and Ross C K 2010 Comparisonof the standards for absorbed dose to water of the NRC and the BIPM for accelerator photon beamsMetrologia 47 06025
Rogers D W O, Walters B and Kawrakow I 2004 BEAMnrc User’s Manual NRC Report PIRS 509(a)revH (Ottawa,Canada: NRCC)
Schaeken B, Cuypers R, Lelie S, Schroeyers W, Schreurs S, Janssens H and Verellen D 2011 Implementationof alanine/EPR as transfer dosimetry system in a radiotherapy audit programme in Belgium Radiother.Oncol. 99 94–96
Seltzer S M 1993 Calculation of photon mass energy-transfer and mass energy-absorption coefficients Radiat.Res. 136 147–70
Sharpe P H G 2003 Progress report on radiation dosimetry at NPL Technical Report (Sevres: BIPM)Sharpe P H G 2006 Alanine dosimetry for clinical applications Technical Report PTB-Dos-51, Physikalisch-
Technische Bundesanstalt pp 3–8Sharpe P H G, Rajendran K and Sephton J P 1996 Progress towards an alanine/ESR therapy level reference dosimetry
service at NPL Appl. Radiat. Isot. 47 1171–5Sheikh-Bagheri D and Rogers D W O 2002 Monte Carlo calculations of nine megavoltage photon beam spectra using
the BEAM code Med. Phys. 29 391–402Voros S, Anton M and Boillat B 2012 Relative response of alanine dosemeters for high-energy electrons determined
using a Fricke primary standard Phys. Med. Biol. 57 1413–32Weise K and Woger W 1993 A Bayesian theory of measurement uncertainty Meas. Sci. Technol. 4 1–11Zeng G G, McEwen M R, Rogers D W O and Klassen N V 2004 An experimental and Monte Carlo investigation of
the energy dependence of alanine/EPR dosimetry: I. Clinical x-ray beams Phys. Med. Biol. 49 257–70Zeng G G, McEwen M R, Rogers D W O and Klassen N V 2005 An experimental and Monte Carlo investigation of
the energy dependence of alanine/EPR dosimetry: II. Clinical electron beams Phys. Med. Biol. 50 1119–29
67

Literaturverzeichnis
[1] DIN6800-2, Procedures of dosimetry with probe-type detectors for photon and
electron radiation - part 2: Ionization chamber dosimetry of high energy photon
and electron radiation (2008). 1, 2, 8, 9
[2] P. R. Almond, P. J. Biggs, B. M. Coursey, W. F. Hanson, M. S. Huq, R. Nath, D.
W. Rogers, Aapm's tg-51 protocol for clinical reference dosimetry of high-energy
photon and electron beams, Med Phys 26 (9) (1999) 1847�1870. 1, 2, 8
[3] P Andreo, D T Burns, K Hohlfeld, M S Huq, T Kanai, F Laitano, V Smyth, S
Vynckier, Absorbed dose determination in external beam radiotherapy. an interna-
tional code of practice for dosimetry based on standards of absorbed dose to water,
Technical Reports Series TRS-398 (Vienna: International Atomic Energy Agency).
1, 2, 8
[4] N. Papanikolaou, J. Battista, A. Boyer, C. Kappas, E. Klein, T. Mackie, M. Sharpe,
J. van Dyk, Aapm report no. 85: Tissue inhomogeneity corrections for megavoltage
photon beams, AAPM Report No. 85 2004 1�135. 1
[5] L. V. Spencer, F. H. Attix, A cavity ionization theory including the e�ects of
energetic secondary electrons, Radiology 64 (1) (1955) 113. 1
[6] L. V. Spencer, F. H. Attix, A theory of cavity ionization, Radiat Res 3 (3) (1955)
239�254. 1, 6
[7] L. S. Skaggs, Depth dose of electrons from the betatron, Radiology 53 (6) (1949)
868�874. doi:10.1148/53.6.868. 2
68

[8] J. Dutreix, A. Dutreix, Comparative study of a series of ionization chambers within
20 and 10 mev electron �uxes, Biophysik 3 (3) (1966) 249�258. 2
[9] G. Hettinger, C. Pettersson, H. Svensson, Displacement e�ect of thimble chambers
exposed to a photon or electron beam from a betatron, Acta radiologica: therapy,
physics, biology 6 (1) (1967) 61�64. 2
[10] K A Johansson, L O Mattsson, L Lindborg, H Svensson, Absorbed-dose deter-
mination with ionization chambers in electron and photon beams having energies
between 1 and 50 mev, National and International Standardization of Radiation
Dosimetry, IAEA Proceedings Series, Vienna 2 (1978) 243�270. 2
[11] IAEA, Absorbed dose determination in external beam radiotherapy. an internatio-
nal code of practice for dosimetry based on standards of absorbed dose to water;
technical reports series trs-277 (1987). 2
[12] D. I. Thwaites, A. R. DuSautoy, T. Jordan, M. R. McEwen, A. Nisbet, A. E.
Nahum, W. G. Pitchford, I. P. E. M. Working Party, The ipem code of practice for
electron dosimetry for radiotherapy beams of initial energy from 4 to 25 mev based
on an absorbed dose to water calibration, Phys Med Biol 48 (18) (2003) 2929�2970.
2
[13] Iwan Kawrakow, On the e�ective point of measurement in megavoltage photon
beams, Med Phys 33 (6) (2006) 1829�1839. doi:10.1118/1.2201147. 2
[14] M. R. McEwen, I. Kawrakow, C. K. Ross, The e�ective point of measurement of
ionization chambers and the build-up anomaly in mv x-ray beams, Med Phys 35
(3) (2008) 950�958. doi:10.1118/1.2839329. 2
69

[15] L. L W Wang, D. W O Rogers, The replacement correction factors for cylindrical
chambers in high-energy photon beams, Phys Med Biol 54 (6) (2009) 1609�1620.
doi:10.1088/0031-9155/54/6/014. 2
[16] Pedro Andreo, On the p(dis) correction factor for cylindrical chambers, Phys Med
Biol 55 (5) (2010) L9�16; author reply L17�9. doi:10.1088/0031-9155/55/5/L01.
2
[17] Y. Huang, C. Willomitzer, G. A. Zakaria, G. H. Hartmann, Experimental deter-
mination of the e�ective point of measurement of cylindrical ionization chambers
for high-energy photon and electron beams, Physica Medica 26 (3) (2010) 126�131.
doi:10.1016/j.ejmp.2009.10.001. 2
[18] F. Tessier, I. Kawrakow, E�ective point of measurement of thimble ion chambers
in megavoltage photon beams, Medical Physics 37 (1) (2010) 96. doi:10.1118/1.
3266750. 2
[19] F. Tessier, B. D. Hooten, M. R. McEwen, Zero-shift thimble ionization chamber,
Medical Physics 37 (3) (2010) 1161. doi:10.1118/1.3314072. 2
[20] C. Legrand, G. H. Hartmann, C. P. Karger, Experimental determination of the
e�ective point of measurement for cylindrical ionization chambers in 60co gamma
radiation, Phys Med Biol 57 (11) (2012) 3463�3475. doi:10.1088/0031-9155/57/
11/3463. 2
[21] M. Roos, K. Derikum, A. Kraus, Deviation of the e�ective point of measurement
of the markus chamber from the front surface of its air cavity in electron beams,
IAEA-TECDOC-1173 (Wien: International Atomic Energy (2000) 45�52. 2
70

[22] L. L. W. Wang, D. W. O. Rogers, Study of the e�ective point of measurement for
ion chambers in electron beams by monte carlo simulation, Medical Physics 36 (6)
(2009) 2034. doi:10.1118/1.3121490. 2, 12
[23] K. Zink, J. Wul�, Positioning of a plane-parallel ionization chamber in clinical
electron beams and the impact on perturbation factors, Phys Med Biol 54 (8)
(2009) 2421�2435. doi:10.1088/0031-9155/54/8/011. 2
[24] F. Lacroix, M. Guillot, M. McEwen, C. Cojocaru, L. Gingras, A. S. Beddar, L. Be-
aulieu, Extraction of depth-dependent perturbation factors for parallel-plate cham-
bers in electron beams using a plastic scintillation detector, Medical Physics 37 (8)
(2010) 4331. doi:10.1118/1.3463383. 2
[25] Hui Khee Looe, Dietrich Harder, Björn Poppe, Experimental determination of the
e�ective point of measurement for various detectors used in photon and electron be-
am dosimetry, Phys Med Biol 56 (14) (2011) 4267�4290. doi:10.1088/0031-9155/
56/14/005. 2
[26] Peter Sharp, Progress report on radiation dosimetry at npl: Technical report, bipm
(2003). 3
[27] E. S. Bergstrand, K. R. Shortt, C. K. Ross, E. O. Hole, An investigation of the
photon energy dependence of the epr alanine dosimetry system, Physics in Medicine
and Biology 48 (12) (2003) 1753�1771. doi:10.1088/0031-9155/48/12/306. 3
[28] G. G. Zeng, M. R. McEwen, D. W. O. Rogers, N. V. Klassen, An experimental
and monte carlo investigation of the energy dependence of alanine/epr dosimetry:
I. clinical x-ray beams, Physics in Medicine and Biology 49 (2) (2004) 257�270.
doi:10.1088/0031-9155/49/2/006. 3
71

[29] M. Anton, R.-P. Kapsch, M. Krystek, F. Renner, Response of the alanine/esr do-
simetry system to mv x-rays relative to 60 co radiation, Physics in Medicine and
Biology 53 (10) (2008) 2753�2770. doi:10.1088/0031-9155/53/10/020. 3
[30] W. H. Bragg, Studies in radioactivity, Macmillan, 1912. 5
[31] H. Fricke, O. Glasser, Eine theoretische und experimentelle untersuchung der klei-
nen ionisationskammern, Fortschr. Röntgenstr. 33 (1925) 239�250. 5
[32] L. H. Gray, The absorption of penetrating radiation, Proc. R. Soc 122 (1929) 647�
668. 5
[33] L. H. Gray, An ionisation method for the absolute measurement of gamma-ray
energy, Proc. R. Soc 156 (1936) 578�596. 5
[34] H. Reich, Dosimetrie ionisierender Strahlung, B. G. Teubner Stuttgart, 1990. 5, 6
[35] F H Attix, Introduction to Radiological Physics and Radiation Dosimetry, Wiley-
VCH, 2004. 5
[36] ICRU-35, ICRU Report 35: Radiation Dosimetry: Electron Beams with Energies
Between 1 and 50 MeV, Vol. 12, ICRU, Bethesda / USA, 1985. doi:10.1118/1.
595780. 6
[37] ICRU-14, ICRU Report 14: Radiation Dosimetry: X Rays and Gamma Rays With
Maximum Photon Energies Between 0.6 and 50 Mev, ICRU, Bethesda / USA, 1981.
6
[38] A. F. Bielajew, Ionisation cavity theory: a formal derivation of perturbation factors
for thick-walled ion chambers in photon beams, Physics in Medicine and Biology
31 (2) (1986) 161�170. doi:10.1088/0031-9155/31/2/005. 6
72

[39] A. E. Nahum, Water/air mass stopping power ratios for megavoltage photon and
electron beams, Phys Med Biol 23 (1) (1978) 24�38. doi:10.1088/0031-9155/23/
1/002. 6, 7
[40] Ernesto Mainegra-Hing, Iwan Kawrakow, D. W O Rogers, Calculations for plane-
parallel ion chambers in 60co beams using the egsnrc monte carlo code, Med Phys
30 (2) (2003) 179�189. doi:10.1118/1.1536291. 7
[41] M. Mascagni, Monte carlo methods: Early history and the basics,
http://www.cs.fsu.edu/ mascagni/MC_Basics.pdf. 11
[42] H.-O. Georgii, Stochastik: Einführung in die Wahrscheinlichkeitstheorie und Stati-
stik, 4th Edition, De Gruyter Lehrbuch, Walter de Gruyter, Berlin, 2009. 11
[43] I. Kawrakow, E. Mainegra-Hing, D. W. O. Rogers, F. Tessier, B. R. B. Walters,
The egsnrc code system: Monte carlo simulation of electron and photon transport,
National Research Council of Canada, Report PIRS-701. 14
[44] J. Wul�, K. Zink, I. Kawrakow, E�ciency improvements for ion chamber cal-
culations in high energy photon beams, Med Phys 35 (4) (2008) 1328�1336.
doi:10.1118/1.2874554. 14, 15
[45] D. W. O. Rogers, J. P. S. I. Kawrakow, B. R. B. Walters, E. Mainegra-Hing, Nrc
user codes for egsnrc, National Research Council of Canada Report PIRS-702. 14
[46] I. Kawrakow, E. Mainegra-Hing, F. Tessier, B.R.B. Walter, The egsnrc c++ class
library, NRC Report PIRS-898 (rev A), Ottawa, Canada. 14
[47] E. S. M. Ali, M. R. McEwen, D. W. O. Rogers, Detailed high-accuracy megavoltage
transmission measurements: A sensitive experimental benchmark of egsnrc, Medical
Physics 39 (10) (2012) 5990. doi:10.1118/1.4745561. 14
73

[48] B. R. Muir, M.R. McEwen, D. W. O. Rogers, Measured and monte carlo calculated
kq factors: Accuracy and comparison, Med Phys 38 (11) (2011) 4600�4609. 14
[49] I. Kawrakow, Accurate condensed history monte carlo simulation of electron trans-
port. i. egsnrc, the new egs4 version, Med Phys 27 (3) (2000) 485�498. doi:
10.1118/1.598917. 14, 16
[50] I. Kawrakow, Accurate condensed history monte carlo simulation of electron trans-
port. ii. application to ion chamber response simulations, Med Phys 27 (3) (2000)
499�513. doi:10.1118/1.598918. 14, 16
[51] I. Kawrakow, M. Fippel, Investigation of variance reduction techniques for monte
carlo photon dose calculation using xvmc, Phys Med Biol 45 (8) (2000) 2163�2183.
doi:10.1088/0031-9155/45/8/308. 14, 15
[52] M. J. Berger, Monte carlo calculation of the penetration and di�usion of fast char-
ged particles: Monte carlo calculation of the penetration and di�usion of fast char-
ged particles, in: B. Alder, S. Fernbach, M. Rotenberg (Eds.), Methods in Comput.
Phys, Academic, New York, 1963, pp. 135�215. 14
[53] I. Kawrakow, A. F. Bielajew, On the condensed history technique for electron
transport, Nuclear Instruments and Methods in Physics Research Section B: Beam
Interactions with Materials and Atoms 142 (3) (1998) 253�280. doi:10.1016/
S0168-583X(98)00274-2. 14
[54] W. Heitler, The quantum theory of radiation, 3rd Edition, Dover Publications, New
York, 1984. 16
[55] G. X. Ding, D. W. O. Rogers, T. R. Mackie, Calculation of stopping-power ratios
using realistic clinical electron beams, Med Phys 22 (5) (1995) 489�501. doi:
10.1118/1.597581. 16
74

[56] P. v. Voigts-Rhetz, K. Zink, Bestimmung des e�ektiven messpunktes von zylinder-
kammern und �achkammern in primärer elektronenstrahlung mittels monte carlo
simulation, 43. Jahrestagung der Deutschen Gesellschaft für Medizinische Physik �
Tagungsband. 17
[57] P. v. Voigts-Rhetz, K. Zink, Determination of the e�ective point of measurement
for parallel plate and cylindrical ionization chambers, Radiotherapy and Oncology
106 (2) (2013) 423. 17
[58] M. Anton, R.-P. Kapsch, A. Krauss, P. v. Voigts-Rhetz, K. Zink, M. McEwen,
Di�erence in the relative response of the alanine dosimeter to megavoltage x-ray
and electron beams, Physics in Medicine and Biology 58 (10) (2013) 3259�3282.
doi:10.1088/0031-9155/58/10/3259. 43
75

I:\Vorlagen\Formulare\0103-Formular-0306-04-019-Erklärungen-Abschlussarbeit.doc
Erklärungen der Kandidatin / des Kandidaten
(1) Prüfungsrechtliche Erklärung zur Anfertigung der Arbeit: Hiermit erkläre ich, _____________________, dass ich die vorliegende Diplomarbeit*)/ Bachelorarbeit*) / Masterarbeit*) bzw. den von mir gekennzeichneten Anteil der Arbeit*) mit dem Titel:
_________________________________________________________________________________ selbstständig verfasst und keine anderen als die zulässigen und angegebenen Quellen und Hilfsmittel verwendet und dieses auch vollständig angegeben habe.
____________________________________ Ort, Datum, Unterschrift Kandidat/in
(2) Erklärung zur Einsichtnahme in die Arbeit Ich erkläre mich damit einverstanden*) / nicht einverstanden*), dass die Arbeit zu wissenschaftlichen Zwecken eingesehen bzw. ausgeliehen werden darf. Ich erkläre damit mein Einverständnis, das die Arbeit weiteren, als nur den im Prüfungsverfahren involvierten Personen zugänglich gemacht werden kann. Diese Erklärung kann von mir jederzeit widerrufen werden.
______________________________________ Ort, Datum, Unterschrift Kandidat/in
(3) Erklärung zum Urheberrecht Ich erkläre mich damit einverstanden*) / nicht einverstanden*), dass einzelne Inhalte oder Ergebnisse dieser Arbeit zu (1) wissenschaftlichen*) und ggf. (2) wirtschaftlichen*) Zwecken von der Technischen Hochschule Mittelhessen verwendet werden können. Die Rechte Dritter bleiben davon unberührt.
______________________________________ Ort, Datum, Unterschrift Kandidat/in
*) nicht zutreffendes durchstreichen, zutreffendes unterstreichen
Ausfertigungen: (1) eingearbeitet in Prüfungsexemplar(e) entsprechend der Anzahl an Exemplaren; (2) Prüfungsakte (einfach)
Philip von Voigts-Rhetz
Determination of the effective point of measurement for parallel plate and cylindrical ionization chambers in clinical electron beams using Monte Carlo simulations
Gießen, den
Gießen, den
Gießen, den