determination of the anionic surfactant di(ethylhexyl ...least 4.4 million barrels (185 million...
TRANSCRIPT
Prepared in cooperation with the U.S. Coast Guard
Determination of the Anionic Surfactant Di(Ethylhexyl) Sodium Sulfosuccinate in Water Samples Collected from Gulf of Mexico Coastal Waters Before and After Landfall of Oil from the Deepwater Horizon Oil Spill, May to October, 2010
By James L. Gray, Leslie K. Kanagy, Edward T. Furlong, Jeff W. McCoy, and Chris J. Kanagy
Open-File Report 2010–1318
U.S. Department of the Interior U.S. Geological Survey

ii
U.S. Department of the Interior KEN SALAZAR, Secretary
U.S. Geological Survey Marcia K. McNutt, Director
U.S. Geological Survey, Reston, Virginia 2011
For product and ordering information: World Wide Web: http://www.usgs.gov/pubprod Telephone: 1-888-ASK-USGS
For more information on the USGS—the Federal source for science about the Earth, its natural and living resources, natural hazards, and the environment: World Wide Web: http://www.usgs.gov Telephone: 1-888-ASK-USGS
Suggested citation: Gray, J.L., Kanagy, L.K., Furlong, E.T., McCoy, J.W., and Kanagy, C.J., 2011, Determination of the anionic surfactant di(ethylhexyl) sodium sulfosuccinate in water samples collected from Gulf of Mexico coastal waters before and after landfall of oil from the Deepwater Horizon oil spill, May to October, 2010: U.S. Geological Survey Open-File Report 2010–1318, 15 p. (also available at http://pubs.usgs.gov/of/2010/1318/).
Any use of trade, product, or firm names is for descriptive purposes only and does not imply endorsement by the U.S. Government.
Although this report is in the public domain, permission must be secured from the individual copyright owners to reproduce any copyrighted material contained within this report.

iii
Contents Abstract ......................................................................................................................................................................... 1 Introduction .................................................................................................................................................................... 2 Purpose and Scope ....................................................................................................................................................... 3 Materials and Methods .................................................................................................................................................. 3
Sample Collection and Preservation .......................................................................................................................... 3 Sample Isolation and Instrumental Analysis ............................................................................................................... 4
Determination of the Anionic Surfactant Di(ethylhexyl) Sodium Sulfosuccinate ............................................................. 5 Quality Assurance/Quality Control ............................................................................................................................. 5 Method Detection Limit .............................................................................................................................................. 5 Determination of DOSS in Coastal Surface Water, May–June 2010.......................................................................... 6 Determination of DOSS in Coastal Surface Water, October 2010 ............................................................................. 6
References Cited ........................................................................................................................................................... 7
Tables 1. Concentration of di(ethylhexyl) sodium sulfosuccinate (DOSS) in pre-landfall coastal Gulf of Mexico water
samples between Texas and Florida and associated quality control data ........................................................ 9 2. Concentration of di(ethylhexyl) sodium sulfosuccinate (DOSS) in post-landfall coastal Gulf of Mexico water
samples between Texas and Florida and associated quality control data .......................................................13
Conversion Factors SI to Inch/Pound
Multiply By To obtain
Length micrometer (µm) 1000 millimeter (mm)
millimeter (mm) 0.03937 inch (in.)
meter (m) 3.281 foot (ft)
meter (m) 1.094 yard (yd)
Volume liter (L) 33.82 ounce, fluid (fl. oz)
liter (L) 2.113 pint (pt)
liter (L) 1.057 quart (qt)
liter (L) 0.2642 gallon (gal)
barrel (bbl) 0.0238 gallon (gal) Temperature in degrees Celsius (°C) may be converted to degrees Fahrenheit (°F) as follows: °F=(1.8×°C)+32 Temperature in degrees Fahrenheit (°F) may be converted to degrees Celsius (°C) as follows: °C=(°F-32)/1.8
iv
Abbreviated water-quality units used in this report: Chemical concentrations are given in metric units. Chemical concentration is given in milligrams per liter (mg/L) and micrograms per liter (µg/L). “Milligrams per liter” is a unit expressing the concentration of chemical constituents in solution as weight (milligrams) of solute per unit volume (liter) of water. “Micrograms per liter” is a unit expressing the concentration of chemical constituents in solution as weight (micrograms) of solute per unit volume (liter) of water. For concentrations less than 7,000 mg/L, the numerical value is the same as for concentrations in parts per million.
1
Determination of the Anionic Surfactant Di(Ethylhexyl) Sodium Sulfosuccinate in Water Samples Collected from Gulf of Mexico Coastal Waters Before and After Landfall of Oil from the Deepwater Horizon Oil Spill, May to October, 2010
By James L. Gray, Leslie K. Kanagy, Edward T. Furlong, Jeff W. McCoy, and Chris J. Kanagy
Abstract On April 22, 2010, the explosion on and subsequent sinking of the Deepwater Horizon oil
drilling platform resulted in the release of crude oil into the Gulf of Mexico. At least 4.4 million barrels had been released into the Gulf of Mexico through July 15, 2010, 10 to 29 percent of which was chemically dispersed, primarily using two dispersant formulations. Initially, the dispersant Corexit 9527 was used, and when existing stocks of that formulation were exhausted, Corexit 9500 was used. Over 1.8 million gallons of the two dispersants were applied in the first 3 months after the spill.
This report presents the development of an analytical method to analyze one of the primary surfactant components of both Corexit formulations, di(ethylhexyl) sodium sulfosuccinate (DOSS), the preliminary results, and the associated quality assurance/quality control (QA/QC) from samples collected from various points on the Gulf Coast between Texas and Florida. Seventy water samples and 8 field QC samples were collected before the predicted landfall of oil (pre-landfall) on the Gulf Coast, and 51 water samples and 10 field QC samples after the oil made landfall (post-landfall). Samples were collected in Teflon bottles and stored at -20ºC until analysis. Extraction of whole-water samples used sorption onto a polytetrafluoroethylene (PTFE) filter to isolate DOSS, with subsequent 50 percent methanol/water elution of the combined dissolved and particulate DOSS fractions. High-performance liquid chromatography/tandem mass spectrometry (LC/MS/MS) was used to identify and quantify DOSS by the isotope dilution method, using a custom-synthesized 13C4-DOSS labeled standard. Because of the ubiquitous presence of DOSS in laboratory reagent water, a chromatographic column was installed in the LC/MS/MS between the system pumps and the sample injector that separated this ambient background DOSS contamination from the sample DOSS, minimizing one source of blank contamination.
Laboratory and field QA/QC for pre-landfall samples included laboratory reagent spike and blank samples, a total of 34 replicate analyses for the 78 environmental and field blank samples, and 11 randomly chosen laboratory matrix spike samples. Laboratory and field QA/QC for post-landfall samples included laboratory reagent spike and blank samples, a laboratory “in-bottle” duplicate for each sample, and analysis of 24 randomly chosen laboratory matrix spike samples. Average DOSS recovery of 89±9.5 percent in all native (non-13C4-DOSS ) spikes was

2
observed, with a mean relative percent difference between sample duplicates of 36 percent. The reporting limit for this analysis was 0.25 micrograms per liter due to blank limitations; DOSS was not detected in any samples collected in October (after oil landfall at certain study sites) above that concentration. It was detected prior to oil landfall above 0.25 micrograms per liter in 3 samples, but none exceeded the Environmental Protection Agency aquatic life criteria of 40 micrograms per liter.
Introduction On April 22, 2010, the Deepwater Horizon oil drilling platform sank following an
explosion and oil began leaking from the Macondo-1 well into the Gulf of Mexico (GOM) at a depth of approximately 1,500 meters (5,000 feet). By July 15, when the well head was capped, at least 4.4 million barrels (185 million gallons) had been released into the GOM (Lehr and others, 2010; Rosenbauer and others, 2010). In comparison, the total volume of crude oil released to Prince William Sound by the 1989 Exxon Valdez oil spill was 250,000 barrels (Michel and others, 2005). In order to solubilize the oil and mitigate the formation of a surface oil slick, over 1.8 million gallons of the chemical dispersants Corexit 9500 and 9527, produced by Nalco Company (Naperville, Ill.), were applied to surface oil (approx. 1.1 million gallons) and to the underwater plume at the well head (approx. 0.77 million gallons) (Lehr and others, 2010). These amounts represent the largest volume of dispersants ever used to respond to an oil spill, and it is the first occasion where dispersants have been used at depth. The Federal Interagency Solutions Group estimated that as of July 14, 2010, 16 percent (potential range 10 to 29 percent) of the spilled oil was chemically dispersed in the environment (Lehr and others, 2010).
Oil dispersants are chemical mixtures of solvents and surfactants designed to reduce oil slicks and emulsions by increasing the apparent solubility or accommodation of oil in seawater. Initially, existing stocks of Corexit 9527 were used to treat the GOM oil spill, but they were rapidly exhausted. Most of the applied dispersant was Corexit 9500, which is of similar composition, except that it does not contain 2-butoxyethanol, a solvent. A list of components for each Corexit formulation is publicly available (U.S. Environmental Protection Agency, 2010a). The primary surfactant components of both formulations are di(ethylhexyl) sodium sulfosuccinate (DOSS; Chemical Abstracts Service Number 577-11-7)1
On September 24, 2010, the U.S. Coast Guard requested that the U.S. Geological Survey (USGS) undertake chemical analyses of water samples collected before and after the oil spill made landfall at different points along the Gulf Coast. Samples for this study were collected according to protocols outlined by Wilde and others (2010). Another report addressing the Coast
, Tween 80, Tween 85, and Span 80 (Place and others, 2010). It is uncertain whether Corexit dispersants would be toxic to aquatic life at expected environmental concentrations—a battery of in vitro mammalian cytotoxicity assays estimated that the LC50 (lethal concentration 50) for Corexit is approximately 100 parts per million (ppm) (Judson and others, 2010), whereas the U.S. Environmental Protection Agency (EPA) found LC50 in 48- and 96-hour toxicity tests between 2.6 and 6.6 ppm (U.S. Environmental Protection Agency, 2010b). The EPA has estimated an aquatic life benchmark concentration at 40 parts per billion (40 ppb) (U.S. Environmental Protection Agency, 2010c). It is worth noting that dispersants can enhance the bioavailability of toxic oil components through increased solubilization (McIntosh and others, 2010).
1 This report contains CAS Registry Numbers®, which is a Registered Trademark of the American Chemical Society. CAS recommends the verification of the CASRNs through CAS client services.

3
Guard’s request showed that most of the coastal oil contamination (sediments and tarballs) correlated with Macondo-1 oil found in Louisiana, Mississippi, and Alabama, which is consistent with the spatial extent of the oil spill (Rosenbauer and others, 2010). To fulfill the request of the U.S. Coast Guard, the above-mentioned analytical method is applied to assess the presence of DOSS, before and after the oil spill made landfall, in near-shore GOM surface waters along the United States coast from Texas to Florida.
Purpose and Scope This report presents data requested by the U.S. Coast Guard for DOSS concentrations in
Gulf of Mexico surface water samples collected before Macondo-1 oil made landfall (pre-landfall samples) along the coast , and surface water samples collected after Macondo-1 oil made landfall (post-landfall samples). Samples were collected from coastal waters in Texas, Louisiana, Mississippi, Alabama, and Florida before and after landfall of oil; where possible, pre- and post-landfall samples were collected from the same site.
In this report, a novel analytical method for the determination of sub-ppb concentrations of DOSS in seawater samples is presented; DOSS is isolated from a 1.5-milliliter (mL) water sample on a 0.2-micrometer (µm) Teflon (polytetrafluoroethylene, PTFE) filter, eluted with a solution of 50 percent methanol in water, and analyzed by liquid chromatography with tandem mass spectrometry (LC/MS/MS). Isotope dilution internal standard procedures are used to quantify DOSS and correct for losses during isolation and analysis, using a custom-synthesized stable-isotope analog (13C4-DOSS), which is added to water samples prior to DOSS isolation.
It is worth noting that the USGS did not have a published analytical method for DOSS prior to the beginning of this project, and in the absence of validated sampling protocols, samples were collected and stored frozen in 1-liter (L) Teflon bottles while a methodology for determining DOSS at predicted ambient environmental concentrations was developed and validated. Therefore, sufficient information documenting methodology and method performance has also been included to aid in the interpretation of results from this occurrence study.
Materials and Methods Sample Collection and Preservation
Samples were collected between May and October of 2010 as part of the USGS response assessing potential effects of the oil spill, concurrent with the development of an analytical method for this study. Therefore, holding times for seawater samples and the effects of specific container types could not be determined prior to sample receipt and storage. Care was taken to handle samples in a way that losses during collection and storage were likely to be minimized. All pre-landfall samples were analyzed within 8 months of collection, and all post-landfall samples were analyzed within 8 months of collection.
Samples were collected in 1-L Teflon containers according to the procedures of Wilde and others (2010), wrapped in aluminum foil to exclude light, and frozen in the field when possible. Samples were shipped overnight to the National Water Quality Laboratory (NWQL), transferred to a freezer at -20°C on receipt, and held at this temperature under chain-of-custody procedures until analysis.

4
As part of the USGS strategy for sample collection in response to the Macondo-1 oil release, field blanks, field laboratory blanks, and equipment blanks were defined and specified for this and other analyses (Wilde and others, 2010).
Sample Isolation and Instrumental Analysis Samples were thawed overnight in the dark one day prior to preparation. Once samples were
thawed, approximately 0.4 percent (4 mL/L) methanol was added to each sample container to facilitate dissolution of any DOSS that had become adsorbed to the Teflon containers. Preliminary experiments showed that the addition of methanol increased DOSS recovery. Samples were placed on a rotating mixer for 5 minutes to thoroughly mix water and particles, and replicate 1.5-mL aliquots were immediately collected: two aliquots for replicate ambient DOSS determinations, and a third aliquot for a select subset of samples to determine DOSS recovery from a laboratory matrix spike sample. Each aliquot was added to a separate methanol-rinsed polypropylene syringe body fitted with a 0.2-micron pore size PTFE filter enclosed in a 22-millimeter (mm) polypropylene housing (Pall Life Sciences, part number CORP-4642). Prior to sample addition, the filter was rinsed twice with 4 mL of methanol (MeOH). For samples analyzed after December 15, 2010 (primarily pre-landfall samples collected in May and June), each filter was rinsed with 2 mL of MeOH, 4 mL of 1-millimolar (mM) formic acid, 4 mL of isopropanol (IPA), 4 mL of 50:50 MeOH:water and finally 2 mL of MeOH. This improved cleaning procedure lowered background contamination and, in future studies, should result in a substantial reduction in the method detection limit (MDL). A 15-microliter (µL) aliquot of a 100-µg/L 13C4-DOSS solution was added to the sample (final concentration 1 µg/L) as an isotope-dilution standard (IDS) prior to analyte isolation. For the matrix spike sample, the 1.5-mL aliquot also was amended to 5 µg/L with a solution of unlabelled DOSS to assess compound recovery. After addition of these solutions, each sample was passed through the PTFE filter. Aqueous DOSS and DOSS-containing particles were retained on the filter, then eluted with 1.5 mL of 50 percent methanol in water. The eluant was amended with a 25-µL aliquot of 2.4 µg/mL ibuprofen-d3 in methanol, which was added as an injection internal standard used to measure recovery of the 13C4-DOSS. Sample extracts were refrigerated at approximately 4°C until analysis.
Sample analysis was carried out using an Agilent 1200 Series high-performance liquid chromatograph (LC) coupled to a 6410 Series triple quadrupole tandem mass spectrometer (MS/MS) operated in multiple-reaction monitoring mode. During method development, ambient DOSS was detected and traced to contamination in the LC/MS/MS system, either as an adsorbed component in the system itself or as an unavoidable contaminant in ultrapure water. The LC/MS/MS was modified by placing an Agilent Zorbax Eclipse column (3.1-mm diameter × 50-mm length; 5-µm particle size) between the LC pumping system and the injector module. The addition of a second column resulted in chromatographic separation of the ambient DOSS contamination from the sample DOSS and permitted identification and quantification in environmental water samples without requiring correction for this instrument background. A 100-µL aliquot of the unconcentrated sample extract was injected on an Agilent Zorbax Eclipse column (4.6 mm × 50 mm; 1.8 µm). Initially, the mobile phase consisted of 20 percent methanol/80 percent 1-mM ammonium formate in water and a flow rate of 0.65 mL/min. A multistep gradient program was applied to reach a final condition of 100 percent methanol after 7 minutes of elution, with DOSS eluting in the pure organic phase with a retention time of approximately 12 minutes. The mass spectrometer was operated under negative electrospray

5
ionization conditions to produce a detectable DOSS (M-H)- precursor ion. The retention time of each target compound, coupled with the observation and measurement of two unique precursor-to-product transitions, were required for acceptable qualitative identification of each compound. Isotope-dilution internal standard quantification of DOSS was used, based on the response of the 13C4-DOSS added to each sample prior to isolation (Antignac and others, 2003).
Determination of the Anionic Surfactant Di(ethylhexyl) Sodium Sulfosuccinate Quality Assurance/Quality Control
A total of 112 pre-landfall samples were analyzed, comprising 70 distinct field sites, 34 replicates, and 8 field blank samples. Similarly, a total of 61 different post-landfall samples were analyzed for this study. These included GOM water from 48 distinct field sites, 3 of which had duplicate samples collected, and 10 blank (field blank and field laboratory blank) samples. Each of these samples was analyzed in duplicate (“in-bottle” duplicates), and a subset was fortified with DOSS to 5 µg/L for recovery analysis. The results from laboratory and field blank analyses were discussed in the Method Detection Limit section. All samples and duplicates were fortified with 1 µg/L of the IDS, 13C4-DOSS, and IDS recovery was calculated relative to response of d3-ibuprofen-d3 in the standards. Average recovery of the 13C4-DOSS IDS was 88.8±13.8 percent (mean ± relative standard deviation, n = 239). In addition, 21 percent (n = 35) of the samples had an aliquot fortified to 5 µg/L of DOSS, quantified relative to the IDS. Average recovery in these samples was 89±9.5 percent. This demonstrates robust method performance across the range of salinity encountered in GOM coastal waters (2–3.5 percent). Finally, although some DOSS was lost to sorption to the inside of the Teflon bottles, when 0.4 percent methanol was added to sample containers the recovery was acceptable. Three 1-L Teflon® bottles were filled with water from Dauphin Island, Ala., that was collected prior to the oil plume’s landfall and fortified to 50 µg/L with DOSS, frozen at -20ºC for one week, then processed as described above. The average recovery in these samples was 75 percent, indicating that our method of sample storage was effective.
Method Detection Limit The MDL for the measurement of DOSS was calculated according to EPA procedures using
a low-level standard (MDL = 0.043 µg/L, n = 7) (U.S. Environmental Protection Agency, 2005). However, there was persistent contamination from sources in both the laboratory and the field. The laboratory reagent water used for preparation of chromatographic eluant was determined to be contaminated with DOSS. This source of contamination was removed from the analysis by the addition of a second column placed in front of the injection system (see Sample Isolation and Instrumental Analysis Section). However, DOSS is a ubiquitous contaminant (Benjamin Place, Oregon State University, oral commun., November 2010) and there was additional contamination not associated with laboratory reagent water, so while the addition of a second column decreased blank contamination substantially, it did not eliminate it. Laboratory blank samples that were prepared as described above had an average concentration of 0.086±0.044 µg/L. Laboratory blank samples collected with modified protocols for pre-rinsing of filters had an average concentration of 0.041±0.014 µg/L. Because the concentration of DOSS in laboratory blank samples exceeded the calculated MDL, data for post-landfall samples were censored at a

6
reporting level (RL) of approximately 3 times the average blank concentration (0.25 µg/L) to minimize the potential for false positive results. The pre-landfall samples, which had lower background DOSS concentrations, were also censored at the higher level (0.25 µg/L) to maintain consistency within this report. Results for blanks collected in the field were not censored so the possibility of additional contamination during sample collection and other field activities could be assessed. The average DOSS concentration in blanks collected in the field was 0.12±0.044 µg/L (n = 10) for samples analyzed prior to December 15, 2010, and 0.075±0.026 µg/L (n = 8) for samples analyzed after that date. Neither result was statistically different from the associated laboratory blanks (Student’s T-test, significant difference at p-value less than 0.05; Helsel and Hirsch, 2002). It is imperative that future studies requiring trace analysis of surfactants use sampling methods informed by these field and laboratory blank findings, by incorporating cleaning solvents and rinse water that have been purified to remove low-level contamination.
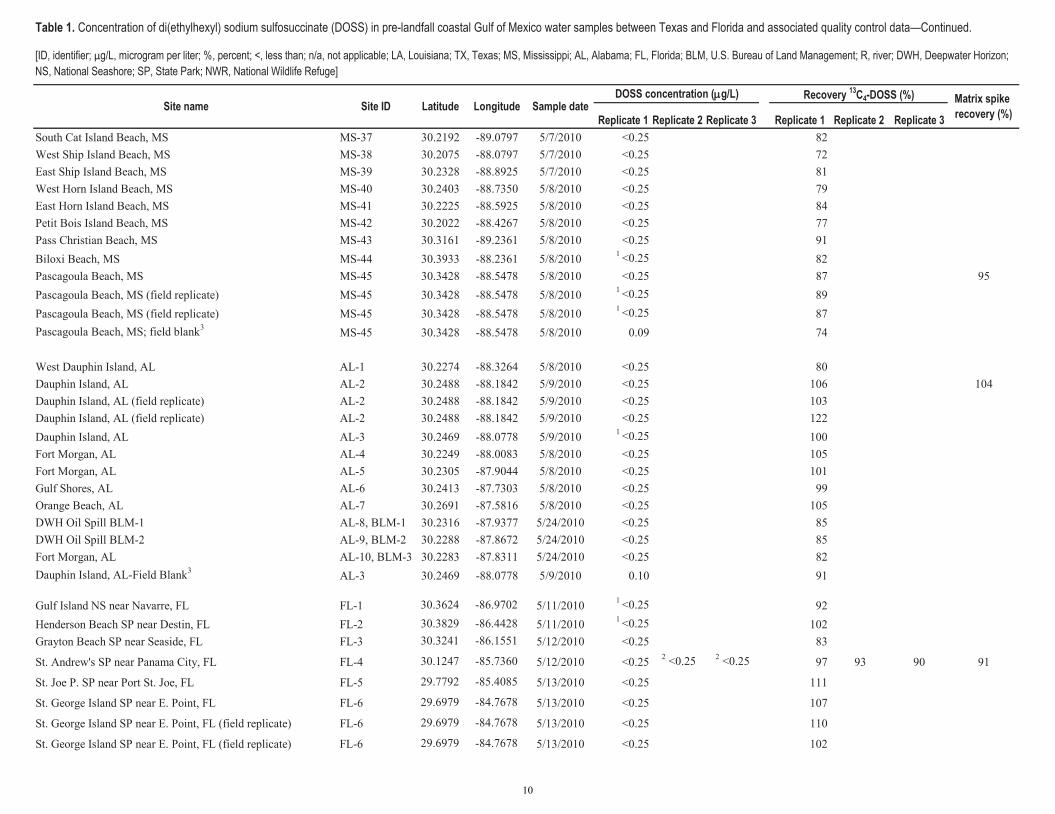
Determination of DOSS in Coastal Surface Water, May–June 2010 Pre-landfall water samples were collected from 70 sites in Texas, Louisiana, Mississippi,
Alabama, and Florida in May and June of 2010 (table 1). DOSS was observed above the RL (0.25 µg/L) at two sites in Texas and one site in Louisiana during this period, at concentrations ranging from 0.34 to 3.66 µg/L. These concentrations all were substantially less than the provisional EPA aquatic life benchmark of 20 µg/L (U.S. Environmental Protection Agency, 2010c). At present, there is no evidence (Rosenbauer and others, 2010) that the extent of the surface oil plume had reached these sites by their respective sampling dates; however, the observed DOSS concentrations may have resulted from preparation or bulk transport of the dispersant from staging areas to the Macondo-1 site or from other, as yet unidentified, sources. An inadvertent chain of custody breach occurred for 31 of the samples within the pre-landfall set, as is noted in table 1. As a result of this breach, the affected samples thawed and were stored at 4ºC. These samples were analyzed and are reported herein.
Determination of DOSS in Coastal Surface Water, October 2010 Post-landfall water samples were collected from a total of 48 sites in Texas, Louisiana,
Mississippi, Alabama, and Florida in October of 2010 (table 2). In three samples, DOSS was qualitatively identified, but concentrations did not exceed the RL of 0.25 µg/L, and the absence of detectable DOSS after reanalysis suggests that any DOSS present in these samples likely resulted from laboratory or field contamination. The sampling locations encompassed the estimated areal extent of the Macondo-1 oil spill, as derived from wind, ocean currents, aerial photography, and satellite imagery (Norse and others, 2010). In a related study, there was evidence of Macondo-1 oil in tarballs and sediment samples from many of the same sites in Louisiana, Mississippi, and Alabama (Rosenbauer and others, 2010).
These samples were collected between October 4 and 15, 2010, which is at least 80 days after the well head had been capped and substantial use of Corexit 9500 had been discontinued. It is likely that DOSS concentrations in GOM water were attenuated both by dilution and degradation processes. Although the rate of degradation was not quantified, the observed loss of DOSS in samples that were exposed to fluorescent light at the NWQL over the course of 24 hours likely resulted from photolysis. Therefore, it is not surprising that DOSS was not detected in sunlit GOM water samples. Although these results indicate that DOSS was not detectable in coastal GOM water 80 days after most dispersant use had ceased, it could be present at concentrations

7
less than the RL or in other areas not sampled as a part of this study. Over 43 percent of the Corexit that was used in response to this oil spill was applied at depth (Lehr and others, 2010). If photolysis is an important mechanism of DOSS transformation in the GOM, DOSS could be more persistent in subsurface plumes where little sunlight penetrates. In addition, Corexit is a complex mixture of surfactants and solvents, and DOSS is the only component that was determined in this study. The absence of DOSS from most coastal samples does not imply that effects resulting from dispersant application did not occur, as other surfactant components could be more persistent, and their presence, persistence, and potential effects have yet to be assessed.
References Cited Antignac, J.P., Le Bizec, Bruno, Monteau, Fabrice, and Andre, François, 2003, Validation of
analytical methods based on mass spectrometric detection according to the “2002/657/EC” European decision—Guideline and application: Analytica Chimica Acta, v. 483, no. 1–2, p. 325–334.
Helsel, D.R., and Hirsch, R.M., 2002. Statistical methods in water resources, chap. A3 of Hydrologic analysis and interpretation, book 4 of Techniques of water-resources investigations of the United States Geological Survey: U.S. Geological Survey, 522 pages.
Judson, R.S., Martin, M.T., Reif, D.M., Houck, K.A., Knudsen, T.B., Rotroff, D.M., Xia, M.H., Sakamuru, Srilath, Huang, R.L., Shinn, Paul., Austin, C.P., Kavlock, R.J., and Dix, D.J., 2010, Analysis of eight oil spill dispersants using rapid in vitro tests for endocrine and other biological activity: Environmental Science & Technology, v. 44, no. 15, p. 5979–5985.
Lehr, Bill, Bristol, Sky, and Possolo, Antonio, 2010, Oil budget calculator—Deepwater Horizon. Report to the National Incident Command: Federal Interagency Solutions Group, Oil Budget Calculator Science and Engineering Team, 217 p., accessed December 8, 2010, at http://www.restorethegulf.gov/sites/default/files/documents/pdf/OilBudgetCalc_Full_HQ-Print_111110.pdf.
McIntosh, Stephen, King, Tom, Wu, D.M., and Hodson, P.V., 2010, Toxicity of dispersed weathered crude oil to early life stages of Atlantic herring (Clupea harengus): Environmental Toxicology and Chemistry, v. 29, no. 5, p. 1160–1167.
Michel, Jacqueline, Adams, E.E., Addassi, Yvonne, Copeland, Tom, Greeley, Mark, James, Bela, McGee, Beth, Mitchelmore, Carys, Onishi, Yasuo, Payne, James, Salt, David, and Wrenn, Brian, 2005, Oil spill dispersants—Efficacy and effects: Washington, D.C., The National Academies Press, 378 p.
Norse, E.A., and Amos, John, 2010, Impacts, perception, and policy implications of the Deepwater Horizon oil and gas disaster: Environmental Law Reporter, v. 40, no. 11, p. 11058–11073.
Place, Benjamin, Anderson, Brian, Mekeri, Abdou, Furlong, E.T., Gray, J.L., Tjeerdema, Ron, and Field, Jennifer, 2010, A role for analytical chemistry in advancing our understanding of the occurrence, fate, and effects of Corexit oil dispersants: Environmental Science & Technology, v. 44, no. 16, p. 6016–6018.
Rosenbauer, R.J., Campbell, P.L., Lam, Angela, Lorenson, T.D., Hostettler, F.D., Thomas, Burt, and Wong, F.L., 2010, Reconnaissance of Macondo-1 well oil in sediment and tarballs from the northern Gulf of Mexico shoreline, Texas to Florida: U.S. Geological Survey Open-File Report 2010–1290, 22 p. ( also available at http://pubs.usgs.gov/of/2010/1290/).

8
U.S. Environmental Protection Agency, 2010a, Questions and answers on dispersants: U.S. Environmental Protection Agency, unpaged, accessed December 8, 2010, at http://www.epa.gov/BPspill/dispersants-qanda.html.
U.S. Environmental Protection Agency, 2010b, National Contingency Plan Product Schedule toxicity and effectiveness summaries: U.S. Environmental Protection Agency, unpaged, accessed December 9, 2010, at http://www.epa.gov/osweroe1/content/ncp/tox_tables.htm.
U.S. Environmental Protection Agency, 2010c, Methods for detecting dispersants in water: U.S. Environmental Protection Agency, unpaged, accessed January 24, 2011, at http://www.epa.gov/bpspill/dispersant-methods.html.
U.S. Environmental Protection Agency, 2005, Definition and procedure for the determination of the method detection limit (revision 1.11), app. B to Guidelines establishing test procedures for the analysis of pollutants, part 136 of Protection of environment—U.S. Code of Federal Regulations, Title 40 [Electronic Code of Federal Regulations]: National Archives and Records Administration–Office of the Federal Register, Government Printing Office, unpaged, accessed December 8, 2010, through the portal site http://ecfr.gpoaccess.gov/.
Wilde, F.D., Skrobialowski, S.C., and Hart, J.S., 2010, Sampling protocol for post-landfall Deepwater Horizon oil release, Gulf of Mexico, 2010: U.S. Geological Survey Open-File Report 2010–1191, 155 p. (also available at http://pubs.usgs.gov/of/2010/1191).

Replicate 1 Replicate 2 Replicate 3 Replicate 1 Replicate 2 Replicate 3
Table 1. Concentration of di(ethylhexyl) sodium sulfosuccinate (DOSS) in pre-landfall coastal Gulf of Mexico water samples between Texas and Florida and associated quality control data .
[ID, identifier; μg/L, microgram per liter; %, percent; <, less than; n/a, not applicable; LA, Louisiana; TX, Texas; MS, Mississippi; AL, Alabama; FL, Florida; BLM, U.S. Bureau of Land Management; R, river; DWH, Deepwater Horizon; NS, National Seashore; SP, State Park; NWR, National Wildlife Refuge]
Site name Site ID Latitude Longitude Sample date Matrix spike recovery (%)
DOSS concentration ( g/L) Recovery 13C4-DOSS (%)
9
Replicate 1 Replicate 2 Replicate 3 Replicate 1 Replicate 2 Replicate 3
Table 1. Concentration of di(ethylhexyl) sodium sulfosuccinate (DOSS) in pre-landfall coastal Gulf of Mexico water samples between Texas and Florida and associated quality control data .
[ID, identifier; μg/L, microgram per liter; %, percent; <, less than; n/a, not applicable; LA, Louisiana; TX, Texas; MS, Mississippi; AL, Alabama; FL, Florida; BLM, U.S. Bureau of Land Management; R, river; DWH, Deepwater Horizon; NS, National Seashore; SP, State Park; NWR, National Wildlife Refuge]
Site name Site ID Latitude Longitude Sample date Matrix spike recovery (%)
DOSS concentration ( g/L) Recovery 13C4-DOSS (%)
10

Replicate 1 Replicate 2 Replicate 3 Replicate 1 Replicate 2 Replicate 3
Table 1. Concentration of di(ethylhexyl) sodium sulfosuccinate (DOSS) in pre-landfall coastal Gulf of Mexico water samples between Texas and Florida and associated quality control data .
[ID, identifier; μg/L, microgram per liter; %, percent; <, less than; n/a, not applicable; LA, Louisiana; TX, Texas; MS, Mississippi; AL, Alabama; FL, Florida; BLM, U.S. Bureau of Land Management; R, river; DWH, Deepwater Horizon; NS, National Seashore; SP, State Park; NWR, National Wildlife Refuge]
Site name Site ID Latitude Longitude Sample date Matrix spike recovery (%)
DOSS concentration ( g/L) Recovery 13C4-DOSS (%)
FL-17
FL-17
11

Replicate 1 Replicate 2 Replicate 3 Replicate 1 Replicate 2 Replicate 3
Table 1. Concentration of di(ethylhexyl) sodium sulfosuccinate (DOSS) in pre-landfall coastal Gulf of Mexico water samples between Texas and Florida and associated quality control data.
[ID, identifier; μg/L, microgram per liter; %, percent; <, less than; n/a, not applicable; LA, Louisiana; TX, Texas; MS, Mississippi; AL, Alabama; FL, Florida; BLM, U.S. Bureau of Land Management; R, river; DWH, Deepwater Horizon; NS, National Seashore; SP, State Park; NWR, National Wildlife Refuge]
Site name Site ID Latitude Longitude Sample date Matrix spike recovery (%)
DOSS concentration ( g/L) Recovery 13C4-DOSS (%)
12

Replicate 1 Replicate 2 Replicate 1 Replicate 2
East Sabine, LA TX-46 29.7489 -93.6633 10/6/2010 < 0.25 < 0.25 78 71Texas Point, TX TX-47 29.6825 -93.9564 10/6/2010 < 0.25 < 0.25 83 90High Island, TX TX-49 29.5567 -94.3683 10/7/2010 < 0.25 < 0.25 89 91 76Galveston Island, TX TX-51 29.3042 -94.7694 10/13/2010 < 0.25 < 0.25 80 81 89Galveston Island, TX TX-51 29.3042 -94.7694 10/13/2010 < 0.25 < 0.25 80 84 84Bolivar Peninsula, TX TX-53 29.3883 -94.7192 10/7/2010 < 0.25 < 0.25 94 99West Bay, TX TX-55 29.2147 -94.9539 10/14/2010 < 0.25 < 0.25 82 87 88San Luis Pass, TX TX-56 29.0867 -95.1086 10/5/2010 < 0.25 < 0.25 83 77 85
West Bay, blank1 Field blank 29.2147 -94.9539 10/14/2010 0.08 0.09 86 84Houston Lab at Shenandoah, TX1 Field lab blank n/a n/a 10/4/2010 0.03 0.11 76 82Houston Lab at Shenandoah, TX1 Field lab blank n/a n/a 10/4/2010 0.12 0.09 86 78
Jean Lafitte National Park, LA LA-22 29.7422 -90.1419 10/13/2010 < 0.25 < 0.25 87 78Jean Lafitte National Park, LA LA-22 29.7422 -90.1419 10/13/2010 < 0.25 < 0.25 82 80 87Cypremont Point, LA LA-23 29.7350 -91.8536 10/5/2010 < 0.25 < 0.25 75 69Lake Felicity, LA LA-24 29.3461 -90.4292 10/12/2010 < 0.25 < 0.25 89 88Rockerfeller Refuge Beach, LA LA-25 29.6356 -92.7672 10/7/2010 < 0.25 < 0.25 88 80Sister Lake, LA LA-26 29.2519 -90.9217 10/8/2010 < 0.25 < 0.25 70 80 92Point Chevreuli, LA LA-28 29.5733 -91.5378 10/5/2010 < 0.25 < 0.25 80 71Crooked Bayou, LA LA-29 29.7233 -89.7236 10/13/2010 < 0.25 < 0.25 110 97Mississippi R. Gulf Outlet, LA LA-30 29.6856 -89.3958 10/12/2010 < 0.25 < 0.25 93 103 90Grand Isle Beach at State Park, LA LA-31 29.2603 -89.9503 10/14/2010 < 0.25 < 0.25 95 87Grand Isle Beach at State Park, LA LA-31 29.2603 -89.9503 10/15/2010 < 0.25 < 0.25 92 91Mississippi R. at Main Pass, LA LA-32 29.3206 -89.1819 10/7/2010 < 0.25 < 0.25 66 64 86Breton Sound, LA LA-33 29.5883 -89.6119 10/13/2010 < 0.25 < 0.25 89 102Mississippi Sound at Grand Pass, LA LA-34 30.1519 -89.2458 10/11/2010 < 0.25 < 0.25 58 69 84Mississippi R. at South Pass, LA LA-35 28.9975 -89.1489 10/7/2010 < 0.25 < 0.25 71 75Mississippi R. at SW Pass, LA LA-36 28.9375 -89.3989 10/14/2010 < 0.25 < 0.25 88 92
Concentration DOSS (mg/L) Recovery 13
C4-DOSS (%)
Table 2. Concentration of di(ethylhexyl) sodium sulfosuccinate (DOSS) in post-landfall coastal Gulf of Mexico water samples between Texas and Florida and associated quality-
control data—Continued.
Site name Site ID Latitude Longitude Sample dateMatrix spike
recovery (%)
[ID, identifier; µg/L, microgram per liter; %, percent; <, less than; n/a, not applicable; LA, Louisiana; TX, Texas; MS, Mississippi; AL, Alabama; FL, Florida; BLM, U.S. Bureau of Land Management;
R, river; DWH, Deepwater Horizon; NS, National Seashore; SP, State Park; NWR, National Wildlife Refuge]
13

Replicate 1 Replicate 2 Replicate 1 Replicate 2
Concentration DOSS (mg/L) Recovery 13
C4-DOSS (%)
Table 2. Concentration of di(ethylhexyl) sodium sulfosuccinate (DOSS) in post-landfall coastal Gulf of Mexico water samples between Texas and Florida and associated quality-
control data—Continued.
Site name Site ID Latitude Longitude Sample dateMatrix spike
recovery (%)
[ID, identifier; µg/L, microgram per liter; %, percent; <, less than; n/a, not applicable; LA, Louisiana; TX, Texas; MS, Mississippi; AL, Alabama; FL, Florida; BLM, U.S. Bureau of Land Management;
R, river; DWH, Deepwater Horizon; NS, National Seashore; SP, State Park; NWR, National Wildlife Refuge]
Mississippi River at Main Pass, blank1 Field blank n/a n/a 10/6/2010 0.20 0.16 65 60
South Cat Island Beach, MS MS-37 30.2192 -89.0797 10/14/2010 < 0.25 < 0.25 85 84 83West Ship Island Beach, MS MS-38 30.2075 -88.0797 10/14/2010 < 0.25 < 0.25 101 91 91East Ship Island Beach, MS MS-39 30.2328 -88.8925 10/11/2010 < 0.25 < 0.25 60 63West Horn Island Beach, MS MS-40 30.2403 -88.7350 10/12/2010 < 0.25 < 0.25 102 80East Horn Island Beach, MS MS-41 30.2225 -88.5925 10/12/2010 < 0.25 < 0.25 84 84 76Petit Bois Island Beach, MS MS-42 30.2022 -88.4267 10/13/2010 < 0.25 < 0.25 82 85 84Pass Christian Beach, MS MS-43 30.3161 -89.2361 10/8/2010 < 0.25 < 0.25 56 64Biloxi Beach, MS MS-44 30.3933 -88.2361 10/7/2010 < 0.25 < 0.25 56 69 91Pascagoula Beach, MS MS-45 30.3428 -88.5478 10/14/2010 < 0.25 < 0.25 99 92 83
Biloxi Beach, equipment blank1 Field blank 30.3933 -88.2361 10/6/2010 0.21 0.16 84 84Biloxi Beach, sediment equipment blank1 Field blank 30.3933 -88.2361 10/6/2010 0.13 0.10 55 62
West Dauphin Island, AL AL-1 30.2274 -88.3264 10/13/2010 < 0.25 < 0.25 85 83Dauphin Island, AL AL-2 30.2488 -88.1842 10/7/2010 < 0.25 < 0.25 62 66 88Dauphin Island, AL AL-3 30.2469 -88.0778 10/6/2010 < 0.25 < 0.25 68 71Fort Morgan, AL AL-4 30.2249 -88.0083 10/12/2010 < 0.25 < 0.25 91 105Fort Morgan, AL AL-5 30.2305 -87.9044 10/13/2010 < 0.25 < 0.25 62 63Gulf Shores, AL AL-6 30.2413 -87.7303 10/14/2010 < 0.25 < 0.25 85 86Orange Beach, AL AL-7 30.2691 -87.5816 10/14/2010 < 0.25 < 0.25 80 83 91DWH Oil Spill BLM-1 AL-8, BLM-1 30.2316 -87.9377 10/13/2010 < 0.25 < 0.25 89 83 91DWH Oil Spill BLM-2 AL-9, BLM-2 30.2288 -87.8672 10/14/2010 < 0.25 < 0.25 88 90 79Fort Morgan, AL AL-10, BLM-3 30.2283 -87.8311 10/14/2010 < 0.25 < 0.25 90 86
Blank1 Field lab blank n/a n/a 10/5/2010 0.10 0.08 91 95Blank1 Field lab blank n/a n/a 10/5/2010 0.15 0.13 99 99
14

Replicate 1 Replicate 2 Replicate 1 Replicate 2
Concentration DOSS (mg/L) Recovery 13
C4-DOSS (%)
Table 2. Concentration of di(ethylhexyl) sodium sulfosuccinate (DOSS) in post-landfall coastal Gulf of Mexico water samples between Texas and Florida and associated quality-
control data.
Site name Site ID Latitude Longitude Sample dateMatrix spike
recovery (%)
[ID, identifier; µg/L, microgram per liter; %, percent; <, less than; n/a, not applicable; LA, Louisiana; TX, Texas; MS, Mississippi; AL, Alabama; FL, Florida; BLM, U.S. Bureau of Land Management;
R, river; DWH, Deepwater Horizon; NS, National Seashore; SP, State Park; NWR, National Wildlife Refuge]
Gulf Island NS near Navarre, FL FL-1 30.3624 -86.9702 10/4/2010 < 0.25 < 0.25 76 71Henderson Beach SP near Destin, FL FL-2 30.3829 -86.4428 10/5/2010 < 0.25 < 0.25 81 82Grayton Beach SP near Seaside, FL FL-3 30.3241 -86.1551 10/5/2010 < 0.25 < 0.25 71 77 78St. Andrew's SP near Panama City, FL FL-4 30.1247 -85.7360 10/11/2010 < 0.25 < 0.25 88 76 90St. Joe P. SP near Port St. Joe, FL FL-5 29.7792 -85.4085 10/13/2010 < 0.25 < 0.25 77 86St. George Island SP near E. Point, FL FL-6 29.6979 -84.7678 10/6/2010 < 0.25 < 0.25 102 120St. Mark's NWR near St. Marks, FL FL-7 30.0742 -84.7678 10/7/2010 < 0.25 < 0.25 90 92 77Lathrop Bayou near Panama City, FL FL-25 30.0408 -85.4328 10/12/2010 < 0.25 < 0.25 84 89 85
Equipment blank1 Field blank 30.0742 -84.7678 10/8/2010 0.10 0.08 78 75Equipment blank1 Field blank 30.0742 -84.7678 10/8/2010 0.09 0.11 78 76 1 See Wilde and others (2010) for terms and definitions regarding field blanks, field lab blanks, equipment blanks, and other quality control terms.
15