determination of silver by slotted quartz …etd.lib.metu.edu.tr/upload/12613695/index.pdf ·...
TRANSCRIPT

DETERMINATION OF SILVER BY SLOTTED QUARTZ TUBE ATOM TRAP
FLAME ATOMIC ABSORPTION SPECTROMETRY USING METAL
COATINGS
A THESIS SUBMITTED TO
THE GRADUATE SCHOOL OF NATURAL AND APPLIED SCIENCES
OF
MIDDLE EAST TECHNICAL UNIVERSITY
BY
GAMZE KARAMAN
IN PARTIAL FULFILLMENT OF THE REQUIREMENTS
FOR
THE DEGREE OF MASTER OF SCIENCE
IN
CHEMISTRY
SEPTEMBER 2011

ii
Approval of the Thesis;
DETERMINATION OF SILVER BY SLOTTED QUARTZ TUBE ATOM TRAP FLAME ATOMIC ABSORPTION SPECTROMETRY USING METAL
COATINGS
submitted by GAMZE KARAMANin a partial fulfillment of the requirements for the degree of Master of Science in Chemistry Department, Middle East Technical University by,
Prof. Dr. Canan Özgen Dean, Graduate School of Natural and Applied Sciences
Prof. Dr. İlker Özkan Head of Department, Chemistry Prof Dr. O. Yavuz Ataman Supervisor, Chemistry Department,METU Examining Committee Members: Prof. Dr. G. İnci Gökmen Chemistry Department, METU Prof. Dr. O. Yavuz Ataman Chemistry Department, METU Prof. Dr. A. Rehber Türker Chemistry Department, Gazi University Prof. Dr. Nusret Ertaş Faculty of Pharmacy, Gazi University Assoc. Prof. Dr. Gülay Ertaş Chemistry Department, Bilkent University
Date: 09.09.2011

iii
I hereby declare that all information in this document has been obtained and
presented in accordance with academic rules and ethical conduct. I also declare
that, as required by these rules and conduct, I have fully cited and referenced
all material and results that are not original to this work.
Name, Last name: Gamze Karaman
Signature

iv
ABSTRACT
DETERMINATION OF SILVER BY SLOTTED QUARTZ TUBE ATOM TRAP
FLAME ATOMIC ABSORPTION SPECTROMETRY USING METAL
COATINGS
Karaman, Gamze
M.Sc., Department of Chemistry
Supervisor: Prof. Dr. O. Yavuz Ataman
September 2011, 76 pages
Silver is a precious metal having antibacterial property and widely used in industry
mostly for water purification and medicinal products. Therefore, the determination of
trace levels of silver is important for industrial applications. Flame atomic absorption
spectrometry (FAAS) is a popular technique for the determination of relatively low
concentration levels. This mature technique owes its widespread application to its
simplicity and low cost. However, for some occasions, FAAS technique suffers from
its low sensitivity because of low nebulization efficiency and relatively short
residence time of analyte atoms in the measurement zone. In order to overcome this
sensitivity problem, atom traps have been developed in recent years. Slotted quartz
tube (SQT) is an accessory designed to use as an atom trap in conventional flame
atomic absorption burner head. This thesis study involves the development of a
sensitive, simple and economical technique with the help of the SQT for the
determination silver. Firstly, the technique known as SQT-FAAS was used to
increase the residence time of analyte atoms in the measurement zone. In this case,
limit of detection (LOD) and characteristic concentration (C0) values were found to
be 19 ng/mL and 35 ng/mL, respectively. Enhancement in sensitivity with respect to

v
FAAS was found to be 2.31 fold using SQT-FAAS. Regarding the angle between the
two slots of the SQT, 180° configuration was used. Secondly, in order to improve
sensitivity further, the SQT was used as an atom trap (AT) where the analyte is
accumulated in its inner wall prior to re-atomization. The signal is formed after re-
atomization of analyte atoms on the trap surface by introduction of organic solvent.
For this purpose, uncoated SQT was used as a trap medium. However, there was a
memory effect. Therefore, the SQT inner surface was coated with different coating
elements and theoptimum conditions were found by using W-coated SQT-AT-FAAS
technique. In the presence of a lean air-acetylene flame, analyte atoms were trapped
in the inner surface of the SQT for 5.0 min and then revolatilized with the
introduction of 25 µL isobutyl methyl ketone (IBMK); afterwards, a transient signal
was obtained. These optimized parameters were used for uncoated SQT, W-coated
SQT and Zr-coated SQT atom trap techniques. Sample suction rate was 6.25 mL/min
in all techniques. Sensitivity was increased 54 fold using uncoated SQT-AT-FAAS
technique with respect to simple FAAS technique. When W-coated SQT-AT-FAAS
technique was applied, 135 fold sensitivity enhancement was obtained with respect
to FAAS technique. The best sensitivity enhancement, 270 fold, was obtained using
Zr-coated SQT-AT-FAAS technique. In addition, the Ag signals were more
reproducible (%RSD, 1.21) when Zr was used as a coating element. After the
sensitive technique was developed, interference effects of some transition and noble
metals and hydride forming elements on Ag signals were investigated. Finally,
surface studies were done to determine the chemical state of Ag during trapping
period by using X-ray Photoelectron Spectroscopy (XPS). It was observed that the
Ag analyte is retained on the SQT surface in its oxide form.
Keywords: Silver, flame atomic absorption spectrometry, slotted quartz tube,
tungsten, zirconium, sensitivity enhancement.

vi
ÖZ
YARIKLI KUVARS TÜP ATOM TUZAĞI VE METAL KAPLAMALAR
KULLANARAK ALEVLĠ ATOMĠK ABSORPSĠYON SPEKTROMETRĠYLE
GÜMÜġ TAYĠNĠ
Karaman, Gamze
Yüksek Lisans, Kimya Bölümü
Tez Yöneticisi: Prof. Dr. O. Yavuz Ataman
Eylül 2011, 76 sayfa
GümüĢ, antibakteriyel özelliğe sahip değerli bir metaldir. Endüstride yaygın bir
kullanıma sahiptir; daha çok su saflaĢtırmada ve tıbbi ürünlerde kullanılır. Bu
nedenle eser miktarda gümüĢ tayini endüstriyel uygulamalar için önemlidir. Alevli
Atomik Absorpsiyon Spektrometri (FAAS), göreceli düĢük deriĢimlerin tayini için
popüler bir tekniktir. Bu olgunlaĢmıĢ teknik, yaygın kullanımını kolaylığına ve
ekonomik oluĢuna borçludur. Ancak FAAS yönteminin duyarlılığı bazı durumlar için
yetersiz kalmaktadır. Bu durumun nedeni; sisleĢtirmenin düĢük verimi ve analit
atomlarının ölçüm bölgesindeki kalma süresinin oldukça kısa olmasıdır. Bu
duyarlılık problemini aĢmak için, son yıllarda atom tuzakları geliĢtirilmiĢtir. Yarıklı
kuvars tüp (YKT), ticari alevli atomik absorpsiyon baĢlığında atom tuzağı olarak
kullanılmak üzere tasarlanmıĢ bir aksesuardır. Bu tez çalıĢması; gümüĢ tayini için
YKT yardımıyla duyarlı, kolay ve ekonomik bir teknik geliĢtirmeyi amaçlamaktadır.
Ġlk olarak analit atomlarının ölçüm bölgesindeki kalma süresini artırma amacıyla
YKT-FAAS tekniği kullanılmıĢtır. Bu durumda gözlenebilme sınırı (LOD) ve

vii
karakteristik deriĢim (C0) değerleri sırasıyla 19 ng/mL ve 35 ng/mL olarak
bulunmuĢtur. YKT-FAAS kullanıldığında bulunan C0 değeri, FAAS yönteminden
elde edilen değer ile karĢılaĢtırıldığında 2.31 kat duyarlılık artıĢı gözlemlenmiĢtir.
YKT’nin yarıkları arasındaki açının 180° olduğu durum kullanılmıĢtır. Bir sonraki
aĢamada, duyarlılığı daha da artırmak amacıyla YKT atom tuzağı (AT) olarak
kullanılmıĢtır. Bu yaklaĢımda, analit tekrar atomlaĢmadan önce YKT iç yüzeyinde
toplanır. Sinyal, tuzak yüzeyinde toplanan analit türlerinin organik çözücü varlığında
atomlaĢmasından sonra elde edilmektedir. Bu amaçla boĢ YKTtuzak alanı olarak
kullanılmıĢtır. Ancak hafıza etkisi gözlemlenmiĢtir. Bu nedenle, YKT iç yüzeyi farklı
kaplama elementleri ile kaplanmıĢ ve optimum Ģartlar W kaplı YKT-AT-FAAS
tekniği kullanılarak bulunmuĢtur. DüĢük asetilen akıĢ hızında; analit atomları, 5.0
dakika boyunca YKT iç yüzeyinde toplanır ve sonra 25 µL izobutil metil keton
(IBMK) gönderilmesiyle toplanan analit türleri buharlaĢır ve hızla atomlaĢır. Bu hızlı
atomlaĢmanın ardından pik Ģeklinde bir sinyal elde edilir. Optimize edilen bu
parametreler sırasıyla kaplamasız YKT, W kaplı YKT ve Zr kaplı YKT atom tuzağı
teknikleri için kullanıldı. Örnek akıĢ hızı tüm tekniklerde 6.25 mL/min idi.
Kaplamasız YKT-AT-FAAS tekniği kullanıldığında, duyarlılık FAAS tekniğine göre
54 kat artmıĢtır. W-kaplı YKT-AT-FAAS tekniği uygulandığında, FAAS tekniğine
göre duyarlılıkta 135 kat artıĢ elde edilmiĢtir. En iyi duyarlılık artıĢı Zr kaplı YKT-
AT-FAAS tekniği kullanılarak 270 kat olarak elde edilmiĢtir. Ayrıca kaplama
elementi olarak Zr kullanıldığında daha tekrarlanabilir (%RSD, 1.21) Ag sinyalleri
elde edilmiĢtir. Duyarlı bir teknik geliĢtirdikten sonra, bazı geçiĢ ve soy metaller ile
hidrür oluĢturan elementlerin Ag sinyali üzerindeki giriĢim etkileri incelenmiĢtir. Son
olarak; Ag elementinin YKT yüzeyinde hangi formda toplandığını belirlemek için, X
ıĢınları fotoelektron spektroskopisi (XPS) kullanılarak yüzey çalıĢmaları yapılmıĢtır.
GümüĢ analitinin YKT yüzeyinde oksit formda tutunduğu gözlenmiĢtir.
Anahtar Kelimeler: Alevli Atomik Absorpsiyon Spektrometri, gümüĢ, yarıklı
kuvars tüp, tungsten, zirkonyum, duyarlılık artıĢı.

viii
To My Family

ix
ACKNOWLEDGEMENTS
I would like to record my gratitude to my supervisor Prof. Dr. O. Yavuz Ataman for
his guidance, advice, support and encouragement throughout this research.
I gratefully acknowledge Dr. Yasin Arslan for his endless patience, guidance and
contribution in each part of this study.
I would like to thank Dr. Sezgin Bakırdere for his encouragement and guidance.
I am deeply grateful to Selin Bora, Pınar Akay, Emrah Yıldırım, Feriye ġenol and
Engin ġimĢek for their help, support and friendship.
I want to thank Necati Koç for his help, all AtaMAn Research and C-50 group
members for their understanding and friendship.
I would like to show my gratitude to Gönül Hızalan, Merve Kolay, Nalan Korkmaz
and Sevgi Ġpekçioğlu for their support, love and friendship.
I owe my deepest gratitude to Buğrahan Dikici for his love, trust, patience and
support.
Finally, my special thanks to my mother, father, sisters and brother for their trust,
patience, support and love.

x
TABLE OF CONTENTS
ABSTRACT ................................................................................................................ iv
ÖZ ............................................................................................................................... vi
ACKNOWLEDGEMENTS ........................................................................................ ix
TABLE OF CONTENTS ............................................................................................. x
LIST OF TABLES .................................................................................................... xiii
LIST OF FIGURES .................................................................................................. xiv
LIST OF ABBREVIATIONS .................................................................................. xvii
CHAPTERS ................................................................................................................. 1
1. INTRODUCTION ................................................................................................... 1
1.1 Silver and its Properties ..................................................................................... 1
1.2 Silver and its Uses .............................................................................................. 2
1.3 Silver in Health .................................................................................................. 3
1.4 Determination of Silver ...................................................................................... 4
1.4.1 Atomic Absorption Spectrometry ............................................................... 4
1.4.1.1 Flame Atomic Absorption Spectrometry ............................................. 5
1.4.1.2 Electrothermal Atomic Absorption Spectrometry ............................... 6
1.4.1.3 Chemical Vapor Generation ................................................................. 7
1.4.2 Plasma Techniques ...................................................................................... 7
1.5 Atom Trapping Techniques in Atomic Absorption Spectrometry ..................... 8
1.5.1 Atom Traps for Vapor Generation .............................................................. 9
1.5.1.1 Quartz Trap .......................................................................................... 9
1.5.1.2 Graphite Furnace Trap ....................................................................... 10
1.5.1.3 Metal Trap .......................................................................................... 10
1.5.2 Atom Traps for Flame Atomic Absorption Spectrometry ........................ 11

xi
1.5.2.1 Long-Path Absorption Tube Technique ............................................. 11
1.5.2.2 Delves’ Microsampling Cup Technique ............................................ 12
1.5.2.3 Slotted Quartz Tube FAAS ................................................................ 13
1.5.2.4 Water Cooled U-tube Atom Trap ....................................................... 15
1.5.2.5 Water Cooled U-tube Atom Trap Combined with Slotted Quartz Tube
........................................................................................................................ 17
1.5.2.6 Slotted Quartz Tube Atom Trap FAAS ............................................. 18
1.6 Re-volatilization Techniques in SQT-AT-FAAS ............................................ 19
1.6.1 Flame Alteration Technique ...................................................................... 20
1.6.2 Organic Solvent Aspiration Technique ..................................................... 20
1.7 Surface Studies ................................................................................................. 21
1.8 Aim of the Study .............................................................................................. 22
2. EXPERIMENTAL ................................................................................................. 23
2.1 Apparatus and Materials .................................................................................. 23
2.2 Reagents ........................................................................................................... 23
2.3 Atomic Absorption Spectrometer .................................................................... 24
2.4 Coating Procedure for the SQT ........................................................................ 25
2.5 Surface Studies ................................................................................................. 25
3. RESULTS AND DISCUSSION ............................................................................ 27
3.1 FAAS Technique .............................................................................................. 29
3.1.1 Optimization of Fuel Flow Rate ................................................................ 29
3.1.2 Calibration Plots for FAAS Technique ..................................................... 30
3.2 Slotted Quartz Tube FAAS Technique ............................................................ 32
3.2.1 Optimization of Fuel Flow Rate ................................................................ 32
3.2.2 Optimization of Height of the SQT from the Burner Head ...................... 33
3.2.3 Calibration Plots for SQT-FAAS Technique ............................................ 34
3.3 Slotted Quartz Tube Atom Trap FAAS Technique.......................................... 36
3.3.1 Optimization of Fuel Flow Rate ................................................................ 37
3.3.2 Optimization of Height of the SQT from the Burner Head ...................... 38
3.3.3 Optimization of Organic Solvent Type ..................................................... 38

xii
3.3.4 Optimization of Organic Solvent Volume ................................................ 41
3.3.5 Effect of Trapping Period.......................................................................... 42
3.3.6 Investigation of 90°, 120° and 180° Angled SQT ..................................... 44
3.3.7 Calibration Plots for Uncoated SQT-AT-FAAS Technique ..................... 45
3.3.8 Analytical Figures of Merit ....................................................................... 47
3.4 Investigation of Coating Materials for SQT-AT-FAAS Technique ................ 48
3.5 Calibration Plots for W-coated SQT-AT-FAAS .............................................. 50
3.5.1 Analytical Figures of Merit ....................................................................... 52
3.6 Calibration Plots for Zr-coated SQT-AT-FAAS .............................................. 53
3.6.1 Analytical Figures of Merit ....................................................................... 55
3.7 Evaluation of System Performance .................................................................. 56
3.8 Interference Studies .......................................................................................... 59
3.9 Surface Studies ................................................................................................. 65
3.9.1 Chemical State of Ag on Quartz Surface .................................................. 66
4. CONCLUSIONS .................................................................................................... 69
REFERENCES ........................................................................................................... 71

xiii
LIST OF TABLES
TABLES
Table 2.1 Operating conditions of AA spectrometer ................................................. 25
Table 3.1 Analytical figures of merit for FAAS technique. ....................................... 32
Table 3.2 Analytical figures of merit for SQT-FAAS technique. .............................. 36
Table 3.3 Molecular formulas and flash points of the organic solvents used in the
optimization of organic solvent type. ......................................................................... 40
Table 3.4 Optimum parameters for SQT-AT-FAAS technique. ................................ 43
Table 3.5 Analytical figures of merit for uncoated SQT-AT-FAAS technique. ........ 48
Table 3.6 Comparison of melting and boiling points of Ag, Zr and W. .................... 50
Table 3.7 Analytical figures of merit for W-coated SQT-AT-FAAS technique. ....... 53
Table 3.8 Analytical figures of merit for Zr-coated SQT-AT-FAAS technique. ....... 56
Table 3.9 Comparison of Techniques in Terms of E, Et and Ev Values. .................... 58
Table 3.10 Comparison of LOD values of different techniques with the developed
atom trap techniques in this study. ............................................................................. 59

xiv
LIST OF FIGURES
FIGURES
Figure 1.1 Schematic representation of a long tube absorption cell. (a) Open ended,
(b) T-shaped [51]........................................................................................................ 11
Figure 1.2 Schematic representation of Delves’ microsampling cup system [51]. .... 12
Figure 1.3 Schematic representation of slotted quartz tube [56]. .............................. 14
Figure 1.4 Schematic representation of water cooled U-tube atom trap [51]. ........... 16
Figure 1.5 Schematic representation of integrated atom trap [51]. ............................ 17
Figure 3.1 Optimization of fuel flow rate using 5.0 mg/L Ag in FAAS. ................... 30
Figure 3.2 Calibration plot for FAAS technique. ....................................................... 31
Figure 3.3 Linear calibration plot for FAAS technique. ............................................ 31
Figure 3.4 Optimization of fuel flow rate using 5.0 mg/L Ag in SQT-FAAS. .......... 33
Figure 3.5 Optimization of height of SQT from the burner using 5.0 mg/L Ag in
SQT-FAAS. ................................................................................................................ 34
Figure 3.6 Calibration plot for SQT-FAAS technique. .............................................. 35
Figure 3.7 Linear calibration plot for SQT-FAAS technique. ................................... 35
Figure 3.8 Optimization of fuel flow rate using 100.0 ng/mL Ag in SQT-AT-FAAS.
.................................................................................................................................... 37
Figure 3.9 Optimization of height of SQT from the burner head using 100.0 ng/mL
Ag in SQT-AT-FAAS. ............................................................................................... 38
Figure 3.10 Effect of organic solvents on Ag signals using 100.0 ng/mL Ag in SQT-
AT-FAAS. .................................................................................................................. 41
Figure 3.11 Optimization of organic solvent volume using 100 ng/mL Ag in SQT-
AT-FAAS. .................................................................................................................. 42
Figure 3.12 Optimization of trapping period using 100 ng/mL Ag in SQT-AT-FAAS.
.................................................................................................................................... 43

xv
Figure 3.13 The signal of W-coated SQT-AT-FAAS for 100.0 ng/mL Ag in optimum
conditions given in Table 3.4. .................................................................................... 44
Figure 3.14 Performance of 90°, 120° and 180° angled SQT using 100 ng/mL Ag in
SQT-AT-FAAS. ......................................................................................................... 45
Figure 3.15 Calibration plot for uncoated SQT-AT-FAAS. ...................................... 46
Figure 3.16 Linear calibration plot for uncoated SQT-AT-FAAS. ............................ 46
Figure 3.17 The signal of uncoated SQT-AT-FAAS for 50 ng/mL Ag in optimum
conditions (Table 3.4). ............................................................................................... 47
Figure 3.18 Effect of coating materials for 100 ng/mL Ag signal in SQT-AT-FAAS.
.................................................................................................................................... 49
Figure 3.19 Calibration plot for W-coated SQT-AT-FAAS. ..................................... 51
Figure 3.20 Linear calibration plot for W-coated SQT-AT-FAAS............................ 51
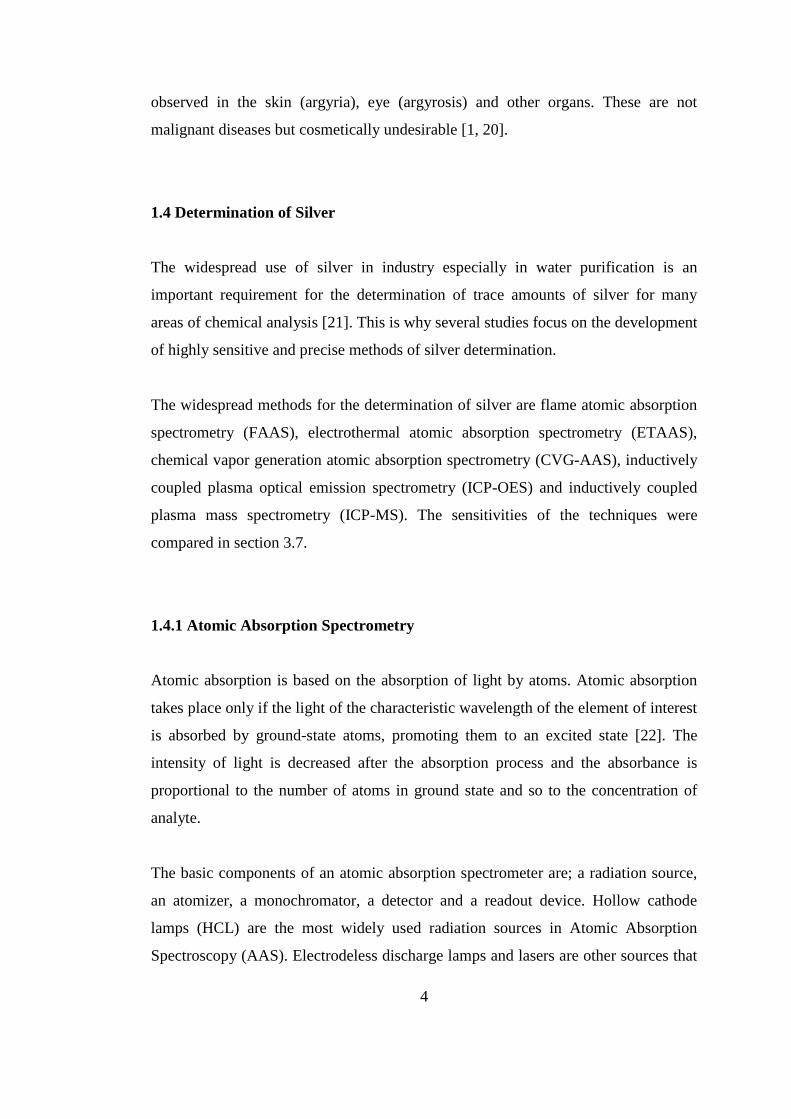
Figure 3.21 The signal of W-coated SQT-AT-FAAS for 30 ng/mL Ag in optimum
conditions (Table 3.4). ............................................................................................... 52
Figure 3.22 Linear calibration plot for Zr-coated SQT-AT-FAAS............................ 54
Figure 3.23 The signal of Zr-coated SQT-AT-FAAS for 40 ng/mL Ag in optimum
conditions (Table 3.4). ............................................................................................... 55
Figure 3.24 Flame absorption profiles for three elements [73]. ................................. 57
Figure 3.25 Interference effects of Cu, Zn and Au on the analytical signal of 50.0
ng/mL Ag using Zr-coated SQT-AT-FAAS. ............................................................. 60
Figure 3.26 Interference effects of Pt, Cd and Ni on the analytical signal of 50.0
ng/mL Ag using Zr-coated SQT-AT-FAAS. ............................................................. 61
Figure 3.27 Interference effects of Fe, Mn and Co on the analytical signal of 50.0
ng/mL Ag using Zr-coated SQT-AT-FAAS. ............................................................. 62
Figure 3.28 Interference effects of Se, Sb and As on the analytical signal of 50.0
ng/mL Ag using Zr-coated SQT-AT-FAAS. ............................................................. 63
Figure 3.29 Interference effects of Hg, Sn and Bi on the analytical signal of 50.0
ng/mL Ag using Zr-coated SQT-AT-FAAS. ............................................................. 64
Figure 3.30 Interference effects of Tl, In and Pb on the analytical signal of 50.0
ng/mL Ag using Zr-coated SQT-AT-FAAS. ............................................................. 65
Figure 3.31 XPS spectrum of Ag on quartz surface................................................... 66

xvi
Figure 3.32 XPS spectrum of C on quartz surface. .................................................... 67
Figure 3.33 XPS spectrum of Ag 3d5/2 and Ag 3d3/2 on quartz surface. ..................... 68

xvii
LIST OF ABBREVIATIONS
ABBREVIATIONS
AAS Atomic Absorption Spectrometry
CVG-AAS Chemical Vapor GenerationAtomic Absorption
Spectrometry
ETAAS Electrothermal Atomic Absorption Spectrometry
FAAS Flame Atomic Absorption Spectrometry
GFAAS Graphite Furnace Atomic Absorption
Spectrometry
IBMK Isobutyl Methyl Ketone
ICP-MS Inductively Coupled Plasma Mass Spectrometry
ICP-OES Inductively Coupled Plasma Optical Emission
Spectrometry
SQT Slotted Quartz Tube
SQT-AT Slotted Quartz Tube Atom Trap
SQT-AT-FAAS Slotted Quartz Tube Atom Trap Flame Atomic
Absorption Spectrometry
SQT-FAAS Slotted Quartz Tube Flame Atomic Absorption
Spectrometry
W Coated SQT-AT-FAAS Tungsten Coated Slotted Quartz Tube Atom Trap
Flame Atomic Absorption Spectrometry
XPS X-Ray Photoelectron Spectroscopy
Zr Coated SQT-AT-FAAS Zirconium Coated Slotted Quartz Tube Atom Trap
Flame Atomic Absorption Spectrometry

1
CHAPTER 1
INTRODUCTION
1.1 Silver and its Properties
Silver is a soft and lustrous white transition metal which is the sixty-fourth most
abundant element in the Earth’s crust. Its atomic number is 47 and atomic mass is
107.9 amu. The word Silver derives from the Anglo-Saxon seolfor or siolfur and its
symbol comes from Latin argentum [1].
It is not known when silver is discovered, however there are some evidences related
with historical background of silver. Some objects that are made up of silver have
been recovered from sites of ancient civilizations of China, Egypt, South America
and Middle East dating from 2000BC. The largest producers of silver in the world
include Mexico, Peru, the United States, Canada, Poland, Chile and Australia [2].
Silver occurs in association with other metal ores; gold, copper, lead, zinc, mercury,
arsenic, antimony, molybdenum and tellurium [1, 3]. It is also found in some 60
minerals including: argentite (silver sulfide), proustite (complexed with arsenic and
sulfur), cerargyrite (silver chloride) and hessite (complexed with tellurium) [1, 4].
Silver is a metallic element having the lowest contact resistance and therefore it has
the highest thermal and electrical conductivity of all metals in the Periodic Table [1].

2
Silver extracted commercially is 99.9% pure. Pure silver is stable in air but it
tarnishes when exposed to air containing sulfur or hydrogen sulfide, ozone [1].
Silver is rarely found in the Earth’s crust and its abundance is thought to be 0.1
mg/L. It is also found in sea water and its abundance there is estimated to be 0.01
mg/L. It occurs as cubic crystals and there are two naturally occurring isotopes of
silver exist: 107
Ag and 109
Ag. These occur in similar proportions. Totally thirty five
isotopes of silver are known and about sixteen of them are radioactive [1].
1.2 Silver and its Uses
Silver is unique metal with its antibacterial property [5-7]. Through this property,
silver has widespread usage in industry. This element with its compounds and alloys
are used in medicinal science and surgery [8-10] for processing drugs [11-13],
production of dental fillings [6]. In addition to these, implants and many medical
devices are treated with silver to prevent infection risk [5, 14].
Silver is probably the first metal known to have antimicrobial activity, so for many
years it was also used for water purification. Moreover its compounds are added to
different products such as foods, beverages and clothing for disinfection [15]. The
production of clothing for hospitals and some domestic products is a new science for
silver uses [1].
On the other hand, silver has an important role in industrial applications for use in
preparation of high-strength and corrosion-resistance alloys and jewellery. It is also
used in the production of electronic devices, photographic films and mirrors [6, 12,
13].

3
1.3 Silver in Health
Silver is ubiquitous in the human environment. It is found everywhere; in the soil, in
drinking water, in the air we breathe and in foods. It is absorbed into the human body
through drinking water, diet and by inhalation. The greatest majority of people
exhibit low levels of silver in their blood plasma or body tissues without any
metabolic disturbances or clinical signs. The amount of silver in the human body is
very low (<2.3 µg/L), however for the people who are working in silver industries
higher amounts can be observed [1].
Metallic silver is inert in the presence of human tissues but in the presence of body
fluids and secretions it readily forms silver ion (probably Ag+) which is biologically
active and is metabolized to most part of the body [16, 17].
Silver has a worldwide acceptance as a broad spectrum antibiotic. Laboratory studies
have shown that it can be used to control most pathogenic bacteria and parasitic
infections including the methicillin-resistant strains of Staphylococcus aureus
(MRSA) which is a bacterium responsible for several infections and have proved
fatal in many aged and immunocompromised people [1].
As mentioned in section 1.2, silver is frequently used for industrial applications. In
addition, silver impregnated filters are used in the preparation of drinking water [15].
Therefore, its concentration increases in aquatic ecosystems. World Health
Organization (WHO) permits 0.1 mg/L of silver ions as a maximum concentration in
drinking water disinfection, on the other hand United States Environmental
Protection Agency (USEPA) recommends 0.05 mg/L silver ions as a maximum [18,
19].
Silver deposition by chronic ingestion or inhalation of colloidal silver leads to
argyria which is characterized by gray to gray-black staining of the skin and mucous
membranes. Silver may be deposited in the skin either from industrial exposure or a
result of medications containing silver salts. Deposition of silver particles can be
4
observed in the skin (argyria), eye (argyrosis) and other organs. These are not
malignant diseases but cosmetically undesirable [1, 20].
1.4 Determination of Silver
The widespread use of silver in industry especially in water purification is an
important requirement for the determination of trace amounts of silver for many
areas of chemical analysis [21]. This is why several studies focus on the development
of highly sensitive and precise methods of silver determination.
The widespread methods for the determination of silver are flame atomic absorption
spectrometry (FAAS), electrothermal atomic absorption spectrometry (ETAAS),
chemical vapor generation atomic absorption spectrometry (CVG-AAS), inductively
coupled plasma optical emission spectrometry (ICP-OES) and inductively coupled
plasma mass spectrometry (ICP-MS). The sensitivities of the techniques were
compared in section 3.7.
1.4.1 Atomic Absorption Spectrometry
Atomic absorption is based on the absorption of light by atoms. Atomic absorption
takes place only if the light of the characteristic wavelength of the element of interest
is absorbed by ground-state atoms, promoting them to an excited state [22]. The
intensity of light is decreased after the absorption process and the absorbance is
proportional to the number of atoms in ground state and so to the concentration of
analyte.
The basic components of an atomic absorption spectrometer are; a radiation source,
an atomizer, a monochromator, a detector and a readout device. Hollow cathode
lamps (HCL) are the most widely used radiation sources in Atomic Absorption
Spectroscopy (AAS). Electrodeless discharge lamps and lasers are other sources that

5
are also popular in this technique. Atomizer is used to produce the ground state
atoms from the analyte molecules or ions. Most commonly used atomizer is flame
atomizer which is employed with air/acetylene and nitrous oxide/acetylene flames.
Graphite furnace is also used as an atomizer in AAS systems [23].
Flame atomic absorption spectrometry (FAAS), electrothermal atomic absorption
spectrometry (ETAAS) and chemical vapour generation atomic absorption
spectrometry (CVG-AAS) are the techniques used for the determination of silver.
Among all, FAAS is still the most preferred technique in the determination of trace
metals because of its high specificity and low cost [24].
1.4.1.1 Flame Atomic Absorption Spectrometry
Flame AAS can be used for the determination of trace levels of analyte in a wide
range of sample types [22]. Typically, in FAAS the sample solution is aspirated into
the flame in the form of an aerosol generated through a nebulizer which forms fine
droplets. This step is known as nebulisation. Then, the aerosol reaches the flame
(atomizer) where desolvation, volatilization and dissociation steps take place to
produce ground state atoms of the analyte [25]. Most common flames are air-
acetylene and nitrous oxide-acetylene flames. An air-acetylene flame at 2100-2400
°C has been mostly used for the determination of majority of elements. A nitrous
oxide-acetylene flame at 2600-2900 °C has been preferred for refractory elements
due to its high temperature [26]. In case of silver determination, air-acetylene flame
is used.
FAAS is quite popular; however the sensitivity of the technique is limited by two
factors. The first one is poor nebulization efficiency of the system, only 1-10% of the
sample solution reaches the flame. A further limitation is the relatively short
residence time of analyte atoms in the measurement zone during sample aspiration;
this is estimated to be in the order of few milliseconds when flame atmosphere is
considered [27].

6
Despite its low sensitivity, FAAS is still an important technique for analysis of trace
elements owing to its simplicity, low cost and its convenience to sensitivity
improvements.
1.4.1.2 Electrothermal Atomic Absorption Spectrometry
Electrothermal atomization is performed by graphite furnace, open filament, or
vertical crucible furnace devices [23]. Among them graphite furnace atomizer which
was first introduced by L’vov in 1959 is the most widely used ETAAS technique
[28]. This is the reason why ETAAS is also known and often named as graphite
furnace atomic absorption spectrometry (GFAAS).
In ETAAS or GFAAS technique, a small amount of sample (5-100 µL) is placed in
an electrically heated graphite tube which is shaped like a cylinder having a hole in
the center of the tube wall for sample introduction. The tube ends are open for the
passage of light from source and removal of the sample constituents [25]. The
ETAAS determination consists of three stages. The drying stage is applied to remove
the solvent from sample at temperatures near the boiling point of the solvent (around
100°C). The aim of second stage known as ashing is to remove the sample matrix as
much as possible; this involves heating the tube between 350 and 1200°C. In
atomization stage, free atoms of the element are produced in the presence of high
temperatures (2000-3000°C) and then the absorption by atomic vapor is measured
[29]. In drying and ashing stages, an inert gas (Ar or N2) is passed through the
system in order to remove any extraneous material. However, the flow must be
stopped during atomization in order to prevent dilution and analyte loss [22].
In atomization stage, the residence time of analyte atoms in the measurement zone is
relatively longerwith respect to FAAS. Hence the sensitivity also increases and µg/L
working ranges may be possible. Also, the transport efficiency of the system reaches
100% which is considerably higher than FAAS technique. Even though ETAAS
seems better when compared with FAAS, it has important deficiencies. One of them

7
is the presence of interferences especially in case of heavy matrices. Another
disadvantage is the cooler ends of the tube which hold the analyte atoms that are
volatilized. Since the atomization is not homogeneous, multiple peaks and peak
broadening may be observed [30]. This disadvantage has been largely eliminated by
the recently developed transversely heating techniques.
1.4.1.3 Chemical Vapor Generation
Chemical vapor generation is a sample introduction technique based on separation of
analyte element from the matrix by the generation of gaseous species. In acidic
environment analyte is reduced by sodium tetrahydroborate (III) and is liberated in
the form of volatile species. This volatilized analyte can be detected by different
methods of atomic spectroscopy [31].
The technique has significant advantages. One of them is reduction or elimination of
interferences after efficient separation of matrix. Another advantage is the high
efficiency of transport of analyte to the detector. Moreover this vapor generation
system enables to use of gas phase separation methods for speciation analysis [32].
There are several studies in literature where this technique was used for the
determination of silver [33-38].
1.4.2 Plasma Techniques
ICP-OES is a type of plasma technique that can be used for the determination of
trace elements. The technique enables to measure different elements at the same time
[39]. In ICP-OES, generally liquid samples are analyzed. Sample is nebulized into
the plasma and evaporation is followed by conversion of sample into excited free
atoms and ions. These excited free atoms and ions emit electromagnetic radiation at
wavelengths that is characteristic for a particular element. This radiation at particular

8
wavelengths is used for qualitative analysis and the measured intensities at these
wavelengths are used for quantitative analysis of the elements [23]. The technique
has several advantages such as there is no need to use a hollow cathode lamp,
simultaneous multi-element detection is possible and since the sample flow rate (~ 1
mL/min) is lower than the sample flow rate of AAS techniques (~ 6 mL/min),
volume of sample in the analysis is smallerthan AAS techniques. In addition to these
it has high sensitivity and large dynamic range [30].
ICP-OES is applied with different sample introduction techniques for the
determination of silver; chemical vapour generation-ICP-OES (CVG-ICP-OES) has
been frequently used in literature [37, 40].
ICP-MS which is commercialized in 1983 has unique features with its extremely low
detection limits at sub-ppt levels [25]. This plasma technique is the marriage of
inductively coupled plasma (ICP) which is operating at atmospheric pressure and
mass spectrometry (MS) which is operating under high vacuum. An ion source (ICP)
converts sample (usually in liquid form) into positively charged ions. The mass
analyzer sorts ions according to their mass-to-charge ratio (m/z). Differently from
other techniques like ETAAS, FAAS, ICP-OES; the technique has the ability to
measure isotope ratios [29]. ICP-MS has further advantages; high-speed analysis is
one of them. Another advantage is due to high sensitivity of the system further
dilution can be done and then matrix interferences are reduced. In addition to these,
the technique has wide linear dynamic range. Similar with ICP-OES, multiple
element determination is possible simultaneously [30].
ICP-MS has been used for the determination of silver in literature [41-43].
1.5 Atom Trapping Techniques in Atomic Absorption Spectrometry
Atom traps are developed in order to improve the sensitivity of the techniques. This
is done by collection of analyte atoms within the body of the atomizer. There is no

9
need to use additional chemicals that result contamination problem when atom traps
are used. In addition these traps have low cost and simple instrumentation [44].
In CVG; quartz trap, graphite furnace trap and metal trap are used for
preconcentration. For FAAS, long-path absorption tube, Delves’ microsampling cup
and slotted quartz tube are used in order to increase residence time of analyte atoms;
integrated atom trap and slotted quartz tube atom trap are used for preconcentration.
1.5.1 Atom Traps for Vapor Generation
As mentioned in section 1.4.1.3, vapor generation is popular due to matrix
elimination and high transport efficiency of analyte. In addition to these its
popularity based on another property; sensitivity improvement is possible by simple
preconcentration techniques such as atom traps.
Atom trapping is based on collection of analyte species on the surface of an atom
trap and sending the atoms to the detector as rapidly as possible. Finally a transient
signal is obtained and either the area or height can be used as the analyte signal [30].
1.5.1.1 Quartz Trap
The quartz atom traps are obtained by heating the quartz pieces externally. The inlet
arm of the quartz T-tube is used directly or some quartz pieces are placed for this
purpose. The generated volatile analyte species are collected on the quartz surface
and then the temperature is further increased for the revolatilization of the analyte
atoms. At this stage, hydrogen gas is sent to the system to create a reducing
environment for revolatilizaiton [45]. External heating is the critical point of the
system since it takes long time [30]. Dedina [46] used microflame in addition to the
external heating to overcome time problem. Oxygen gas is sent to the system and the
reaction between oxygen and hydrogen forms microflame.

10
1.5.1.2 Graphite Furnace Trap
The volatile analyte species are trapped on the surface of the graphite tube and these
collected species are revolatilized and atomized with the increasing temperature.
Then a transient signal is obtained [30].
Graphite furnace trap has lower sensitivity than quartz trap because of limited
surface area. Also it has higher cost than quartz trap. However it is easy to operate
and provides better tolerance to atomization interferences [47].
1.5.1.3 Metal Trap
Another approach is using metal surfaces as a trapping medium. In this case no
external heating is applied; metal itself is resistively heated by the passage of
electricity. Since the metal has higher thermal conductivity than quartz, it is easy to
reach high temperatures in a short time. Typically tungsten is used as a metal trap
due to its high melting point and low cost [27].
In literature, W-coil was used as an atom trap in combination with a T-tube atomizer
for the determination of Bi [48]. Also, it is used both for trapping medium and
atomizer for the determination of Se [49].
Unfortunately, in metal trap systems oxidation of W-coil is inevitable and this affects
the system performance. To overcome this problem hydrogen gas is sent to the
system and a reducing medium is created [30].

11
1.5.2 Atom Traps for Flame Atomic Absorption Spectrometry
As mentioned previously in section 1.4.1.1, there are some problems in FAAS
technique. Atom traps in FAAS mainly aim to overcome these sensitivity problems
with in-situ preconcentration of the analyte atoms [50].
1.5.2.1 Long-Path Absorption Tube Technique
These prolonged absorption tubes are arranged on the basis of Beer’s law which
states that absorbance is directly proportional to the path length of the sample cell.
As shown in Figure 1.1, these tubes can be T-shaped or open-ended. In the
technique, since the absorption medium is confined by the tube, probable
contamination from outside atmosphere is prevented and the concentration of free
atoms increases. Here the critical point is the mean lifetime of free atoms which
varies with the element, the temperature and also the composition of flame gases
[51].
Figure 1.1 Schematic representation of a long tube absorption cell. (a) Open ended,
(b) T-shaped [51].

12
The absorption tube technique was used for the determination of silver, copper, gold
and cadmium in propane-butane-air flame and sensitivity improvement was 5-13 fold
[52]. In another study, 45 cm long silica tube was used to investigate the fuel flow
rate effect on several elements (copper, silver, gold, cadmium, tin, lead, antimony,
bismuth, manganese and rhodium) [53].
Even though the studies with using long-path absorption tube are favorable, the tube
has not been utilized commercially since it is too long to place into the burner head
of standard atomic absorption spectrometer [51].
1.5.2.2 Delves’ Microsampling Cup Technique
Delves’ microsampling cup technique is the best method reported for microsample
analysis with a flame atomizer [54]. As can be seen in Figure 1.2, sample is placed in
a sampling boat and the absorption tube is above the long path flame. By this way the
vaporized species from crucible are collected in absorption tube which is placed
above the source [51].
Figure 1.2 Schematic representation of Delves’ microsampling cup system [51].

13
In 1970, the technique was used for the detection of lead in blood. In this case, 10 µL
of sample is placed in micro crucible which is made up of nickel foil. The nickel
absorption tube was above the air-acetylene flame which was 20 mm height from the
burner head. The atomization is occurred inside the tube and the source radiation was
passing along the axis of tube [54]. The sensitivity is increased when this technique
is applied because the transport efficiency is high and also residence time of analyte
atoms in the measurement zone is long due to prolonged absorption tube. Here, the
most important point is all these are possible with small volume of samples.
The technique was proposed for the analysis of clinical, environmental and industrial
samples [51]. It was particularly used for the determination of lead and cadmium at
sub-ppm levels in biological samples. This trap system was manufactured in the
1970s; however, it has not been commercially available for a long time [51].
1.5.2.3 Slotted Quartz Tube FAAS
Slotted quartz tube, illustrated in Figure 1.3, was an accessory firstly designed and
also used by Watling in 1977 [55]. The tube was designed to use in the conventional
flame atomic absorption burner head and aimed to increase the sensitivity and
precision for trace metals. This quartz tube which is aligned with the optical path of
the spectrometer has two parallel slots; the entrance slot (lower), aligned directly
above the flame, allows the passage of flame to the inside of the tube and the exit slot
(upper) eliminates the possible damages to lens of the spectrometer [55]. The
entrance and exit slots may be positioned at 120° or 180° to each other [23]. The tube
is typically made up of quartz which has high melting point and low thermal
expansion coefficient. However stainless steel, graphite and silicon nitride are also
used while making slotted tubes [51].

14
Figure 1.3 Schematic representation of slotted quartz tube [56].
This double-slotted tube, placed into air-acetylene flame with the help of asbestos
blocks, was used for the analysis of trace metals in fresh water. The height of the
SQT above the burner head was 5.0 mm and it was fixed. A significant increase (9
fold) in analytical sensitivity was obtained for Ag and 2-5 fold increase in sensitivity
was obtained for Zn, Cd, Bi, Pb, As, Sb, Se and Hg in comparison with conventional
FAAS. On the other hand for elements such as Co, Ni, Cu, Mn and Fe; a little
enhancement (1-2 fold) was observed in absorbance signal. However, precision at
low concentrations was improved for majority of elements since the tube walls
controlled the flame dimensions through the absorption path and reduce the
instrumental noise formed by flame flicker [55, 57]. In another study, the SQT was
used in conjunction with different types of flames (air-acetylene, air-hydrogen,
argon-hydrogen) for the determination of As, Sb, Se and Hg. When the SQT was
used in conjunction with air-acetylene flame, up to 10 fold increase in sensitivity was
observed [58]. These studies have shown the achievement of the SQT regarding
sensitivity and precision improvement as compared to conventional FAAS. There are
several reasons contribute to these results. One of the reasons is that in the presence
of the SQT, flame speed through the absorption path is slower than original flame
and also the optical path is longer; therefore residence time of analyte atoms in the
measurement is increased. Another reason is the stability of chemical environment
inside the tube because of the elimination of oxidizing species present in

15
conventional flame. In this way, the amount of neutral atoms inside the tube is also
stable [55].
Slotted quartz tubes can be used with hydride generation technique, flow injection
systems and used in conjunction with discrete nebulization instead of pneumatic
nebulization. On the other hand various modifications can be done such as changing
dimension and length of the tube. In all cases, the aim of the SQT is sensitivity
improvement [51].
To sum up, slotted quartz tube is suitable for simple and rapid analysis of samples.
Quartz has low cost and is easily manufactured [55]. As mentioned at the beginning
sensitivity increased with this system, however it should be underlined that slotted
quartz tube provided only momentary sensitivity improvement with conventional use
of flame [27].
1.5.2.4 Water Cooled U-tube Atom Trap
Water cooled U-tube atom trap, illustrated in Figure 1.4, was first proposed by Lau et
al. [59]. This silica U-tube, positioned just below the optical path, was placed into
air-acetylene flame. The tube was designed in U-shape for the entrance and exit of
water or air into the system. In this system, the sample solution aspirated by
conventional nebulizer is collected on the outer surface of the U-tube while the tube
is cooled by the passage of the cold water. The analyte species are condensed on the
cool surface of the tube. After collection stage, the cold water flow is replaced by
pressurized air and the U-tube surface undergoes rapid heating. By this heating,
analyte species are released into the flame and a transient signal is obtained [27].

16
Figure 1.4 Schematic representation of water cooled U-tube atom trap [51].
The water cooled U-tube is probably the first application of quartz as an atom trap
[60]. There are several studies concerning this system. In one study, the mechanism
of the atomization in water cooled U-tube atom trap was investigated and found that
elements such as Ag, Au, Cd, Co, Cu, Fe, Ni, Pb, Se and Zn were trapped on the
cooled surface as metals while other elements such as K, Li, Na, Cr, Mg and Mn
were trapped as silicates or oxides [61]. In other studies, different materials such as
titanium, nickel, stainless-steel and copper are used for making U-tube instead of
quartz. The aim of the researchers was to obtain colder surfaces that were able to
collect more volatile species. However the idea was not so successful since
intermetallic compounds were formed. In addition to these cooling-heating step
caused physical deformations when titanium and stainless steel were used [62, 63].
Chinese researchers developed a modified water-cooled stainless steel trap for the
determination of Ag in water and found the characteristic concentration and detection
limit as 0.18 ng/mL and 0.29 ng/mL, respectively [64].
To sum up, the U-tube technique which involves atom trapping and preconcentration,
has some advantages that it is simple to apply, has low cost and also can be used for
the analysis of various materials. Although the technique is more sensitive than
slotted quartz tube, has a drawback that large volume of sample is needed due to long
collection time (about 2 min for a measurement) [51].

17
1.5.2.5 Water Cooled U-tube Atom Trap Combined with Slotted Quartz Tube
The advantages of water cooled U-tube atom trap and slotted quartz tube were
combined in a new hybrid atom trap by Roberts and Turner [60]. This new trap,
which was named as slotted-tube water-cooled atom trap or STWCAT, consisting of
water cooled U-tube which was placed into the slotted quartz tube. By using new
hybrid trap, high sensitivity and good precision were obtained in the determination of
Cd and Pb in river water. However, there was a noise in signals due to water vapor
[60].
Matusiewicz and Kopras developed and used the combination of SQT and water
cooled U-tube and referred to as an integrated atom trap (IAT). IAT, shown in Figure
1.5, had similar arrangement with STWCAT. It was used for the determination of
Ag, Cd, Cu, Fe, In, Mn, Pb, Tl and Zn in beer. Detection limits were in the range of
0.1-10 ng/mL while using IAT technique [65].
Figure 1.5 Schematic representation of integrated atom trap [51].
This atom trap technique is so simple and rapid for trace element analysis. It is also
more sensitive than SQT and water cooled U-tube. Hence it can be suggested to use
in the absence of ETAAS [51].

18
1.5.2.6 Slotted Quartz Tube Atom Trap FAAS
As mentioned in integrated atom trap system, volatile species are released from the
tube after the passage of air instead of cold water. In this system, analyte species that
are collected inside the SQT, are released by the organic solvent aspiration which
changes the flame composition [66]. The details of the technique are given below:
(i) The SQT is placed above the flame and aligned with the optical path of the
spectrometer. Sample solution is aspirated via pneumatic nebulization into the SQT
and analyte species are collected on the inner surface of the SQT using optimized
flame. This few minutes long step is called collection.
(ii) After collection step, a small volume (10-50 µL) organic solvent is
aspirated to the flame and alters the flame composition momentarily. This momently
change releases analyte atoms from the trapping medium so called revolatilization
step. IBMK (isobutyl methyl ketone) is the most commonly used organic solvent in
revolatilization step.
(iii) Finally rapid atomization takes place and a transient signal is obtained.
SQT-AT-FAAS technique has several advantages. One of them is the SQT is easily
aligned with respect to the optical path that signal-to-noise ratio is similar with
simple FAAS technique. Secondly, revolatilization step takes only few seconds and
sharp signals are obtained. Also a significant increase is observed in sensitivity,
therefore sample solutions could be diluted and this leads a decrease in interferences.
In addition to these, this technique is simple and has low cost and few milliliters of
sample are sufficient for the analysis [27].
There are several parameters that should be optimized before the sample analysis.
Flame composition is one of them. Typically fuel-lean or stoichiometric flame is
used in collection step; however fuel content of flame must be separately optimized
for each element.Another parameter is the height of the SQT from the burner head

19
which should be as close as possible to the burner. The reason is the efficient
introduction of sample into the tube and then better trapping efficiency of analyte
species. Sample suction rate is also optimized. In case of lower suction rate,
nebulization efficiency and so trapping efficiency are better. Therefore, mass
sensitivity is higher for lower rates. To select proper organic solvent and find the
optimum volume for this solvent are another important processes throughout
optimizations. IBMK is commonly used as an organic solvent since it provides rapid
and complete atomization of analyte atoms. Finally the effect of trapping period
which is also known as collection period should be optimized in trap studies. The
sensitivity increases with the increasing trapping period as a result of increasing
analyte concentration in trap medium. However, rapidity of the technique is also
importantto compete with other techniques such as ETAAS [27].
In literature there are several studies regarding SQT-AT-FAAS technique. DemirtaĢ
has studied the determination of Pb by Ta-coated SQT-AT-FAAS technique and she
obtained 1650 fold enhancement in sensitivity with respect to FAAS technique [67].
In another application; Bi, Au and Mn determination by using the combination of
water-cooled U-tube and uncoated SQT atom traps was studied and sensitivity
improvements as compared to FAAS technique are 94, 180 and 6.6 fold respectively
[68].
Apart from these; by using slotted silica tube atom trap, interference effects of some
salts on Bi, Cd, In, Pb and Sb signals were studied. It was observed that there was a
devitrification problem because of salts [69]. In another study, revotilization
mechanisms were investigated using Bi, Au, Mn, Cd and Pb as an analytes [50].
1.6 Re-volatilization Techniques in SQT-AT-FAAS
Two techniques are suggested regarding re-volatilization:

20
1.6.1 Flame Alteration Technique
In flame alteration technique, fuel content of flame is increased after the collection
step to revolatilize the analyte species [50].
The acetylene flow was divided into two streams which are controlled by further
flow meters. In collection step, acetylene from one stream was sent to the waste and
the other one was sent to the flame via valve. At the end of the collection, the stream
sending to the waste was adjusted to send to the flame also. Since all acetylene
streams were sent to the flame, it became stoichiometric or fuel-rich. Hence the
flame composition was altered, analyte atoms were rapidly reatomized and a sharp
signal was obtained [70].
1.6.2 Organic Solvent Aspiration Technique
In this technique, trapped analyte species were revolatilized with the aspiration of
small volume of organic solvent [70].
With the application of this technique, the effect of temperature on revolatilization
was investigated [50]. For this purpose water cooled U-shaped silica trap was used.
All conditions were kept constant and the air temperature inside the tube was
measured with the thermocouple. Different organic solvents were aspirated to the
flame and temperature changes were monitored. It was observed that when organic
solvent is aspirated to the flame, the flame temperature is either decreased or
increased at insignificant level and revolatilization took place in either
case.Therefore, the results showed that the revolatilization process by organic solvent
aspiration technique is not thermal [50].
Momentarily increase of fuel in flame gases is followed by revolatilization of analyte
species by either flame alteration technique or organic solvent aspiration technique
[27]. In the previous experiment it was found thatthe revolatilization is not directly

21
related with an increase in flame temperature [50]. Therefore, another experiment
was performed to verify whether a contact between flame gases and quartz surface
was necessary for revolatilization [50]. This time analyte species were collected on
the inner surface of slotted silica tube and revolatilization was tried after rotating the
tube around its long axis by 90°. The revolatilization was attempted by either organic
solvent aspiration or flame alteration. However no signal was obtained at this
position of slotted tube. When the tube was rotated 90° (back to its original position),
the revolatilization was successful by either technique and there was a peak shaped
signal. This experiment showed that there should be a physical contact between
flame gases and silica surface for revolatilization process [50].
Several experiments showed that the sensitivities of both revolatilization techniques
were comparable [70]. However, organic solvent aspiration technique is easy to
apply since there is no need for extra gas [66].
1.7 Surface Studies
To improve the sensitivity and also to prevent the devitrification of SQT, inner
surface of SQT may be coated with some elements such as W, Ta, Ir, Au, Os, Mo,
Zr, Ti and Pd. While deciding the coating element, the critical point is that the
melting point of the coating element should be significantly higher than the boiling
point of the element of interest. In other words, it is desired that the coating element
will not be lost before the revolatilization of analyte.
Nature of analyte species collected on the SQT surface was investigated by X-ray
photoelectron spectroscopy (XPS), which is also known as electron spectroscopy for
chemical analysis (ESCA), is a technique used for the measurement of the elemental
composition, empirical formula, chemical state and electronic state of the elements
[71]. Elements produce characteristic XPS peaks at particular binding energies. By
using XPS spectra, it is possible to identify the element of interest and also its

22
oxidation states on the surface. These peaks correspond to the electron configuration
of the analyte species.
1.8 Aim of the Study
Silver is the least expensive of the precious metals which are valued for their beauty
and relative scarcity in the Earth’s crust, and their superior properties. The
determination of trace levels of silver plays an important role because of the
widespread usage of silver especially in industrial applications.
The main purpose of this study is to develop a sensitive analytical technique for the
determination of trace levels of silver. High sensitivity alone is not sufficient for a
technique; simplicity and low cost are also important. ICP-MS is a good example for
this criterion; although the technique provides sensitive measurements, its cost is too
high for most laboratories. On the other hand, ETAAS suffers both from high cost
and interferences. FAAS technique has low sensitivity without preconcentration for
trace analysis.
Therefore, in this study; SQT-AT-FAAS techniques are used for the determination of
silver. At the beginning, FAAS and SQT-FAAS techniques both will be used for
silver determination. Also all parameters are to be optimized regarding these
techniques. After that, an uncoated SQT with two slots having an angle of 90°, 120°
or 180° with respect to each other will be used for sensitivity improvement in SQT-
AT-FAAS technique. Then; coating of the SQT with W and Zr will be performed
and experiments will be carried out with these configurations. All parameters are to
be optimized for both uncoated and coated SQT-AT-FAAS techniques. Interference
effects of several elements will also be studied. Finally, characterization of analyte
species will be performed by using XPS spectroscopy.

23
CHAPTER 2
EXPERIMENTAL
2.1 Apparatus and Materials
Three types of slotted quartz tubes were used with respect to position of two slots.
The slots were positioned at 90°, 120° and 180°; the length of the lower slot was 102
mm and upper slot was 52 mm. The slotted tube was 15 cm long; its inner and outer
diameters were 16 mm and 20 mm, respectively. The slotted tubes were prepared by
Hazer Cam in Altındağ, Ankara.
To prepare the standard solutions, adjustable 100-1000 µL and 500-5000 µL
Eppendorf micropipettes were used. The solutions were prepared in glass containers
and then stored in polyethylene containers (100 mL capacity) in refrigerator.
In revolatilization step, the organic solvent was aspirated into flame by using 1.0 mL
plastic cups and an adjustable micropipette.
2.2 Reagents
All reagents used in this study were of analytical grade or higher purity. The analyte
solutions were prepared by 1000 mg/L High-Purity Standards silver stock solution.
The working solutions were prepared daily and obtained after successive dilutions.
For the dilutions, 18MΩ·cmdeionized water obtained from a Millipore (Molsheim,

24
France) Milli-Q water purification system which was fed using the water produced
by Millipore Elix 5 electro deionization system was used. All standard solutions were
prepared in 1.0 M HNO3, using analytical grade 65% (v/v) HNO3 (Merck).
During interference study, 3 different solutions were prepared. In all solutions, Ag
concentration was kept constant at 50.0 ng/mL, and interferent element
concentrations were 1, 10 and 100 fold of the analyte concentration. Au (High Purity
Standards), Cu (Merck), Ni (High Purity Standards), Pt (Merck), Cd (High Purity
Standards), Zn (High Purity Standards), Co (Merck), Fe (High Purity Standards), Mn
(Merck), As (Ultra Scientific), Se (High Purity Standards), Sb (Ultra Scientific), Bi
(High Purity Standards), Hg (Merck), Sn (Merck), Pb (High Purity Standards), Tl
(Ultra Scientific), In (High Purity Standards) were prepared from 1000 mg/L stock
solution in 1.0 M HNO3.
Throughout this study, all glassware and (polyethylene) plastics were stored in acid
bath which is 10% (v/v) HNO3 solution in a plastic container; the acid solution was
prepared by diluting (1+9) the concentrated nitric acid reagent using water.The
materials were immersed in acid bath at least 24 hours and washed with deionized
water before use.
2.3 Atomic Absorption Spectrometer
In this study, ATI Unicam 929AA single beam spectrometer, equipped with a
Deuterium (D2) background correction system, was used for the absorbance
measurements. Air-acetylene flame was used with a 10.0 cm burner head. The
signals and results were saved by the help of SOLAAR AA software. VWR
Scientific Ag hollow cathode lamp was used as a radiation source. Due to the
mechanical restrictions, the sample suction rate could not be changed; it was 6.25
mL/min in the whole study. Summary of operating conditions are given in Table 2.1.

25
Table 2.1 Operating conditions of AA spectrometer
Parameter Value
Wavelength of Ag, nm 328.1
Hollow Cathode Lamp Current, mA 4.0
Spectral Bandpass, nm 0.5
Flame Type Air-Acetylene
Air Flow Rate, L/min 1.2
2.4 Coating Procedure for the SQT
The coating procedure was applied for the SQT having two slots positioned at 180°
with respect to each other. 100 mL of 1000 mg/L standard solutions of Zr, W, Ti,
Mo, Ta and Au were aspirated into the SQT in the presence of a fuel-lean flame for
coating the SQT. The suction rate was 6.25 mL/min. After using the SQT 50-100
times, recoating was required since the sensitivity of the system decreased.Before
recoating, the SQT was immersed in 10% (v/v) HF solution (concentrated reagent
diluted 1+9 by water) for an hour to remove residuals, and then with the same
procedure it was coated.
2.5 Surface Studies
Ag coated quartz surface was investigated by X-ray photoelectron spectroscopy
(XPS) to identify the chemical nature of Ag. For XPS study, three 1.0 mm thick
quartz pieces with the width of 1.0 cm and the length of 1.0 cm were used. These
quartz pieces were carefully placed into the inner surface of the SQT. Then 150 mL

26
of 10 mg/L Ag solution was aspirated into the SQT in the presence of fuel-lean flame
for trapping Ag on quartz pieces. During coating, the suction rate was 6.25 mL/min.
PHI VersaProbe 5000-XPS instrument with Al dual mode was used for surface
analysis in Middle East Technical University Central Laboratory. The instrument has
a high pressure (up to 20 atm) reactor and also temperature capabilities (from -100
°C to 650 °C) in low and high pressures. The vacuum pumping of the instrument is
too high (10-11
atm). In addition to these, the mass analyzer is functional up to 200
amu. Monochromatic Al Kα radiation was used as a X-ray source and for excitation
of Ag on quartz 49.7 W energy was used. The quartz piece was irradiated with
mono-energetic x-rays and then the photoelectrons were emitted from the surface of
the quartz. The binding energy of these emitted photoelectrons was determined by an
electron energy analyzer. By using the binding energies of photoelectrons; the
elemental identity and chemical state of an element are determined. The binding
energy of C 1s (284.5 eV) was used as an internal calibrant in order to estimate the
chemical nature of Ag.

27
CHAPTER 3
RESULTS AND DISCUSSION
In this study, there are five main techniques handled for the determination of silver;
i. Firstly, simple FAAS technique was used for the determination of silver.
ii. SQT-FAAS was the second technique which improves sensitivity with the use of
SQT. In the presence of SQT the flame speed is slow, therefore the residence time of
analyte atoms in the measurement zoneincreases.In addition, due to the size
restriction and partial elimination of oxidizing species in air, the chemical
environment inside the absorption path is more stable. Only 180° angled SQT was
used in this part.
iii. Thirdly, SQT-AT-FAAS technique was applied. In this case, the SQT is used as a
trap medium for preconcentration. Sample solution is aspirated into the flame and
analyte species are trapped on the inner surface ofthe SQT for a few minutes, then
analyte atoms are revolatilizedby organic solvent aspiration. The technique was
applied with 90°, 120° and 180° angled uncoated SQT to compare their efficiencies.
180°configuration of SQT was used in the rest of study. After optimum conditions
were found, uncoated SQT-AT-FAAS technique was performed for the
determination of silver.

28
iv. SQT-AT-FAAS technique was applied by coating the SQT with different
elements for further sensitivity improvements. In this part, for the determination of
silver W-coated SQT-AT-FAAS technique was used.
v. In the previous part, different coating elements were used and two of them gave
sensitive results; W and Zr. For this reason, Zr coated SQT-AT-FAAS technique was
also applied for the determination of silver.
The main point here is the evaluation of the sensitivity improvements of different
techniques. Forcalculation of analytical figures of merit, the peak height values were
used for signals. The standard deviation (s) values were calculated using the lowest
analyte concentration. Characteristic concentration (C0) which is the concentration
that corresponds to 0.00436 absorbance (1% absorption); C0 = 0.00436 x (analyte
concentration/absorbance) and limit of detection (LOD), found as 3s/m, are the
important figures of merit. In addition, limit of quantitation (LOQ), found as 10s/m,
is used in sensitivity comparison. Among them, since LOD is dependent on the
instrument conditions, especially the source beam; it is better to consider the
enhancement factor, E, obtained by taking the ratio of characteristic concentration
values of the systems with and without atom trap. E is also known as ratio of
calibration sensitivities (slopes). To compare the ratio of LOD values and E values is
also useful; however, the figures of merit obtained for comparison may be different
since LOD is dependent on both signal and reproducibility.
The critical part is the comparison of atom trap techniques, since different sample
volumes or sampling periods render the comparisons difficult. In trap studies,
sensitivity is directly related with the trapped analyte mass which increases with
increasing trapping period. In many cases, it is difficult to decide whether sensitivity
is improved or not since sample volume and trapping period can be given randomly.
To overcome this confusion, new terms were introduced by Ataman [27] considering
enhancement. The first defined value was maximum enhancement factor (Emax),
which also depends on analyte concentration and matrix composition. Then two new
terms were added; Et and Ev, which are found as dividing E value by total time spent

29
in terms of minutes and dividing E value by total volume spent in terms of milliliters,
respectively. In addition to characteristic concentration (C0), characteristic mass (m0)
is also used as a figure of merit. It is the mass of analyte that produces a defined
peakthat has an absorbance value of 0.00436 (or 1% absorption) and found as the
(volume of trapped analyte) x (C0).
3.1 FAAS Technique
In this part, simple FAAS technique was used for the determination of silver.
Acetylene flow rate was optimized in order to obtain high S/N ratio. 5.0 mg/L Ag
solution was aspirated into the flame throughout the optimization.
3.1.1 Optimization of Fuel Flow Rate
In the optimization, the flow rate of air was kept constant at 1.2 L/min and sample
flow rate was constant at 6.25 mL/min. As can be seen in Figure 3.1, the optimum
fuel flow rate was found as 0.9 L/min. In case of higher flow rates, the Ag signals
were getting worse and there was not an important change in absorbance. It is found
that the optimum flame for silver determination with FAAS technique requires
stochiometric flame.

30
Figure 3.1 Optimization of fuel flow rate using 5.0 mg/L Ag in FAAS.
Flow rate of air: 1.2 L/min, Sample suction rate: 6.25 mL/min
3.1.2 Calibration Plots for FAAS Technique
In optimum conditions, the absorbance values of silver solutions in concentrations
between 0.25-10.0 mg/L were obtained (Figure 3.2). Calibration plot is linear
between 0.25-5.0 mg/L (Figure 3.3). The best line equation and correlation
coefficient were, y = 0.0449x + 0.0129 and 0.9968, respectively, where x is the
analyte concentration in mg/L.

31
Figure 3.2 Calibration plot for FAAS technique.
Fuel flow rate: 0.9 L/min, Flow rate of air: 1.2 L/min, Sample suction rate: 6.25
mL/min.
Figure 3.3 Linear calibration plot for FAAS technique.
Fuel flow rate: 0.9 L/min, Flow rate of air: 1.2 L/min, Sample suction rate: 6.25
mL/min.

32
From the calibration plot, LOD and LOQ values were calculated as 76 ng/mL and
253 ng/mL, respectively. In order to find the values of LOD and LOQ, 11
measurements of 0.25 mg/L Ag solution were used. Characteristic concentration was
found as 81 ng/mL. The calculated values can be seen in Table 3.1.
Table 3.1 Analytical figures of merit for FAAS technique.
Limit of Detection (LOD), ng/mL 76
Limit of Quantitation (LOQ), ng/mL 253
Characteristic Concentration (C0), ng/mL 81
Linear Range, ng/mL 2.50x10²-50.0x10
2
3.2 Slotted Quartz Tube FAAS Technique
In this technique, the SQT was used to improve the sensitivity as a result of
increasing life time of analyte atoms in the measurement zone. The chemical
environment inside the tube is more stable and the flame speed is slow in the
presence of the SQT.The SQT is aligned with the optical path of the spectrometer
and the lower slot of SQT is positioned directly above the flame. In order to improve
sensitivity, fuel flow rate and height of the SQT from the burner head were optimized
by using 5.0 mg/L Ag solution.
3.2.1 Optimization of Fuel Flow Rate
During optimization, the height of the SQT from the burner head was 5.0 mm. As
seen in Figure 3.4, the optimum fuel flow rate was found as 1.2 L/min. The Ag
signals are reproducible (%RSD, 1.45) and the absorbance values are high at this

33
flow rate. Similar with FAAS, stochiometric flame is required for the determination
of silver.
Figure 3.4 Optimization of fuel flow rate using 5.0 mg/L Ag in SQT-FAAS.
Flow rate of air: 1.2 L/min, Sample suction rate: 6.25 mL/min,
Height of SQT from the burner head: 5.0 mm.
3.2.2 Optimization of Height of the SQT from the Burner Head
Since the flame was extinguished, 5.0 mm was the lowest height that could be
adjusted and it was found to be the optimum height of the SQT from the burner head,
as shown in Figure 3.5. When the SQT is closer to the burner head, analyte atoms
enter into the tube easily. For this reason, the sensitivity of 5.0 mm height of SQT
from the burner head was higher than 8.0 mm and 11.0 mm.

34
Figure 3.5 Optimization of height of SQT from the burner using 5.0 mg/L Ag in
SQT-FAAS.
Fuel flow rate: 1.2 L/min, Flow rate of air: 1.2 L/min, Sample suction rate: 6.25
mL/min.
3.2.3 Calibration Plots for SQT-FAAS Technique
After the optimum parameters were found, the calibration graph is drawn (Figure
3.6) with using Ag standard solutions in concentrations between 0.1-20 mg/L.
Calibration plot is linear between 0.1-10 mg/L ( Figure 3.7). The best line equation
and correlation coefficient were, y = 0.1213x + 0.0042 and 0.9948, respectively,
where x is the analyte concentration in mg/L.

35
Figure 3.6 Calibration plot for SQT-FAAS technique.
Fuel flow rate: 1.2 L/min, Height of SQT from the burner head: 5.0 mm,
Flow rate of air: 1.2 L/min, Sample suction rate: 6.25 mL/min.
Figure 3.7 Linear calibration plot for SQT-FAAS technique.
Fuel flow rate: 1.2 L/min, Height of SQT from the burner head: 5.0 mm,
Flow rate of air: 1.2 L/min, Sample suction rate: 6.25 mL/min.

36
As seen in Table 3.2, LOD and LOQ values were calculated as 19 ng/mL and 65
ng/mL, respectively. Characteristic concentration was found as 35 ng/mL. In order to
obtain LOD and LOQ values, 11 measurements of 0.25 mg/L Ag solution were used.
The sensitivity enhancement was 2.31 fold with respect to FAAS technique.
Table 3.2 Analytical figures of merit for SQT-FAAS technique.
Limit of Detection (LOD), ng/mL 19
Limit of Quantitation (LOQ), ng/mL 65
Characteristic Concentration (C0), ng/mL 35
Linear Range, ng/mL 0.100x10³-10.0x10
3
Enhancement (E) with respect to FAAS 2.31
3.3 Slotted Quartz Tube Atom Trap FAAS Technique
At this stage, the SQT was used as a trap medium and analyte solution was aspirated
into the inner surface of this medium to collect the analyte atoms for a few minutes.
Then with the introduction of small volume of organic solvent, the fuel content of
flame gases was momentarily increased and analyte atoms were revolatilized from
the surface of the SQT. A transient signal was obtained after this rapid atomization.
At the beginning, uncoated SQT was used in the optimization studies. However,
there was a memory effect which required aspirating the organic solvent more than 5
times. This excess organic solvent aspiration was time consuming. In order tosolve
the memory problem, SQT was coated with Wand the revolatilization of atoms was
tried again. This time memory effect was eliminated.For this reason,W-coated SQT
was used throughout the optimization of atom trap parameters. Fuel flow rate, height
of the SQT from the burner head, type and volume of organic solvent and

37
trappingperiod were the important parameters that should be optimized.Finally; 90°,
120° and 180° angled SQT performance were compared and different coating
elements were investigated in the optimum conditions.
3.3.1 Optimization of Fuel Flow Rate
In trap studies, fuel flow rate is an important parameter that should be carefully
optimized. The optimum fuel flow rate was found as 0.27 L/min using 100.0 ng/mL
Ag. This was a fuel-lean flame as usually expected in trap studies (Figure 3.8). In
trap studies, a fuel-lean flame is required for the atoms to be trapped. Otherwise, the
atoms may be atomized earlier and the absorption signals during releasing from the
trap decrease. As seen in Figure 3.8, almost no signal was obtained at flow rates
higher than 0.37 L/min.
Figure 3.8 Optimization of fuel flow rate using 100.0 ng/mL Ag in SQT-AT-FAAS.
Height of SQT from the burner head: 2.0 mm, Organic solvent: IBMK
Volume of organic solvent: 25µL, Trapping period: 1.0 min
Flow rate of air: 1.2 L/min, Sample suction rate: 6.25 mL/min.

38
3.3.2 Optimization of Height of the SQT from the Burner Head
As seen in Figure 3.9, the optimum height of the SQT from the burner head was
found as 2.0 mm. Similar with SQT-FAAS, increasing the height decreased the
absorbance values since the sample solution could not efficiently enter the SQT. On
the other hand, differently from SQT-FAAS, height could be adjusted lower than 5.0
mm since a fuel-lean flame was used. In SQT-FAAS; whenever the distance between
the burner head and SQT was lower than 5.0 mm, the flame was extinguished.
Figure 3.9 Optimization of height of SQT from the burner head using 100.0 ng/mL
Ag in SQT-AT-FAAS.
Fuel flow rate: 0.27 L/min, Organic solvent: IBMK
Volume of organic solvent: 25µL, Trapping period: 1.0 min
Flow rate of air: 1.2 L/min, Sample suction rate: 6.25 mL/min.
3.3.3 Optimization of Organic Solvent Type
In order to revolatilize the analyte atoms organic solvent aspiration technique was
preferred. An optimum organic solvent should be highly flammable for rapid and
complete revolatilization of analyte species. Therefore, from ketones to alcohols

39
different types of organic solvents were tested to find the optimum one (Table 3.3).
Organic solvent, having the lowest flash point at which it can vaporize to form an
ignitable mixture in air, is expected to have the highest revolatilization performance.
Although some have low flash points, no signal was obtained with the aspiration of
ethanol, n-butanol, isopropyl alcohol, cyclopentanol and methanol. Therefore, it
should be accepted that the nature of revolatilization is not known exactly. It is only
estimated that the revolatilization is a complex process including radical formations.
As shown in Figure 3.10, introduction of other organic solvents worked better.
Acetonitrile was eliminated due to low absorbance values as compared with others.
Although meaningful signals were obtained, n-Hexane was not selected since the
flame was extinguished when it was introduced. The Ag signals obtained with MEK
(%RSD, 9.39) and acetone (%RSD, 9.37) were not sharp and reproducible. For this
reason, IBMK was found to be the proper organic solvent asthe Ag signals obtained
with high absorbance value and reasonable reproducibility (%RSD, 3.44).

40
Table 3.3 Molecular formulas and flash points of the organic solvents used in the
optimization of organic solvent type.
Organic Solvent Molecular Formula Flash Point [72]
Isobutyl methyl ketone (IBMK) C6H12O 14 °C
Acetone C3H6O -17 °C
Methyl ethyl ketone (MEK) C4H8O -9 °C
n-Hexane C6H14 -23 °C
Acetonitrile C2H3N 2 °C
Ethanol C2H6O 13 °C
n-Butanol C4H10O 35 °C
Isopropyl alcohol C3H8O 12 °C
Cyclopentanol C5H10O 93 °C
Methanol CH4O 11 °C

41
Figure 3.10 Effect of organic solvents on Ag signals using 100.0 ng/mL Ag in SQT-AT-FAAS.
Fuel flow rate: 0.27 L/min, Height of SQT from burner head: 2.0 mm Volume of organic solvent: 25µL, Trapping period: 1.0 min Flow rate of air: 1.2 L/min, Sample suction rate: 6.25 mL/min.
3.3.4 Optimization of Organic Solvent Volume
Organic solvent aspiration technique requires only a small volume of organic solvent
for the revolatilization of trapped analyte atoms. For this reason, IBMK in volumes
between 10-50 µL were used in order to select the optimum volume to be used. As
seen in Figure 3.11, there was no significant difference between the absorbance
values obtained using 25 µL and 35 µL; however, 25 µL was selected as the proper
volume. The reason is that when high volumes of solvent were aspirated into the
SQT, flame may tend to extend from the ends of the tube and damage the quartz
windows of the instrument. In addition, the peak height of Ag signal was decreased
for volumes of IBMK higher than 25 µL.

42
Figure 3.11 Optimization of organic solvent volume using 100 ng/mL Ag in SQT-
AT-FAAS.
Fuel flow rate: 0.27 L/min, Height of SQT from burner head: 2.0 mm
Organic solvent: IBMK, Trapping period: 1.0 min
Flow rate of air: 1.2 L/min, Sample suction rate: 6.25 mL/min.
3.3.5 Effect of Trapping Period
In atom trap studies, increasing the collection time improves the sensitivity of the
technique. However, shorter measurement time is also an important criterion to
compete with other techniques. For this reason, 5.0 min was selected as an optimum
trapping period (Figure 3.12). Above 5.0 min, there was not a significant increase; in
addition, the curve deviated from linearity indicating a saturation effect for the SQT.

43
Figure 3.12 Optimization of trapping period using 100 ng/mL Ag in SQT-AT-
FAAS.
Fuel flow rate: 0.27 L/min, Height of SQT from burner head: 2.0 mm
Organic solvent: IBMK, Volume of organic solvent: 25 µL
Flow rate of air: 1.2 L/min, Sample suction rate: 6.25 mL/min.
Table 3.4 Optimum parameters for SQT-AT-FAAS technique.
Parameter Optimum Condition
Fuel Flow Rate, L/min 0.27
Height of SQT from the Burner Head, mm 2.0
Volume of Organic Solvent, µL 25
Organic Solvent IBMK
Trapping Period, min 5.0

44
The signal of 100 ng/mL Ag, which was obtained in optimum conditions given in
Table 3.4, is shown in Figure 3.13. Full width at half maximum (FWHM) of the
signal was found to be 0.8 s.
Figure 3.13 The signal of W-coated SQT-AT-FAAS for 100.0 ng/mL Ag in
optimum conditions given in Table 3.4.
3.3.6 Investigation of 90°, 120° and 180° Angled SQT
The SQT atom trap optimizations were performed by using the SQT with two slots
having an angle of 180°. By using the optimum conditions (Table 3.4) except the
trapping period, the performance for 90°, 120° and 180° angled uncoated SQT
devices were compared. As shown in Figure 3.14, the sensitivity of 180° angled SQT
was higher than the others. In addition, the Ag signals for 90° and 120° angled SQT
devices were broad and not reproducible. Therefore, only 180° angled SQT was used
in the measurement of calibration standards.
FWHM, 0.8 s

45
Figure 3.14 Performance of 90°, 120° and 180° angled SQT using 100 ng/mL Ag in
SQT-AT-FAAS.
Fuel flow rate: 0.27 L/min, Height of SQT from burner head: 2.0 mm
Organic solvent: IBMK, Volume of organic solvent: 25 µL, Trapping period: 1.0 min
Flow rate of air: 1.2 L/min, Sample suction rate: 6.25 mL/min.
3.3.7 Calibration Plots for Uncoated SQT-AT-FAAS Technique
In order to obtain the calibration plots for uncoated SQT-AT-FAAS, optimum
conditions (Table 3.4) were used. Ag solutions in concentrations between 5.0-100
ng/mL were used for the calibration plot which was linear between 10-100 ng/mL
(Figure 3.16). %RSD was found to be 2.24. The best line equation and correlation
coefficient were, y = 0.0025x + 0.0175 and 0.9995, respectively.

46
Figure 3.15 Calibration plot for uncoated SQT-AT-FAAS.
Fuel flow rate: 0.27 L/min, Height of SQT from burner head: 2.0 mm
Organic solvent: IBMK, Volume of organic solvent: 25 µL, Trapping period: 5.0 min
Flow rate of air: 1.2 L/min, Sample suction rate: 6.25 mL/min.
Figure 3.16 Linear calibration plot for uncoated SQT-AT-FAAS.
Fuel flow rate: 0.27 L/min, Height of SQT from burner head: 2.0 mm
Organic solvent: IBMK, Volume of organic solvent: 25 µL, Trapping period: 5.0 min
Flow rate of air: 1.2 L/min, Sample suction rate: 6.25 mL/min.

47
In Figure 3.17, the signal for 50 ng/mL Ag, whose absorbance value was used to
calculate the characteristic concentration of uncoated SQT-AT-FAAS technique, is
shown. The half bandwidth of the signal was found as 1.1 s.
Figure 3.17 The signal of uncoated SQT-AT-FAAS for 50 ng/mL Ag in optimum
conditions (Table 3.4).
3.3.8 Analytical Figures of Merit
The analytical figures of merit of uncoated SQT-AT-FAAS were calculated as seen
in Table 3.5. LOD and LOQ values were calculated as 3.1 ng/mL and 10.3 ng/mL,
respectively. These values were obtained with 11 measurements of 5.0 ng/mL Ag
solution. Characteristic concentration was calculated as 1.5 ng/mL. The sensitivity
enhancement was 54 fold with respect to FAAS technique.All these values were
obtained by using a sample suction rate of 6.25 mL/min and 5.0 min sampling.
FWHM, 1.1 s

48
Table 3.5 Analytical figures of merit for uncoated SQT-AT-FAAS technique.
Limit of Detection (LOD), ng/mL 3.1
Limit of Quantitation (LOQ), ng/mL 10.3
Characteristic Concentration (C0), ng/mL 1.5
Characteristic Mass (m0), ng 47.0
Linear Range, ng/mL 10-100
Enhancement (E) with respect to FAAS 54
Enhancement (E) with respect to SQT-FAAS 23
3.4 Investigation of Coating Materials for SQT-AT-FAAS Technique
The coating procedure is important since a significant increase in sensitivity may be
observed depending on the analyte element and coating element. The melting point
of the coating element should be close to or significantly higher than the boiling
point of the analyte element. In other words, the coating element should not leave the
inner surface of SQT before the analyte element revolatilizes from the surface. As
described in Section 2.4, using fuel-lean flame, 100 mL of 1000 mg/L standard
solutions of Zr, W, Ti, Mo, Ta and Au were sentinto the SQT through conventional
nebulization to coat the inner surface of the tube.
As seen in Figure 3.18, the absorbance values obtained for Ta and Au coated SQTs
were small as compared to uncoated SQT. Although the absorbance values of Mo
and Ti coated SQTs were close to the uncoated SQT, there was a splitting in Ag
signals. Therefore, they were also eliminated for further studies. The absorbance

49
values of Zr and W coated SQT devices were close to each other and both of them
indicated increased sensitivity. Therefore, both Zr and W coated SQT-AT-FAAS
techniques were used for the determination of silver.
Figure 3.18 Effect of coating materials for 100 ng/mL Ag signal in SQT-AT-FAAS.
Fuel flow rate: 0.27 L/min, Height of SQT from burner head: 2.0 mm
Organic solvent: IBMK, Volume of organic solvent: 25 µL, Trapping period: 1.0 min
Flow rate of air: 1.2 L/min, Sample suction rate: 6.25 mL/min.
As shown in Table 3.6, the melting point of Zr is lower than the boiling point of the
Ag. However, this condition did not create a serious problem because, ifthe flame
temperature during revolatilization step reaches such a high value, at first quartz will
melt. In addition, the revolatilization step in atom traps takes only a few seconds
which is too short to remove the coating element from the surface of SQT even if the
flame is too hot.Therefore; the melting point of the coating element may be lower
than the boiling point of the analyte.

50
Table 3.6 Comparison of melting and boiling points of Ag, Zr and W.
Ag Zr W Quartz
Melting Point, °C 961 1855 3422 1650
Boiling Point, °C 2212 4409 5828 2230
3.5 Calibration Plots for W-coated SQT-AT-FAAS
After coating procedure, W-coated SQT-AT-FAAS technique was performed using
optimum conditions that were shown in Table 3.4. In order to obtain the calibration
plots, Ag solutions in concentrations between 2.5-100 ng/mL were used. The
calibration plot was linear between 2.5-100 ng/mL (Figure 3.20). % RSD was found
to be 4.04. The best line equation and correlation coefficient were, y = 0.008x +
0.0029 and 0.9995, respectively.

51
Figure 3.19 Calibration plot for W-coated SQT-AT-FAAS.
Fuel flow rate: 0.27 L/min, Height of SQT from burner head: 2.0 mm
Organic solvent: IBMK, Volume of organic solvent: 25 µL, Trapping period: 5.0 min
Flow rate of air: 1.2 L/min, Sample suction rate: 6.25 mL/min.
Figure 3.20 Linear calibration plot for W-coated SQT-AT-FAAS.
Fuel flow rate: 0.27 L/min, Height of SQT from burner head: 2.0 mm
Organic solvent: IBMK, Volume of organic solvent: 25 µL, Trapping period: 5.0 min
Flow rate of air: 1.2 L/min, Sample suction rate: 6.25 mL/min
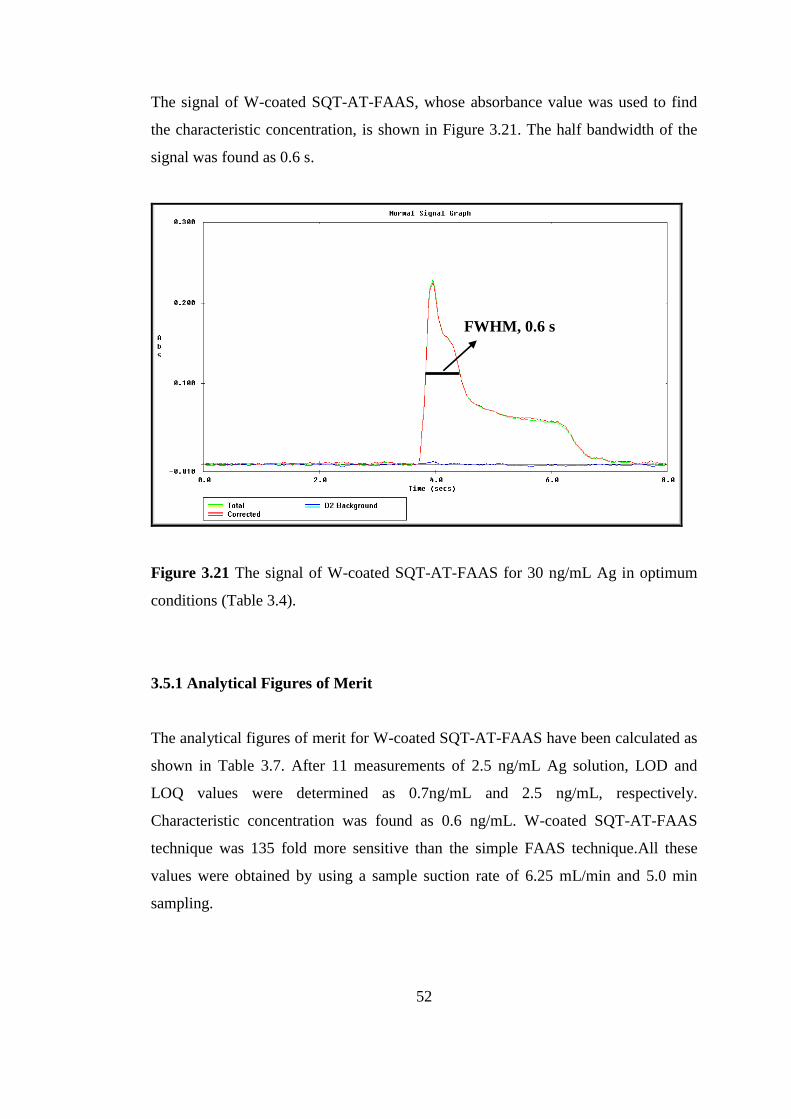
52
The signal of W-coated SQT-AT-FAAS, whose absorbance value was used to find
the characteristic concentration, is shown in Figure 3.21. The half bandwidth of the
signal was found as 0.6 s.
Figure 3.21 The signal of W-coated SQT-AT-FAAS for 30 ng/mL Ag in optimum
conditions (Table 3.4).
3.5.1 Analytical Figures of Merit
The analytical figures of merit for W-coated SQT-AT-FAAS have been calculated as
shown in Table 3.7. After 11 measurements of 2.5 ng/mL Ag solution, LOD and
LOQ values were determined as 0.7ng/mL and 2.5 ng/mL, respectively.
Characteristic concentration was found as 0.6 ng/mL. W-coated SQT-AT-FAAS
technique was 135 fold more sensitive than the simple FAAS technique.All these
values were obtained by using a sample suction rate of 6.25 mL/min and 5.0 min
sampling.
FWHM, 0.6 s

53
Table 3.7 Analytical figures of merit for W-coated SQT-AT-FAAS technique.
Limit of Detection (LOD), ng/mL 0.7
Limit of Quantitation (LOQ), ng/mL 2.5
Characteristic Concentration (C0), ng/mL 0.6
Characteristic Mass (m0), ng 18.8
Linear Range, ng/mL 2.5-100
Enhancement (E) with respect to FAAS 135
Enhancement (E) with respect to SQT-FAAS 58
Enhancement (E) with respect to uncoated SQT-AT-FAAS 3
3.6 Calibration Plots for Zr-coated SQT-AT-FAAS
Using the optimum conditions given in Table 3.4, the absorbance values of Ag
calibration standards in concentrations between 0.5-100 ng/mL were measured. The
calibration plot was linear between 1.0-100 ng/mL (Figure 3.22). %RSD was found
to be 1.21. The best line equation and correlation coefficient were, y = 0.0136x +
0.0369 and 0.9994, respectively.

54
Figure 3.22 Linear calibration plot for Zr-coated SQT-AT-FAAS.
Fuel flow rate: 0.27 L/min, Height of SQT from burner head: 2.0 mm
Organic solvent: IBMK, Volume of organic solvent: 25 µL, Trapping period: 5.0 min
Flow rate of air: 1.2 L/min, Sample suction rate: 6.25 mL/min.
The absorbance value of the signal shown in Figure 3.23 was used to estimate the
characteristic concentration of the Zr-coated SQT-AT-FAAS technique. The half
bandwidth of the signal was found as 1.0 s.

55
Figure 3.23 The signal of Zr-coated SQT-AT-FAAS for 40 ng/mL Ag in optimum
conditions (Table 3.4).
3.6.1 Analytical Figures of Merit
Table 3.8 shows the analytical sensitivity parameters of Zr-coated SQT-AT-FAAS
technique. LOD and LOQ values were calculated as 0.3ng/mL and 0.9 ng/mL,
respectively. These values were obtained with 11 measurements of 0.5 ng/mL Ag
solution. Characteristic concentration was calculated as 0.3 ng/mL. The enhancement
of Zr-coated SQT-AT-FAAS technique was 270 fold with respect to FAAS
technique.All these values were obtained by using a sample suction rate of 6.25
mL/min and 5.0 min sampling.
FWHM, 1.0 s

56
Table 3.8 Analytical figures of merit for Zr-coated SQT-AT-FAAS technique.
Limit of Detection (LOD), ng/mL 0.3
Limit of Quantitation (LOQ), ng/mL 0.9
Characteristic Concentration (C0), ng/mL 0.3
Characteristic Mass (m0), ng 9.4
Enhancement (E) with respect to FAAS 270
Enhancement (E) with respect to SQT-FAAS 117
Enhancement (E) with respect to uncoated SQT-AT-FAAS 5
Enhancement (E) with respect to W-coated SQT-AT-FAAS 2
3.7 Evaluation of System Performance
The analytical figures of merit of all techniques used in this study are summarized in
Table 3.9. It seems that sensitivity improvement is required for simple FAAS
technique. As seen in Table 3.9, the best sensitivity enhancement with respect to
FAAS was obtained 270 fold using Zr-coated SQT-AT-FAAS technique. On the
other hand, 135 fold enhancement in sensitivity was obtained using W-coated SQT-
AT-FAAS technique.Zr and W both improved the sensitivity of the system.
However, Zr was better as a coating element. The reason is that the analytical signals
of Ag were more reproducible (%RSD, 1.21) using Zr-coated SQT.

57
If the SQT was not coated with any coating material, there was still an increase in
sensitivity with respect to FAAS technique where the detection limit was found as
3.1 ng/mL. However, there was a memory effect without coating element.
Figure 3.24 Flame absorption profiles for three elements [73].
As shown previously in Figure 3.17, Figure 3.21 and Figure 3.23 in turn there was a
tailing problem in Ag signals and the problem was independent of the coating
element. The tailing was observed in both coated and uncoated SQT atom trap
techniques. Figure 3.24 illustrates the flame absorption profile of Ag and according
to this profile Ag atoms have long life times in flame. Therefore, the atoms stay in
SQT for a long time. However, since the flame conditions return back to lean flame
after 1 second and the flame conditions are not optimum any more, the signal is
decreased.Then a tailing is observed in the signals. It should be accepted that the
reason for this undesirable behaviour in the signal may be related with the long life
time of Ag atoms in flame.

58
Table 3.9 Comparison of Techniques in Terms of E, Et and Ev Values.
LOD,
ng/mL
LOQ,
ng/mL
C0,
ng/mL
m0,
ng E
Et,
min-1
Ev,
mL-1
Slope,
L/mg
FAAS 76 253 81
1
0.0449
SQT-
FAAS 19 65 35
2.31
0.1239
Uncoated
SQT-AT-
FAAS*
3.1 10.3 1.5 47.0 54 10.8 1.7 2.5
W-coated
SQT-AT-
FAAS*
0.7 2.5 0.6 18.8 135 27 4.3 8
Zr-coated
SQT-AT-
FAAS*
0.3 0.9 0.3 9.4 270 54 8.6 13.6
E = C0 (FAAS)/C0 (Selected Method), Et = E/ttotal, Ev = E/vtotal
* Total time (Trapping period): 5.0 min, Total volume: 31.3 mL
As seen in Table 3.10, the suggested techniques in this study are competing with the
most sensitive analytical techniques such as ICP-MS, ICP-OES, CVG-AAS and
ETAAS. Besides their sensitivity, the developed techniques are also simple and very
inexpensive.

59
Table 3.10 Comparison of LOD values of different techniques with the developed
atom trap techniques in this study.
Technique LOD, ng/mL
ICP-MS 0.15 [41]
CVG-AAS 1.4 [33]
ETAAS 20 [74]
CVG-ICP-OES 50.1 [40]
Uncoated-SQT-AT-FAAS 3.1
W-coated SQT-AT-FAAS 0.7
Zr-coated SQT-AT-FAAS 0.3
3.8 Interference Studies
In order to investigate the effect of some elements on Ag signals, the interference
studies were performed by using Zr-coated SQT-AT-FAAS technique. In this study;
3 different solutions were prepared for each element. In all solutions, Ag
concentration was kept constant at 50.0 ng/mL, and interferent element
concentrations were 1, 10 and 100 fold of the analyte concentration using the units of
ng/mL. The effect of transitions and noble metals such as Cu, Zn, Au, Pt, Cd, Ni, Fe,
Mn, Co and hydride forming elements such as Se, Sb, As, Hg, Sn, Bi, Tl, In, Bi were
investigated in acidified solution (1.0 M HNO3). The optimum conditions shown in
Table 3.5 were used except that, the trapping period was 1.0 min instead of 5.0 min.

60
The effect of transition and noble metals were shown in Figure 3.25, Figure 3.26 and
Figure 3.27. As seen in Figure 3.25, Zn did not have any effect on the analytical
signal of Ag. 1 and 10 fold of Cu and Au also did not have a significant effect on the
Ag signal. However, 100 fold of Cu and Au suppressed the Ag signal by 28% and
32%, respectively.
Figure 3.25 Interference effects of Cu, Zn and Au on the analytical signal of 50.0
ng/mL Ag using Zr-coated SQT-AT-FAAS.

61
1, 10 and 100 fold of Pt, Cd and Ni slightly altered the Ag signal, as seen in Figure
3.26. These effects were 10% or lower.
Figure 3.26 Interference effects of Pt, Cd and Ni on the analytical signal of 50.0
ng/mL Ag using Zr-coated SQT-AT-FAAS.

62
As shown in Figure 3.27; although 1 and 10 fold of Fe did not affect the Ag signal,
100 fold Fe increased the Ag signal by 34%. 100 fold of Mn also increased the Ag
signal by 21% and only a slightly increase was observed for 1 and 10 fold of Mn. On
the other hand, Ag signal was suppressed in the presence of Co. 1 and 10 fold of Co
suppressed the Ag signal by 17% while 100 fold Co suppressed by 30%.
Figure 3.27 Interference effects of Fe, Mn and Co on the analytical signal of 50.0
ng/mL Ag using Zr-coated SQT-AT-FAAS.

63
The effects of hydride forming elements were shown in Figure 3.28, Figure 3.29 and
Figure 3.30. In Figure 3.28, the effects of Se, Sb and As are shown. These three
hydride forming elements did not have a significant effect on the analytical signal of
Ag.
Figure 3.28 Interference effects of Se, Sb and As on the analytical signal of 50.0
ng/mL Ag using Zr-coated SQT-AT-FAAS.

64
As given in Figure 3.29; Sn ve Bi were having similar behaviours; 1 and 10 fold of
both elements did not change the Ag signal and 100 fold of them slightly suppressed
the Ag signal. While lower concentrations of Hg did not affect the Ag signal, 100
fold of Hg increased the Ag signal by 17%.
Figure 3.29 Interference effects of Hg, Sn and Bi on the analytical signal of 50.0
ng/mL Ag using Zr-coated SQT-AT-FAAS.

65
As shown in Figure 3.30; Tl, Pb and In did not have a significant effect on the
analytical signal of Ag.
Figure 3.30 Interference effects of Tl, In and Pb on the analytical signal of 50.0
ng/mL Ag using Zr-coated SQT-AT-FAAS.
3.9 Surface Studies
X-ray Photoelectron Spectroscopy (XPS) was used for the determination of
elemental identity and chemical state of analyte and trapped species collected on a
relatively small quartz surface. In this way, it is easy to understand the chemical
behavior of Ag throughout the trapping period. For this purpose, Ag on quartz
surface was investigated by using XPS. The coating procedure for XPS study was
described in section 2.5.
In XPS studies, binding energies may shift due to the physical and chemical
environment. In order to estimate the real binding energies, a reference shift is
required. Therefore; since C is always present as a result of hydrocarbon formation in
air or vacuum, the carbon 1s line have been used to calibrate the binding-energy

66
scale for XPS measurements; a binding energy of 284.8 eV is assumed for this
purpose.
3.9.1 Chemical State of Ag on Quartz Surface
As shown in Figure 3.31; O 1s, Si 2p and C 1s were found in high percentages in
XPS spectrum of Ag on quartz surface. There are also P 2p, Na 1s, Ag 3d, N 1s, Ca
2p and Ar 2p peaks in the spectrum. Ag was found as Ag 3s, Ag 3p1, Ag 3p3/2, Ag
3d5/2, Ag 3d3/2 and Ag 3d peaks.
Figure 3.31 XPS spectrum of Ag on quartz surface.

67
The peak of C 1s is shown in detail in Figure 3.32. Theoretically, C 1s peak was
assumed to be at 284.5 eV. In XPS spectrum of Ag on quartz surface, it was
observed at 283.0 eV. Therefore, C shift was found as -1.5 eV.
Figure 3.32 XPS spectrum of C on quartz surface.

68
As shown in detail in Figure 3.33, Ag 3d5/2 and Ag 3d3/2 peaks were at 366.0 eV and
372.0 eV, respectively. By the substraction of C shift (-1.5 eV); the real peaks of Ag
3d5/2 and Ag 3d3/2 were found as 367.5 eV and 373.5 eV, respectively. When we
consider Ag 3d5/2 peak, Ag was found to be in its oxide form and its oxidation state
was estimated as―+1‖ [75].
Figure 3.33 XPS spectrum of Ag 3d5/2 and Ag 3d3/2 on quartz surface.

69
CHAPTER 4
CONCLUSIONS
The main purpose of this study was to develop a sensitive, simple and economical
technique for the determination of trace levels of silver by using slotted quartz tube.
First part of the study involves the determination of silver by simple FAAS
technique. Secondly, 180° angled SQT was used to increase the residence time of
analyte atoms in the measurement zone. Sensitivity was increased 2.31 fold with
respect to FAAS technique when SQT was used in conjunction with stoichiometric
air-acetylene flame. In this part of the studies, the height of SQT from the burner
head could not be adjusted to lower than 5.0 mm since the flame was extinguished. If
it were possible to adjust it lower, the sensitivity enhancement could have been
higher since more analyte could reach the entrance slot which is closer to the burner
head.
In the latter part, SQT device was used as an atom trap for preconcentration of
analyte atoms. At the beginning, uncoated SQT was used as an atom trap. However,
there was a memory effect. To overcome this problem, SQT was coated with a
coating element (W) and the memory problem was eliminated. Therefore, throughout
the optimization of parameters for atom trap studies; W-coated SQT was used.
Afterwards, the sensitivity of 90°, 120° and 180° angled uncoated SQT devices were
compared in the presence of optimum conditions. Since the sensitivity of 180°
angled SQT was higher than the others, it was used for the rest of the study. To
improve sensitivity further, inner surface of SQT was coated with different coating

70
elements such as Zr, W, Ti, Mo, Ta and Au. Among them, W has been used for
optimization of parameters. This time W-coated SQT-AT-FAAS technique was
applied for the determination of silver where the sensitivity was increased 135 fold
with respect to FAAS technique. Zr also significantly affected the sensitivity. The
sensitivity enhancement was 270 fold with respect to FAAS technique when Zr-
coated SQT-AT-FAAS technique was applied. Zr was better than W as a coating
element. The reason is that the analytical Ag signals using Zr-coated SQT were more
reproducible (%RSD, 1.21). All trap techniques were performed with 5.0 min
trapping period and 31.3 mL sample volume.
To investigate the effects of some metals on Ag signals, interference studies were
performed using Zr-coated SQT-AT-FAAS technique. The effect of some transitions
and noble metals (Cu, Zn, Au, Pt, Cd, Ni, Fe, Mn, Co) and hydride forming elements
(Se, Sb, As, Hg, Sn, Bi, Tl, In, Bi) were investigated. 100 fold of Cu, Au and Co
suppressed the Ag signals approximately 30% where 100 fold of Fe increased the Ag
signals in the same percentage. Others did not have any significant effect on Ag
signals.
Finally, to identify the chemical state of Ag on quartz throughout the trapping period,
surface studies were done by using XPS analysis. It was concluded that Ag was
found in its oxide form and its oxidation state was estimated as “+1”.
As a summary, Zr-coated SQT-AT-FAAS was an analytical technique which was not
only sensitive and economical but also simple and required small sample volume for
the determination of silver. The technique also competed with the most sensitive
analytical techniques with its low detection limit.

71
REFERENCES
[1] A. B. G. Lansdown, ―Silver in healthcare: its antimicrobial efficacy and safety in
use‖, Royal Society of Chemistry, Cambridge, UK, 2010.
[2] A. B. G. Lansdown, ―Silver, in chemistry: foundation and application, ed. J. J.
Lagowski, Thomas Gale, MacMillan Reference, Farmington Mills, MI, 2004.
[3] I. Thornton, ―Metals in the global environment: facts and misconceptions,
international council on metals and the environment (ICME), Ottawa, 1995.
[4] The Silver Institute, http://www.silverinstitute.org/silver_element.php, last
accessed in 01.07.11.
[5] I.De Schrijver, M.Aramendia, L.Vincze, M. Resano, A.Dumoulin, F.Vanhaecke,
―Comparison of atomic absorption, mass and X-ray spectrometry techniques using
dissolution-based and solid sampling methods for the determination of silver in
polymeric samples‖, Spectrochim acta B 62 (2007) 1185-1194.
[6] N. N. Greenwood, A. Earnshow, ―Chemistry of the elements‖, second ed.,
Elsevier, Oxford, 1997.
[7] G. Kampf, B. Dietze, C. Grobe-Siestrup, C. Wendt, H. Martiny, ―Antimicrob.
agents‖, Chemother. 42 (1998) 2440-2442.
[8] R. J. White, ―A historical overview of the use of silver in wound management‖,
Br. J. Nurs. (2001) 10 (Suppl) S3.
[9] H. Klasen, ―Historical review of the use of silver in the treatment of burns‖, Part
1.Early uses, Burns, 2000, 26, 117; Part 2.Renewed interest for silver, Burns, 2000,
26, 131.
[10] A. B. Searle, ―The Use of Metal Colloids in Health and Disease‖, E. P. Dutton
and Company, New York, 1919.
[11] J. L. Manzoori, H. Abdolmohammad-Zadeh, M. Amjadi, ―Ultra-trace
determination of silver in water samples by electrothermal atomic absorption
spectrometry after preconcentration with a ligand-less cloud point extraction
methodology‖, J Hazard Matter 144 (2007) 458-463.
[12] M. Grayson, ―Kirk–Othmer encyclopedia of chemical technology‖, vol. 21, 3rd
ed., Wiley, New York, 1980.

72
[13] I.C. Smith, B.L. Carson, ―Trace metals in the environment‖, vol. 2, Ann Arbor
Science Publisher’s Inc., Ann Arbor, MI, 1977.
[14] H. Loertzer, J. Soukup, A. Hamza, A. Wicht, O. Rettkowski, E. Koch,
P.Fornana, ―Use of catheters with the AgION antimicrobial system in kidney
transplant recipients to reduce infection risk‖, Transplant. Proc. 38 (2006) 707–710.
[15] E. Kilinc, V. Lepane, A. Viitak, B. Gumgum, ―Off-line determination of trace
silver in water samples and standard reference materials by cloud point extraction-
atomic absorption spectrometry‖, Proc Est Acad Sci-Ph 58 (2009) 190–196.
[16] Alan B. G. Lansdown, ―A pharmacological and toxicological profile of silver as
an antimicrobial agent in medical devices‖, Adv Phar Sc 2010 (2010) 1-16.
[17] R. E. Burrell, ―A scientific perspective on the use of topical silver preparations‖,
Ostomy Wound Manag 49 (2003) 19–24.
[18] C.S.T.Araujo, V.N.Alves, H.C.Rezende, N.M.M.Coelho, ―Development of a
flow system for the determination of low concentrations of silver using moringa
oleifera seeds as biosorbent and flame atomic absorption spectrometry‖, Microchem
J 96 (2010) 82-85.
[19] K.H.O.H. Heinonen-Tanski, O.P. Hänninen, ―Accumulation of silver from
drinking water into cerebellum and muscules soleus in mice‖, Toxicology 186 (2003)
151–157.
[20] M. C. Fung, D.L. Bowen, ―Silver products for medical indications: risk-benefit
assessment‖, Clin Toxicol 34 (1996) 119-126.
[21] S.Z.Mohammadi, D.Afzali, M.A.Taher, Y.M.Baghelani, ―Ligandless dispersive
liquid-liquid microextraction for the separation of trace amounts of silver ions in
water samples and flame atomic absorption spectrometry determination‖, Talanta 80
(2009) 875-879.
[22] L. Ebdon, E.H. Evans, A. Fisher, S. J. Hill, ―An introduction to analytical
spectrometry‖, John Wiley & Sons, Inc, Chichester, London, England, 1998.
[23] L. H. J. Lajunen and P. Peramaki, ―Spectrochemical analysis by atomic
Absorption andEmission‖, University of Oulu, Wakefield, Finland, 2004.
[24] E. Carasek, ―A low-cost flame atomic absorption spectrometry method for
determination of trace metals in aqueous samples‖, Talanta 51 (2000) 173–178.
[25] J. M. Andrade-Garda, ―Basic chemometric techniques in atomic spectroscopy‖,
University of Coruna, Galicia, Spain, 2009.
[26] J. E. Cantle, ―Atomic absorption spectrometry‖, Amsterdam, Netherlands, 1982.

73
[27] O. Y. Ataman, ―Vapor generation and atom traps: atomic absorption
spectrometry at the ng/L level‖, Spectrochim Acta B 63 (2008) 825-834.
[28] B.V. L’Vov, ―Fifty years of atomic absorption spectrometry‖, J Anal Chem 60
(2005) 382–392.
[29] J. R. Dean, ―Atomic absorption and plasma spectroscopy‖, John Wiley&Sons,
England, 1997.
[30] S. Bakırdere, F. Aydın, E. G. Bakırdere, S. Titretir, Ġ. Akdeniz, I. Aydın, E.
Yıldırım, Y.Arslan, ―From mg/kg to pg/kg levels: a story of trace element
determination: areview‖, App Spectrosc Rev 46 (2011) 38-66.
[31] T. Matoušek, ―The efficiency of chemical vapour generation of transition and
noble metals‖, Anal Bioanal Chem 388 (2007) 763-767.
[32] R. E. Sturgeon, X. Guo, Z. Mester, ―Chemical vapor generation: are further
advances yet possible?‖, Anal Bioanal Chem 382 (2005) 881-883.
[33] S. Musil, J. Kratzer, M. Vobecký, J. Hovorka, O. Benada, T. Matoušek,
―Chemical vapor generation of silver for atomic absorption spectrometry with the
multiatomizer: Radiotracer efficiency study and characterization of silver species‖,
Spectrochim Acta B 64 (2009) 1240–1247.
[34] T. Matousek, R. E. Sturgeon, ―Chemical vapour generation of silver: reduced
palladium as permanent reaction modifier for enhanced performance‖, J Anal Atomic
Spectrom 19 (2004) 1014-1016.
[35] T. Matousek, J. Dedina, M. Vobecky, ―Continuous flow chemical vapour
generation of silver for atomic absorption spectrometry using tetrahydroborate(III)
reduction-system performance and assessment of the efficiency using instrumental
neutron activation analysis‖, J Anal Atomic Spectrom 17 (2002) 52-56.
[36] S. Musil, J. Kratzer, M. Vobecký, J. Hovorka, O. Benada, T. Matoušek, ―Silver
chemical vapor generation for atomic absorption spectrometry: minimization of
transport losses, interferences and application to water analysis‖, J Anal Atomic
Spectrom 25 (2010) 1618-1626.
[37] T. Matousek, R. E. Sturgeon, ―Surfactant assisted chemical vapour generation of
silver for AAS and ICP-OES: a mechanistic study‖, J Anal Atomic Spectrom 18
(2003) 487-494.
[38] A. S. Luna, R. E. Sturgeon, R. C. de Campos, ―Chemical vapor generation:
atomic absorption by Ag, Au, Cu, and Zn following reduction of aquo ions with
sodium tetrahydroborate(III)‖, Anal Chem 72 (2000) 3523-3531.
[39] J. Nölte, ―ICP Emission Spectrometry, A Practical Guide‖, Wiley-VCH,
Weinheim, Germany, 2003.

74
[40] E. Pena-vazquez, J. Villanueva-Alonso, P. Bermejo-Barrera, ―Optimization of a
vapour generation method for metal determination using ICP-OES‖, J Anal Atomic
Spectrom 22 (2007) 642-649.
[41] W. Guo, S. Hu, J. Zhang, H. Zhang, ―Elimination of oxide interferences and
determination of ultra-trace silver in soils by ICP-MS with ion–molecule reactions‖,
Sci Total Environ 409 (2011) 2981–2986.
[42] H. Jingyu, L. Zheng, W. Haizhou, ―Determination of trace silver in superalloys
and steelsby inductively coupled plasma-mass spectrometry‖, Anal Chim Acta 451
(2002) 329–335.
[43] K. Ndung’u, M. A. Ranville, R. P. Franks, A. R. Flegal, ―On-line determination
of silver in natural waters by inductively-coupled plasma mass spectrometry:
Influence of organic matter‖, Mar Chem 98 (2006) 109–120.
[44] D. Korkmaz, N. ErtaĢ, O. Y. Ataman, ―A novel silica trap for lead determination
by hydride generation atomic absorption spectrometry‖, Spectrochim Acta B 57
(2002) 571–580.
[45] Ġ. Menemenlioğlu, D. Korkmaz, O. Y. Ataman, ―Determination of antimony by
using a quartz atom trap and electrochemical hydride generation atomic absorption
spectrometry‖, Spectrochim Acta B 62 (2007) 40–47.
[46] J. Kratzer, J. Dedina, ―Stibine and bismuthine trapping in quartz tube atomizers
for atomic absorption spectrometry—Method optimization and analytical
applications‖, Spectrochim Acta B 63 (2008) 843–849.
[47] J. Dedina, ―Atomization of volatile compounds for atomic absorption and
atomic fluorescence spectrometry: On the way towards the ideal atomizer‖,
Spectrochim Acta B 62 (2007) 846–872.
[48] O. Cankur, N. ErtaĢ, O. Y. Ataman, ―Determination of bismuth using on-line
preconcentration by trapping on resistively heated W coil and hydride generation
atomic absorption spectrometry‖, J Anal Atomic Spectrom 17 (2002) 603-609.
[49] F. Barbosa Jr., S. S. de Souza, F. J. Krug, ―In situ trapping of selenium hydride
in rhodium-coated tungsten coil electrothermal atomic absorption spectrometry‖, J
Anal Atomic Spectrom 17 (2002) 382–388.
[50] D. Korkmaz, S. Kumser, N. Ertas, M. Mahmut, O. Y. Ataman, ―Investigations
on nature of re-volatilization from atom trap surfaces in flame AAS‖, J Anal Atomic
Spectrom 17 (2002) 1610–1614.
[51] H. Matusiewicz, ―Atom trapping in situ preconcentration techniques for flame
atomic absorption spectrometry‖, Spectrochim Acta B 52 (1997) 1711-1736.

75
[52] Y.V. Zeljukova, N.S. Poluektov, ―Atomic-absorption analysis by means of
exhaust gases of the flame‖, Zh Anal Khim 18 (1963) 435–439.
[53] I. Rubeska, B. Moldan, ―Investigations on long-path absorption tubes in atomic-
absorption spectroscopy‖, Analyst 93 (1968) 148–152.
[54] H. T. Delves, ―A micro-sampling method for the rapid determination of lead in
blood by atomic-absorption spectrophotometry‖, Analyst 95 (1970) 431–438.
[55] R. J. Watling, ―The use of a slotted quartz tube for the analysis of trace metals in
fresh water‖, Water SA 3 (1977) 218–220.
[56] G. Kaya, M. Yaman, ―Online preconcentration for the determination of lead,
cadmium and copper by slotted tube atom trap (STAT)-flame atomic absorption
spectrometry‖, Talanta 75 (2008) 1127–1133.
[57] R. J. Watling, ―The use of a slotted tube for the determination of lead, zinc,
cadmium, bismuth, cobalt, manganese and silver by atomic absorption
spectrometry‖, Anal Chim Acta 97 (1978) 395–398.
[58] R. J. Watling, ―The use of a slotted quartz tube for the determination of arsenic,
antimony, selenium and mercury‖, Anal Chim Acta 94 (1977) 181–186.
[59] C. Lau, A. Held, R. Stephens, ―Sensitivity enhancements to flame AAS by use
of a flame atom trap‖, Can J Spectrosc 21 (1976) 100–104.
[60] A. D. Turner, D. J. Roberts, ―Metal determinations with a novel slotted-tube
water-cooled atom trap‖, J Anal Atomic Spectrom 11 (1996) 231–234.
[61]J. Khalighie, A. M. Ure, T. S. West, ―Some observations on the mechanisms of
atomization in atomic absorption spectrometry with atom-trapping and
electrothermal techniques‖, Anal Chim Acta 117 (1980) 257–266.
[62] J. Khalighie, A. M. Ure, T. S. West, ―Atom-trapping absorption spectrometry
with water-cooled metal collectors tubes‖, Anal Chim Acta 134 (1982) 271–281.
[63] C. M. Lau, A. M. Ure, T. S. West, ―The determination of selenium by atom-
trapping atomic absorption spectrometry‖, Anal Chim Acta 141 (1982) 213–224.
[64] H. Sun, L. Yang, D. Zhang, J. Sun, ―Direct determination of silver at parts-per-
billion level in waters by derivative atomic absorption spectrometry using the atom
trapping technique‖, Anal Chim Acta 353 (1997) 79-84.
[65] H. Matusiewicz, M. Kopras, ―Methods for improving the sensitivity in atom
trapping flame atomic absorption spectrometry: analytical scheme for the direct
determination of trace elements in beer‖, J Anal Atomic Spectrom 12 (1997) 1287-
1291.

76
[66] O. Y. Ataman, ―Economical alternatives for high sensitivity in atomic
spectrometry laboratory‖, Pak. J. Anal. Chem. 8 (2007) 64-68.
[67] Ġ. DemirtaĢ, M.S. thesis, ―Lead determination by flame atomic absorption
spectrometry using a slotted quartz tube atom trap and metal coatings‖, Middle East
Technical University, Ankara, Turkey, 2009.
[68] S. Kumser, M.S. thesis, ―Atom trapping atomic absorption spectrometry using
organic solvent atomization‖, Middle East Technical University, Ankara, Turkey,
1995.
[69] D. Korkmaz, M. Mahmut, R. Helles, N. ErtaĢ, O. Y. Ataman, ―Interference
studies in slotted silica tube trap technique‖, J Anal Atomic Spectrom 18 (2003) 99–
104.
[70] N. Ertas, D. Korkmaz, S. Kumser, O. Y. Ataman, ―Novel traps and atomization
techniques for flame AAS‖, J Anal Atomic Spectrom 17 (2002) 1415–1420.
[71] ġ. Süzer, N. ErtaĢ, S. Kumser, O. Y. Ataman, ―X-ray photoelectron
spectroscopic characterization of Au collected with atom trapping on silica for
atomic absorption spectrometry‖ Appl Spectrosc 51 (1997) 1537-1539.
[72] National Institute for Occupational Safety and Health, Pocket Guide to
Chemical Hazards, http://www.cdc.gov/niosh/npg/npgd0326.html, last accessed in
13.08.2011.
[73] D. A. Skoog, F. J. Holler, S. R. Crouch, ―Principles of Instrumental Analysis‖,
Thomson Brooks/Cole, USA, 6th edition, 2007.
[74] I. Lopez-Garcia, N. Campillo, I. Arnau-Jerez, M. Hernandez-Cordoba, ―Slurry
sampling for the determination of silver and gold in soils and sediments using
electrothermal atomic absorption spectrometry‖ Spectrochim Acta B 58 (2003) 1715–
1721.
[75] D. Briggs, M. P. Seah, ―Practical Surface Analysis (2nd ed.)‖, N° Publi: 150
Ref: John WILEY & SONS, Vol. 1, 1993.