determination of residential-use turf pesticides in
TRANSCRIPT

The University of MaineDigitalCommons@UMaine
Electronic Theses and Dissertations Fogler Library
12-2003
Determination of Residential-Use Turf Pesticides inSurface and Ground Water by HPLC/DADDanyun Zhu
Follow this and additional works at: http://digitalcommons.library.umaine.edu/etd
Part of the Food Science Commons
This Open-Access Thesis is brought to you for free and open access by DigitalCommons@UMaine. It has been accepted for inclusion in ElectronicTheses and Dissertations by an authorized administrator of DigitalCommons@UMaine.
Recommended CitationZhu, Danyun, "Determination of Residential-Use Turf Pesticides in Surface and Ground Water by HPLC/DAD" (2003). ElectronicTheses and Dissertations. 83.http://digitalcommons.library.umaine.edu/etd/83

DETERMINATION OF RESIDENTIAL - USE TURF PESTICIDES
IN SURFACE AND GROUND WATER BY HPLCIDAD
BY
Danyun Zhu
B.S. Hefei United University, 1984
A THESIS
Submitted in Partial Fulfillment of the
Requirements for the Degree of
Master of Science
(in Food Science and Human Nutrition)
The Graduate School
The University of Maine
December, 2003
Advisory Committee:
Rodney J. Bushway, Professor of Food Science and Human Nutrition, Co-Advisor
L. Brian Perkins, Research Chemist of Food Science and Human Nutrition, Co-Advisor
Alfred A. Bushway, Professor of Food Science and Human Nutrition

LIBRARY RIGHTS STATEMENT
In presenting this thesis in partial f~dfillment of the rccpircmcnts f o r a11 ndvmce(1
degree at The University of Maine. I agree that the Library shall mdtc it li-cci! available
for inspection. I further agree that pennission for "fair use'' copying of this ~liesis for
scholarly purposes may be granted by the Librarian. It is understood that any copying or
publication of this thesis for financial gain shall not be allo\ved w i t h o ~ ~ l 111y written
pennission.
Signature: Bu J

DETERMlNATION OF RESIDENTIAL - USE TURF PESTICPDES
IN SURFACE AND GROUND WATER BY HPLCIDAI)
By Danyun Zhu
Thesis Co-Advisor: Dr. Rodney J. Bushway and Dr. L. Brian ['erliins
An Abstract of the Thesis Presented in Partial Fulfillment of the Requirements for the
Degree of Master of Science (in Food Science and I~uman Nutrition)
December. 2003
A simple. relatively fast, and efficient method has been developed for the
simultaneous detection of residual levels of the pesticides dithiopyr, fenoxaprop-1'-e~hyl,
l~alofenozide, and oryzalin in surface and ground water. This method involves solid phase
(SPE) extraction/clean-up of these pesticides from water, followed by detcction and
quantification by a high performance liquid chromatograph (HPLC) equipped with a
photo diode array detector (DAD). The recoveries for dithiopyr, fenoxaprop-l'-c~I~yl.
halofenozide, and oryzalin were performed by fortifying ground water from 0.1 ppb to
100 ppb, and surface water from 0.2 ppb to 100 ppb. For ground water, percent
recoveries ranged from 89 to 122 with an average percent coefficient of variation (%CV)
of 8.1 for dithiopyr, 82 to 94 with an average %CV of 6.6 for fenoxaprop-P-ethyl. 98 to
1 1 5 with an average %CV of 6.9 for halofenozide. and 95 to 1 1 0 with an average '%CV
of 5.7 for oryzalin. For surface water, percent recoveries ranged from 82 to 93 \\:it11 an
average %CV of 5.5 for dithiopyr, 78 to 98 with an average %CV of 4.8 for fenoxaprop-
P-ethyl, 91 to 102 with an average %CV of 3.2 for halofenozide, and 91 to 100 with an

average %CV of 5.6 for oryzalin. The limit of quantitation for dithiopyr, fenoxaprop-P-
ethyl, halofenozide, and oryzalin were 0.50 ppb, 0.15 ppb, 0.1 0 ppb, and 0.10 ppb for
ground water; 0.50 ppb, 0.30 ppb, 0.20 ppb. and 0.20 ppb for surface ~vater.
Reproducibility studies showed that for ground water, %CVs ranged from 2.6 to 25 for
dithiopyr, 2.5 to 24 for fenoxaprop-P-ethyl, 1.0 to 9.3 for halofenozide, and 2.0 to 14 for
oryzalin. For surface water, the %CVs ranged from 2.2 to 17 for dithopyr, 2.3 to 12 for
fenoxaprop-P-ethyl, 0.80 to 9.9 for halofenozide, and 3.9 to 12 for oryzalin.

ACKNOWLEDGMENTS
First, I would like to express my sincere gratitude and deep appreciation to my
advisors. Dr. Rodney J. Bushway and Dr. L. Brian Perkins, for their encouragement,
guidance and direction throughout my graduate career and during the completion of this
thesis, as well as their enduring patience and advice. Their help smoothed my work very
much and their immense patience was essential to the completion of this thesis.
Thanks also to the member of my thesis committee, Dr. Alfred A. Bushway, for
his willingness to serve on my thesis committee, for his counsel and assistance. His
advise, comments, and suggestions provided significant support and impact on the overall
effectiveness of this thesis.
I sincerely thank Dr. Mary Ellen Camire and Dr. Denise I. Skonberg for their
support and encouragement during my graduate studies. Thanks also to Kelly Guthrie for
her friendly help. She was always there to answer any questions.
I also would like to take this opportunity to extend my thanks to each one of my
friends, here in the U.S. and back home, for their truthful and sincere helping me get
through two years of graduate school.
Finally, I would like to thank my family for their understanding and support
throughout my graduate years.

TABLE OF CONTENTS
. . ACKNOWLEDGMENTS ........................................................................ 11
LIST OF TABLES ................................................................................ v
LIST OF FIGURES .............................................................................. vi
. . LIST OF ABBREVIATIONS ................................................................... VII
INTRODUCTION ................................................................................ 1
LlTERATURE REVIEW ........................................................................ 3
Pesticides Runoff and Leaching ............................................................ 3
Compound Related Factors ........................................................ 3
Environmental Factors .............................................................. 5
Selected Turfgrass Pesticides ............................................................... 8
Chemical and Usage ................................................................ 8
Fate and Behavior ................................................................. 13
. . Toxicity ............................................................................. 18
Analysis Methods .................................................................. 24
MATERIALS AND METHODS .............................................................. 35
Sample Collection .......................................................................... 35
Pesticides ..................................................................................... 35
...................................................................................... Solvents 35
................................................. HPLC System and Operating Condition 35

Preparation of Standard Solutions ........................................................ 36
Sample Preparation ......................................................................... 36
............................................................................. Standard Curves 37
Recovery Studies .......................................................................... -37
Reproducibility Studies .................................................................... 38
RESULTS AND DISCUSSION ............................................................... 39
Optimum Conditions ....................................................................... 39
Retention Time ............................................................................... 44
Limit of Detection (LOD) and Limit of Quantitation (LOQ) ......................... 44
Linearity Studies ............................................................................ 44
Recovery Studies .......................................................................... S O
.................................................................... Reproducibility Studies 58
CONCLUSION ................................................................................... 61
REFERENCES .................................................................................... 62
BIOGRAPHY OF THE AUTHOR ............................................................ 68

LIST OF TABLES
.......................... . Table 1 Factors Affecting the Pathway of Potential Contamination 5
Table 2 . Factors Influencing Water Contamination ............................................. 8
Table 3 . The Major Physical Chemical Properties of Dithiopyr. Fenoxaprop.P.ethy1. Halofenozide. and Oryzalin ............................................................. 12
Table 4 . Acute Toxicity Data for Dithiopyr ..................................................... 19
. ......................................... Table 5 Acute Toxicity Data for Fenoxaprop.P.ethy1 20
. Table 6 Acute Toxicity Data for Halofenozide ................................................. 21
Table 7 . Acute Toxicity Data for Oryzalin ...................................................... 23
Table 8 . Methods for Analysis of Dithiopyr ..................................................... 30
Table 9 . Methods for Analysis of Fenoxaprop.P.ethy1 ........................................ 31
Table 10 . Methods for Analysis of Halofenozide ............................................... 32
-I -I Table 1 1 . Methods for Analysis of Oryzalin .................................................... J J
Table 12 . Separation Results from Different HPLC Columns ................................ 41
Table 13 . Recoveries from Different Elute Solvent Volumes ................................. 43
Table 14 . The LOD and LOQ of Dithiopyr. Fenoxaprop.P.ethy1. Halofenozide. and Oryzalin in Ground and Surface Water .............................................. 45
..................... Table 15 . Percent Recovery of Fortified Samples from Ground Water 51
..................... Table 16 . Percent Recovery of Fortified Samples from Surface Water 52
Table 17 . Reproducibility of Fortified Samples from Ground Water ........................ 59
Table 18 . Reproducibility of Fortified Samples from Surface Water ........................ 60

LIST OF FIGURES
......................................... Figure 1 . Chemical Structures of the Turf Pesticides 11
................................................ Figure 2 . Fate of Pesticides in the Environment 14
.......................................................... Figure 3 . Standard Curve of Dithiopyr 46
.............................................. Figure 4 . Standard Curve of Fenoxaprop-P-ethyl 47
...................................................... Figure 5 . Standard Curve of Halofenozide 48
............................................................ Figure 6 . Standard Curve of Oryzalin 49
................................. Figure 7 . HPLC-DAD Chromatogram of Standard Mixture 53
...................................... Figure 8 . HPLC-DAD Chromatogram of Ground Water 54
............................ Figure 9 . HPLC-DAD Chromatograin of Spiked Ground Water 55
..................................... Figure 10 . HPLC-DAD Chromatogram of Surface Water 56
............................ Figure 11 . HPLC-DAD Chromatogram of Spiked Surface Water 57

vii
LIST OF ABBREVIATIONS
A1 BCF cv DAD DT5o ECco
ECD GC H' HPLC Koc/Kd KO, LC50 LD50 LLE LOD LOQ MRL MS MTBE NPD PAN PPB PPM R~ S SPE T1/2 THF uv
Active ingredient Bioconcentration vector Coefficient of variation Diode array detector Chemical half-life in water (days) Effective concentration at which the desired response is present for 50 % of the population Electron capture detector Gas chromatography Henry's Law Constant High performance liquid cl~romatography Sorption coefficient Octanollwater partition coefficient Lethal concentration of a compound for 50 % of a test population Lethal dose of a compound for 50 % of a test population Liquid - liquid extraction Limit of detection Limit of quailtitation Limit of maximum residue Mass spectrometry Methyl tert butyl ether Nitrogen - phosphorous detector Pesticide Action Network Parts per billion Parts per million Coefficient of determination Solubility Solid phase extraction Half - life Tetrahydro furan Ultraviolet

INTRODUCTION
As urban areas expand, turf areas have been increased rapidly througl~out the
United States since the 1960s, and now they cover more than 30 million acres, including
50 million home lawns, golf courses, parks, athletic fields, cemeteries, sod farms, and
other sites (Walston et al., 2001). Color, uniformity, and density of the turfgrass will be
affected adversely by incursions of weeds, disease, and insects. The public demand for
high quality and uniform turf often requires the use of intensive management strategies to
maximize pest control and nutrient availability (Walston et al., 2001). The use of
pesticides has significantly contributed to the overall aesthetic quality of turfgrasses.
The major concern for the impact of pesticides on the environment is their potential
entrance into drinking water sources which is facilitated by nlovement in surface water
and groundwater from the treated site (Gilliom et al., 1999). Studies in urban watersheds
from the U.S. Geological Survey National Water Quality Assessment indicated
widespread presence of pesticides typically used in lawns, gardens, and golf courses
(USGS, 1999). Other studies also detected many pesticides in surface and ground waters
on or near golf courses, including nine pesticides that exceeded maximum allowable
concentrations based on protection of aquatic species (Cohen et al, 1999).
Winters in the Maine can be long and cold. Soils are generally frozen during this
period (December-March). Significant runoff can occur in the winter due to snowmelt or
rainfall on frozen soils, which can contain and transport unused or unbound pesticides
from turfgrass despite the fact that no compounds were applied in the winter (Easton,

2003). Furthermore when the temperature is below freezing, the time needed to break
down a pesticide increases.
Because of these factors. information is needed concerning pesticides' pollution
potential, its fate in agricultural runoff and other aquatic environ~nents. Analytical
methodology is, therefore, needed for the determination of pesticides in surface and
ground water.
The purpose of this thesis was to develop a method to reduce sample handing
while providing reproducible and sensitivity results for the determination of pesticides in
surface and ground water using a high performance liquid chromatograph (I-IPLC)
equipped with a photo diode array detector (DAD). To obtain efficient pre-concentration
with good precision and recovery, a Styrene-divinylbenzene copolymer was selected as
the solid phase for the extraction of pesticides from water. Finally, the proposed method
was validated. The parameters involved in the validation were linearity, linlits of
detection (LOD) and quantification (LOQ), precision (reproducibility). and recovery. The
pesticides were dithiopyr, fenoxaprop-P-ethyl, halofenozide, and oryzalin. These
pesticides are commonly used on turfgrasses in Maine.

LITERATURE REVIEW
Pesticides Runoff and Leaching
Runoff and leaching are two major ways that pesticides can reach surface and
ground water. Runoff will occur if the chemical does not adsorb onto soil. Leaching will
occur if the chemical is weakly adsorbed by soil and can easily move through the soil
proiile. Amounts of leaching and runoff are largely affected by two major groups factors
- compound related factors and environmental factors.
Compound Related Factors
Initiul levels. The larger the initial levels, the greater the potential for runoff and
leaching. Larger initial levels of chemicals (e.g., > 2-3 Ib/A active ingredient) generally
take more time to break down than smaller levels (e.g., < 2 Ib/A a.i.) (Deubert, 1990).
Precipitation or sprinkler irrigation may wash more material into the ground or surface
water after the application of a heavy dose as compared to a light dose.
Solubility in wuter. Solubility is a measure of the amount of chen~ical that can
dissolve in water. Water solubility is an important factor i n determining a pesticide's
tendency to move through the soil profile with infiltrating water, and over the soil with
runoff. As a rule of thumb, liigldy water-soluble pesticides leach or runoff faster than the
less-soluble ones. Pesticides with > 30 ppm solubility may be considered mobile in sandy
soil when their persistence is high and their adsorption is low (Deubert, 1990). Polar

cl~emicals tend to dissolve in water and non-polar chemicals tend to partition in non-polar
organisms or soil since these are made up of ~nolecules conlprising of non-polar C-H
bonds. Salts and acids tend to remain dissolved in water until degraded through
photolysis or hydrolysis. Esters will often adsorb to the suspended matter in water, and
precipitate to the sediments. Once in the sediments, esters can remain adsorbed to soil
particles or be degraded through microbial metabolism. Highly acidic or alkaline waters
can chemically alter an herbicide and change its behavior in water. The average pH
oftypical surface waters is between five and nine (Hutzinger 198 1).
Persistence. Persistence is reported as half-life, i.e., the time it takes for 50% of a
given substance to break down. Compounds with a half-life of > 3-4 months are
considered persistent, while those with a half-life of < 1 month are considered non-
persistent (Deubert, 1990). Chemicals are usually more persistent in dry, compacted, cold
soil than in moist, warm, well-aerated soil. Dry spells after an application may extend the
persistence of a chemical in the ground (Deubert, 1990).
Adsorpfion: Adsorption describes the tendancy of a pesticide to bind soil particles
and is reported as the adsorption coefficient (Koc), whereby Koc < 300-500 is considered
low adsorption. Adsorbed chemicals do not move with the soil water but remain adsorbed
while the water moves towards the ground or surface water (Van Es, 1990). A polar
pesticide is very water soluble and tends not to be adsorbed onto soil. Pesticides that are
non-polar tend to leave water and be adsorbed onto soil especially soils contain high

concentrations of non-polar carbon material. Table I lists where a chemical is likely to
end up depending on its Koc value and its persistence in the environment.
Table 1. Factors Affecting the Pathway of Potential Water Contamination
(Rao et a]., 1983)
Koc
Low
Low
High
Environmental Factors
Interception by leaves and thatch. Leaves and thatch are rich in organic carbon.
High organic carbon can increase sorption of pesticides and increase microbial
degradation, and therefore attenuate movement of pesticides in soil (OSLJ. 2003).
High
Photodegradation. In the atmosphere, there are two major degradation pathways
that occur. The first is photochemical reactions caused by sunlight and the second is free
radical reactions. The products formed may or may not be more toxic than the parent
chemical. Sunlight may break down a chemical deposited on a leaf surface.
Photochemical reactions can take place in air or water when s~lnlight is present.
Potential contaminating
Ground water
Half-life
Long
Short
Long
Pathway of loss
Leaching
" if only heavy rains or irrigation occur soon after pesticide applicalion
Short
Leaching
Runoff
Ground water*
Surface water
Runoff Surface water*

Precipitation. Precipitation up to several days after an application washes residues
off the leaves and moves them into the ground or surface water. This can be significant
for soluble chemicals (> 30 ppm) in sandy soil containiilg small amounts of organic
matter. The farther apart the rainfall events and the less precipitation, the less the
potential for leaching (Deubert, 1990).
Topography (slope). The topography of an area may affect the distribution of a
chemical through surface runoff, provided the conditions are favorable. Dry formulations
as well as residues adsorbed on soil particles are affected. Residues may accumulate in
low spots, thus increasing the residue load of an area. This can be significant where the
groundwater table is high (1-2 ft.) (Deubert, 1990).
Soil properties. Soil properties are also important, as each soil has a characteristic
ability to adsorb pesticides. Soils high in clay or organic matter adsorb pesticides better
than sandy soils low in organic matter. I11 addition, organic matter serves as nutrient
substrate for microorganisms active in the breakdown of residues. The more organic
matter there is, the more adsorption and breakdown occur, and the likelihood of leaching
is greatly reduced (Deubert, 1990). Soil structure determines the infiltration rate. Rapidly
infiltrating water may move pesticides on the surface deeper into the soil as they have
less time for sorption. Soils that weakly adsorb pesticides and have a rapid infiltration
rate are more sensitive to groundwater pollution than soils that strongly adsorb pesticides
and have a slow infiltration rate. Soil sorption and infiltration rate also determine
pesticide loss in runoff. Soils with slow infiltration rate may be more prone to runoff, as

more water will remain on the surface. Pesticides adsorbed to soil will not be lost to
runoff. However, if runoff results in soil erosion, pesticides adsorbed to surface soil will
also move with runoff. Soil texture affects the movement of water as the carrier of the
pesticide, and indirectly the adsorption of the chemical on soil particles. Sandy soils
retain less water and pesticides than clay soils or organic soils. The heavier the soil, the
lower the potential for leaching. Soil moisture is essential for soil microorganisins
activity in the breakdown of pesticide residues. Obviously, residues are more persistent in
dry than in moist soils.
Root density. The root zone is the most active part of the topsoil for the break
down of pesticide residues due to aeration and activity of microorganisms. The healthier
and the denser the root system, the more break down takes place and the lower the
potential is for leaching.
Table 2 summarizes the factors that contribute to the potential of ground and
surface water contamination.

Table 2. Factors Influencing Water Contamination (Modified fro111 Kenna, 1995)
1 Factor i Values I Water solubility > 300 ppm
Soil adsorption coefficient (Koc) < 300 - 500
Hydrolysis (half - life) > 25 wcelts
Photolysis (half - life)
Field dissipation (half - life)
, 1 \~eeIi
> 3 weeits
Aerobic soil inetabolism (half - life)
Selected Turfgrass Pesticides
The turfgrass pesticides are chemicals that are applied to lawns and gardens to
control weeds, bugs, fungus and other unwanted living organisms. Some commonly used
turfgrass pesticides in Maine include dithiopyr, fenoxaprop-P-ethyl, halofenozide. and
oryzalin. The following sections represent a review of the chemical and usage, fate and
behavior, toxicity, and analytical methods of these turfgrass pesticides.
> 3 weelts
Anaerobic soil metabolism (half - life)
Chemical and Usage
Dithiopyr. The scientific name of dithiopyr (CAS # 97886-45-8) is S,S-Dimethyl-
2-(difluorometl1yl)-4-(2inetl1ylpropyl)-6-(triluoron1etl1yl)-3,5-pyridi1edicabotl1ioic acid
(Figure 1). The trade name is Dimension. It is also known by the development code
nunlber MON 7200. The major pl~ysical/chemical properties are listed in Table 3.
> 3 weeks

Dithiopyr is a member of pyridine family. I t was introduced by Monsanto and
subsequently sold to Rohnl and Haas in 1994. It is a pre-emergence and early post-
emergence herbicide used to control of annual grass and selected broad-leaved weeds in
turf at 0.25 to 1.0 lbla. Its mode of action is to inhibit cell division by disrupting spindle
microtubule formation (British Crop Protection Council, 2000).
Fenoxu~~~op-P-ethyl. Fenoxaprop-P-ethyl (CAS # 7 1283-80-2) is the proposed
common name for (+)-ethyl 2-(4-(6-chloro-2-benzoxazolyloxy)-phenoxy)-propai1oate
(Figure 1). The trade names are Acclaim Super and Excel Super. It is also known by the
Hoechst code number HOE 046360. Its major physical/chemical properties are listed in
Table 3. Fenoxaprop-P-ethyl is a member of the phenoxy chemical group. I t was
discovered by H.P. Huff et al. (1989) and introduced by Hoechst AG (now AgrEvo
GmbH). The product is used for post-emergence control of annual and perennial grass
weeds in potatoes, beans, beets, vegetables, peanuts, flax, oilseed rape, and cotton; and
(when applied with the herbicide Safener mefenpyr-diethyl) annual and perennial grass
weeds and wild oats in wheat, rye, triticale, and in some barley varieties (British Crop
Protection Council, 2000). Fenoxaprop-P-ethyl is a selective and systemic herbicide
primarily absorbed through the leaves of plants and is translocated in the xylem and
phloem, where it is changed to the free phenoxy acid to inhibit the biosynthesis of fatty
acid (Food and EPA, 1985).
Hdofenozide. Halofenozide (CAS # 1 12226-61-6) is the proposed common name
for 4-chlorobenzoic acid 2-benzoyl-2-(I. 1 -dimethylethyl)hydrazide (Figure I ) . The trade
name is Mach 2. It is also known by the development code number RH-0345. The major

pl~ysicallcl~einical properties are listed in Table 3. Halofenozide is a member of the new
diacylhydrazine class of insecticides. It is a joint venture between Rohm and Haas and
America1 Cyanamid, and is registered for control of Coleoptera and Lepidoptera in turf
and ornamentals at 0.5-2.0 lbla (British Crop Protection Council, 2000). Halofenozide is
a systemic, ingested insecticide. Its mode of action is to inhibit insect by binding the
receptor site of the hormone ecdysone. The result is premature molting, resulting in a loss
of heinolymph and molting fluid, which causes desiccation, and death of the larvae
(Gardner et al., 200 1 ).
Oryzulin. Oryzalin (CAS # 19044-88-3) is the proposed name for 4-
(dipropy1amino)-3,5-dinitrobenzenesulfonamide (Figure 1). It is also l<nown by the
development code number EL-1 19 and is available in aqueous suspension, dry flowable,
and wettable powder formulations. The major physicallchen~ical properties are listed in
Table 3. Oryzalin is a dinitroaniline sulfonamide herbicide. It was first reported by
Gramlich et al. (1969), introduced in Bulgaria by Eli Lilly & Co. (now DowElanco) in
1973, and was first registered by the U.S. Environmental Protection Agency (EPA) in
1974. Oryzalin is a selective, pre-emergence, surface-applied herbicide used for control
of ailnual grasses and broadleaf weeds in fruit trees. nut trees, vineyards, established
bermudagrass turf, and established ornamentals. It inhibits the growth of germinating
weed seeds by blocking cell division in the meristeins (Meister, 1992).

CH3 I
c ' \ ~ ~ > o ~ - o - c -C02C2H5 / \ 0 -
COSCH, '"8u"" CH,SOC H I
CH2CH(CH3)2
Ditliopyr Fenoxaprop-P-ethyl
Halofenozide Oryzal in
Figure 1. The Chemical Structures of Four Pesticides

2 2 . " ~2
cd 0 V m
C .I
r:, .2 5
1 m i - q g 0 V

Fate and Behavior
When a pesticide is used in the environment, it becomes distributed among four
major compartments: water, air, soil, and biota (living organisms). The fraction of the
chemical that will move into each compartment is governed by the physio-chemical
properties of that chemical (Linde, 1994). Figure 2 illustrates the flow for the major routs
of travel for pesticides in the environment. Pesticides are distributed in the enviroilment
by physical processes such as sedimentation, adsorption, and volatilization. They can
then be degraded by chemical and / or biological processes. Chemical processes generally
occur in water or the atmosphere and follow one of four reactions: oxidation, reduction,
hydrolysis, and photolysis. Biological mechanisms in soil and living organisms utilize
oxidation, reduction, hydrolysis and conjugation to degrade chemicals (Linde, 1994).
Chemicals that have high solubility will remain in water. A pesticide reacts with water to
form degradation products that can be distributed in the environment. Chemicals that are
non-polar tend tp be pushed out of water and onto soils which contain non-polar carbon
material. Bioconcentration factor (BCF) is an indicator of how much a chemical will
accumulate in living organisms (linde, 1994). Polar chemicals are soluble in water (polar)
and not very soluble in tissues (non-polar), whereas non-polar chemicals will accumulate
in fatty tissues. Henry's law constant (H') is a measure of the concentration of a chemical
in air over its concentration in water (Linde, 1994). A pesticide with a high H' will
volatilize from water into air and be distributed over a large area. Chemicals with a low
H' tend to persist in water and may be adsorbed onto soil. Pesticides with high vapor
pressures may become environmental problems because they can volatilize and disperse
over a large area.

Chemical
Atmosphere
+ ' BCF Biota
Figure 2. Fate of Pesticides in the Environment

Concerns associated with pesticides use include eiwironmental containination and
nonselectivity. Contamination of the water supply can have toxic effects on plants and
wildlife in the area of administration. Contamination of the food being produced can have
widespread effects, as well. Pesticides may pose threats to nontarget organisms. Whether
these nontarget organisms are humans, wildlife. or plant life; the use of pesticides may
pose a threat to the environinent that should be considered carefully.
Dithiopyr. When dithiopyr is released to the sod and soil surface, it inetabolizes
rapidly by photodegradation and volatilization. Upon entry into the root media, biotic and
abiotic mediated degradation occurs at a much slower rate compared to loss by
volatilization. When exiting the golf course greens in the solution, the con~pound can be
further degraded by UV light, as well as by biological and abiotic mediated processes
(Hong, 1996). The half-life in soil is 17-61 days depending on the forinulation type. The
major soil metabolites are the di-acid, the normal nlono-acid and the reverse mono-acid.
These metabolites, dissipate almost completely within one year. (British Crop Protection
Council, 2000). When dithiopyr is fed to rats. it is rapidly absorbed, extensively
inetabolized and rapidly excreted. Transforination of dithiopyr by rat liver enzymes "in
vitro" produces the inonoacids as the predominant metabolites (Feng, 1991). The low
water solubility (1 3 8 ppm), high octanol-water partition coefficient (Kow = 56,250), and
organic carbon partition coefficient (Koc = 1920) suggest a high potential of dithiopyr
retention within the thatch, mat, and surface soil (Schleicher, 1995). Modeling results and
calculations (based upon field studies) performed by the Department of Health

(NYSDEC, 1993) indicate that groundwater concentrations of dithiopyr and its
metabolites could approach or exceed the potential groundwater standard of 25 ppm
(dithiopyr) and 50 ppm (each metabolite).
Fenoxcyrop-P-dhyl. Fenoxaprop-P-ethyl is stable for 90 days at 50 "C. It is not
sensitive to light, but can be decomposed by acids and alkalis. At 20 "C, the DT 50 >
1000 days at pH 5, 100 days at pH 7, and 2.4 days at pH 9 (British Crop Protection
Council, 2000). When fenoxaprop-P-ethyl is released to the soil, it breaks down rapidly
to the free acid, which is subsequently degraded by 90% within 13 to 38 days with partial
inineralisatioil can also taking place. Studies show that parent coinpounds and major
metabolites are unlikely to leach from soil (Food & EPA, 1985). No data has been
submitted for the behaviour of fenoxaprop-P-ethyl in water, therefore, extrapolation from
the studies on fenoxaprop-P-ethyl should be made. The metabolism and degradation of
fenoxaprop-P-ethyl in plants is first hydrolyzed to 2-(4-(6-chloro-2-benzoxazo1oxy)-
phenoxy)-propionic acid 'B' HOE 053022. Fenoxaprop-P-ethyl also hydrolyzes to the
D+ form of this acid 'P' HOE 088406. In wheat these acids undergo cleavage of the
benzoxazolyloxy-linkage to form 6-chloro-2,3-dihidro-benzoxazol-2-one HOE 054014.
Further degradation takes place to form polar conjugates and bound residues (Food &
EPA, 1985). When fenoxaprop-P-ethyl is fed to rats, it is rapidly adsorbed and excreted.
The metabolism of fenoxaprop-P-ethyl proceeds via identical pathways to those
determined for the racemate (Food & EPA, 1985).

Halofinozide. Halofenozide is stable to heat, light, and water. The hydrolysis DT
50 is 3 10 days at pH 5, 481 days at pH 7, and 226 days at pH 9. When halofenozide is
applied to soil, the half-life, under aerobic laboratory conditions is 68-72 days in silt
loam. 653-8 18 days in sandy loam; soil dissipation half-life is 46-267 day in the field;
turf half-life is 3-7 days; the half-life for soil photolysis is 129 clays. When halofenozide
is released to surface water, the pond water photolysis half-life is 10 days (British Crop
Protection Council, 2000). According to the PAN Pesticides Database, halofenozide has a
related high water solubility (12.3 ppm) with the hydrolysis half-life of 30 days. Aerobic
soil half-life is 21 8.9 days, anaerobic soil half-life is 60 days, the adsorption coefficient
(Koc) is 1.78. Therefore halofenozide has the potential to contaminate water. No data has
been found for the fate behaviour of halofenozide in animals.
Oryzalin. When oryzalin is released to the atmosphere, it will degrade rapidly in
the vapor-phase by reacting with photochemically produced hydroxyl radicals (half-life
of about 3.7 hr) (Spectrum Laboratories). When released to soil or \\ater. orj~zalin may
degrade through microbial degradation and photodecomposition. Oryzalin has a water
solubility of 2.5 uglml, and it does not have a strong tendency to adsorb to soil particles
(USDA, 1990). These properties indicate a potential for offsite movement by runoff and
percolation. It leaches downward to a limited extent with rainfall (WSSA, 1989) and has
a moderate potential to contaminate groundwater (USDA, 1990). Its soil half - life is
estimated to be 20 days (IJSDA, 1990). Microbial degradation may be responsible for the
breakdown of oryzalin in soils. It is subject to photodecomposition, but not volatilization
at the soil surface (WSSA, 1989). Oryzalin has a low solubility in water. No hydrolysis of

oryzalin was observed at pH 5, 7, and 9 (WSDOT, 1993). It has a high potential of runoff
(Koc = 600 cm3Ig, = 42 day) and to contaminate surface water (Guo, 2000). Plant
metabolisin of oryzalin is minimal. Uninetabolized oryzalin is rarely detected ( WSDOT,
1993). When used at the recommended level. damage to plants in the follo\ving year is
not expected (The Royal Society of Chemistry, 1983). When it was administered to male
rats, 40% of the dose was excreted in the urine and 40% in the feces within 3 days.
Similar results were obtained from tests with rabbits, a 400 pound steer, and with IXhesus
monkeys (USEPA, 1987).
Toxicity
Dithiopyr. Dithiopyr has low acute mammalian toxicity following oral, dermal or
inhalation exposure. The toxicity category established by WHO is 111, which nleans the
acute toxicity rating is slightly toxic. The sulninary of acute toxicity data is listed in Table
4. Repeated exposure to dithiopyr may cause ltidney, lijrer. blood, and adrenal effects. as
well as thyroid damage. Subchronic and chronic exposure produces primarily liver and
kidney toxicity. Dithiopyr did not produce any tumors in long-tenn animal studies. No
birth defects were observed in rabbit and rat given dithiopyr during pregnancy (Dow
AgroSciences Inc., 2001). Dithiopyr is considered toxic to bees and fish, and somewhat
toxic to aquatic invertebrates. Dithiopyr shows a slight acute toxic to birds but no chronic
toxicity. Bio-concentration data is not available (Dow AgroSciences Inc., 2001).
Dithiopyr is not genotoxic or oncogenic and does not interfere with norinal reproduction
and development. (Ward, 1993)

Table 4. Acute Toxicity Data for Dithiopyr (Dow AgroSciences Inc., 2000)
Test Results
Oral LD jo (rat)
Dermal LD jo (rabbit)
Inhalation LCso (rat)
Eye Irritation (rabbit)
Skin Absorption LDjo (rat and rabbit)
Skin Irritation (rabbit)
Skin Sensitization (sensitive individuals)
3600 mglkg
> 5000 mglkg
1 1 mg/L for 4 hr
Substantial irritation
> 5000 mglkg
Severe irritation
Positive
Fenoxaprop-P-ethyl. Fenoxaprop-P-ethyl demonstrates low acute inaininalian
toxicity following acute oral, dermal or inhalation exposure. The suininary of acute
toxicity data is listed in Table 5. The toxicity to birds was generally low with a oral LDso
> 2000 mglkg. Whereas the toxicity to the aquatic organisms is high. The LCjo for
rainbow trout is 0.57 mgll for 96 hours and ECso for daphnia magila is 0.56 mgI1 Sor 48
hours. Fenoxaprop-P-ethyl shows a low toxicity to bees (Bayer Cropscience, 2002).
Fenoxaprop-P-ethyl is a slight to moderate skin irritant, depending on the contact time.
Sub-chronic studies in rats and mice shows reduced blood lipids and cholesterol and
increased liver weights, but these changes are reversible. These iindings were not
apparent in lifetime feeding studies in rats and mice, confirming their transient nature.

Birth defects studies were performed in mice, rats, rabbits and monkeys by both oral and
dermal exposure. No embryotoxic or fetotoxic effects were seen at doses non-toxic to the
mothers. Reduced pup body weight gain during lactation was observed at high doses in a
two generation reproduction study in rats. There were no effects on fertility in this study.
A variety of mutagenicity studies conducted in bacterial and mammalian cells "in vitro"
and "in vivo" have shown fenoxaprop-P-ethyl to be non-mutagenic (AgrEvo USA Co.,
1996).
Table 5. Acute Toxicity Data for Fenoxaprop-P-ethyl (Bayer Cropscience, 2002)
Test Results
Oral LDso (rat)
Dermal LDso (rat)
Inhalation LCso (rat)
Eye Irritation (rabbit)
Sensitisation (guinea pig)
Skin Irritation (rabbit)
> 5000 mglkg
> 4000 mglkg
> 10.74 mg/L for 4 hr
Slightly irritation
None sensitizing
Slightly irritation
Halqfenozide. There is no available cancer, endocrine disruption, reproductive, or
developmental toxicity information. The toxicity category established by EPA is 111,
which means the acute toxicity rating is "slightly toxic". Halofenozide has a low

mammalian toxicity. The summary of acute toxicity data is presented in Table 6. Based
on physical property data, halofenozide is considered to have a high potential to pollute
water (Orme et al., 2002). Based on results from standard laboratory studies,
halofenozide was shown to be toxic to fish, very toxic to aquatic invertebrates, and
harmless to algae and adult honeybees (MSDS, 2003). Halofenozide is slightly toxic to
birds, the acute oral half-life for quail is greater than 2250 mglkg, the acute dietary half-
life is 4522 mglkg for quail, and greater than 5000 ppm for mallard ducks (British Crop
Protection Council, 2000). Study from a turfPQ model, which is a pesticide runoff model
developed exclusively for turf, simulating the runoff of halofenozide from turf found that
the concentration of halofenozide runoff from turf was well below LCso levels (Haith et
al., 2003).
Table 6. Acute Toxicity Data for Halofenozide (British Crop Protection Council,
2000)
Test Results
Oral LDso (rat)
(mice)
Inhalation LC jo (rat)
Eye Irritation
Skin Sensitize (guinea pig)
Skin Irritation (rabbit)
NOEL 90 d (dog)
(rat)
2850 mglkg
22 14 nlglkg
> 2.7 mgll
Moderately irritation
Positive
Negative
3.8 mglkg daily
5.7 mglkg daily

Orizalin. Orizalin demonstrates low acute toxicity to mammals. The toxicity class
established by EPA and WHO is 111. The suinmary of acute toxicity data is presented in
Table 7. Large oral doses cause nausea and vomiting in dogs and cats (WSSA, 1994).
Long-term exposure to oryzalin has found to cause blood cl~anges and tumors in animals
(WSSA, 1994). When oryzalin was fed to rats at a dose of 135 mglkg for 2 years, there
was an increase in the incidence of thyroid, mammary and skin tumors. Repeated
ingestion of large doses led to adverse changes in blood cell formation in clogs (OHS Inc.,
1992). Rats fed a dietary level of 45 mglkg for two years eshibiled blood changes,
increased liver and kidney weights, inhibition of growth, and decreased survival (OHS
Inc., 1992). Mice given dietary doses of 1,350 ppm for one year exhibited decreased
uterine and ovarian weight (OHS Inc., 1992) (USEPA, 1990). Rats fed 45 mglkg or 135
mglkg, the highest dose tested, for one year showed minimal signs of toxicity (IJSEPA,
1987). There were no adverse effects 011 reproduction in a 3- generation study where rats
were fed the highest dose testing (OHS Inc., 1992) (USEPA, 1990). There were no birth
defects in the offspring of pregnant rats fed dietary concentration as high as 112
mglkglday for 3 generations, nor in the offspring of pregnant rabbits given doses of 125
mglkglday (WSSA, 1994) (USEPA, 1990). The EPA reports that oryzalin was not
mutagenic in several tests, including tests 011 live rats and mice and on bacterial cell
cultures (USEPA, 1990). Oryzalin did not produce tumors in more than one test species,
did not produce tumors in more than one experiment, and did not produce an unusual
degree of tumors, so the EPA has classified oryzalin as a possible human carcinogen
(USEPA, 1990). Oryzalin is not hazardous to birds. Its oral IJDTo in bobwhite quail and
mallard ducks is > 500 mglkg (BCPC, 2000), and > 1,000 inglkg in hens (Meister, 1992).

The 5-day dietary LDjo for oryzalin in quail and ducks is 5,000 inglkg (WSSA, 1994).
Oryzalin is moderately toxic to fish. Direct contamination of a body of water with
oryzalin from a wettable power formulations may kill fish, the 96-hour LCjo for oryzalin
in bluegill sunfish is 2.88 mgll, 3.26 mgll in rainbow trout (Meister, 1992; WSSA, 1994),
and > 1.4 mgll in goldfish finglings (BCPC, 2000).
Table 7. Acute Toxicity Data for Oryzalin (Modified from British Crop Protection
Council, 2000 and WSSA, 1994)
- -
Test Results
Oral LDjo (rat and gerbil)
(cat and dog)
Dermal LDj0 (rabbit)
Inhalation LC j o (rat)
Eye Irritation (rabbit)
Skin Irritation (rabbit)
NOEL 2 y (rat)
(mice)
> 10,000 mglkg
> 1000 &kg
> 2000 n~glkg
> 3.1 mgll for 4 hr
None
Mild irritation
300 mglkg diet
1350 mglkg diet

Analysis Methods
There are several approaches to pesticide analysis. These metl~odological
approaches vary on their degree of complexity; in the time, effort, and analytical
instrumentation required to complete them; and in the degree of confidence that can be
placed in the final results. Typically. one would use the least demanding procedure that
will provide a level of confidence in the final results sufficient to answer the questions
being posed (Nielsen. 1998).
High performance liquid chromatography (HPLC) and gas chromatography (GC)
are good options for the determination of pesticides. Each analytical method has
advantages and disadvantages.
GC is the technique of choice because of its ability to resolve a single member of
a chemical class and individual analytes in suitable prepared extracts containing potential
interferences. However, GC is not capable of determining thermally labile and
nonvolatile pesticides. Compared with the GC, HPLC is very effective in separating non-
volatile and thermally labile compounds. Recently developed pesticides together with
their degradation products are representative candidates for HPLC separations because of
their thermolability andlor low volatility (Pico, 2000). However, HPLC has some
limitation with its selectivity and sensitivity because of the variety and complexity of
matrix and small amount of pesticides present.
The sample preparation process has a direct impact on accuracy, precision, and
quantitation limits and is often the rate determining step for many analytical methods.
Analytical chemists continue to search for sample preparation procedures that are faster,

easier, safer, and less expensive to perform, yet provide accurate and precise data with
reasonable quantitation limits.
Liquid-liquid extraction (LLE) and solid-phase extraction (SPE) are the methods
most commonly used to purify analytes from interfering substances in different sample
matrices. Such purification is based on the differences of polarity between components.
LLE method has been widely used in the past for extraction of pesticides from different
matrices. This procedure has several disadvantages, including: the use of large quantities
of organic solvent which may be flammable or toxic, requiring hazardous waste disposal;
processes are generally time consuming, laborious and difficult to automate; en~ulsion
may form between the two liquid phases; glassware and distillation apparatus are
required; and LLE methods are not easily conducted in the field. SPE is a liquid-solid
separation. It was developed commercially by the Waters Co. in 1978 and is sold as
cartridges called as Sep-Pak. Since then, others have entered the field. It offered an
alternative to LLE (Font et al., 1993; Simpson, 1992). SPE cartridges and disks are now
available from many suppliers and represent a variety of matrix chemistries. These
matrices can be polar, non-polar, or ionic with numerous examples including octadecyl
(C ,,), octyl (C ,), ethyl (C , ), cyclohexyl, diol, silica, cyanlpropyl, aminopropyl, phehyl,
and Florisil (Font, 1993). Of the sorbent materials available for SPE of pesticides from
water, C ,, has become by far the most popular (Nollet, 2000). However, there is an
increasing awareness, supported by experimental data, that C ,, cartridges are inadequate
to solve the problems of isolating polar contaminants from large water volumes. This
failure has led to alternative sorbent material, such as styrene divinylbenzene copolymer
(PRP-1) and highly crosslinked styrene-divinylbenzene copolymers (PS-DVB) (Nollet,

2000). These SPE is exhibited better performance for retaining medium - and high - polar
pesticides. The polymer SPE columns have advantages over the silica - based C ,, SPE
columns. These include excellent pH stability (pH 1 - 13), higher percentage recoveries,
and improved reproducibility. Also, many analytes are less likely to irreversibly bind to
the polystyrene divinylbenzene polymer resin than to the C ,, coated silica matrix.
(Posyniak et al., 1999). SPE and LLE both involve a partitioning of the analyte between
two phases. SPE methods have several advantages over conventional LLE when trace
components are of interest. It is faster, requires less organic solvent per extraction,
eliminates solvent immiscibility, is easily automated for multiple sample extractions, and
can be conducted in the field. EPA methods are currently being tested, and some have
been approved using SPE methodology to replace LLE methods (Federal Register, 1995;
USGPO, 1995).
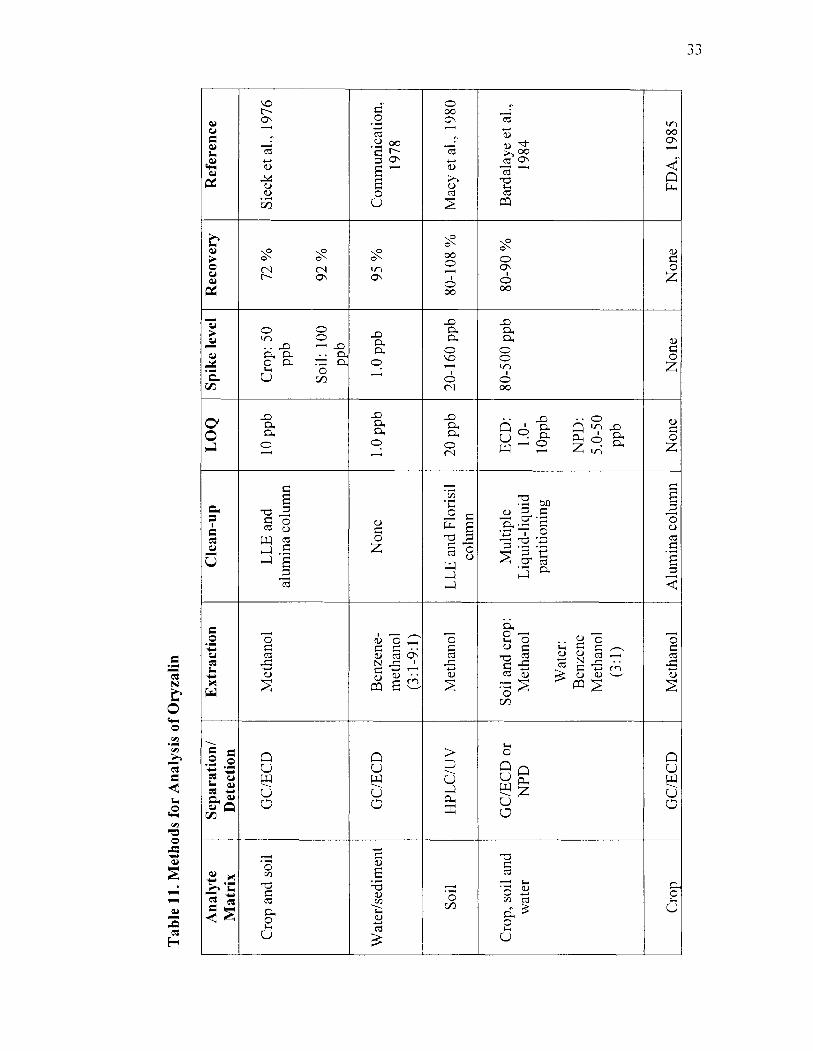
The following sections represent a review of the published methods for analysis
of dithiopyr, fenoxaprop-P-ethyl, halofenozide, and Oryzalin. The summaries are listed in
Table 8, 9, 10, and 1 1, respectively.
Dithiopyr. The determination of dithiopyr is accomplished by GC equipped with
different detectors. The concentration of dithiopyr in soil and plant can be determined by
GC equipped with an electron capture detector (ECD) (Hong et al., 1994; Saikia et al.,
1999; and Monsanto Co., 1991 and 1997). The dithopyr is extracted from soil by liquid-
liquid extraction, followed by inethylation with diazomethai~e and purified by liquid-
liquid partitioning or Florisil column. The methods are very time- and labor-consuming.
The concentration of dithiopyr in water can be determined by GUMS (Tanabe et al.,
1996 and Kiguchi et al., 2000). The dithiopyr is extracted form water with SPE, then

determined by GCIMS. The introduction of MS detection has enabled the
chromatographer to simultaneously determine and confirm dithiopyr in water. While
there is no published information about determination of dithiopyr by HPLC.
Halofenozide. There is very little information available on methods for the
analysis of halofenozide. The determination of halofenozide in soil can be acconlplished
by GC with a nitrogen-phosphorous detector (NPD) (American Cyanamid Co., 1996).
Halofenozide is extracted from soil with methanol-HC1. and purified by liquid-liquid
partitioning. Following a Aluminum oxide column clean up. Extracted analytes need
further derivitization prior to GC/NPD analysis. Determination of halofenozide in
turfgrass and soil can be acconlplished by HPLC with a ultraviolet detector (UV).
Halofenozide has been extracted with ethyl acetate liquid-liquid extraction following by
reversed-phase HPLCIUV (American Cyanamid Co., 1996).
Fcnoxaprop-P-ethyl. There is little literature available on methods for the analysis
of fenoxaprop-P-ethyl. Fenoxaprop-P-ethyl can be determinated by GC (Food & EPA,
1985). The disadvantage of the GC method determination for this compound is that the
extracted analytes need derivatization prior to GC analysis. The derivatization process is
rather time consumiiig and requires a 130 " C oil bath. The effective compounds are
easily volatilize and can be lose. Li et al. (2003) developed a I-IPLC with DAD procedure
for the determination of fenoxaprop-P-ethyl in rape seed and soil. Fenoxaprop-P-ethyl is
extracted in rape seed and soil by soxhlet with ether, and cleaned up with a C18 column.

Oryzalin. The concentration of oryzalin in technical and formulated products can
be deterininated by spectrophoinetry (Decker et al.. 1976) or by reversed-phase HPLC
with ultraviolet detection (HPLCIUV) (Kennedy. 1977). Oryzalin can not bc
quantitatively estimated directly by GC. Under a wide range of operating conditions. the
gas chron~atographic peaks are broad and exhibit considerabIe tailing, making
quantitative assessment uncertain. This is most probably associated with the greater
polarity and hydrogen bonding potential of the sulfonamide group (Sieck et al., 1976).
The reported methods for the determination of oryzalin in crops and soil are based on an
overnight chemical derivatization followed by gas chromatography (FDA, 1985; Sieck,
1976). Oryzalin is extracted from the crops by blending with methanol and derivatized to
a N,N-dimethyl derivative with methyl iodide after filtration. The N,N-dimethyl
derivative is purified by alumina colulnn chromatography and finally determined by
electron capture gas chromato~raphy. The disadvantages of derivatization methods aye
that extra time is required for the derivative formation, the derivatization step is usually
not quantitative, and the probability of error increases because of the extra sample
manipulation. An HPLC method has been reported for determination of oryzalin in soil
(Macy et al., 1980). The method requires no derivatization. Oryzalin is extracted with
methanol following by purification and separated by liquid-liquid partitioning and Florisil
column chromatography to clean up the samples before reverse-phase IHPLC analysis
with UV detection. HPLC equipped with a mass spectrometry (MS) detector has also
been reported for determination of oryzalin in fruits and vegetables (Liu et al., 1991).
This method involves the extraction of pesticides with acetone followed by purification
by liquid-liquid partitioning prior to HPLCIMS analysis. The EPA (1993) method for the

determination of oryzalin in industrial and inunicipal wastewaters involves the extraction
of oryzalin with methylene chloride by liquid-liquid extraction and Florisil column clean-
up the sample before HPLC analysis with UV detection.

Table 8. Methods for Analysis of Dithiopyr
Analyte
leachate
Separation1 Detection GCIECD
Extraction Spike Level Recovery Reference
LLE (hexane+ethyl
acetate)
6.25 ppb 6.25-125 ppb Hong et al., 1994
None
SPE(C 18) Water:
SPE(SDB-L)
1.0 ppb Water:
1 .O- 100 ppb 0.5 ppb None River water r GCIMS Tanabe et
al.. 1996 0.01 ppb
Suspended substances: ultrasonic
Suspended substances:
0.05 ppb
None
Diethyl ether
partitioning and
Florisil col cunn
1 Soil GCIECD Acetonitrile- 10 ppb, 100 ppb
Monsanto Co., 1997 0.2 M HCI
(95 : 5) and petroleum
ether
Soil : 1000-5000 ppb Wheat and straw:
200-2000ppb 0.2-2.0 ppb
I Soil, wheat GCIECD Acetone-0.2 M HC1 (95:5)
SPE (SDB- XD Empore
disk + Carbon Empore disk
Partitioning (hexane)
Saikia et al., 1999 1 grain and
Kignchi et al., 2000
GCIMS None None


MATERIALS AND METHODS
Sample Collection
Surface water was collected from the Stillwater River in Orono, ME. The water
was collected in a 4 L jar and stored under refrigeration at 5 OC . Samples were processed
within 2 days of collection.
Ground water was collected from 439 Wing Road in Hermon, ME. The water was
collected in 4 L jars and stored under refrigeration at 5 'C. Samples were processed
within 4 days of collection.
Pesticides
Dithiopyr (99.9% pure), halofenozide (96.9% pure), fenoxaprop-P-ethyl (99.5%
pure), and oryzalin (99.9% pure) standards were obtained from the EPA repository, Fort
Mead, MD.
Solvents
All solvents were HPLC grade and obtained from the Fisher Scientific Company,
Fair lawn, NY.
HPLC System and Operating Conditions
The HPLC system consisted of a Hewlett Packed model 1050 isocratic pump and
auto sampler equipped with upgraded 1040 diode array detector (DAD). The analytical

column was a Columbus C-18, 5 um, 50 x 4.6 mm. Data was collected using a HP
Chemstation (version AO3.O 1) software.
Operating conditions: The injection volun~e of standards and sample were 50 ul.
The flow rate was set at 1.0 mllmin. The analytical column was operated at ambient
temperature. The UV spectra was collected from 200 to 350 nin. The quantification was
carried out with 250 nm for dithiopyr, 240 nin for fenoxaprop-P-ethyl, 237 nm for
halofemozide, and 288 nm for oryzalin. The selected mobile phase was a mixture of
acetonitrile-water-phosphoric acid (325 + 175 + 0.1, VIVIV).
Quantification of pesticides was accomplished by comparing the peak area
response for samples with peak area of the standards. Confirmation for water samples
showing positive response for pesticides was accomplished by comparing the sample UV
spectra with standard UV spectra.
Preparation of Standard Solution
Standard stock solutions were prepared by accurately weighing a known amount
of pesticide (approximately 25 mg) analytical standard into a 25 ml volumetric tlask. The
stock solutions were diluted to the volume with acetonitrile. A mixed working standard
solution was prepared by diluting an appropriate aliquot of stock solution in 25 n11 of the
acetonitrile.
Sample Preparation
Ground and surface water samples were prepared by passing a 500 ml of water
through the styrene-divinylbenzene copolymer (SDB-L) cartridge at a flow-rate of 10

inllmin. The cartridge was conditioned by passing consecutively 5 ml methanol and 5 in1
volume of deionized water. After the entire sample volume was passed through, the SPE
cartridges was washed with 10 ml of deionized water and dried under vacuum for 30 min.
The pesticides collected on the cartridges were eluted with 20 in1 ethyl acetate at a flow-
rate of 10 mllmin. The elutes were dried using a rotary evaporation at 40 ' C and residues
were re-dissolved in 1 ml acetonitrile prior to injection into the HPLC system.
Standard Curves
Calibration standards of the four pesticides were prepared by dilution with the
acetonitrile, in concentrations of 0.02, 1.0, 5.0, 10.0, 25.0, 50.0 ppm for halofenozide,
0.05, 1 .O, 5.0, 10.0, 25.0, 50.0 ppm for fenoxaprop-P-ethyl and oryzalin, 0.1, 1 .O, 5.0,
10.0,25.0, 50.0 ppm for dithiopyr.
Recovery Studies
Recovery studies were carried out by spiking 500 ml ground and surface water
samples with a mixed standard of known cunounts. The spiked samples were then
extracted and cleaned up with SPE, and analyzed by HPLC as previously described. Six
different spiking levels of the pesticides were prepared for HPLC analysis. For ground
water, the spiking levels were 0.50, 2.0, 12, 25, 50, and 100 ppb for dithiopyr, 0.15, 2.0,
12, 25, 50, and 100 ppb for fenoxaprop-P-ethyl, 0.10, 2.0, 12, 25, 50, and 100 ppb for
halofenozide and oryzalin. For surface water, the spiking levels were 0.50, 2.0, 12, 25,
50, and 100 ppb for dithiopyr, 0.30, 2.0, 12, 25, 50, and 100 ppb for fenoxaprop-P-ethyl,

0.20, 2.0, 12, 25, 50, and 100 ppb for halofenozide and oryzalin. These samples were
then extracted and analyzed by HPLC.
Reproducibility Studies
Samples from six different spiking levels were extracted and analyzed once a day
for six different days. The lowest spike levels in ground water were 0.50 ppb for
dithiopyr, 0.15 ppb for fenoxaprop-P-ethyl, 0.10 ppb for halofenozide and oryzalin,
respectively. The other spike levels in ground water were 2.0, 12, 25, 50, and 100 ppb for
these pesticides. The lowest spike levels for surface water were 0.50 ppb for dithiopyr.
0.30 ppb for fenoxaprop-P-ethyl, 0.10 ppb for halofenozide and oryzalin, respectively.
The other spike levels in surface water were same as those used for ground water.

RESULTS AND DISCUSSION
HPLC-DAD is an excellent analytical system for the analysis of compounds that
contain aromatic rings, carbonyl groups, nitro groups, or sulphur because of its sensitivity
and specificity. The chemical structures of dithiopyr, fenoxaprop-P-ethyl, halofenozide,
and oryzalin (Figure 1) contain at least one of groups, witch listed above, makes make
them very ideal candidates for HPLC-DAD determination. The HPLC-DAD method has
the advantage that the identification of the pesticides based on the retention time is
confirmed by the UV spectrum.
The surface water contains relatively high concentrations of anions as well as
humic and fulvic acids that produce a high UV response because of their high percentage
of aromaticity (Peuravuori et al., 1997). This response is often produced in the early part
of the chromatogram and interferes with early-eluting peaks from the most polar analytes.
These humic substances can be removed by pre-column, chemical treatment of sample, or
adjustment of solvent concentrations in the mobile phase (Peuravuori et al., 1997). In this
study, these humic substances were eluted within the first 5 minutes, and no interfering
peaks were observed for the quantification of the four pesticides.
Optimum Conditions
Wavelength. The choice of wavelength was based on where the compounds of
interest have the best response and interfering compounds have the lowest response. One
of the advantages of the DAD detector is that it can simultaneously collect different

chromatograms at different wavelengths during a single run. The choice of lnaximunl
absorbing wavelengths of dithiopyr, fenoxaprop-P-ethyl, halofenozide, and oryzalin in
this study were 250 nm, 240 nm, 237 nm, and 288 nm, respectively.
Mobile Plzusc. Different mobile phases were tested in order to optimize the
separation of pesticides from the matrix substances of the water samples. There was an
overlapping pair of compounds (dithiopyr and fenoxaprop-P-ethyl) and peak shapes were
not good when using acetonitrile and water mixture alone. These problems were be
overcome by adding of 0.1 ml phosphoric acid in 500 ml acetonitrile and water mixture.
It is often essential to acidify the mobile phase to control selectivity and to achieve
reproducible separations with acceptable peak shape (Tindall et al., 2003). Therefore, the
optimal mobile phase in this study was a mixture of acetonitrile-water-phosphoric acid
(325 + 175 + 0.1, VIVIV).
HPLC Columns. Five different HPLC columns were tested in order to find the
best separation and peak shapes of the detection responses of the four pesticides. Table
12 shows the results of the separation and peak shapes with different HPLC columns.
With Nucleosil and Prontosil columns, there were two overlapping pair of pesticides
(halofenozide and oryzalin, fenoxaprop-P-ethyl and dithiopyr). With Luna and Columbus
columns, base-line separation for all four pesticides was achieved. However, the peaks
were non-gaussian when using the Luna column. Therefore. the best column was the
Columbus C-18,5 urn, 50 x 4.6 mm.
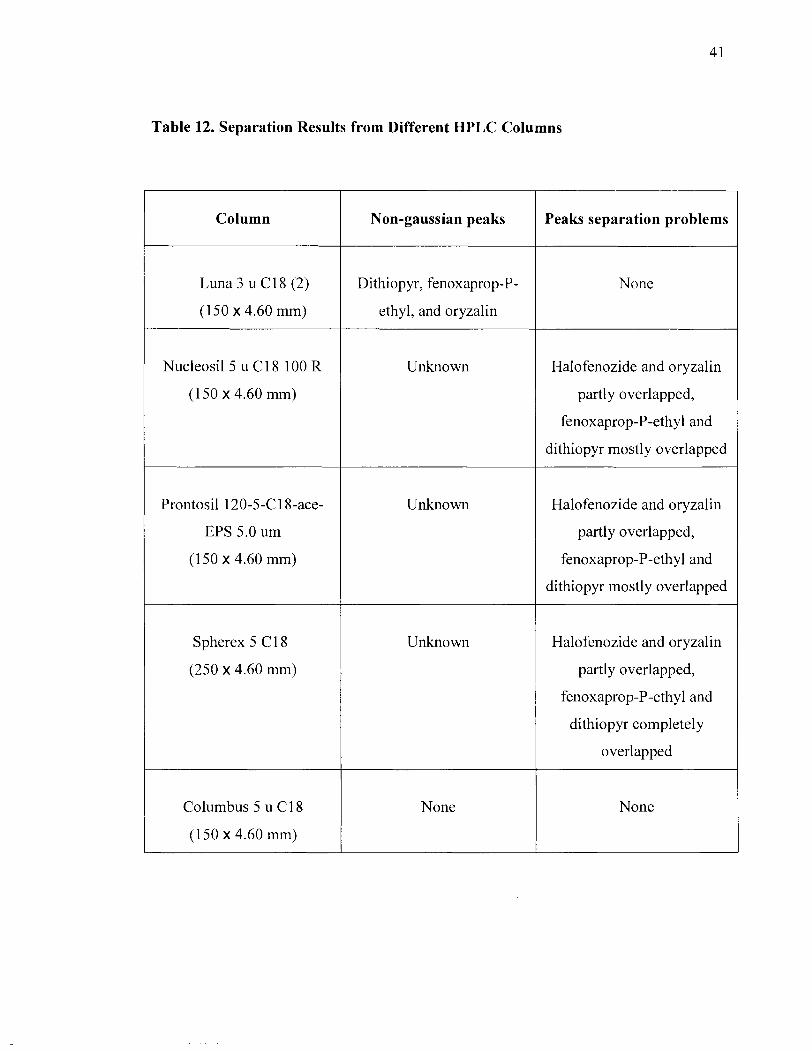
Table 12. Separation Results from Different HPLC Columns
Column c Luna 3 u C18 (2)
(1 50 x 4.60 mm)
Nucleosil5 u C 1 8 100 R
(1 50 x 4.60 mm)
1 Prontosil 120-5-C 18-ace-
I EPS 5.0 um
(150 x 4.60 mm)
Spherex 5 C 1 8
(250 x 4.60 mm)
Columbus 5 u C 1 8
(1 50 x 4.60 mm)
Non-gaussian peaks
Dithiopyr, fenoxaprop-P-
ethyl, and oryzalin
Unknown
Unknown
Unknown
None
Peaks separation problems
None
Halofenozide and oryzalin
partly overlapped,
fenoxaprop-P-ethyl and
dithiopyr mostly overlapped
Halofenozide and oryzalin
partly overlapped,
fenoxaprop-P-ethyl and
dithiopyr mostly overlapped
Halofenozide and oryzalin
partly overlapped,
fenoxaprop-P-ethyl and
dithiopyr completely
overlapped
None

Elution Solvents and Solvent Volume.for SPE. Acetonitrile, ethyl acetate, MTBE,
MTBE:THF (90+10, VN), and acetone were evaluated as elution solvents for the SPE
cartridges. The recoveries of dithiopyr, fenoxaprop-P-ethyl, halofenozide, and oryzalin
for each of these elution solvents were tested. The results demonstrated ethyl acetate and
acetonitrile had the best recoveries. Ethyl acetate was chosen as the elution solvent
because ethyl acetate dissolves less interfering compounds and its lower boiling point
madeit faster to condense. To determine the elution solvent volume, 500 ml water
samples were spiked with 2.0 ug (2.0 ppm x 1 ml) standard mixture before passed
through the cartridge. The cartridge was eluted with 5 ml of ethyl acetate for four times.
The recoveries of the different steps of eluent were evaluated. The results of HPLC-DAD
analysis showed that most of the analytes were eluted with the first 5 ml of the ethyl
acetate solvent (Table 13). The second 5 ml elutes further improved the recoveries of four
pesticides, but the third 5 ml elutes only improve halofenozide and fenoxaprop-P-thy1
recoveries. The final 5 in1 eluted all four pesticides at a satisfactory level. Therefore, the
selected eluting solvent was 20 ml of ethyl acetate.

Table 13. Recoveries from Different Eluate Solvent Volumes
Dithiopyr 1 First 5 ml I 91.7 I 97.0
Pesticides
1 Second 5 ml I 5.3 I 1 Third 5 ml I 0 I 1 Forth 5 ml I 0 I
Total recovery (%) Elute step
Fenoxaprop-P-ethyl I First 5 in1 I 82.3 I 95.6
Recovery (%)
/ Second 5 ml I 9.1 I
1 Second 5 ml 1 2.6 1 Halofenozide
1 Third 5 ml I 0.1 I 1 Forth 5 ml I 0 I
Third 5 ml
Forth 5 ml
First 5 ml
Oryzalin I First 5 ml I 97.9 I 100.4
3.1
1.1
97.2
1 Second 5 ml I 2.5 I
99.9
1 Third 5 ml I 0 I / Forth 5 ml I 0 I

Retention Time
The retention times under the above mentioned HPLC conditions for
halofenozide, oryzalin, fenoxaprop-P-ethyl and dithiopyr were 5.1, 7.0, 16.1, and 1 8.6
min, respectively.
Limit of Detection (LOD) and Limit of Quantitation (LOQ)
The LOD and LOQ of dithiopyr, fenoxaprop-P-ethyl, hanofenozide, and oryzalin
in ground and surface water are summarized in Table 14. The comparison of the response
with the baseline noise, the LOD for the dithiopyr, fenoxaprop-P-ethyl, halofenozide, and
oryzalin were 0.10, 0.050, 0.020 and 0.050 ppm, respectively. The effective LOQ after
the pre-concentration step for dithiopyr, fenoxaprop-P-ethyl, halofenozide, and oryzalin
was 0.50, 0.15, 0.10, and 0.1 0 ppb in the ground water, 0.50, 0.30, 0.20, and 0.20 ppb in
the surface water. Although there is no regulations for the limits of maximum residues
(MRL) of these pesticides, the LOQ in here are well below the maximum contanlinant
level in drinking water set by the Environmental Protection Agency for herbicides
(USEPA Office of Drinking Water, 1990)
Linearity Studies
Results of the linearity study using peak area are shown in Figures 3, 4, 5 and 6.
The photo diode array detector demonstrated linearity over the range from 0.020 to 50
ppm for halofenozide, from 0.10 to 50 ppin for dithiopyr, from 0.050 to 50 ppm for
fenoxaprop-P-ethyl, and oryzalin, with a correlation coefficient (r ' ) of 1.000. Thus, the
linearity values and correlation coefficient are excellent for this analytical method.

Table 14. The LOD and LOQ of Dithiopyr, Fenoxaprop-1'-ethyl, Halofenozide, and
Oryzalin in Ground and Surface Water
Dithiopyr
Halofenozide
Oryzalin

0 10 20 30 40 50
Concentration (ppm)
Figure 3. Standard Curve of Dithiopyr

20 40
Concentration (ppm)
Figure 4. Standard Curve of Fenoxaprop-P-ethyl

20 40 Concentration (ppm)
Figure 5. Standard Curve of Halofenozide
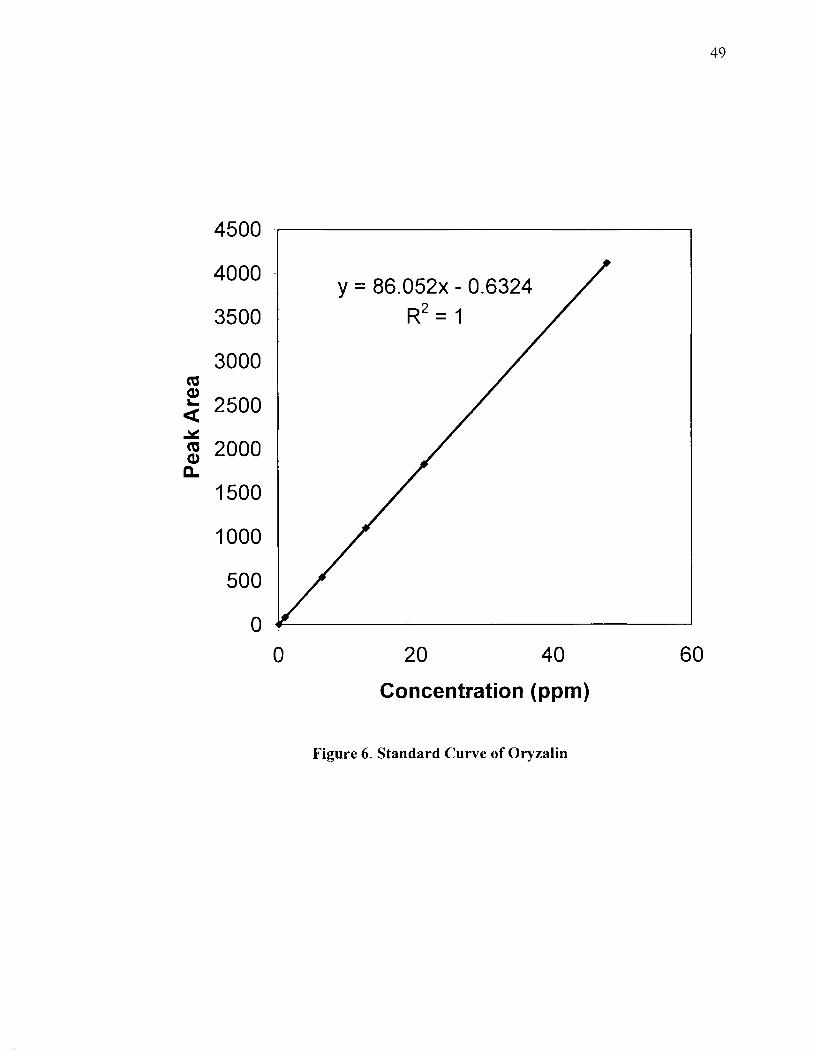
0 20 40 60
Concentration (ppm)
Figure 6. Standard Curve of Oryzalin

Recovery Studies
The accuracy of the analytical method is estimated based on measuring of
recoveries of fortified ground and surface water samples. The results of the recovery
studies are shown in Tables 15 and 16, respectively. The chromatogram of the separation
of standard mixture under the above mentioned HPLC conditions is shown in Figure 7.
The chromatograms of ground and surface water samples are shown in Figures 8 and 10,
respectively. The chromatograms of spiked ground and surface water samples are shown
in Figures 9 and 1 1, respectively.
For ground water, the mean percent recoveries ranged from 89 to 122 with
percent coefficients of variation (%CV) varying from 1.0 to 20 for dithiopyr, from 82 to
96 with %CV from 1.7 to 18 for fenoxaprop-P-ethyl, from 98 to 1 15 with %CV 2.2 to 15
for halofenozide, and from 92 to 110 with %CV 2.3 to 19 for oryzalin. For surface water,
the mean percent recoveries ranged from 82 to 93 with %CV varying from 1.2 to 19 for
dithiopyr, from 78 to 98 with %CV 2.1 to 8.5 for fenoxaprop-P-ethyl, from 91 to 102
with %CV 1.0 to 9.3 for halofenozide, and from 91 to 100 with %CV 2.0 to 14 for
oryzalin. Recoveries for both water samples were considered satisfactory. Thus, Styrene-
divinylbenzene copolymer as a solid-phase extractor with ethyl acetate as elution solvent
was a very effective procedure for extraction, pre-concentration, and clean-up water
samples.

Table 15. Percent Recovery of Fortified Samples from Ground Water
Pesticides
Dithiopyr
1 Recovery ( O h )
Halofenozide
Oryzalin
" Mean percent recovery based on four determinations

Table 16. Percent Recovery of Fortified Samples from Surface Water
Spiked Level (ppb) I Mean Percent I C V ( W )
Dithiopyr 0.50
Halofenozide I 0.20 I 9 1 I 9.3
Oryzalin
Recovery" (%)
82
" Mean percent recovery based on four determinations
19


Reproducibility Studies
The precision of the analytical method was estimated based on spiking water
samples with six different levels, and determinations were conducted over a period of six
different days indicated the procedure was reproducible. The reproducibility results of
ground and surface water are given in Tables 17 and 18, respectively.
For ground water, the ranges of %CV values were from 2.6 to 25 for dithiopyr, 2.5 to 24
for fenoxaprop-P-ethyl, 2.1 to 19 for halofenozide, and 2.4 to 14 for oryzalin. For surface
water, the ranges of %CV values were from 2.2 to 17 for dithiopyr, 2.3 to 12 for
fenoxaprop-P-ethyl, 0.80 to 9.9 for halofenozide, and 3.9 to 12 for oryzalin. Overall the
reproducibility for six different days was good with an average %CV of 8.4 for dithiopyr,
7.5 for fenoxaprop-P-ethyl, 7.5 for halofenozide, and 5.6 for oryzalin in ground water;
with an average %CV of 5.5 for dithiopyr, 5.6 for fenoxaprop-P-ethyl, 3.3 for
halofenozide, and 6.6 for oryzalin in surface water. With the exception of lowest levels of
spiked samples, the most of %CVs were below 5. The generally high %CVs of the lowest
level of spiked sample may result from the integration error associated with the small
peaks. Also, high concentrated matrix may have interfered with the analytes.

Table 17. Reproducibility of Fortified Samples from Ground Water
Pesticides
I I I
Oryzalin
-
-
-
-
-
Spiked Level (ppb)
Dithiopyr
Halofenozide
" Mean recovered value based on six determinations performed on six different days
Mean Recovered
Value" (ppb)
0.50
100
0.10
CV ( O h )
0.54
93
0.1 1
25
2.5
19

Table 18. Reproducibility of Fortified Samples from Surface Water
Spiked Level (ppb) Mean Recovered CV (%)
Value" (ppb)
Pesticides
Dithiopyr
Halofenozide
Oryzalin
" Mean recovered value based on six determinations performed on six different days

CONCLUSION
A simple, relatively fast, and efficient HPLC method has been developed for the
simultaneous determination of dithiopyr, fanoxaprop-P-ethyl, halofenozide, and oryzalin
in ground and surface water. The results of the linearity, sensitivity, recovery and
reproducibility studies indicate the method presented here is a successful, acceptable
technique.
Compared with the existing methods, the method discussed in this thesis has
several advantages over previous methods. First no derivatization step is required as
compared to current official methods. Second the styrene divinylbenzene polymer SPE
has shown to be an efficient tool for extracting pesticides from water samples and
reducing the matrix effects as observed in control samples. SPE procedure makes
unnecessary the cleanup steps in presently used procedures. Although some of the
methods using GC may provide better sensitivity for some of the target pesticides than
this method described, they are very time-and labor-consuming due to the complex
extraction procedure and derivatization process. Finally, in terms of sensitivity, this
method permits determination of pesticide residues in surface and ground waters at levels
of around 0.1 ppb. Method detection limits were adequate for environmental n~onitoring
and can satisfy the requirements set by EPA and international regulations for the limits of
maximum residues (MRL). which are usually at the ppm level for the majority of
pesticides and ppb for some others.

REFERENCES
AgrEvo USA Company. 1996. Section 1. Chemical product and company identification. Option (R) I1 Herbicide.
American Cyanamid Company. 1996. GCINP method for the determination of RH-0345 residues in soil. Environmental Protection Agency's (EPA) Environmental Chemistry Laboratory (ECL) recommended method of analysis - M 2509.
Bayer Cropscience. Fenoxaprop-P-ethyl. Material Safety Data Sheet. 2002. l~ttp:llw\w.bayercropsciei~ce.com.aujprod~ctslresourceslnsdslWilcat msds 08 02.pdf
British Crop Protection Council. 2000. The Pesticide Manual: A World Con~pendiun~, twelfth edition. Croydon, England.
Cohen, S., Svrjcek, A., Durborow, T., and Barnes, N.L. 1999. Water quality impacts by Golf courses. J. Environ. Qual. 28:798-809.
Decker, O.D., and Johnson, W.S., 1976. Anal. Methods Pest. Plant Growth Regul., 8, 433.
Deubert, K.H. 1990. Environmental fate of common turf pesticides factors leading to leaching. USGA Green Section Record. JulyIAugust Vol28(4): 5-8.
Dow AgroSciences Inc. 2001. Dimension Herbicide. Material Safety Data Sheet.
Easton, Z.M. 2003. Frozen soil worsens pesticide runoff problems. TurfGrass Trends. February 1.
Environmental Protection Agency (EPA). Engineering and Analysis Division. 1993. Methods for the determination of nonconventional pesticides in municipal and industrial wastewater. Volume I. Washington, D.C.: U.S. Environmental Protection Agency, Office of Water.
FDA, Pesticide Analytical Manual. 1985. Food and Drug Administration: Washington, DC, Vol. 11.
Federal Register, 1995. Vol. 60, No. 148, August 2, 40 CFR Part 136, Guidelines establishing test procedures for the analysis of pollutants; chlorinated pesticides and PCBs by disk extraction; final rule, p. 39585-39590.

Feng, P.C.C., and Solsten, RT. 1991. I11 vitro transformation of dithiopyr by rat liver enzymes: Conversion of methylthioesters to acids by oxygenases. Xenobiotica, 21(10):1265-1271.
Font, G., Manes, J., Molto, J.C., and Pico, Y. 1993. Solid-phase extraction in multi- residue pesticide analysis of water. J. Chromatography. 642: 135 - 16 1.
Food and Environment Protection Act, 1985, Part LU. Control of pesticides regulations 1986.
Gardner, D.S., and Branham, B.E. 2001. Mobility and dissipation of ethofumesate and helofenozide in turfgrass and bare soil. J. Agric. Food Chem., 49(6):2894-2 898.
Gilliom, K.J., Barbash, J.E., Kolpin, D.W., and Larson, S.J. 1999. Testing water quality for pesticide pollution. Environmental Sci. and Technol. 4: 164a-169a.
Gramlich, J.V., Golab, T., Van der Schans, C. D., and Steenwyk, P. L., 1969. Abstr. Weed Sci. Soc. Am.. No. 22.
Guo, L. and Spurlock, F. 2000. Recominelldation for priority surface water monitoring studies on selected pesticides. Department of Pesticide Regulation, Environmental Hazards Assessment Program, Sacramento, CA.
Haith, D.A. and Rossi, F.S. 2003. Risk assessment of pesticide runoff from turf. J. Environmental Quality. 32 (2): 447-455.
Henriet, J. 1985. Analysis of technical and formulated pesticides. CIPAC Handbook. Page 5 1.
Hong, S. and Smith, A.E. 1996. Abiotic and biotic degradation of dithiopyr in golf course greens. J. Agric. Food Chem. 44:3393-3398.
Huff, H.P. 1989. Proc. Br. Crop Prot. Conf. - Weeds. 2 , 7 17.
Hutzinger, 0. 198 1. Environmental and toxicological chemistry at the University of Amsterdam: Five years of philosophy and practice of environmental health chemistry. Chapter 2 in Environmental health chemistry. J. D. McKinney, ed. Ann Arbor Science Publishers Inc., Ann Arbor, MI.
Kenna, M.P., 1995. What happens to pesticides applied to golf courses? The United States Golf Association's Green Section Record. JanuaryIFebruary Vol 33(1): 1-9.
Kennedy, J.H., 1977. High pressure liquid chromatographic analysis of oryzalin and other seleted herbicides. J. Chromatogr. Sci., 15, 79-81.

Kidd, H. and James, D. R., Eds. The Agrochemicals Handboolc. 3'* ed. Royal Society of Chemistry Inforn~ation Services, Cambridge, UK. 1991.
Kiguchi, O., and Saitoh, K. 2000. Simultaneous determination of polar and nonpolar pesticides in water samples by solid-phase multilayered disk extraction using polystyrene gel and activated carbon disk along with GC-MS. Bunselci Kagaku. Aug., 49(8), 575-582.
Li, K., Li, Z., Wu, M., et al., 2003. Determination of fenoxaprop-P-ethyl residue in rape and soil. http://202.127.45.170:8080/code/jino,er.l1tm
Linde, C.D. 1994. Physico-chemical properties and environmental fate of pesticides. 11tt~://www.cdpr.ca.,~ov/docs/en~pm/pubs/ehapreps/eh9403 .pdf
Liu, C.H., Mattern, G.C., Yu, X.B., Rosen, R.T., and Rosen. J.D. 1991. Multiresidue determination of nonvolatile and thermally labile pesticides in fruits and vegetables by thermospray liquid chromatography/n~ass spectrometry. J. Agric. Food Chem., 39(4):718-723.
Macy, T.D. and Loh, A. 1980. Determination of oryzalin and prosulfalin residues in soil by high pressure liquid chromatography. Anal. Chem. 52: 138 1 - 1383.
Material Safety Data Sheet (MSDS). 2003. Hi-Yield Kill-A-Grub Plus Lawn Fertilizer. http://www.v-p-g.coin/MSDS/HiYield/Dry Insecticides/HY%2OKill-A- Grub%20Plus%20Lawn%2OFertilizer~2OMSDS.pdf
Mattern, G.C., Liu, C.H., Louis, J.B., and Rosen, J.D. 1991. G U M S and LCIMS determination of 20 pesticides for which dietary oncogenic risk has been estimated. J. Agric. Food Chem., 39(4):700-704.
Meister, R.T. 1992. Farm chemicals handbook '92. Meister Publishing Company, Willougl~by, OH.
Monsanto Company. 1997. Analytical method for the determination of MON 1500 inetabolites in soil. Environmental Protection Agency's (EPA) Environmental Chemistry Laboratory (ECL) recommended method.
New York State Department of Environmental Conservation. 1993. Dithiopyr (Dimension) NY SDEC Conditional Registration. 12/93.
Nielsen, S.S. 1998. Food Analysis. Second edition. Aspen Publishers, Inc. Gaithersburg, MD.
Nollet, L.M.L. 2000. Food analysis by HPLC. Second edition. Marcel Dekker, Inc. New York, NY.

Occupational Health Services, Inc. 1992 (Nov. 17). MSDS for oryzalin. OHS Inc., Secaucus, NJ. littp://pmep.cce.cornell.ed~/~~rofiles/e>lii~-ext.litn~l
Orme, S., and Keglev, S. 2002. PAN Pesticide Database, Pesticide Action Network, North America (San Francisco, CA). http://\%~%~v.pesticideii~fo.org
OSU Extension Pesticide Education Programs. 2003. Mobility and dissipation of pesticides applied to turfgrass - gardner. littp://pested.osu.cdu/presentatioi~O3folder/l'esticide%2OFate%~2Oii1%20'1'~1rf~!rass. p&
Peuravuori, J., and Pihlaja, K. 1997. Molecular size distribution and spectroscopic properties of aquatic humic substances. Anal. Chim. Acta. 337 : 133-149.
Pico, Y., Font, G., Molto, J.C., and Manes, J. 2000. Pesticide residue determination in fruit and vegetables by liquid chromatography-mass spectrometry. J. Chromatography A. 882: 153-1 73.
Posyniak, A., Zmudzki, J., Ellis, R.L., Semeniuk, S., and Niedzielska, J. 1999. Validation study for the determination of tetracycline residues in animal tissues. J. AOAC Int. 82:862-865.
Rao, P., Mansell, R., Baldwin, L., and Laurent, M. 1983. Pesticides and their behavior in soil and water. Soil Science Fate Sheet, Institute of Food and Agricultural Sciences-University of Florida.
Saikia, N., and Kulshrestha, G. 1999. New gas chromatographic method for residue determination of dithiopyr in soil, wheat grain and straw. J. Chromatography A, 864:35 1-353.
Schleicher, L.C., Shea, P.J., Stougaard, R.N., and Tupy, D. 1995. Efficacy and dissipation of dithiopyr and pendirnethalin in perennial ryegrass (lolium perenne). Turf. Weed Sci. 43: 140- 148.
Sieck, R.F., Jolmson, W.S., Cockerill, A.F., Mallen, D.N.B., Osborne, D.J., and Barton, S.J. 1976. Gas chromatographic analysis of oryzalin residues in agricultural crops and soil. J. Agric. Food Chem., 24(3):617.
Simpson, N. 1992. Solid-phase extraction - disposable chromatography. Am. Laboratory. 24: 37-43.
Spectrum Laboratories: Chemical Fact Sheet - Cas # 19044883 l~tt~:ll~~w.speclab.coi~~/coi~~~ound/c 1904488.htm

Tanabe, A., Mitobe, H., Kawata, K., and Saltai, M. 1996. Monitoring of herbicides in river water by gas chromatography-mass spectrometry and solid-phase extraction. J. Chromatography A, 754: 159-1 68.
The Royal Society of Chemistry. 1983. The Agro-Chemicals Handbook. University of Nottingham, England.
Tindall, G.W., and Dolan, J.W. 2003. Mobile phase buffers, part I1 - Buffer selection and capacity. LC Troubleshooting. LC-GC Europe. January. http:ll~y\w.1~~ceurope.com/lcgceuropc/datdarticlestandard/lc~ceuro~e/5 12002/4 1697/article.pdf
U. S. Department of Agriculture, Soil Conservation Service. 1990 (Nov.). SCS/ARS/CES Pesticide properties database: version 2.0 (summary). USDA - Soil Conservation Service, Syracuse, NY.
U.S. Environmental Protection Agency. June 30, 1987. Pesticide Fact Sheet Number 2 1 1 : Oryzalin. US EPA, Office of Pesticides and Toxic Substences, Washington, DC, 10-1 07.
U.S. Environinental Protection Agency (USEPA). June 20, 1990. Pesticide tolerance for oryzalin. Federal Register 55 (1 19): 25 140-1.
U.S. EPA Office of Drinking Water. 1990. Drinking water regulations and health advisories. HO4- 1 ID-PEST1. Washington, DC.
U.S. Government Printing Office (USGPO). 1995. Proposed Update 111, Test methods for evaluating solid waste, Physical/Chemical Methods (SW-846) Third Edition.
United States Geological Survey. 1999. The quality of our nation's water; nutrients and pesticides. Circ. 1225. U.S. Geol. Survey. Reston, VA.
Van Es, H.M. 1990. Pesticide management for water quality. United States Department of Agriculture-extension Service web site. littp://~~mep.cce.coeneile~~.ed~i/f.dcts/pestn~.~t-~vater-c~ua~-~~~. ht~nl.
Walston, A.T., Williamson, R.C., and Stier, J.C. 2001. Pesticide runoff: how does turf contribute? TurfGrass Trends. July 1.
Ward, D.P. 1993. Summary of toxicology studies with dithiopyr. Toxicology Department, The Agricultural Group, A Unit of Monsanto Company.
Washington State Department of Transportation. 1993. Roadside vegetation management: environmental impact statement. WSDOT.

Weed Science Society of America. 1994. Herbicide Handbook, 7"' ed. Champaign, IL. 10-59.

BIOGRAPHY OF THE AUTHOR
Danyun Zhu was born in Hefei, People's Republic of China on October 25, 1962.
She graduated from Hefei No. 1 High School, Hefei, China in July 1980. She attended
the Hefei United University and graduated in 1984 with a Bachelor's degree in Chemical
Engineering. Following graduation, Danyun Zhu was employed as a chemist by Hefei
Sanitary and Anti-epidemic Station, People's Republic of China, from July 1984 to
December 1997.
In September 2002, Danyun Zhu enrolled in the graduate program in the
department of Food Science and Huinan Nutrition at The University of Maine. She is a
candidate for the Master of Science degree in Food Science and Human Nutrition from
The University of Maine in December, 2003.