determination of rejected landing roll runway point-of-no
TRANSCRIPT

International Journal of Aviation, International Journal of Aviation,
Aeronautics, and Aerospace Aeronautics, and Aerospace
Volume 3 Issue 1 Article 5
2016
Determination of rejected landing roll runway point-of-no-return Determination of rejected landing roll runway point-of-no-return
and go-around in transport category airplanes and go-around in transport category airplanes
Nihad E. Daidzic, Ph.D., Sc.D. AAR Aerospace Consulting, LLC, [email protected]
Follow this and additional works at: https://commons.erau.edu/ijaaa
Part of the Aerospace Engineering Commons, Applied Mechanics Commons, Aviation Commons, and
the Engineering Physics Commons
Scholarly Commons Citation Scholarly Commons Citation Daidzic,, N. E. (2016). Determination of rejected landing roll runway point-of-no-return and go-around in transport category airplanes. International Journal of Aviation, Aeronautics, and Aerospace, 3(1). https://doi.org/10.15394/ijaaa.2016.1110
This Article is brought to you for free and open access by the Journals at Scholarly Commons. It has been accepted for inclusion in International Journal of Aviation, Aeronautics, and Aerospace by an authorized administrator of Scholarly Commons. For more information, please contact [email protected].

The evidence shows and it has been recognized in aviation/airline
industry, academia, and government regulatory and safety agencies that takeoffs
and landings are singularly the most hazardous flight phases in commercial air
transportation (FAA, 1994). More than 50% of all commercial aviation accidents
occur during takeoffs and landings which combined represent no more than 5% of
the average flight duration. While takeoffs are relatively well defined and the
initial energy conditions are under full control, landings carry many uncertainties
regarding the touchdown location and speed (kinetic energy content). Thus,
landing operational regulations provide larger margins to allow for unavoidable
variations in environmental, pilot, and aircraft conditions. Although it is desired
that airplane touch down at a predetermined spot on the runway and at proper
speeds, the operational experience has demonstrated wide margins in landing
operations (FAA, 2007). Multiple reasons for that exist which will not be
specifically discussed in this article.
One scenario rarely discussed and for which only few operators have even
rudimentary standard operating procedures (SOP) is aborted landing roll and go-
around after touchdown. While touch-and-go landings are quite common in light
training airplanes (certified under FAR 23), transport category (T-category)
airplanes (certified under FAR 25) normally never utilize such maneuvers. While
fatal accidents have occurred after unsuccessful go-around following landing
touchdown there is no known statistics, at least to this author, on how frequent
such events are in commercial and business aviation industry.
Attempts of go-arounds after touchdown can be very hazardous and fatal.
American Airlines Boeing 727-95 N1963 landed long at STT (St Thomas, US
Virgin Islands) on April 17, 1976 (Job, 1994) which resulted in 37 fatalities out of
88 on board during unsuccessful landing-roll abort. After prolonged float in
ground effect, the airplane touched down about 3,000 ft from the threshold of the
very short 4,650-ft runway. Soon after touchdown and realizing it will not be able
to stop on the remaining runway, the captain attempted to go around adding
TOGA (Takeoff Go-Around) thrust. Then realizing that it would be impossible to
lift off using what was left of the runway, the captain changed his mind again and
tried to abort go-around and stop. As expected, the airplane exited the runway at
high speed. Many fatalities occurred in the ensuing crash and fire.
On July 31, 2008, at about 09:45 AM central daylight time, a Hawker
Beechcraft BAE 125-800A with registration N818MV was completely destroyed
killing all 8 occupants when it impacted terrain at high speed during aborted
landing roll and subsequent unsuccessful go-around from runway 30 at the
Owatonna Degner Regional Airport (KOWA), Owatonna, Minnesota. The non-
1
Daidzic,: Rejected landing roll PNR
Published by Scholarly Commons, 2016

scheduled flight was operating under the provisions of Title 14 CFR Part 135. The
instrument flight rules (IFR) flight plan had been filed and activated, but was
cancelled before the landing. Visual meteorological conditions existed at the time
of landing. However, severe thunderstorms passed through the area with heavy
rain less than two hours before ill-fated Hawker crash.
Recent final National Transportation Safety Board (NTSB) ruling (ID:
DCA08MA085) has confirmed that pilots of a Hawker Beechcraft 800A (BAe
125-800A) registration N818MV in Owatonna (KOWA in MN) on July 31, 2008
attempted unsuccessfully a go-around after long touchdown and poor braking
efforts. NTSB final ruling says that pilots did not use brakes for 8 seconds after
touchdown and simply did not attain the flying speed to escape the ground effect
during attempted go-around, stalled, and crashed about 1,500 ft beyond the
runway threshold. A 1,000-ft long impact and crash deceleration distance existed
beyond 1,500 ft touchdown in the corn field. Eyewitnesses said that the airplane
tried to takeoff after it already touched down attempting to land. Additionally,
severe thunderstorms passed through the area shortly before Hawker’s attempted
landing in KOWA. It was postulated by Daidzic (2008) that the absence of
braking effort was most likely due to hydroplaning on a short 5,500 ft municipal
airport runway. The NTSB reported not finding evidence of hydroplaning, but the
question of why no braking effort was initiated for extended period remains
unanswered.
Runway distances illustrated in Figure 1 are normally declared by
respective airport authority following the applicable regulations and can be found
in FAA’s Airport/Facility (A/F) Directory. Takeoff Distance Available (TODA)
includes Takeoff Run Available (TORA) plus clearway in which case clearway
used in calculations cannot exceed 50% of TORA (FAA, 2013, 2014a; Jeppesen,
2007; Padilla, 1995; Swatton, 2008). Accelerate-Go Distance Available (ASDA)
includes TORA and stopway while Landing Distance Available (LDA) may or
may not be equal to TORA (FAA, 2014a). That will depend on the availability of
displaced threshold and if the stopway is included in LDA. Sometimes
Engineered Materials Arresting Systems (EMAS) are placed at the far end of the
runway to slow down and/or stop overrunning airplanes (Daidzic and Shrestha,
2008; FAA, 2012). EMAS, of course, cannot be a part of stopway or LDA (FAA,
2012). DeLoach et al. (2009) performed analysis of landing overrun with
uncertainty analysis for the evaluation of a passive runway arresting system.
Gross or un-factored (ASD, TOR, TOD) and net or factored (ASDR,
TORR, TODR) takeoff distances are illustrated in Figure 2. Airplane weight must
be adjusted for existing environmental and atmospheric conditions so that
2
International Journal of Aviation, Aeronautics, and Aerospace, Vol. 3 [2016], Iss. 1, Art. 5
https://commons.erau.edu/ijaaa/vol3/iss1/5DOI: https://doi.org/10.15394/ijaaa.2016.1110
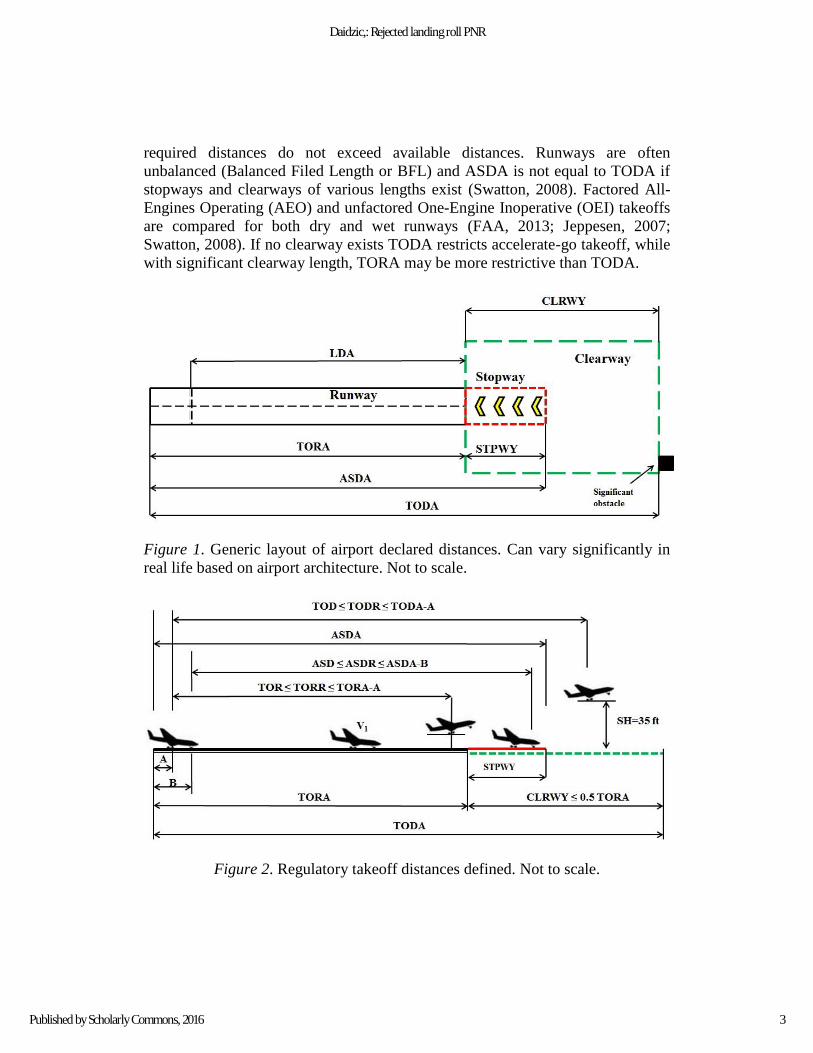
required distances do not exceed available distances. Runways are often
unbalanced (Balanced Filed Length or BFL) and ASDA is not equal to TODA if
stopways and clearways of various lengths exist (Swatton, 2008). Factored All-
Engines Operating (AEO) and unfactored One-Engine Inoperative (OEI) takeoffs
are compared for both dry and wet runways (FAA, 2013; Jeppesen, 2007;
Swatton, 2008). If no clearway exists TODA restricts accelerate-go takeoff, while
with significant clearway length, TORA may be more restrictive than TODA.
Figure 1. Generic layout of airport declared distances. Can vary significantly in
real life based on airport architecture. Not to scale.
Figure 2. Regulatory takeoff distances defined. Not to scale.
3
Daidzic,: Rejected landing roll PNR
Published by Scholarly Commons, 2016

Landing runway requirements for commercial public air transportation are
spelled out in operational regulations (e.g., 121, 135, etc.). Transport-category
airworthiness certification rules such as Title 14 CFR 25.125 (FAA 2013) only
specify gross performance and conditions under which gross landing performance
was obtained. DLD is gross (un-factored), sometimes also called demonstrated,
landing distance on dry runway which was derived from the measured
certification flight tests and averaged for the fleet of particular airplane make and
models. DLDR is factored or net dry landing distance required accounting for
operational performance cushions (Daidzic, 2009c; FAA, 2014b). WLDR is the
required net landing distance for generic wet runways and does not implicitly or
explicitly include contaminated runways. Damp runways are often treated as wet
runways, but they may become very slippery under specific conditions. Required
distances can never exceed available distance. Landing requirements are
illustrated in Figure 3 (FAA, 2014b).
Figure 3. Regulatory landing distances defined. Not to scale.
A schematic of the landing decelerate-accelerate-takeoff maneuver with
the dynamic PNR location is illustrated in Figure 4. Unlike Rejected Takeoffs
(RTO) and V1 (decision/action) speeds there is no assurance that the landing
airplane will indeed stop by the end of LDA. Thus a concept of rejected landing
ground roll is introduced (RLR) with the PNR-speed taking the primary role in
decision making process. The rejected-landings (decelerate-accelerate) are
fundamentally different from, and inverse of, the RTO’s (accelerate-decelerate).
While takeoff maneuver, if done properly, will guarantee that the airplane will or
fly when OEI or stop by the end of ASDA, no such guarantee exists for the
landing PNR maneuver and the airplane can get in the situation where it cannot
go-around nor can it stop on the remaining runway.
The main idea behind runway landing PNR-concept is thus to define a
speed from which it is still possible, after initial deceleration, to continue OEI go-
around takeoff. Operational regulations may require reaching certain minimum
4
International Journal of Aviation, Aeronautics, and Aerospace, Vol. 3 [2016], Iss. 1, Art. 5
https://commons.erau.edu/ijaaa/vol3/iss1/5DOI: https://doi.org/10.15394/ijaaa.2016.1110

screen height (SH) at departure end of the runway (DER). However, it is almost
impossible to schedule or plan PNR speeds in line operations as the landing
maneuver is very dynamic with many variables and uncertainties affecting the
exact location of touchdown and kinetic energy carried by the aircraft.
Figure 4. Landing decelerate-accelerate landing-roll go-around maneuver with
PNR. Nose-gear touchdown (NGTD) typically occurs 3 seconds after main-gear
touchdown (TD). Not so scale.
The NTSB used designation commit-to-land point for the landing PNR we
use here. However, PNR can be seen more as a last-chance commit-to-go-around
point. Not changing anything and just continuing deceleration efforts and
disregarding runway PNR is a default solution albeit one that does not ensure full
stop on the runway. It takes a dynamic effort to change both, the human and the
airplane inertia, and switch from stop-stop to go-go mental attitude (Daidzic,
2008, 2009a). As it happened in the unfortunate case with B727 in 1976 it is a
very difficult decision to make and pilots are normally not trained for this
scenario. There is absolutely no space for confusion or indecision in the cockpit
when aborted (rejected) landing decelerate-accelerate-takeoff decision must be
made.
The main purpose of this research article is to provide deeper physical
insights and deliver a comprehensive novel theory based on the aircraft’s total
energy. This approach would still result in a reasonably accurate models for
rejected landing PNR determination as a function of many aforementioned
variables and parameters.
Literature Review
While touch-and-go landing practice is quite frequent in flight training,
little was found on equivalent maneuver in commercial air transportation. It seems
that few operators even consider such an option exists and no SOPs or training is
5
Daidzic,: Rejected landing roll PNR
Published by Scholarly Commons, 2016

available to guide pilots. No statistical data was found on frequency of landing
go-arounds. Only those unfortunate and unsuccessful few are well known.
Takeoff dynamics of rigid airplanes is described in various levels of detail
in several standard and classical aerospace/aeronautics engineering references
(Anderson, 1999; Asselin, 1997; Davies, 2003; Eshelby, 2000; Filippone, 2006;
Hale, 1984; Mair and Birdsall, 1992; McCormick, 1995; Padilla, 1996; Roskam
and Lan, 1997; Saarlas, 2007; Shevell, 1989; Torenbeek and Wittenberg, 2009;
Vinh, 1993). Blake and Elliot (1991) discuss the final few minutes during airplane
approach and landing. Authors reported one landing overrun per 3.6 million
flights. In 1990, that would have been one landing overrun every 3 months in
USA. However, today, 60 to 80 overruns occur in commercial air transportation
worldwide utilizing T-category airplanes every year (Daidzic, 2009a). Progress
achieved in improving approach-and landing safety was discussed by McKinney
(1999). The author highlighted some recommendations for the reduction and
elimination of approach-and-landing accidents. But despite all the efforts to
reduce accidents during landing phase, the same operational errors and difficulties
stubbornly persist. van Es et al. (2001) discuss the safety aspects of aircraft
performance on wet and contaminated runways by studying sample of 91
overruns and veer-offs. Based on a sample of European airports there appeared to
be four-fold increase in accident risk for aircraft operating on wet and
contaminated runways. The authors suggest that go-arounds should be considered
whenever fast and long landings on wet and contaminated runways are expected.
van Es (2005) performed analysis of landing overrun accidents over the period of
35 years.
In-depth development of landing dynamics models and computational
simulations incorporating differing pilot techniques and variable runway and
environmental conditions was conducted by Daidzic and Shrestha (2008).
Programs developed from that research can be used for accident investigations
and solution of inverse problems. Daidzic (2009a, 2009c) provides further
analysis of braking action on contaminated surfaces accounting for many physical
factors including anti-skid operation and physics of tire-surface friction forces.
The calculations of veer-offs on contaminated/slippery runways in the presence of
crosswind were presented in Daidzic (2009b). van Es (2010) performed a study of
runway excursions from a European perspective. Both, takeoff and landing
overruns and veer-offs were analyzed for the runway excursions occurring in the
period of 1980-2008. The author also discusses some technical solutions by
Airbus, Boeing, and Honeywell to reduce landing overruns. Daidzic (2011a,
2011b) further discusses contaminated runways and operations.
6
International Journal of Aviation, Aeronautics, and Aerospace, Vol. 3 [2016], Iss. 1, Art. 5
https://commons.erau.edu/ijaaa/vol3/iss1/5DOI: https://doi.org/10.15394/ijaaa.2016.1110

Takeoff problems on contaminated runways in the presence of crosswind
that may result in veer-offs and the role of thrust-reversers in such situations were
discussed by Daidzic (2013a). Takeoff considerations and certification of T-
category airplanes was discussed in Daidzic (2013b). Special takeoff techniques
such as overspeed takeoffs were considered in Daidzic (2014).
Over the last 60 years many attempts were made to assist pilots with
takeoff performance monitors (TOPM). Takeoffs are critical for flight safety and
the airplane is heaviest with smallest performance margins (FAA 1994). All the
performance measures are based on speeds without actually measuring distances.
This can only work if the scheduled accelerations (AEO or OEI) are actually met
in practice. Monitoring acceleration, speed, and distance during takeoffs and then
predicting future performance is very important, but that has defied engineers and
designers so far. More details on takeoff performance monitors can be found in
Wagenmakers (1991). Zammit-Mangion and Eshelby (2005) discussed design and
integration of a take-off monitor display in cockpit environment. Recently,
Zammit-Mangion and Eshelby (2006) have studied flight tests of large T-category
jet and twin turboprop airplanes. Predictive algorithms were developed which
according to authors were well within the SAE’s aerospace standard AS-8044
thus warranting adoption in TOPM.
While rejected landing and go-around has been mentioned cursory in some
older materials, no scientific consideration and discussion was ever conducted. To
the best of our knowledge the first analytical consideration and computation of the
PNR speeds, distances and time was given by Daidzic (2008). That analysis
specifically focused on the Hawker 800A unsuccessful go-around and crash in
Owatonna, MN in 2008. More in-depth discussion on landing PNR was then
treated in Daidzic (2009a) and Daidzic (2011b). Most recent contribution toward
this topic was given by Daidzic (2016) in which also the need for SOPs and
design of runway energy monitoring and management systems was emphasized.
Essentially, in all previous analytical studies simpler algebraic rejected-landing
PNR models were presented with computational methods on how to determine
landing PNR speed and time for given touchdown conditions.
Mathematical Models and Methodology
The entire dynamics of landing go-around PNR could be simulated with
differential equations of motion in an appropriate reference systems. Many
additional algebraic relationships would be required to describe constitutive and
other relationships. Such large system of strongly nonlinear ODE (Ordinary
Differential Equations) could be numerically integrated in time to provide the
7
Daidzic,: Rejected landing roll PNR
Published by Scholarly Commons, 2016

entire history of motion. The model could be made as complicated as one desires
with probably in excess of 50 simultaneous differential and algebraic equations.
Due to excessive complexity, we chose to present simpler model based on the
total energy conservation principle, while taking into account average forces and
accelerations over finite time intervals. Such exercise will facilitate better
understanding of the critical influences with still reasonably accurate model.
Landing dynamics
Ideally, transport category airplane crosses runway threshold at a given
landing screen height (regulatory for certification is 50 ft) and given reference
airspeed VREF, initiates short flare (roundout) maneuver at appropriate height
(typically 10-30 ft), touches down and promptly lowers the nose gear
(recommended within 3 seconds), and initiates deceleration ground roll utilizing
friction braking and thrust reversers. For all practical purposes aerodynamic drag
during landing roll can be neglected other than for extremely slippery
contaminated runways where deceleration levels are so low that even
aerodynamic drag plays relatively important role (Daidzic and Shrestha, 2008).
The landing dynamic equations are set in a non-orbiting flat-Earth, approximately
inertial, frame of reference as the distances are short and non-inertial effects
negligible (Daidzic and Shrestha, 2008). The fundamental equations of motion in
horizontal and vertical planes which describe decelerating ground roll at constant
airplane mass and arbitrary wind, yield:
.constLWWWwwhhvvss:ICs
wdt
dh
W
Ncos
W
v,Lg
dt
dw
vvvdt
ds
sinW
Ns
W
D
W
Tg
dt
dv
TDTD
RWY
wGS
RWYB
aeror
000 00
0
0
0
(1)
The airborne part (descent-decelerate), flare, main-gear and nose-gear
touchdown dynamics is not included in above differential model. Almost all the
terms on the RHS of the horizontal dynamics in Equation (1) are functions of the
true and ground speed, air density, airplane’s geometry, and aerodynamic
characteristics. The first term or the (T/W)-ratio can be or slightly positive
8
International Journal of Aviation, Aeronautics, and Aerospace, Vol. 3 [2016], Iss. 1, Art. 5
https://commons.erau.edu/ijaaa/vol3/iss1/5DOI: https://doi.org/10.15394/ijaaa.2016.1110

(residual thrust and no thrust reversers) or significantly negative by using thrust
reversers and contributing to deceleration. The second term is the aerodynamic
drag which often is very small compared to other contributions and when then
really only at higher speeds. The third term is the generally spatially-dependent
friction braking term and overwhelmingly the most important decelerating force
on dry runway. Only when the runways are contaminated and significantly
slippery does this term become small. This coefficient could also take into full
consideration pilot’s braking efforts and the anti-skid system braking efficiency
(Daidzic, 2009a, 2011a, 2011b, 2013a). The last term can be both negative and
positive along the runway designating local runway slope, which for most
commercial airports/runways can be neglected (less than 2%). Additionally, for
most nearly-level runways, we can reasonably substitute RWYRWYsin and
1RWYcos , with angles expressed in radians.
The air distance covered in flare for which descent angle is assumed
positive (although it is negative as negative net thrust exists) can be approximated
by:
22
22
221TDSH
FLR,eff
LND,eff
LND
LND
TDSH
LNDLND
LND
AIR vvg
E
E
SH
a
vv
W
T
E
SHL
(2)
where:
11
11
FLRLND
FLR,eff
LNDLND
LND,effW
T
EE
W
T
EE
The aerodynamic efficiency is defined as DLE . During flare, the
throttles are typically pulled back to flight idle which in most modern turbofans is
about 7-10% of the maximum thrust for given air pressure and temperature.
Landing flare is accelerated maneuver (Daidzic and Shrestha, 2008) during which
kinetic energy is dispensed to slow down potential energy (height) loss. To
simplify the problem, in the future landing considerations the landing air distance
will be a simple input together with the touchdown speed. Details of flare
dynamics and speed decrement during flare (from threshold crossing to
touchdown), which often is small unless prolonged floating in ground effect
occurs, thus need not be considered at all. For details on this see Daidzic and
Shrestha (2008) and Daidzic (2009a, 2009c).
9
Daidzic,: Rejected landing roll PNR
Published by Scholarly Commons, 2016

Takeoff dynamics
Expanded basic differential equations of motion of rolling rigid aircraft of
variable mass on a perfectly rigid surface are (Daidzic, 2014):
TOWWWwwhhvvss:ICs
wdt
dh
W
Ncos
W
v,Lg
dt
dw
vvvdt
ds
dt
dW
Wg
vsin
W
Ns
W
v,Dv,Tg
dt
dv
v,SFCgv,Tdt
dW
RWY
wGS
RWYr
00000 00
0
0
0
0
(3)
However, other phases of takeoff must be accounted for as well, which
includes rotation, lift-off and initial climb to SH all of which tremendously
complicates model analysis. The coupled system of nonlinear ODE presented
with Equation (3) is valid up to the point of rotation. The reactive thrust
component (rocket-thrust) is negligible for conventional jet-engine airplanes. The
complexity of the system which describes sufficiently-well the takeoff ground run
of rigid airplanes is obvious. Dynamics of many subsystems, such as, shock
absorbers is not included. The rolling friction coefficient for airplane tires on dry
concrete or asphalt runways is typically between 0.02 and 0.05 (Asselin, 1997;
Saarlas, 2007). This rolling friction coefficient is also a function of groundspeed.
Runway slope changes continuously along runway, but for most applications this
term is small. Instead of using differential models, such as those presented by
Equations (1) and (3), we will be using integral algebraic models based on the
energy conservation principles which tremendously simplifies the analysis.
The crucial difference between takeoffs, which are well defined, and
landings, which are not so well defined in terms of actual location and energy
state, exists. Normal takeoff starts from the runway start (Brake Release Point or
BRP of TORA) and is reduced by mandatory runway alignment corrections
and/or running-takeoff correction (Swatton, 2008). On the other side, the location
of aircraft during landing is variable with standard deviations exceeding 500 ft.
Many studies have shown significant variations in airplane touchdown points
10
International Journal of Aviation, Aeronautics, and Aerospace, Vol. 3 [2016], Iss. 1, Art. 5
https://commons.erau.edu/ijaaa/vol3/iss1/5DOI: https://doi.org/10.15394/ijaaa.2016.1110

during line operations (FAA, 2007; Mair and Birdsall, 1992). It is not uncommon
for a wide-body jet to touch down past the 3,000-ft runway marker followed by
frantic braking efforts attempting to rapidly dissipate airplane’s kinetic energy.
However, as airplane already carries some kinetic energy that may be beneficial if
subsequent takeoff/go-around after touchdown is attempted.
Using the energy and power conservation law in integral form (Anderson,
1999; Asselin, 1997; Eshelby, 2000; Hale, 1984; Mair and Birdsall, 1992;
McCormick, 1995; Saarlas, 2007; Vinh, 1993), yields:
Energy Kinetic
Energy Potential
ndissipatioEnergy
generationEnergy
dt
dv
g
v
dt
dh
W
vD
W
vT
(4)
This equation can be rearranged to yield:
vdv
gdh
vDvT
Wdx
1 (5)
This is particularly useful expression when considering horizontal distance
covered during airborne (climb-acceleration) part of takeoff (similar to landing air
run) for which integral results in:
SH
g
vv
DT
Wvdv
gdh
DT
WdxL LOFSH
av
SH
LOF
SH
av
SH
LOF
AB2
122
0
(6)
The average net thrust-to-weight ratio is essentially an inverse of the
average angle of climb since we know that approximately (Anderson, 1999;
Asselin, 1997; Eshelby, 2000; Hale, 1984; Padillla, 1996; McCormick, 1995;
Saarlas, 2007):
WLD
LE
EW
T
W
DTsin
1 (7)
The SH at DER can be set to an arbitrary value (typically between 0 and
35 ft) as dictated by operational regulations and safety standards. The SH-speed is
typically taken to be V2 (takeoff decision speed) and we could use the same
reasoning by setting VSH=V2 for given weight. Interestingly, for many T-category
11
Daidzic,: Rejected landing roll PNR
Published by Scholarly Commons, 2016

airplanes V2 will be very close to VREF. However, we allowed for landing
threshold speeds to be in excess of desired reference speed to account for
operational problems.
Determination of PNR
Using graphic illustration in Figure 4, the entire landing go-around PNR
dynamics can be now formulated with a simple algebraic inequality:
LDALLLLLL ABACELCOASTDECELNGTDAIR (8)
The extremal condition is achieved when the inequality is substituted with
the equality maximally utilizing LDA. Two main assumptions are made here.
First, the speed loss in flare is neglected. This is reasonable approximation and
practice shows that on-average airplanes lose about 3-5 knots in flare other than in
case of long and extended float (FAA, 2007). Second, the airplane does not lose
any speed during nose-gear de-rotation which is reasonably decent first
approximation resulting in VTD=VNGTD. A conventional transport category
airplane for which aerodynamic braking at high-AOA is negligible touching down
at about 130 knots may only lose 2-3 knots during de-rotation mostly due to
rolling friction and aerodynamic drag at high AOA.
Once throttles are applied for go-around, deceleration level will start
decreasing, but deceleration cannot instantly mutate into acceleration as that
would require forces of infinite magnitude. This “coasting” phase depends on
many factors, including, engine acceleration characteristics (Daidzic, 2012a), the
position and use of thrust-reversers, pilot reaction time, changing airplane drag
and high-lift configuration, etc.
The entire rejected-landing PNR event can be seen in terms of the total
energy state as illustrated in Figure 5. Landing aircraft has both potential and
kinetic energy and must regain both for safe takeoff. The potential energy is
dissipated upon touchdown and the remaining kinetic energy is supposed to be
fully dissipated before the end of the LDA. If the kinetic energy cannot be
dissipated by the end of LDA, an option may exist for which the airplane may use
remaining runway to gain enough kinetic and potential energy and execute safe
go-around. Various average acceleration and deceleration levels are shown in
Figure 5. In the case of deceleration, two extremes exists – dry and contaminated
(slippery) runways. In the case of acceleration, two extreme acceleration levels
exist – AEO and OEI. Twin-jets are especially vulnerable to a loss of thrust on
one engine. That is why their engines are disproportionally larger than in tri-jets
12
International Journal of Aviation, Aeronautics, and Aerospace, Vol. 3 [2016], Iss. 1, Art. 5
https://commons.erau.edu/ijaaa/vol3/iss1/5DOI: https://doi.org/10.15394/ijaaa.2016.1110

or four-jet airplanes as field requirements must be met under reasonable
conditions when OEI. If the aircraft touched down long and/or fast that will shift
all deceleration lines to the right leaving less space for rejected landing. For a
successful go-around, an airline simply must achieve total energy level by the end
of LDA. Under the assumption that there is no significant speed-loss during nose-
gear de-rotation, we may write conservatively:
NGTDTDNGTD tvL (9)
Figure 5. Average acceleration (AEO and OEI) and deceleration (dry, wet,
contaminated) levels. Deviations in touchdown location and speed are illustrated
as well. Not so scale.
Slowing down in landing roll can be described using average deceleration
values from VTD to VPNR, after which the decision is made to go-around and
TOGA thrust/power is applied. In order to avoid using negative signs which only
causes confusion, we just use absolute value of deceleration magnitude:
PNRTDDEC
DEC
PNRTD
PNR
TD DEC
DECEL vvaa
vv
a
dvvL
00
2
22
(10)
13
Daidzic,: Rejected landing roll PNR
Published by Scholarly Commons, 2016

T-category jets typically decelerate at a rate of 1 to 8 knot/s, depending on
the runway condition and combined braking effort. Similarly to FAR 25.109
(FAA, 2013) for the determination of ASDR, coasting at VPNR for a given time
interval (2-4 seconds), during which deceleration changes into acceleration
(inertia configuration change) is calculated from:
0 COASTPNRCOAST tvL (11)
The acceleration phase which will be assumed OEI only (decision to go
coincides with engine failure and OEI continuing takeoff condition):
PNRLOFACC
ACC
PNRLOF
ACEL vvaa
vvL
00
2
22
(12)
The acceleration will depend if AEO or OEI and atmospheric conditions.
Typically, average AEO acceleration is 5-6 knot/s while average OEI acceleration
is 2-3 knot/s. The last remaining part is the airborne (AB) takeoff phase extending
from LOF to SH condition. Various takeoff regulations (FAR 25.105 to 25.113)
for dry and wet runways can be extended to require particular SH at the end of
LDA (FAA, 2013). Thus we can write using Equation (6):
TOTO
TO
LOFSH
TO
ABEW
TSH
g
vvL
1
2
122
(13)
Substituting Equations (9-13) into Equation (8) for an identity extremal
solution and performing required reductions, we arrive at a simple quadratic
equation for estimation of unknown VPNR speeds:
02 CvBvA PNRPNR (14)
Where:
SHg
vv
a
v
a
vtvLLDAC
tBaa
aaA
LOFSH
TOACC
LOF
DEC
TDNGTDTDAIR
COAST
ACCDEC
ACCDEC
2
1
22
002
2222
(15)
14
International Journal of Aviation, Aeronautics, and Aerospace, Vol. 3 [2016], Iss. 1, Art. 5
https://commons.erau.edu/ijaaa/vol3/iss1/5DOI: https://doi.org/10.15394/ijaaa.2016.1110

where:
sec3sec21
NGTDCOAST
effTOTO
TO ttW
T
EW
T
The aerodynamic efficiency for T-category airplanes in takeoff
configuration is typically between 10 and 12. We assumed the value of 10. In the
landing configuration the aerodynamic efficiency is closer to 6 (six) for modern
jetliners with high-lift devices fully deployed. Thrust-to-Weight ( WT ) ratio will
depend on AEO or OEI condition. Thrust of modern turbofans is a function of
TAS and density ratio Daidzic (2012a, 2012b).
The coefficient C is critically important in that it defines the specific total
energy extracted from the available runway for deceleration-acceleration-takeoff
maneuver. If C < 0, a solution is real and VPNR exists. However, if C is
sufficiently large negative real number than VPNR > VTD, which means the
solution is not feasible. If C = 0, one VPNR solution is zero. For all other cases C >
0, the solution does not exist (complex solutions) and VPNR would be effectively
less than zero meaning that we can operationally set it to zero. Such is a scenario
commonly used by light-planes safely conducting touch-and-go landing practice
on very long runways. Excess of runway implies also that an overspeed takeoff for
better climb performance could be implemented (Daidzic, 2014).
Regular VPNR could vary between zero and VTD speed. If the runway is
excessively long it is easy to imagine that an airplane could slow down to a full
stop and then start from standstill. Such solution is often irrelevant as that would
imply that the airplane can indeed stop on the runway. A possible utilization of
such a solution would be if go-around is accomplished for other reasons other
than weak braking deceleration. An example could be the inability to comply with
LAHSO instructions after touchdown. The other extreme implies short runway for
which the airplane must execute go-around instantly after touchdown. If the
remaining runway is shorter than this condition, the airplane in landing roll cannot
stop or go on the remaining runway – a very precarious situation. Such situation
could also arise from a long and/or fast landing even on dry runways.
The airplane carries kinetic energy upon touchdown, which can be used
toward supplementing total energy required for a safe go-around. Further, we
assumed for this simple energy-conservation model that:
112 201151 SSHSLOFSHNGTDTD v.vv.vWvvvv (16)
15
Daidzic,: Rejected landing roll PNR
Published by Scholarly Commons, 2016

The two possible real solutions of Equation (14) may be or double
(identical) real root or two different real roots. Calculating the coefficient C
represents the most daunting part in solving this nonlinear algebraic equation, for
which the solution may be written (Spiegel and Liu, 1999):
roots Real042
2
CABD
A
DBv II/I
PNR (17)
Only larger positive real solution for the VPNR could be accepted for
operational use unless other conditions allow for both real positive solutions. If
one neglects the nose-gear touchdown delay and dynamics, then B=0 and only
one real (positive) solution exists:
A
CvPNR
(18)
In another special case for which C = 0, two real solutions exist:
A
Bvv II
PNR
I
PNR and0 (19)
A kinetic energy versus runway length for a generic T-category airplane
executing go-around after touchdown and initial acceleration is shown in Figure
6. After nose-gear touchdown an airplane has certain kinetic energy which may or
may not be dissipated by the end of a runway. Energy dissipation will depend on
the deceleration rates (deceleration forces and landing mass). If go-around is
necessary then airplane must gain safe total energy level (kinetic and potential) by
the end of the runway. The kinetic energy requirements are typically an order-of-
magnitude (or more) larger than potential energy amounts during takeoffs and
landings.
It follows from Figure 6 that if the initial deceleration is high, an airplane
can slow down to lower PNR speeds while using less runway before initiating go-
around maneuver. If the deceleration is weak, the PNR speed is higher and more
runway is used to slow down to it. Clearly as less runway is available to reach
safe total energy requirements, the airplane must acquire more kinetic energy at
the moment it rejects landing roll and executes go-around. This implies that:
ondeceleratifast ondecelerati slow PNRPNR vv .
16
International Journal of Aviation, Aeronautics, and Aerospace, Vol. 3 [2016], Iss. 1, Art. 5
https://commons.erau.edu/ijaaa/vol3/iss1/5DOI: https://doi.org/10.15394/ijaaa.2016.1110

Figure 6. Average landing PNR acceleration and deceleration levels. It is inverse
of the takeoff phase, i.e., it is decelerate-go maneuver. Not so scale.
In order to demonstrate the fundamental difference between the rejected
landing roll go-around and regular takeoffs, an illustration of takeoff-energy
versus distance is shown in Figure 7. The specific kinetic energy (per mass) was
used on the vertical axis. Again, the average acceleration magnitudes are utilized,
whereas instant accelerations constantly change (jerk or surge). Takeoff is well
defined maneuver where the aircraft is always assured of continuing takeoff when
OEI or stopping by the end of ASDA.
The average acceleration or deceleration, which by definition is constant,
can be used to estimate acceleration distances, according to a simple kinematic
expression:
002
2
aa
vL
ACC
(20)
Results of computations that include typical accelerations and decelerations for
takeoffs and landings are shown in Figure 8. For average acceleration factor of
17
Daidzic,: Rejected landing roll PNR
Published by Scholarly Commons, 2016

0.05g about 9,000 ft of runway will be required to stop from groundspeed of 100
knots. Such scenario may indeed occur on runways covered with thin ice and no
use of thrust-reversers (Daidzic and Shrestha, 2008; Daidzic, 2009a, 2009c,
2011a, 2011b).
Figure 7. Average constant takeoff acceleration and deceleration levels.
Accelerate-stop and accelerate-go BFL takeoff maneuver. Not so scale.
On the other hand, an airplane experiencing deceleration of 0.4g (4 m/s2 or
12.8 ft/s2) such as during powerful braking on dry porous asphalt runway with the
new tires it would only take 1,100 ft to stop from 100 knots. A takeoff utilizing
maximum thrust AEO acceleration would closely resemble average 0.3g (9.66
ft/s2) net acceleration requiring about 2,900 ft to accelerate to 140 knots from
standstill.
Results and Discussion
The mathematical model developed earlier enabled us to compute various
cases of runway go-around PNRs. That would include short and long runways,
18
International Journal of Aviation, Aeronautics, and Aerospace, Vol. 3 [2016], Iss. 1, Art. 5
https://commons.erau.edu/ijaaa/vol3/iss1/5DOI: https://doi.org/10.15394/ijaaa.2016.1110

contaminated and dry runways, variable environmental conditions, variable
landing touchdown speed (kinetic energy) and distance from the threshold, the
effect of airplane weight, etc. To perform exhaustive parametric study of all
different cases would require the article tenfold in size. Thus, we are only
presenting more relevant results.
Figure 8. Acceleration/Deceleration levels and distances versus speed.
As discussed above, one of the main reasons rejected landing roll
maneuver would be attempted, is to prevent overrun on slippery runways and/or
after touching down fast and long. Computations of required landing distances on
dry and wet runways at various touchdown points and speeds are shown in Figure
9. A time interval of three seconds was used for lowering of nose-gear without
appreciable loss of speed. The attribute WET was actually used to designate
combined contaminated runway providing deceleration of about 6.44 ft/s2 (0.2g).
An airplane landing on dry runway (Figure 9) at excessive touchdown
speed of 160 knots and main-gear touchdown point at 3,500 ft would still be able
to stop on a 8,000-ft runway utilizing combined 0.35g deceleration (“good”
braking). However, the same airplane landing on a slippery runway (0.2g
19
Daidzic,: Rejected landing roll PNR
Published by Scholarly Commons, 2016

combined deceleration - with or without thrust-reversers), and even touching
down at proper distance of 1,500 ft, would just barely avoid overrun at touchdown
speed of 160 knots if LDA is 8,000 ft. If the airplane’s main gear touched down at
3,500 ft runway distance, the overrun would occur even at touchdown speeds as
low as 131 knot with 8,000 ft runway and about 146 knot with 9,000 ft LDA.
Reference speed for a given airplane is 125 knots.
The main question arises: if the pilots realized that the landing roll
deceleration is too weak and likely leading to overrun, could they still execute go-
around and safely take off on remaining runway, while meeting all regulatory
requirements? In order to answer this important question, results of simulation for
decelerate-accelerate landing-takeoff maneuver are presented. The results
presented in Figure 10, provide the relationship between VTD and VPNR, as well as
times from nose-gear down moment (NGTD) until reaching PNRs (dashed lines)
at three different runaway touchdown locations.
Figure 9. Stopping distance on 8,000 and 9,000 ft LDA runways at various
touchdown distances and speeds for dry and slippery braking conditions.
In these results it is assumed that one-engine suddenly becomes
inoperative at the moment of reaching PNR and TOGA applications. Thus all go-
around accelerations are with OEI. The coasting dead-time (inertia) is taken as 2
seconds at PNR speed to be compatible with the FAR 25.109. For example, an
20
International Journal of Aviation, Aeronautics, and Aerospace, Vol. 3 [2016], Iss. 1, Art. 5
https://commons.erau.edu/ijaaa/vol3/iss1/5DOI: https://doi.org/10.15394/ijaaa.2016.1110

airplane touching down on an 8,000-ft LDA runway at 2,500 ft and accounting for
given rates of deceleration and OEI acceleration could theoretically slow down to
119 knots before initiation go-around. Pilots will have about 11 seconds from
nose-gear touchdown to evaluate deceleration levels and make critical decision to
abandon landing roll and go-around. From the deceleration rate it can be
concluded that no thrust reversers are used and the runway is very slippery, so
PNR go-around could be an option to avoid almost certain overrun.
Figure 10. PNR speed (solid) and time (dashed) on a slippery 8,000 ft runway at
various touchdown distances and speeds with go-around and given decelerations.
For the same runway, environmental, and airplane conditions as above,
but having 9,000 ft LDA (Figure 11), the pilots could slow down to 113 knots
(from 140 knots touchdown speed at 2,500 ft) and will have about 14 seconds to
make decision to abort landing and execute OEI running takeoff and achieve 35 ft
and V2 at DER SH. As expected longer runway will give pilots more time and the
ability to slow down to lower speeds while making decisions to attempt to stop or
accelerate and take off. Computational results for the case of 9,000 ft runway as
shown graphically in Figure 11 are summarized numerically in Table 1. At longer
touchdown points the pilots can only slow down to progressively faster speeds
and have less time to make decisions to go-around. Longer runways normally
offer pilots more time and alternatives, but what really counts is the runway
remaining after touchdown and the available airplane’s kinetic energy level.
21
Daidzic,: Rejected landing roll PNR
Published by Scholarly Commons, 2016

Figure 11. PNR speed and time on a slippery 9,000 ft runway at various
touchdown distances and speeds for OEI go-around and given decelerations.
Table 1
PNR speeds (knots) and times (seconds) for LDA=9,000 ft and conditions given in
Figure 11
VTD [knot]
LAIR [ft]
1,500 2,500 3,500
VPNR TPNR VPNR TPNR VPNR TPNR
120 89.12 16.20 96.79 12.17 103.89 8.45
125 93.56 16.49 100.88 12.65 107.70 9.07
130 97.94 16.81 104.96 13.14 111.52 9.69
135 102.29 17.16 109.02 13.63 115.35 10.31
140 106.61 17.51 113.08 14.12 119.18 10.92
145 110.90 17.89 117.12 14.62 123.03 11.53
150 115.16 18.28 121.16 15.13 126.87 12.13
155 119.39 18.68 125.19 15.64 130.72 12.74
160 123.61 19.09 129.21 16.15 134.57 13.34
22
International Journal of Aviation, Aeronautics, and Aerospace, Vol. 3 [2016], Iss. 1, Art. 5
https://commons.erau.edu/ijaaa/vol3/iss1/5DOI: https://doi.org/10.15394/ijaaa.2016.1110

The next two results presented will address the effect of acceleration and
deceleration magnitudes. Again, 8,000 and 9,000 ft runways will be used with
unchanged OEI acceleration starting at PNR/TOGA condition. However, this time
deceleration will be on dry runways with good braking characteristics (combined
0.4g). Results for PNR calculations on a dry 8,000 ft runway for various
touchdown points and speeds are graphically presented in Figure 12. It
immediately becomes clear that airplanes can slow down to much lower speeds,
but the time available between the nose-gear touchdown and PNR is halved
compared to slow deceleration case (Figure 10). This may be very misleading as
the pilots will actually have less time to make critical go-around decisions and
may be deceived by the high deceleration magnitudes. This could be hazardous
when landing long and/or fast on dry runway as was the case with the ill-fated
B727 St. Thomas accident in 1976. Results for PNR calculations on a dry 9,000 ft
runway for various touchdown points and speeds are graphically presented in
Figure 13. Values of PNR speeds and times for an LDA=9,000 ft dry runway
conditions are presented in Table 2. For operational use, the speeds would be
rounded to the nearest larger integer (e.g., 93.55 knots becomes 94 knots), while
times could be rounded to nearest lower integer (e.g., 9.32 seconds would become
9 seconds) for additional safety margins.
Figure 12. PNR speed (solid) and time (dashed) results on a dry LDA=8,000 ft
runway at various touchdown distances and speeds for OEI go-around and given
deceleration magnitude.
23
Daidzic,: Rejected landing roll PNR
Published by Scholarly Commons, 2016

Figure 13. PNR speed (solid) and time (dashed) results on a dry LDA=9,000 ft
runway at various touchdown distances and speeds and given deceleration.
Table 2
PNR speeds (knots) and times (seconds) for LDA=9,000 ft and conditions given in
Figure 13
VTD [knot]
LAIR [ft]
1,500 2,500 3,500
VPNR TPNR VPNR TPNR VPNR TPNR
120 44.98 9.84 69.41 6.63 86.90 4.34
125 49.81 9.86 72.53 6.88 89.38 4.67
130 54.31 9.93 75.61 7.13 91.87 5.00
135 58.57 10.02 78.66 7.39 94.37 5.33
140 62.65 10.14 81.68 7.65 96.88 5.65
145 66.57 10.29 84.68 7.91 99.40 5.98
150 70.36 10.44 87.66 8.18 101.93 6.30
155 74.06 10.61 90.61 8.44 104.46 6.63
160 77.66 10.80 93.55 8.71 107.01 6.95
An ill-fated Hawker 800A Owatonna crash in 2008 was most likely the
result of too slow deceleration (NTSB) due to multiple known and some
24
International Journal of Aviation, Aeronautics, and Aerospace, Vol. 3 [2016], Iss. 1, Art. 5
https://commons.erau.edu/ijaaa/vol3/iss1/5DOI: https://doi.org/10.15394/ijaaa.2016.1110

undetermined reasons making overrun almost certain. After not experiencing any
appreciable deceleration while the runway end was approaching rapidly, pilots
have apparently aborted the landing roll and attempted go-around too late and
below the PNR speed (past landing PNR). This led to unsuccessful takeoff and
stall in ground effect resulting in high-speed impact with the terrain just past the
runway’s departure end. Becoming safely airborne after slowing below runway
PNR speed is not possible. On the other hand, the main cause for B727-95
accident was landing too long with essentially no option to stop or to abort
landing roll and go-around. Unfortunately, such information was not available to
B727 crew and critical decisions were basically left to captain’s feel. Both of
these unfortunate fatal accidents are well described by the theoretical
considerations presented here.
Some operators use simple guideline, which is to commit to landing roll
deceleration under all circumstances once the thrust reversers are deployed. This
is certainly common-sense and simple enough rule to follow, but not necessarily
optimal or best in all situations. One has to consider that jet engine may take up to
8 seconds to spool up to TOGA thrust from idle. On the other hand, engines in
reverse thrust will spool up quicker when reversers are re-stowed. One would
really need to study the operation and dynamics of each particular jet engine to
establish best practices in both cases – with and without thrust reversers. In any
case, aborted landing roll and go-around may be an option that could prevent
some overruns. However, such option only safely exists if initiated before the
PNR point.
However, the real complication is that landings present very dynamic
scenarios with many uncertainties as to the exact touchdown speeds and runway
touchdown points, which cannot be controlled nearly as good as during normal
takeoffs. Thus it is almost impossible for operators to schedule PNR go-around
conditions. This is something that must be done in real time and during the actual
operation in existing conditions. While a go-around after touchdown may be very
rare in actual line operations, nevertheless it may easily result in fatal accidents if
performed improperly. On the other hand, overrunning landing runways at high-
speed is also not an option and could be avoided if proper go-around is initiated in
flight or after touchdown. The problem is that pilots may not know beforehand
what exactly to expect in terms of decelerations while on approach and can start
sensing the actual conditions only after the landing roll deceleration started.
Without the availability of the accurate and efficient airplane-runway energy
detection, monitoring, management, and information system the point-of-no-
return runway location and speed becomes impossible to compute and depend on.
25
Daidzic,: Rejected landing roll PNR
Published by Scholarly Commons, 2016
The aviation industry has recognized the need for TOPM long time ago.
But takeoff performance monitors alone are not sufficient to resolve landing PNR
and go-around problems. Equally so, and perhaps even more important, are
landing performance monitors, but such do not currently exist other than in
rudimentary forms utilizing simple functions with the automatic brake systems.
For that purpose an airplane and runway energy measurement, monitoring,
management and protection system which monitors, informs, and protects all
runway operations was developed by AAR Aerospace Consulting, LLC and is
called TRSSTM. The total energy levels are monitored during takeoffs and
landings in addition to following the longitudinal and lateral runway tracks and
predicting motion along the runway based on measured accelerations, energy
state, known environmental conditions, remaining runway, surface and tire
condition, etc. It is hoped that such systems will significantly reduce runway
landing and takeoff overruns, veer-offs, unsuccessful aborted landings, and other
critical runway operations.
Conclusions
The decelerate-accelerate-takeoff maneuver in transport category airplanes
has been discussed. Mathematical model based on conservation of total energy
has been used to calculate the point-of-no-return on a runway which will still
enable the airplane to safely execute go-around and achieve regulatory screen
heights and takeoff safety speeds. After this point has been exceeded or below the
point-of-no-return speed no go-around should ever be considered. It is better to
accept overrun which may or may not result in severe crash. Landing long and
fast and/or decelerating on slippery runways may very well result in an overrun
which could be prevented if the go-around is attempted before reaching this
critical runway condition. The point-of-no-return on the runway will depend on
many factors with most important ones being the levels of deceleration and
acceleration, remaining runway left after touchdown and touchdown speed,
airplane configuration change and engine acceleration characteristics, AEO or
OEI takeoff, use of thrust reversers, and many other more or less important
factors. It is important that operators develop standard operating procedures and
train pilots on how to execute such go-around maneuver. The main problem with
landing go-arounds is that landing cannot be well defined in terms of remaining
energy and touchdown points. Dynamic conditions exist which without the
availability of the proper airplane and runway energy measurement, monitoring,
management, and information system makes the point-of-no-return runway
location and speed impossible to predict accurately.
26
International Journal of Aviation, Aeronautics, and Aerospace, Vol. 3 [2016], Iss. 1, Art. 5
https://commons.erau.edu/ijaaa/vol3/iss1/5DOI: https://doi.org/10.15394/ijaaa.2016.1110

Author Bio
Dr. Nihad E. Daidzic is president of AAR Aerospace Consulting, L.L.C. He is also
a full professor of Aviation, adjunct professor of Mechanical Engineering, and
research graduate faculty at Minnesota State University, Mankato. His Ph.D. is in
fluid mechanics and Sc.D. in mechanical engineering. He was formerly a
research associate in applied physics at the Center for Microgravity Research
and Applications at Vanderbilt University and a staff scientist at the National
Center for Microgravity Research and the National Center for Space Exploration
and Research at NASA Glenn Research Center in Cleveland, OH. He has also
held various faculty appointments at Vanderbilt University, University of Kansas,
and Kent State University. His current research interest is in theoretical,
experimental, and computational fluid dynamics, micro- and nano-fluidics,
aircraft stability, control, and performance, mechanics of flight, piloting
techniques, and aerospace propulsion. Dr. Daidzic has authored more than 130
peer-reviewed journal, international conference, and professional industry
magazines articles and has authored over 60 proprietary technical reports for
NASA, DOE, ESA, etc. Dr. Daidzic is ATP and “Gold Seal” CFII/MEI/CFIG with
flight experience in airplanes, helicopters, and gliders.
27
Daidzic,: Rejected landing roll PNR
Published by Scholarly Commons, 2016

References
Anderson, J. D. Jr. (1999). Aircraft performance and design. New York, NY:
McGraw-Hill.
Asselin, M. (1997). An Introduction to Aircraft Performance. Reston, VA:
American Institute for Aeronautics and Astronautics (AIAA).
Blake, W., & Elliott, R. L. (1991, March). The last two minutes, Boeing Airliner,
Jan.–March 1991, 1–9.
Daidzic, N. E., & Shrestha, J. (2008). Airplane Landing Performance on
Contaminated Runways in Adverse Conditions, Journal of Aircraft, 45(6),
2131-2144. DOI: 10.2514/1.38056
Daidzic, N. E. (2008, December). When go-around is impossible - defining the
point of no return. Professional Pilot, 42(12), 110-113.
Daidzic, N.E. (2009a) Aircraft Landing Operations on Contaminated Runways
and Adverse Conditions, WATS 2009, World Aviation Training
Conference, Rosen Shingle Creek Resort, Paper WATS 5.2, 28-30 April
2009, Orlando, FL.
Daidzic, N. E. (2009b, September). Avoiding veer-off accidents on contaminated
runways, Professional Pilot, 43(9), 54-58.
Daidzic, N. E. (2009c, December). Avoiding overrun accidents on contaminated
runways, Professional Pilot, 43(12), 104-107.
Daidzic, N. E. (2011a, March). Dealing with Contaminated Runways. The
Journal for Civil Aviation Training (CAT), 2/2011, 29-32.
Daidzic, N.E. (2011b) Some Considerations for Regional Airline Operations on
Contaminated Runways, WATS 2011, World Aviation Training
Conference, Rosen Shingle Creek Resort, Paper RATS 6.3, April 19-21,
2011, Orlando, FL.
Daidzic, N.E. (2012a, March) FADEC advances allow better Engine
Performance, Professional Pilot, 46(3), 78-82.
28
International Journal of Aviation, Aeronautics, and Aerospace, Vol. 3 [2016], Iss. 1, Art. 5
https://commons.erau.edu/ijaaa/vol3/iss1/5DOI: https://doi.org/10.15394/ijaaa.2016.1110

Daidzic, N.E. (2012b, September) Jet Engine Thrust Ratings, Professional Pilot,
46(9), 92-96.
Daidzic, N. E. (2013a, August). T/O overruns and veer-offs on slippery runways
with crosswinds, Professional Pilot, 47(8), 54-58.
Daidzic, N. E. (2013b, November). Aircraft tests arrive at numbers pilots need for
safe operations, Professional Pilot, 47(11), 100-104.
Daidzic, N.E. (2014). A total-energy based model of airplane overspeed takeoffs.
International Journal of Aviation Aeronautics Aerospace (IJAAA), 1(3), 1-
25.
Daidzic, N.E. (2016). Determining the runway point-of-no-return for landing roll
go-around in transport category airplanes, A3IR Aviation Research
Conference 2016, Paper #1210, January 14-17, 2016, Chandler AZ.
Davies, M. (Ed.) (2003). The standard handbook for aeronautical and
astronomical Engineers. New York, NY: McGraw-Hill.
DeLoach, R., Marlowe, R. J., & Yager T. (2009). Uncertainty analysis for the
evaluation of a passive runway arresting system, 47th AIAA Aerospace
Sciences Meeting including The New Horizons Forum and Aerospace
Exposition Conference, Paper AIAA 2009-1156, January 5-8
2009, Orlando, FL. DOI: 10.2514/6.2009-1156
van Es, G. W. H., Roelen A. L. C., Kruijsen E. A. C, & Giesberts, M. K. H.
(2001). Safety aspects of aircraft performance on wet and contaminated
runways (Report NLR-TP-2001-216), Amsterdam, The Netherlands: NLR
Air Transport Safety Institute.
van Es, G. W. H. (2005). Running out of runway: Analysis of 35 years of landing
overrun accidents (Report NLR-TP-2005-498), Amsterdam, The
Netherlands: NLR Air Transport Safety Institute.
van Es, G. W. H. (2010). A study of runway excursion from a European
perspective (Report NLR-CR-2010-259), Amsterdam, The Netherlands:
NLR Air Transport Safety Institute.
Eshelby, M. E. (2000). Aircraft performance: Theory and practice. Boston, MA:
Elsevier.
29
Daidzic,: Rejected landing roll PNR
Published by Scholarly Commons, 2016

Filippone, A. (2006). Flight performance of fixed and rotary wing aircraft.
Reston, VA: American Institute for Aeronautics and Astronautics (AIAA).
Hale, F. J. (1984). Introduction to aircraft performance, selection, and design.
New York, NY: John Wiley & Sons.
Jeppesen. (2007). Performance. (JAA ATPL Training, Edition 2, JA 310109-002,
Book 9, JAR Ref. 032, ISBN 0-88487-496-6). Neu-Isenburg, Germany:
Atlantic Flight Training, Ltd., Sanderson Training products, Jeppesen
GmbH.
Job. M. (1994). Air disaster – Volume 1. Weston Creek, Australia: Aerospace
Publications Pty Ltd.
Mair, W. A., & Birdsall, D. L. (1992). Aircraft performance. Cambridge, UK:
Cambridge University Press.
McCormick, B. W. (1995). Aerodynamics, aeronautics and flight mechanics (2nd
ed.). New York, NY: John Wiley & Sons.
McKinney, D. (1999). Flight Safety Foundation approach-and-landing accident
reduction task force operations and training working group final report
(SAE Paper 1999-01-5585). Warrendale, PA: Society of Automotive
Engineers (SAE).
Padilla, C. E. (1996). Optimizing jet transport efficiency: Performance,
operations, and economics. New York, NY: McGraw-Hill.
Roskam, J., & Lan, C. T. (1997). Airplane aerodynamics and performance,
Lawrence, KS: DAR Corporation.
Saarlas, M. (2007). Aircraft performance. Hoboken, NJ: John Wiley & Sons.
Shevell, R. S. (1989). Fundamentals of flight. Englewood Cliffs, NJ: Prentice
Hall.
Spiegel, M. R., & Liu, J. (1999). Mathematical handbook of formulas and tables
(2nd ed.). New York, NY: McGraw-Hill.
Swatton, P. J. (2008). Aircraft performance: Theory and practice for pilots (2nd
ed.). Chichester, UK: John Wiley & Sons.
30
International Journal of Aviation, Aeronautics, and Aerospace, Vol. 3 [2016], Iss. 1, Art. 5
https://commons.erau.edu/ijaaa/vol3/iss1/5DOI: https://doi.org/10.15394/ijaaa.2016.1110

Torenbeek, E., & Wittenberg, H. (2009). Flight physics, Amsterdam, The
Netherlands: Springer.
US Department of Transportation, Federal Aviation Administration. (1994).
Takeoff safety training aid (AC 120-62). Washington, DC: Author.
US Department of Transportation, Federal Aviation Administration. (2007). A
study of normal operational landing performance on subsonic, civil,
narrow-body jet aircraft during instrument landing system approaches
(Final Report DOT/FAA/AR-07/7), Washington, DC: Author.
US Department of Transportation, Federal Aviation Administration. (2012).
Engineered Materials Arresting Systems (EMAS) for Aircraft Overruns
(Advisory Circular AC 150/5220-22B). Washington, DC: Author.
US Department of Transportation, Federal Aviation Administration. (2013). Part
25, Airworthiness Standards: Transport Category Airplanes. Washington,
DC: Author.
US Department of Transportation, Federal Aviation Administration. (2014a).
Airport design (Advisory Circular AC 150/5300-13A). Washington, DC:
Author.
US Department of Transportation, Federal Aviation Administration. (2014b). Part
121, Operating Requirements: Domestic, Flag, and Supplemental
Operations. Washington, DC: Author.
Vinh, N. X. (1993). Flight mechanics of high-performance aircraft. Cambridge,
UK: Cambridge University Press.
Wagenmakers, J. (1991). Aircraft performance engineering. New York, NY:
Prentice Hall.
Zammit-Mangion, D., & Eshelby, M. (2005). Design and integration of a take-off
monitor display, AIAA Atmospheric Flight Mechanics Conference and
Exhibit, August 15-18 2005, San Francisco, CA. DOI: 10.2514/6.2005-
6218
Zammit-Mangion, D., & Eshelby, M. (2006). Evaluation of takeoff performance
monitoring algorithm in large transport operations, Journal of Aircraft,
43(1), 201-206. DOI: 10.2514/1.2974
31
Daidzic,: Rejected landing roll PNR
Published by Scholarly Commons, 2016