determination of promethazine in human plasma by automated high-performance liquid chromatography...
TRANSCRIPT

105
Journal of Chromatography, 339 (1985) 105-115 Biomedical Applications Elsevier Science Publishers B.V., Amsterdam - Printed in The Netherlands
CHROMBIO. 2482
DETERMINATION OF PROMETHAZINE IN HUMAN PLASMA BY AUTOMATED HIGH-PERFORMANCE LIQUID CHROMATOGRAPHY WITH ELECTROCHEMICAL DETECTION AND BY GAS CHROMATOGRAPHY- MASS SPECTROMETRY
D.E. LEELAVATHI*, D.E. DRESSLER, E.F. SOFFER, SD. YACHETTI and J.A. KNOWLES
Research Division, Wyeth Laboratories, Inc., Radnor, PA 19087 (U.S.A.)
(First received August 20th, 1984; revised manuscript received November 8th, 1984)
SUMMARY
A highly specific and sensitive method using automated high-performance liquid chro- matography with electrochemical detection (HPLC-ED) and a method using gas chro- matography-mass spectrometry (GC-MS) have been developed for the quantitative deter- mination of promethazine in plasma. The lowest detectable concentration by HPLC-ED is 0.1 ng/ml of plasma and by GC-MS 0.5 ng/ml of plasma. The HPLC-ED method in- corporates a valve switching unit to prevent all of the electroactive impurities from enter- ing the electrode compartment, thus maintaining the sensitivity of the detector for the analyses of large numbers of samples. The GC-MS method incorporates the highly specific selected-ion monitoring technique. Plasmas derived from healthy subjects each given a single 50-mg oral dose of promethazine were analyzed by both HPLC-ED and GC-MS. The two methods compare favorably with a correlation coefficient of 0.92 and a slope of 1.059. While both methods are suitable for studying single-dose pharmacokinetics of promethazine, the automated HPLC-ED method has a decided advantage in being more sensitive and suitable for unattended overnight analyses of the large number of samples encountered in pharmacokinetic studies. The specificity of the HPLC-ED method is demonstrated by comparison to the GC-MS analysis of biological samples.
INTRODUCTION
The quantitation of promethazine, a potent antihistamine, in blood sam- ples has been complicated by its instability, the very low concentrations en- countered after therapeutic doses, and interferences from metabolic products. Analytical techniques developed over the past few years which might be suitable for pharmacokinetic studies with this drug are lacking in sensitivity [l-7] and in ability to run a large number of samples [B, 91.
While we were investigating electrochemical detection (ED) for measur-
037%4347/85/$03.30 o 1985 Elsevier Science Publishers B.V.

106
ing promethazine, two very similar methods appeared in the literature, one by Wallace et al. [S] and the other by Curry and Brown [6], both using high-performance liquid chromatography (HPLC) with electrochemical detec- tion. We have been able to determine as low as 0.1 ng/ml of plasma using a modification of the method by Wallace et al. [8]. However, the high sensitiv- ity of this method decreased rapidly in the course of analyzing only ten to fifteen samples. The electrode needed resurfacing every day to improve sensi- tivity. This was impractical for running the large number of samples encoun- tered in pharmacokinetic studies. The deterioration of sensitivity was found to be due to the large plasma contaminant peak that eluted near the solvent front. Extensive purification of plasma extract before chromatography is not possible due to the instability of promethazine [8] during processing. The number of samples encountered in pharmacokinetic studies cannot be run because of the rapid decrease in electrode sensitivity due to impurities in the plasma extracts. The chromatographic column (Micropak CN-10 from Varian) separated all of these impurities as a single peak near the solvent front. Therefore, we have incorporated a valve switching device to divert the impurities away from the electrode compartment, resulting in the maintenance of high electrode sensitivity and baseline stability over a long period of time. This communication describes the configuration of such a valve switching device and the automation of the chromatographic procedure for determining promethazine at subnanogram quantities in plasma.
In this report we have also included a gas chromatographic-mass spectro- metric (GC-MS) method with selected-ion monitoring (SIM). This method is also highly sensitive and specific. Both methods have been compared by deter- mining the concentrations of promethazine in plasmas from subjects given 50 mg of an oral dose of Phenergan@.
EXF'ERIMENTAL
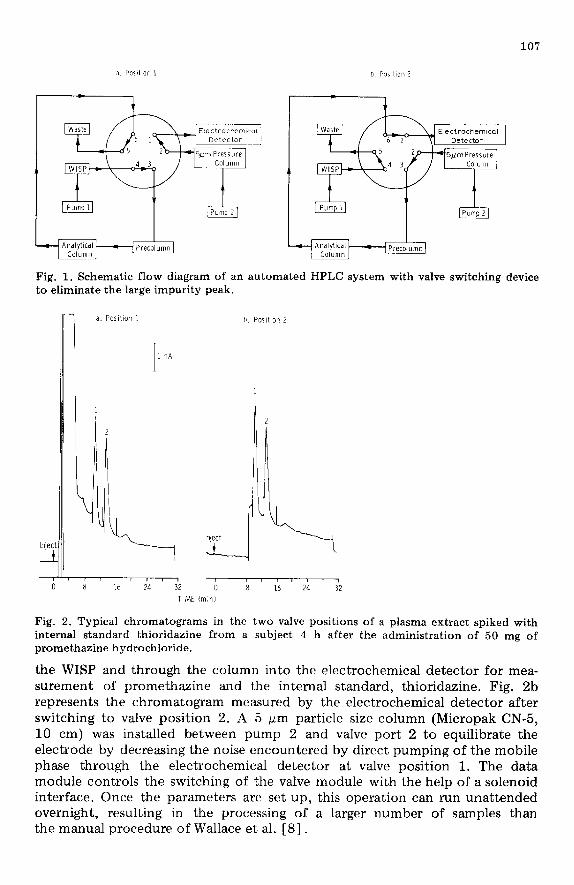
Instrumentation, column and valving configuration Fig. 1 depicts a schematic diagram of the apparatus employed for HPLC.
It consists of two pumps (Corn&metric, Laboratory Data Control) pump- ing the mobile phase at the same rate, a precolumn (Micropak, CN-10, 3 cm X 4.6 mm) and an analytical column (Micropak CN-10, 30 cm X 4 mm, Vari- an), a Waters Intelligent Sample Processor (WISP), an Autochrome six-port column switching Model 7OOOA valve, an electrochemical detector (LC-4B from Bioanalytical Systems) and a Waters M730 data module to control the WISP and valve module and to plot and integrate the signals from the detec- tor.
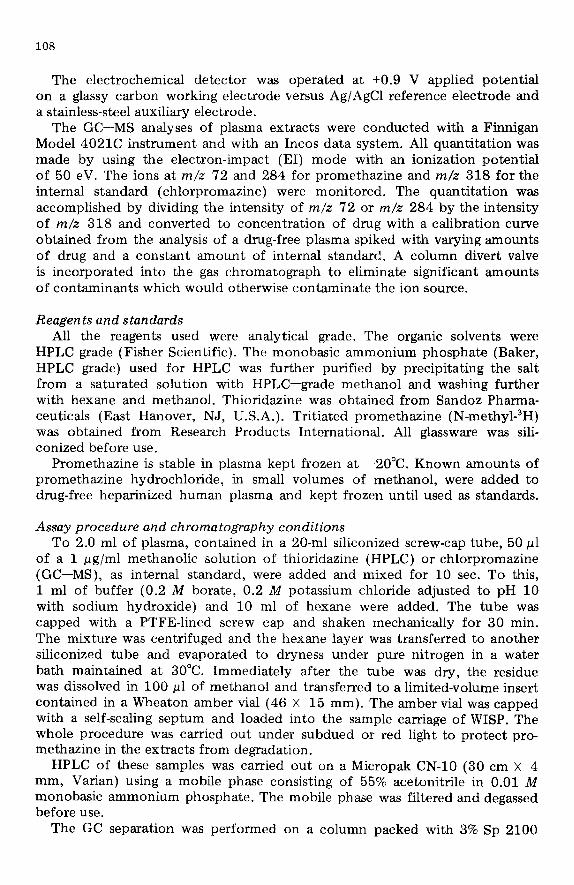
The two valve configurations selected for this particular application are represented in Fig. la and b. The sample, injected by the WISP, is directed by the solvent flow from pump 1 (direction represented by the arrows) through the two columns to waste. Fig. 2a represents a typical chromatogram from an electrochemical detector if the sample were injected without valve switch- ing. By the time the initial broad peak has eluted completely from the ana- lytical column (8.5 min in this case), the valve module switches to position 2, shown in Fig. lb. In this position, pump 1 is flushing mobile phase through
107
Fig. 1. Schematic flow diagram of an automated HF’LC system with valve switching device to eliminate the large impurity peak.
d. PasItIon 1 b. PosItIDr 2
I 1 0 8 16 24 32 0 8 16 24 32
TIME <mlnl
Fig. 2. Typical chromatograms in the two valve positions of a plasma extract spiked with internal standard thioridazine from a subject 4 h after the administration of 50 mg of promethazine hydrochloride.
the WISP and through the column into the electrochemical detector for mea- surement of promethazine and the internal standard, thioridazine. Fig. 2b represents the chromatogram measured by the electrochemical detector after switching to valve position 2. A 5 pm particle size column (Micropak CN-5, 10 cm) was installed between pump 2 and valve port 2 to equilibrate the electrode by decreasing the noise encountered by direct pumping of the mobile phase through the electrochemical detector at valve position 1. The data module controls the switching of the valve module with the help of a solenoid interface. Once the parameters are set up, this operation can run unattended overnight, resulting in the processing of a larger number of samples than the manual procedure of Wallace et al. [8].
108
The electrochemical detector was operated at +0.9 V applied potential on a glassy carbon working electrode versus Ag/AgCl reference electrode and a stainless-steel auxiliary electrode.
The GC-MS analyses of plasma extracts were conducted with a Finnigan Model 4021C instrument and with an Incas data system. All quantitation was made by using the electron-impact (EI) mode with an ionization potential of 50 eV. The ions at m/z 72 and 284 for promethazine and m/z 318 for the internal standard (chlorpromazine) were monitored. The quantitation was accomplished by dividing the intensity of m/z 72 or m/z 284 by the intensity of m/z 318 and converted to concentration of drug with a calibration curve obtained from the analysis of a drug-free plasma spiked with varying amounts of drug and a constant amount of internal standard. A column divert valve is incorporated into the gas chromatograph to eliminate significant amounts of contaminants which would otherwise contaminate the ion source.
Reagents and standards All the reagents used were analytical grade. The organic solvents were
HPLC grade (Fisher Scientific). The monobasic ammonium phosphate (Baker, HPLC grade) used for HPLC was further purified by precipitating the salt from a saturated solution with HPLC-grade methanol and washing further with hexane and methanol. Thioridazine was obtained from Sandoz Pharma- ceuticals (East Hanover, NJ, U.S.A.). Tritiated promethazine (N-methyl-3H) was obtained from Research Products International. All glassware was sili- conized before use.
Promethazine is stable in plasma kept frozen at -20°C. Known amounts of promethazine hydrochloride, in small volumes of methanol, were added to drug-free heparinized human plasma and kept frozen until used as standards.
Assay procedure and chromatography conditions To 2.0 ml of plasma, contained in a 20-ml siliconized screw-cap tube, 50 ~1
of a 1 pg/ml methanolic solution of thioridazine (HPLC) or chlorpromazine (GC-MS), as internal standard, were added and mixed for 10 sec. To this, 1 ml of buffer (0.2 1w borate, 0.2 M potassium chloride adjusted to pH 10 with sodium hydroxide) and 10 ml of hexane were added. The tube was capped with a PTFE-lined screw cap and shaken mechanically for 30 min. The mixture was centrifuged and the hexane layer was transferred to another siliconized tube and evaporated to dryness under pure nitrogen in a water bath maintained at 30°C. Immediately after the tube was dry, the residue was dissolved in 100 ~1 of methanol and transferred to a limited-volume insert contained in a Wheaton amber vial (46 X 15 mm). The amber vial was capped with a self-sealing septum and loaded into the sample carriage of WISP. The whole procedure was carried out under subdued or red light to protect pro- methazine in the extracts from degradation.
HPLC of these samples was carried out on a Micropak CN-10 (30 cm X 4 mm, Varian) using a mobile phase consisting of 55% acetonitrile in 0.01 M monobasic ammonium phosphate. The mobile phase was filtered and degassed before use.
The GC separation was performed on a column packed with 3% Sp 2100
109
(methylsilicone, 1.8 m X 0.25 cm). The helium carrier gas flow-rate was main- tained at 20 ml/min. Promethazine, chlorpromazine and thioridazine eluted at 2.2, 3.9 and 20 min, respectively. Chlorpromazine was a better internal standard than thioridazine under these conditions. For simultaneous deter- mination of these samples by HPLC and GC-MS, a slight modification of the HPLC conditions was used. A micropak CN-5 column (30 cm X 4 mm) and 60% acetonitrile in 0.01 M monobasic ammonium phosphate gave a better separation of promethazine and chlorpromazine. Extraction of promethazine and chlorpromazine was the same as described earlier except the final residue was dissolved in 20 ~1 instead of 100 ~1 of methanol. A 3+1 aliquot was in- jected onto the GC column. The remaining portion was dissolved in 100 ~1 and 50 ~1 were injected onto the HPLC column.
Plasma samples, obtained from normal subjects each given a single oral dose of 50 mg promethazine, were analyzed by both the HPLC and GC-MS procedures described above.
Calibration procedure A calibration curve of peak height ratios of promethazine to internal stan-
dard (thioridazine or chlorpromazine) against concentrations of promethazine (ng/ml) was constructed over the range 0.1-10 ng/ml of plasma. Samples of drug-free human plasma (2 ml) and plasma spiked with 0.1, 0.2, 0.5, 1.0, 2.5, 5 and 10 ng/ml promethazine and 50 ng of internal standard were taken through the extraction procedure described earlier and analyzed by HPLC-ED and GC-MS. Calibration standards were chromatographed each day along with the unknown samples. The concentrations of the unknown samples were determined by comparison to peak height ratios from the standard curve obtained that day. Four replicate extractions were made at each concentra- tion over the calibration range.
Recovery The peak heights of the promethazine standards were measured after in-
jecting 0.1-20 ng of the drug. The peak height values of the extracted samples from spiked plasma were compared with the peak height for standard solu- tions after correcting for the dilution and reported as percent recovery.
The extraction efficiency was also tested with radioactive promethazine. [3H] Promethazine was purified by collection of a fraction corresponding to the HPLC peak using UV detection. The purity was tested using silica gel thin-layer chromatography with two solvent systems: ethyl acetate-acetic acid-ammonia (45:45:2) and hexane-~chloroform-methanol- triethylamine (45:4:5:5). This fraction was 94% pure and used without further purifica- tion. The radioactivity of the hexane fraction derived by extracting plasma spiked with [3H]promethazine was measured using 10 ml of HydrofluorTM scintillation mixture from Laboratory Diagnosis in Packard Tri-Carb liquid scintillation spectrometer.
RESULTS
High-performance liquid chromatography The maximum oxidation potential was +0.9 V for promethazine and +0.95

110
V for both thioridazine and chlorpromazine versus Ag/AgCl reference elec- trode. All compounds gave linear responses at +0.9 V. An amount of 50 pg of promethazine gave a signal twice that of background. The limit of detec- tion of extracted promethazine was 0.1 ng/ml using 2 ml of plasma.
Promethazine and the internal standard (thioridazine) were well separated, eluting at 10.2 and 12.9 min, respectively (Fig. 2). Blank plasma extracts yielded no interferences from endogenous components. The only two me- tabolites responsive to electrochemical detection at the potential used, mono- desmethyl- and didesmethylpromethazine, elute at 7.2 and 8.2 min, respec- tively. Promethazine sulfoxide elutes at 8.9 min but it is less electroactive at 0.9 V applied potential versus Ag/AgCl reference electrode. Its position was determined by UV detection. A representative chromatogram of spiked plasma extract, shown in Fig. 2b, indicates almost complete elimination of the initial broad peak of electroactive contaminants (Fig. 2a). Elimination of this highly electroactive contaminating peak at the elution front maintains the sensitiv- ity of the detector and stability of the baseline for a month. Without use of the valve switching, the electrode needs resurfacing every day to maintain the needed sensitivity. There were variations between the different columns obtained from the same manufacturer (Varian) with respect to the exact time of elution of the compounds. However, the specificity of the column as determined by the order of elution of the various compounds remained the same. The time of valve switching must be determined for each column. With a single column, the retention time from day to day remained the same. The precision of the assay and linearity of the calibration curve did not change with different columns or by using either thioridazine or chlorpromazine as the internal standard.
Within-day precision of the method gave a coefficient of variation of less than 3% for concentrations above 0.5 ng/ml and slightly higher for those below 0.5 ng/ml. Day-to-day variation for analyses carried out in the course of one month are represented in Table I. Calibration standards were chro- matographed along with unknown samples each day for increased precision of analysis.
A calibration plot for the determination of promethazine constructed over the concentration range 0.1-10 ng/ml was linear (correlation coefficient
TABLE I
CALIBRATION CURVE DATA FOR PROMETHAZINE (HPLC-ED)
Concentration
(ngbl)
0.1 0.2 0.5 1.0 2.5 5.0
10.0
n Mean peak height ratio + S.D.
0.018 ? 0.003 0.035 +_ 0.007 0.064 z 0.008 0.149 + 0.008 0.372 -L 0.036 0.711 * 0.055 1.355 = 0.068
Y = 0.136~ + 0.012; correlation coefficient = 0.995
111
0.9922). The recovery of promethazine with unlabeled standards was 74*4%. The recovery of labeled promethazine was 78*2%. Promethazine is very stable in plasma when stored at -20°C in the dark. There was no significant de- crease in its concentration when analyzed after a year.
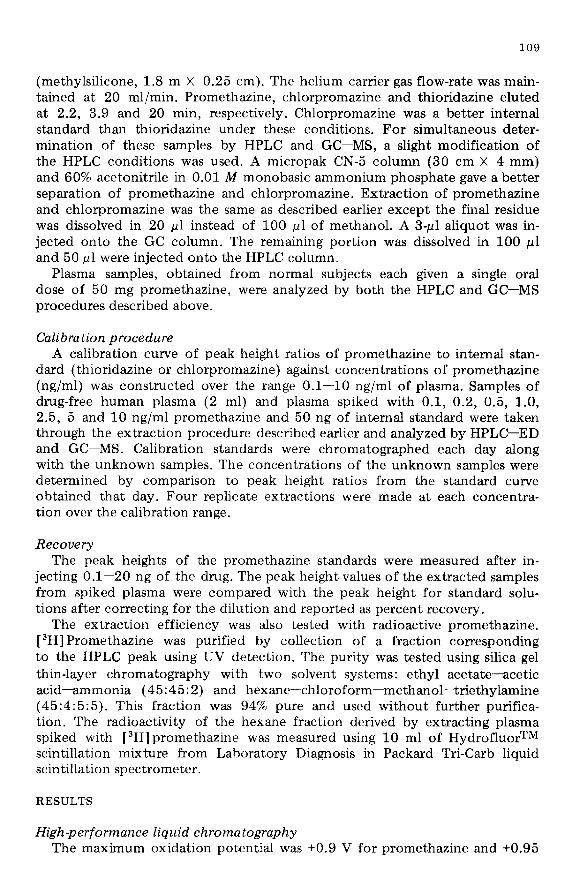
Gas chromatography-mass spec trome try The EI spectrum of promethazine is shown in Fig. 3. A similar spectrum
has been reported and interpreted previously [lo]. The relative abundance of various mass ions are 72(100), 99(3.7), 167(4.86), 198(7.25), 199(12.30), 213(6.84) and 284(5.57). The best ions suitable for SIM were fragment ion 72 for sensitivity and mass ion 284 for specificity. Chlorpromazine was used as the internal standard and mass ion 318 was determined to be the most suitable for monitoring.
!OO.O 12 -
~
r lG.OX - 152576
7
180 198 , 213 284
56 65 d77 85 95
100 150 200 250
Fig. 3. Electron-impact ionization mass spectrum of promethazine.
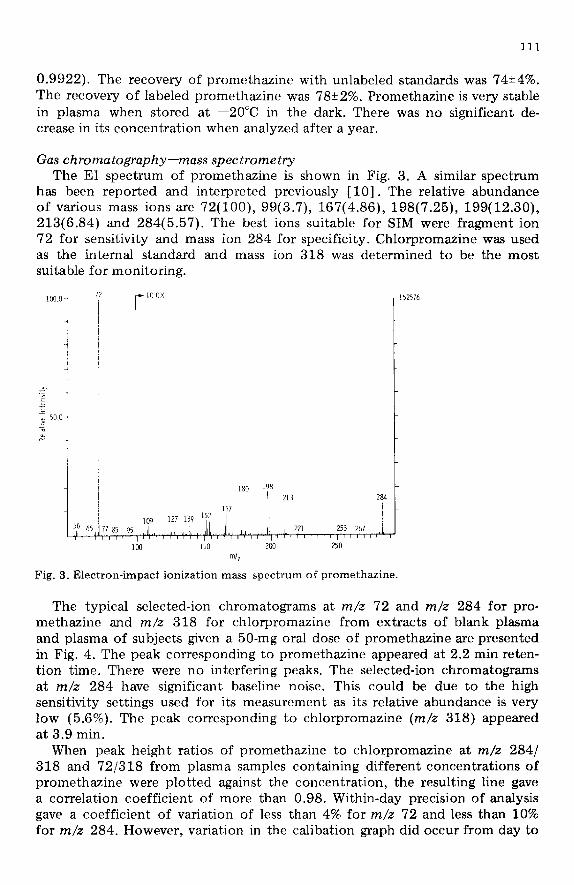
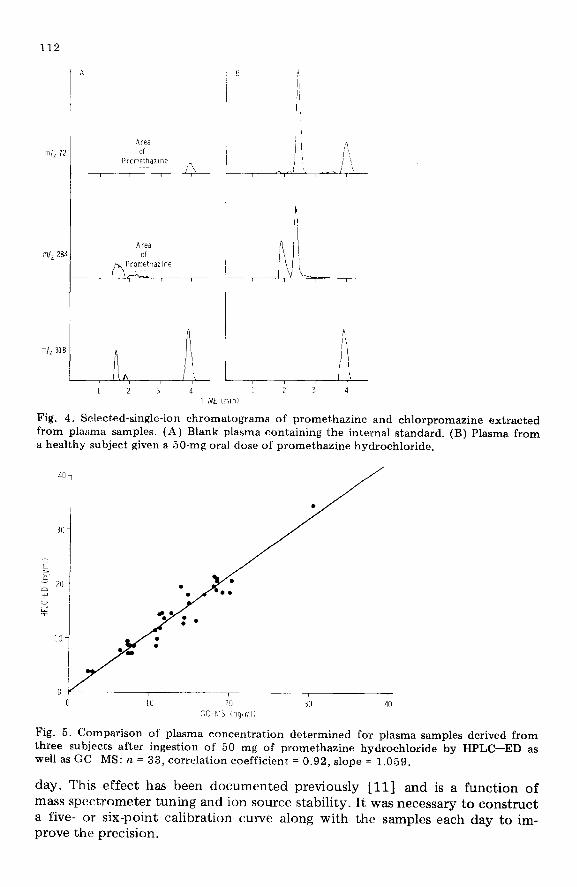
The typical selected-ion chromatograms at m/z 72 and m/z 284 for pro- methazine and m/z 318 for chlorpromazine from extracts of blank plasma and plasma of subjects given a 50-mg oral dose of promethazine are presented in Fig. 4. The peak corresponding to promethazine appeared at 2.2 min reten- tion time. There were no interfering peaks. The selected-ion chromatograms at m/z 284 have significant baseline noise. This could be due to the high sensitivity settings used for its measurement as its relative abundance is very low (5.6%). The peak corresponding to chlorpromazine (m/z 318) appeared at 3.9 min.
When peak height ratios of promethazine to chlorpromazine at m/z 284/ 318 and 72/318 from plasma samples containing different concentrations of promethazine were plotted against the concentration, the resulting line gave a correlation coefficient of more than 0.98. Within-day precision of analysis gave a coefficient of variation of less than 4% for m/z 72 and less than 10% for m/z 284. However, variation in the calibation graph did occur from day to
112
mir 7:
ml, 28
ml, 311 ‘\ j \
I
3
1 2 3 4
TIME ,-IL
Fig. 4. Selected-single-ion chromatograms of promethazine and chlorpromazine extracted from plasma samples. (A) Blank plasma containing the internal standard. (B) Plasma from a healthy subject given a 50-mg oral dose of promethazine hydrochloride.
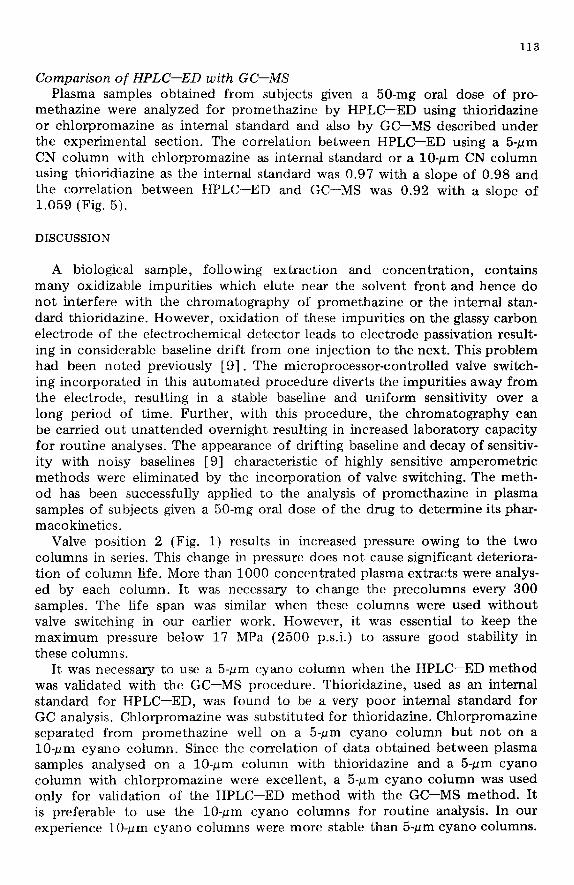
Fig. 5. Comparison of plasma concentration determined for plasma samples derived from three subjects after ingestion of 50 mg of promethazine hydrochloride by HPLC-ED as well as GC-MS: n = 33, correlation coefficient = 0.92, slope = 1.059.
day. This effect has been documented previously [ll] and is a function of mass spectrometer tuning and ion source stability. It was necessary to construct a five- or six-point calibration curve along with the samples each day to im- prove the precision.
113
Comparison of HPLC-ED with GC-MS Plasma samples obtained from subjects given a 50-mg oral dose of pro-
methazine were analyzed for promethazine by HPLC--ED using thioridazine or chlorpromazine as internal standard and also by GC-MS described under the experimental section. The correlation between HPLC-ED using a 5-pm CN column with chlorpromazine as internal standard or a lo-pm CN column using thioridiazine as the internal standard was 0.97 with a slope of 0.98 and the correlation between HPLC-ED and GC-MS was 0.92 with a slope of 1.059 (Fig. 5).
DISCUSSION
A biological sample, following extraction and concentration, contains many oxidizable impurities which elute near the solvent front and hence do not interfere with the chromatography of promethazine or the internal stan- dard thioridazine. However, oxidation of these impurities on the glassy carbon electrode of the electrochemical detector leads to electrode passivation result- ing in considerable baseline drift from one injection to the next. This problem had been noted previously [9]. The microprocessor-controlled valve switch- ing incorporated in this automated procedure diverts the impurities away from the electrode, resulting in a stable baseline and uniform sensitivity over a long period of time. Further, with this procedure, the chromatography can be carried out unattended overnight resulting in increased laboratory capacity for routine analyses. The appearance of drifting baseline and decay of sensitiv- ity with noisy baselines [9] characteristic of highly sensitive amperometric methods were eliminated by the incorporation of valve switching. The meth- od has been successfully applied to the analysis of promethazine in plasma samples of subjects given a 50-mg oral dose of the drug to determine its phar- macokinetics.
Valve position 2 (Fig. 1) results in increased pressure owing to the two columns in series. This change in pressure does not cause significant deteriora- tion of column life. More than 1000 concentrated plasma extracts were analys- ed by each column. It was necessary to change the precolumns every 300 samples. The life span was similar when these columns were used without valve switching in our earlier work. However, it was essential to keep the maximum pressure below 17 MPa (2500 p.s.i.) to assure good stability in these columns.
It was necessary to use a 5-pm cyano column when the HPLC-ED method was validated with the GC-MS procedure. Thioridazine, used as an internal standard for HPLC-ED, was found to be a very poor internal standard for GC analysis. Chlorpromazine was substituted for thioridazine. Chlorpromazine separated from promethazine well on a 5-pm cyano column but not on a lo-pm cyan0 column. Since the correlation of data obtained between plasma samples analysed on a lo-pm column with thioridazine and a 5-pm cyan0 column with chlorpromazine were excellent, a 5-pm cyan0 column was used only for validation of the HPLC-ED method with the GC-MS method. It is preferable to use the lo-pm cyan0 columns for routine analysis. In our experience lo-pm cyan0 columns were more stable than 5-pm cyano columns.
114
Nearly six to eight times more samples can be analysed using lo-pm cyan0 columns compared to &urn cyan0 columns.
Promethazine, similar to other phenothiazines, is extensively metabolized with high first-pass metabolism [ 10, 121. Metabolites of phenothiazines arise by S-oxidation, demethylation, N-oxidation, hydroxylation and conjugation. The conjugated metabolites, because of their polarity, do not pose any problem in the assay. A non-polar solvent (hexane) at alkaline pH does not extract N-oxides [ 131. Monodesmethyl- and didesmethylpromethazine were well separated from promethazine and the internal standard. Less than 1% of the sulfoxide was extracted under our conditions. The electrochemical detector specificity eliminates significant interferences from the sulfone, if present. However, owing to the low concentration of the parent drug attained in plasma following oral dosing and the large number of metabolites formed in vivo, it was necessary to validate the method by GC-MS. The high sensitivity and specificity of the GC-MS procedure, especially by the SIM technique, make it the method of choice for validation. It was necessary to utilize SIM of both m/z 72 and m/z 284 for the determination of promethazine. The rela- tive abundance of m/z 284 is very low (5.9%) and hence has to be measured at a very high sensitivity setting. This results in a noisier baseline, which makes it impossible to measure promethazine below 2 ng/ml with this mass ion. Higher sensitivity can be easily achieved by SIM at m/z 72. The disadvantage of using the m/z 72 is the significant interference that could be expected by coelution of metabolites of promethazine. The predominant metabolite, pro- methazine sulfoxide, which could interfere by on-column reduction under GC conditions [14] is minimally extracted into the organic phase (less than 1%) under our conditions. However, the high degree of correlation between measuring m/z 72 and m/z 284 eliminates the possibility of significant con- tamination from unknown metabolites. This is the first report on a systematic comparison of the HPLC-ED method with GC-MS for promethazine. Recent- ly McKay et al. [15] have compared the HPLC-ED method with GC-MS for another phenothiazine, chlorpromazine.
CONCLUSION
The extraction procedure described in this paper yields a clean extract suitable for both HPLC-ED and GC-MS. Both methods could be used for the study of single-dose pharmacokinetics of this drug.
The general downtime associated with a mass spectrometer and variation in source sensitivity makes the CC-MS procedure difficult for routine use. On the other hand the automated HPLC-ED method not only gives a con- venient and comparatively less troublesome analytical method but has high capacity to run the large number of samples generated during the study of pharmacokinetics of this drug.
Other phenothiazines such as chlorpromazine, thioridazine and promazine could be analyzed by the same method with a suitable internal standard.
115
ACKNOWLEDGEMENT
We wish to thank Dr. Hans W. Ruelius for helpful discussions.
REFERENCES
1 J. Quinn and R. Calvert, J. Pharm. Pharmacol., 28 (1976) 59P. 2 G. Taylor, R.T. Calvert and J.B. Houston, Anal. Lett., 12 (1979) 1435. 3 C.J. Reddrop, W. Riess and T.F. Slater, J. Chromatogr., 192 (1980) 375. 4 G.J. DiGregario and E. Ruth, J. Pharm. Sci., 69 (1980) 1457. 5 J.E. Wallace, E.L. Shimek, SC. Harris and S. Stavchansky, Clin. Chem., 27 (1981)
253. 6 S.H. Curry and E.A. Brown, IRCS Med. Sci., 9 (1981) 166. 7 R.B. Pate1 and P.G. Welling, J. Pharm. Sci., 71 (1982) 529. 8 J.E. Wallace, E.L. Shimek, S. Stavchansky and S.C. Harris, Anal. Chem., 53 (1981)
960. 9 S.H. Curry, E.A. Brown, O.Y.P. Hu and J.H. Perrin, J. Chromatogr., 231 (1982) 361.
10 C.M. Shearer and S.M. Miller, Anal. Profiles Drug Subst., 5 (1976) 429. 11 B.J. Millard, Quantitative Mass Spectrometry, Hayden and Son, London, 1978. 12 B.A. Clement and A.H. Beckett, Xenobiotica, 11 (1981) 609. 13 D.A. Cowan, in E. Reid (Editor), Assay of Drugs and Other Trace Compounds in
Biological Fluids - Methodological Development in Biochemistry, Vol. 5, North Hol- land, Amsterdam, 1976, p. 193.
14 R.B. Pate1 and P.G. Welling, Clin. Chem., 27 (1981) 1060. 15 G. McKay, K. Hall, J.K. Cooper, E.M. Hawes and K.K. Midha, J. Chromatogr., 232
(1982) 275.