determination of perfluorinated compounds in the upper mississippi river basin
TRANSCRIPT
Determination of PerfluorinatedCompounds in the UpperMississippi River BasinS H O J I F . N A K A Y A M A , †
M A R K J . S T R Y N A R , ‡ J E S S I C A L . R E I N E R , §
A M Y D . D E L I N S K Y , ‡ A N DA N D R E W B . L I N D S T R O M * , ‡
National Risk Management Research Laboratory, U.S.Environmental Protection Agency, Cincinnati, Ohio 45268,National Exposure Research Laboratory, U.S. EnvironmentalProtection Agency, Research Triangle Park,North Carolina 27711, and National Institute of Standardsand Technology, Charleston, South Carolina 29412
Received February 3, 2010. Revised manuscript receivedMarch 29, 2010. Accepted April 22, 2010.
Despite ongoing efforts to develop robust analytical methodsfor the determination of perfluorinated compounds (PFCs) suchas perfluorooctanesulfonate (PFOS) and perfluorooctanoicacid (PFOA) in surface water, comparatively little has beenpublished on method performance, and the environmentaldistributionof thesematerialsremainspoorlydescribedworldwide.In this study, an existing method was improved and appliedin a large-scale evaluation of the Upper Mississippi River Basin,one of the largest watersheds in the world. Samples werecollected in 2008 in an effort that involved multiple sample sitesand collection teams, long-range transport, and storage ofup to 4 weeks before analysis. Ninety-four percent of the resulting177 samples had quantifiable PFC concentrations, with 80%of the individual target compounds below 10 ng/L. The mostabundant PFCs were perfluorobutanoic acid (C4; 77% above thelimit of quantitation, LOQ), perfluorooctanoic acid (C8; 73%),perfluorooctanesulfonate (PFOS; 71%), perfluorohexanoic acid(C6; 70%), and perfluoroheptanoic acid (C7; 69%), with theremaining target compounds occurring above the LOQ in lessthan 50% of the samples. The highest concentrations recordedinclude C4 at 458 ng/L, PFOS at 245 ng/L, and C8 at 125 ng/L,suggesting various point source inputs within the Basin.
IntroductionIn the past decade, a number of studies have been conductedto help characterize the distribution of perfluorinatedcompounds (PFCs) in surface water resources worldwide.The PFCs are fully fluorinated alkyl compounds that havebeen used along with their polyfluorinated precursor ma-terials in numerous applications, including stain- andmoisture-repellent surface coatings for carpets, paper,upholstery, and textiles; firefighting foams; cosmetics; lu-bricants; and the synthesis of various polymeric materials(1). Many of these compounds are extremely resistant to
degradation, leading to their presence in environmental andbiological media worldwide (2-4). While the routes of humanexposure remain poorly characterized, many studies havemeasured PFCs in the serum of individuals in the generalpopulation of industrialized countries at concentrations inthe nanograms per milliliter range (5). At the same time, anincreasing number of studies with laboratory animals havedocumented the toxicity of some of the PFCs (4). Recentstudies have suggested that some of the PFCs may be currentlydeclining in human serum (6) as a result of voluntaryreductions in production, emissions, and product contentby major manufacturers in some parts of the world (7).However, very little is known about sources, fate, andtransport of the PFCs in the environment, making it verydifficult to prioritize human exposure routes and assesspotential risks.
Contaminated water sources have been consistentlyreported as playing a central role in human exposure. In oneof the first investigations of PFCs in surface and drinkingwater, Saito et al. (8) documented that elevated PFCs in theblood of the residents of a large metropolitan region in Japanwas likely due to consumption of contaminated drinkingwater. Emmett et al. (9) subsequently reported on a situationin the United States where median PFOA blood levels inresidents living near a major fluorochemical productionfacility were approximately 100 times higher than controls,with the consumption of contaminated well water being themost important exposure route determined. Most recently,a series of studies in Germany (10, 11) has documented thatland application of PFC-contaminated sludge in the RhineRiver drainage basin resulted in elevated PFC concentrationsin surface water, drinking water, and the blood of residentswho consumed this water.
The U.S. Environmental Protection Agency (EPA) hasrecently issued provisional health advisories for PFOA andPFOS in drinking water (12). While it has been shown thatPFCs can be removed from drinking water with activatedcharcoal, this treatment option is not common and it requiresconstant monitoring because charcoal becomes saturatedrelatively quickly (10, 13). Moreover, studies of wastewatertreatment plants (WWTP) report that PFCs are not efficientlyremoved by conventional treatment, with WWTP effluentsoften having higher concentrations of PFCs than processinput water (14, 15). Because it is common for treatedwastewater to make up a large proportion of the drinkingwater source intake for communities downstream, themeasurement of surface water for potential contaminationbecomes essential for the evaluation of potential humanexposures.
Despite numerous efforts to develop robust sampling andanalytical methods for the PFCs in many matrices, theperformance of these methods is often poorly characterized,and agreement between laboratories has only recently begunto improve (16). Given the unique chemical properties of thePFCs and the comparatively small number of studies thatdescribe useful assay performance data, it remains importantto monitor and report conventional quality control measuressuch as accuracy, precision, and recovery. With larger studiesthat may include complex study designs and multiple fieldteams, it also becomes important to evaluate the potentialloss of analytes during long-term storage and long-rangetransport; possible contamination during sampling andanalytical procedures; and the potential for a wide range ofsample matrix contaminants to interfere with sample prepa-ration and liquid chromatography-tandem mass spectrom-etry (LC/MS/MS) analysis.
* Address correspondence to this author at U.S. EnvironmentalProtection Agency, Mail Drop E205-04, Research Triangle Park,NC 27711; phone: 919-541-0551; fax: 919-541-0905; e-mail:[email protected].
† National Risk Management Research Laboratory, U.S. EPA.‡ National Exposure Research Laboratory, U.S. EPA.§ National Institute of Standards and Technology.
Environ. Sci. Technol. 2010, 44, 4103–4109
10.1021/es100382z 2010 American Chemical Society VOL. 44, NO. 11, 2010 / ENVIRONMENTAL SCIENCE & TECHNOLOGY 9 4103
Published on Web 05/04/2010

In this study, a method that was previously developed inour laboratory (17) was improved for use in a large-scalemonitoring effort that required sample collection from abroad geographical area, a number of different samplecollection teams, long-range transport, and storage of up to4 weeks before samples were processed. This method wasapplied in an evaluation of PFCs in the Upper MississippiRiver Basin, thus providing preliminary information aboutPFC concentrations in a large area of the continental UnitedStates.
Experimental SectionStandards and Reagents. Potassium salts of perfluorobu-tanesulfonate (PFBS, 98% purity) and perfluorohexane-sulfonate (PFHS, 93%) were provided by 3M Company (St.Paul, MN). The potassium salt of perfluorooctanesulfonate(PFOS, 98%) was purchased from Fluka (Sigma-Aldrich, St.Louis, MO). Perfluorobutanoic acid (C4, 98%), perfluoro-pentanoic acid (C5, 98%), and perfluorodecanesulfonate(PFDS, 98%) were obtained from Wellington Laboratories(Guelph, Ontario, Canada). Perfluorohexanoic acid (C6, 97%),perfluoroheptanoic acid (C7, 99%), perfluorooctanoic acid(C8 or PFOA, 96%), perfluorononanoic acid (C9, 97%), andperfluorodecanoic acid (C10, 98%) were purchased fromSigma-Aldrich (St. Louis, MO). Perfluoroundecanoic acid(C11, 96%), and perfluorododecanoic acid (C12, 96%) werepurchased from Oakwood Products (West Columbia, SC).Mass-labeled standards including sodium [1,2,3,4-13C4]-perfluorooctanesulfonate (MPFOS), 18O2-labeled sodium perf-luorohexanesulfonate (MPFHS), [1,2,-13C2]perfluorohexanoicacid (MC6), and [1,2-13C2]perfluoroundecanoic acid (MC11)were obtained from Wellington Laboratories (Guelph, On-tario, Canada). 13C8-labeled PFOA (MPFOA) was purchasedfrom Cambridge Isotope Laboratories (Andover, MA).
Original Method. This laboratory initially developed asampling and analysis method for surface water that wasapplied in a study where samples were generally collectedand processed within 24 h (17). In 2007, a series of pilot-scale studies was conducted to determine if this methodcould be used in situations where long-range sampletransport and lengthy sample storage times would benecessary. Results (not shown) from this evaluation indicatedthat (1) in the time it took to ship the samples from the fieldsite to the analytical laboratory (1 week or longer), ap-proximately 20% of the samples developed so much bacterialand/or algal growth that they could not pass through theinitial glass fiber filtration or solid-phase extraction (SPE)cleanup steps; (2) the recoveries of the target compounds inthe travel spikes ranged from 16% to 48%, suggesting thatanalytes may have adsorbed onto the interior surface of thesample collection bottle; and (3) trace-level LC/MS/MSanalysis of many of the samples was affected by varyingamounts of matrix interference causing ion suppression orenhancement by as much as 200%, indicating that SPEcleanup was insufficient. A number of small-scale experi-ments lead to the following tentative solutions to theseproblems: (1) 5 mL of 35% nitric acid was added to all 1 Lsamples immediately after collection to suppress biologicalactivity; (2) at the time of analysis, sample bottles werethoroughly rinsed with 10 mL of methanol to recoveradsorbed material, and the rinsate was combined with thefiltered sample before further processing; and (3) to helpovercome matrix interferences, a weak anion-exchange(WAX) SPE cartridge was used to provide a better cleanupwhile also retaining the shortest acids on the target list (eC6acid). In addition, because the PFCs appeared to focus at thehead of the cartridge, samples were eluted via a simple back-flush technique with a mixture of methanol/methyl tert-butylether (MTBE) to help minimize coeluting interferences. With
these improvements in place, the modified method was usedin the 2008 study as described below.
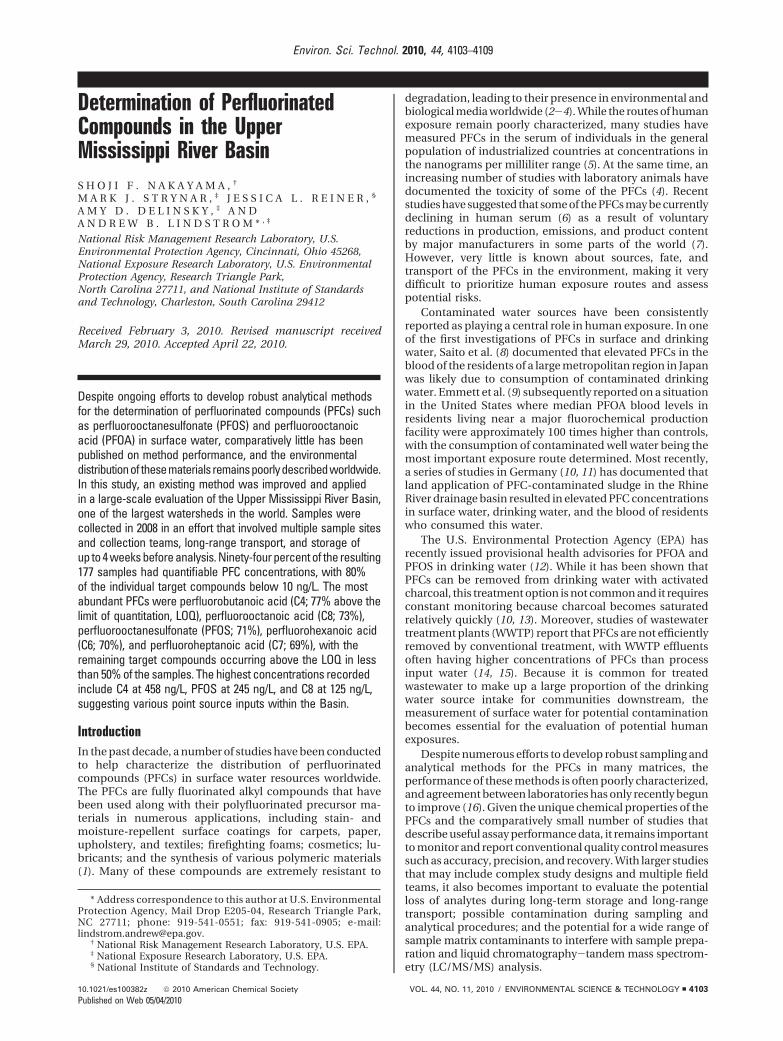
Water Collection. Samples (n ) 177) were collected from88 sampling sites between March and August 2008 from theUpper Mississippi River Basin and a portion of the MissouriRiver Basin (Figure 1) by member agencies of the UpperMississippi River Basin Association (UMRBA). Seventy-twosamples were collected by the Minnesota Pollution ControlAgency, 33 by the Wisconsin Department of Natural Resources,49 by the Illinois Environmental Protection Agency, and 23 bythe U.S. EPA Region 7 Water Quality Monitoring Team inconsultationwiththeIowaandMissouriDepartmentsofNaturalResources. The Upper Mississippi River Basin is one of thelargest river basins in the United States, including large partsof the states of Illinois, Iowa, Minnesota, Missouri, andWisconsin (18). This river basin consists of the upper half of theMississippi River (∼2000 km), 12 major tributaries includingthe Minnesota, Wisconsin, Iowa, Illinois, and Missouri Rivers,and many other streams, which sum up to approximately 50,000km. Approximately 30 million residents depend on surface andgroundwater resources from the Mississippi River Basin tosupply their drinking water. Sampling locations were chosenby each of the participating agencies with the primary intentionof providing preliminary PFC data in these individual regions.Sample sites were coded as follows: river abbreviation/stateabbreviation-sample number (smaller numbers are closer tothe headwaters). In some cases, sites were resampled onmultiple occasions. For each sampling event, a shippingcontainer holding approximately 6 empty precleaned (methanol-rinsed) 1-L high-density polyethylene (HDPE) bottles (ThermoFisher Scientific, Rochester, NY) and one travel spike samplewas sent from the analytical laboratory to the field crew forcollection. Surface water was collected by hand approximately15-30 cm beneath the surface of the water, and samples werepreserved by adding 5 mL of 35% nitric acid (EP ScientificProducts, Miami, OK). Samples were then shipped at ambienttemperature via a commercial freight carrier to the analyticallaboratory, where they were stored at room temperature andanalyzed within 4 weeks.
Quality Assurance Samples. For each sampling event,a 1-L sample containing deionized water that was spikedwith a PFC mixture (final concentration being 50 ng/L forall target analytes) and nitric acid preservative and wasshipped to the field as a travel spike (F-QC) along with theempty precleaned sample collection bottles. The F-QCswere shipped back to the laboratory with the field samplesand analyzed at the same time to evaluate analyte loss orcontamination during sample transport and storage. Fieldpersonnel were asked to collect at least 10% of the samplesin duplicate. In-house laboratory spikes (L-QCs) were alsoprepared at the time of analysis to assess the performanceof the assay. At least two solvent blanks and matrix blanks(deionized water with internal standards that went throughthe whole extraction process) were analyzed with everyanalytical batch.
Sample Preparation and Solid-Phase Extraction. Watersamples were filtered with GF/A glass fiber filter cups(Whatman Inc., Piscataway, NJ) into a polypropylene vacuumflask (Thermo Fisher Scientific, Rochester, NY). Filter cupswere determined to be PFC-free and did not retain targetanalytes. Filtered solids were also tested and found to containonly negligible amounts of PFCs (<0.5 ng/L). The originalemptied sample container was then thoroughly rinsed with10 mL of methanol and the filtered water was poured backinto the original container, thus combining the filtered sampleand the methanol rinse. The samples were then spiked with100 µL of a 0.10 ng/µL solution (10 ng) of the internalstandards (MPFHS, MPFOS, MC6, MC8, and MC11) anddivided into two 500-mL aliquots. Oasis WAX Plus (225 mg)cartridges (Waters Corp., Milford, MA) were conditioned with
4104 9 ENVIRONMENTAL SCIENCE & TECHNOLOGY / VOL. 44, NO. 11, 2010
10 mL of methanol followed by 10 mL of deionized water,each at a flow rate of 10 mL/min. A 500-mL aliquot of eachwater sample was loaded onto the preconditioned cartridgesat a flow rate of 10 mL/min with a positive-pressure pumpsystem (Sep-Pak concentrator, Waters Corp.). The remaining500-mL sample aliquot was stored at room temperature incase additional analysis was required. The cartridges werewashed with 10 mL of 25 mM sodium acetate buffer (pH 4)followed by 10 mL of methanol and were dried completelyby purging with high-purity nitrogen gas for 10 min. Forsample elution, the cartridges were set up in the vacuummanifold in an inverted direction (back-flush technique) andthe target analytes were eluted from the cartridge with 2 mLof ammonium hydroxide (NH4OH, 28% in water)/methanol/methyl tert-butyl ether (MTBE) solution (v/v/v 1:2:27) at aflow rate of 1 mL/min. The eluate was reduced in volume to
500 µL with TurboVap II nitrogen evaporator at 35 °C (CaliperLife Sciences, Hopkinton, MA). A 100 µL aliquot of theconcentrated eluate was mixed with 100 µL of 2 mMammonium acetate buffer (pH 6.5) to approximate the initialmobile-phase conditions.
Instrumental Analysis. Samples were analyzed on aWaters Acquity ultraperformance liquid chromatographysystem coupled with a Waters Quatro Premier XE triple-quadrupole mass spectrometer (UPLC-MS/MS; Waters Corp.).In order to reduce PFC background in the instrument, thepoly(tetrafluoroethylene) (PTFE) tubing was replaced withpolyether ether ketone (PEEK) material. To further reduceinstrumental contamination, a C18 hold-up column (pro-totype provided by Waters and now available as a PFC kitfrom Waters) was installed on the aqueous solvent line justbefore the mixing chamber. A 20 µL aliquot of each sample
FIGURE 1. Sampling locations colored by sampling agencies.
VOL. 44, NO. 11, 2010 / ENVIRONMENTAL SCIENCE & TECHNOLOGY 9 4105

was injected onto an Acquity UPLC BEH C18 Column (1.7µm, 1.0 × 50 mm; Waters Corp.) that was maintained at 50°C. Separation was achieved by use of a gradient mobilephase of 2 mM ammonium acetate buffer and methanol ata flow rate of 500 µL/min (Table S1, Supporting Information).
Electrospray negative ionization (ESI) was used with themass spectrometer operating in the multiple-reaction-monitoring (MRM) mode (Table S1, Supporting Information).Ionization and collision cell parameters were optimized foreach individual analyte. One MRM transition was used forquantitation and another transition was used for confirma-tion for each analyte (Table S2, Supporting Information).
Quantitation. The instrumental quantitation limit (IQL),based on methanolic standards and a 10:1 signal-to-noiseratio, was approximately 0.5 pg on column for all targetcompounds. By use of the same criteria and a series of fortifieddeionized water samples, the limit of detection (LOD) wasdetermined to be 0.02 ng/L. Six-point calibration curves wereprepared for each analytical batch in the range of 0.2-500ng/L, but consistent measurements for all compounds givingprecision of(15% and accuracy of 100%(20% were obtainedbetween 1.0 and 500 ng/L, making this the reporting range.The lower limit of quantitation (LOQ) was set to be 1.0 ng/L.Quantitation was performed with MassLynx 4.1 (WatersCorp.) using a linear 1/x weighted regression fit with acoefficient of correlation greater than 0.99. Data wereconsidered reportable if the ion ratio (quantifier/confirma-tory) for samples was within 70-130% of the average ionratio for calibration standards. Additionally, data from ananalytical batch were considered acceptable only if blankswere below the IQL and the QC samples were within (25%of their theoretical concentrations.
Statistical Analyses. All statistical analyses were per-formed with R-2.9.0 software (19). When duplicate sampleswere collected, mean values were reported and used in allanalyses. Summary statistics used LOQ/sqrt(2) for sampleslisted as <LOQ.
Results and DiscussionQuality Control. The performance characteristics of theimproved method for remote sampling and long-rangetransport are presented in Table S3, Supporting Information.All 16 of the travel spike samples prepared at the 50 ng/Llevel had mean recoveries of 91.7%-108% for all compounds,with relative standard deviations (RSD)e15%. The laboratoryspike samples prepared at the 5 and 50 ng/L levels had similaraccuracy and precision, with mean recoveries ranging from89.3% to 105%, and all RSDs being e14%. Recoveries of
internal standards ranged from 75% to 125%. None of theblanks (n ) 16) had quantifiable PFCs. Overall, the averagepercent relative difference for duplicate field samples (n )31) was 12% (range 0.1%-134%), with most of this variationoccurring in cases where one sample was below the LOQ.The average relative percent difference for duplicate PFOSand PFOA measurements above10 ng/L was 13.3% and 3.7%,respectively.
Distribution of PFCs in the Basin. Table 1 shows summarystatistics for all measurements made in this study. At leastone target compound was above the LOQ in 94% of thesamples collected, with 80% of all of the individual compoundmeasurements being below 10 ng/L. The most frequentlymeasured compounds and the percentage above the LOQwere C4 (77%), C8 (73%), PFOS (71%), C6 (70%), and C7(69%). The remaining target compounds occurred above theLOQ in less than 50% of the samples. Median concentrationsranged from no detection at all for PFDS to a high of 3.01ng/L for PFOS. While compound measurements in mostsamples were comparable to low-level “background” con-centrations reported in previous studies (<10 ng/L) (8, 17, 20),samples occasionally had elevated levels. The highest indi-vidual concentrations recorded include C4 at 458 ng/L, PFOSat 245 ng/L, and C8 at 125 ng/L, suggesting the influence ofpoint source inputs at some specific sampling locations. Table2 summarizes the 10 highest C8, C4, and PFOS concentrationsrecorded during this investigation.
WWTPs and PFCs. In the spring of 2007, the MinnesotaPollution Control Agency (MPCA) conducted systematicmeasurements of PFCs in influent, effluent, and sludge atwastewater treatment plants (WWTPs) across the state ofMinnesota (21). The MPCA reported that multiple PFCs weremeasured in WWTP effluents from plants located in largerurban areas, with these compounds being attributed to localsources such as refineries, airports, and PFC production sites,which discharged waste to these WWTPs (21). The currentstudy confirms these earlier findings, as, for example, thesamples collected below the Metropolitan WWTP (MS/MN-19; Figure S1, Supporting Information) and adjacent to amajor chemical manufacturer showed higher PFC concen-trations than samples collected upstream of this area (MS/MN-18). Specifically, in August at MS/MN-19, C8 was 23.2( 0.9 ng/L (mean ( SD); C4, 30.9 ( 4.7 ng/L; PFOS, 24.0 (7.1 ng/L; PFHS, 13.1 ( 0.4 ng/L; and PFBS, 11.9 ( 4.4 ng/L.Upstream at MS/MN-18, C8 was 8.69 ( 1.03 ng/L; C4, 11.9( 1.2 ng/L; PFOS, 13.2 ( 0.6 ng/L; PFHS, 5.65 ( 0.47 ng/L;and PFBS, 3.14 ( 0.57 ng/L.
TABLE 1. Statistical Summary of Measurements
N % > LOQa % NDb medianc 95% CId for median P90e P95f P99g max
C12 173 9.8 9.8 0.71 0.71-0.71 0.71 2.33 10.9 24.7C11 173 6.4 21 0.71 0.71-0.71 0.71 1.14 23.6 29.1C10 173 14 12 0.71 0.71-0.71 1.30 2.54 14.3 42.0C9 173 29 13 0.71 0.71-0.71 3.33 4.51 8.84 72.9C8 173 73 2.9 2.07 1.46-2.54 11.9 19.8 36.5 125C7 173 69 5.8 2.16 1.56-2.46 6.91 8.89 11.5 90.2C6 173 70 1.2 1.59 1.34-1.83 7.07 12.9 28.4 53.4C5 167 41 34 0.71 0.71-0.71 6.03 9.27 12.4 31.5C4 167 77 16 2.73 2.18-3.42 27.9 47.9 357 458PFDS 158 0 61PFOS 173 71 2.9 3.01 2.03-3.78 17.0 27.2 147 245PFHS 173 40 11 0.71 0.71-0.71 5.11 6.79 38.7 169PFBS 173 43 23 0.71 0.71-1.00 4.21 10.4 31.2 84.1a Percentage of samples above limit of quantitation (LOQ). LOQ ) 1.0 ng/L. b Percentage of samples not detected (below
limit of detection, LOD). LOD ) 0.02 ng/L. c For calculation of median, values of LOQ/sqrt(2) ) 0.707 and LOD/sqrt(2) )0.014 were assigned for LOQ and ND, respectively. d 95% confidence interval. e 90th percentile. f 95th percentile. g 99thpercentile.
4106 9 ENVIRONMENTAL SCIENCE & TECHNOLOGY / VOL. 44, NO. 11, 2010

Also, samples collected on the Mississippi River at theoutfall of the Brainerd WWTP [MS/MN-8 (August); FigureS1, Supporting Information], had PFOS and PFBS at 226 (28 and 65.5 ( 26.4 ng/L, respectively (Table S4, SupportingInformation). During the same sample period, severalsamples collected upstream of this point (MS/MN-5-7)indicated typically low concentrations of all compounds (<10ng/L), suggesting that the WWTP was a point source of thesePFCs in this area. An earlier study by the MinnesotaDepartment of Health (MDH) found that until September2007, a local chrome-plating plant used a mist suppressantreagent containing 1%-7% “organic fluorosulfonate” (21).The results of the current study indicate that PFC materialwas still present in this area, perhaps as a residual from theplating plant or possibly from other industries. It should alsobe noted that a sample collected on the same day just 200 mdownstream of the WWTP outflow site (MS/MN-9) did nothave elevated concentrations of the target compounds (<LOQfor most measurements), suggesting that the volume of flowat this point in the river water diluted upstream inputs to“background” levels. Moreover, this also suggests thatidentification of point source inputs may require intensivesampling to pinpoint their specific origins.
Additional evidence of the potential impact of WWTPscame from Wisconsin samples collected at the outfalls of theLa Cross and Prairie du Chien WWTPs (MS/WI-7 and -12;Figure S2, Supporting Information). Both sites had elevatedPFCs, with the Prairie du Chien site (MS/WI-12) having PFOSat 61.7 ng/L and PFHS at 101 ng/L (Table S5, SupportingInformation). Evaluation of the operations of the varioussources that make discharges to these plants would be helpfulfor determining why these samples were elevated.
Historical Firefighting Activity. Samples were collectedfrom a waterway near Duluth International Airport (TR/MN-1; Figure S1, Supporting Information), despite the fact thatit was not part of the Mississippi River Basin, because ofsuspected contamination related to the historic use offirefighting foams. Initial samples from this site collected inApril exhibited notably elevated levels of some of the PFCswith C8 at 50.5 ng/L; C6, 53.4 ng/L; PFOS, 124 ng/L; PFHS,169 ng/L; and PFBS, 19.2 ng/L (Table S4, SupportingInformation). To confirm the initial test results, this locationwas resampled in triplicate in July. Results again indicatedelevated levels of the same PFCs, with concentrations of C8at 92.1 ( 3.1 ng/L; C6, 131 ( 8 ng/L; PFOS, 287 ( 15 ng/L;PFHS, 367 ( 3 ng/L; and PFBS, 41.7 ( 0.6 ng/L (Table S4,Supporting Information). The possible link to the use offirefighting foams is anecdotal but consistent with previousreports implicating firefighting activities at airports (17, 22).
Differing Results from Samples Collected in Nearby Loca-tions. Samples were collected from the same pool (MS/MN-19 and MS/WI-1; below Lock and Dam 2; Figures S1 and S2,Supporting Information) in the Mississippi River but they
were separated by 1.3 km distance. MS/MN-19 and MS/WI-1 were sampled on August 20 and 13 in 2008, respectively,on which days the flow rates were 72 and 130 m3/s,respectively. At low flow, C8 was 23.8 ng/L (MS/MN-19), butwhen the flow was almost 2 times higher, the concentrationincreased by a factor of more than 5 to 125 ng/L (MS/WI-1).In contrast, PFOS concentrations were very similar to eachother despite the increased flow: 29 ng/L for MS/MN-19 and27 ng/L for MS/WI-1. The increased amount of PFOA in theWisconsin sample may be due to vertical mixing or turbulentresuspension of previously deposited materials in sedimentssince the sample was collected at the immediate outflow ofthe Lock and Dam 2. All of the carboxylic acids from C6 toC11 exhibited similar severalfold increases during high flowconditions, but PFOS and the other sulfonates remained atroughly the same concentrations. This may indicate animportant difference in how these two classes of PFCs aretransported in the environment.
C4 Elevation. The highest PFC concentrations measured inthis survey are the C4 (also known as PFBA) levels in samplesfrom the Mississippi River in the vicinity of Cordova, IL.Upstream of this area, C4 was found in the <LOQ to 10 ng/Lconcentration range, except for samples from below MississippiRiver Lock and Dam 2 in Minnesota (MS/MN-18 and MS/MN-19) collected in August (11.0-34.2 ng/L) in an area where ahistorical C4 input source has been identified (21). In Illinois,however, C4 clearly becomes the most prominent compoundmeasured in the Basin. For instance, at MS/IL-3 (Figure S3,Supporting Information), C4 was measured at 325 ng/L inMarch, 420 ng/L in April, and 458 ng/L in May 2008 (Table S6,Supporting Information). It is interesting to note that the waterconcentrations here remain fairly consistent, despite increasingtotal flow estimates more than 3 times higher. This may suggestthat the samples were collected at a point within the plume ofa discharge and were not well mixed, or it may imply a larger-scale area source. Some 30 km downstream near Rock Island,IL (MS/IL-4), concentrations of C4 were about 2-4 times lowerbut still substantially elevated in comparison to other areas inthis survey, confirming the presence of a major source in thisregion.
Near Chicago. Some of the samples collected in the upperreaches of the Illinois River watershed near Chicago hadrelatively high PFC concentrations (i.e., C6, C8, and PFOS;Table S6). Samples from where the Cal Sag Channel meetsthe Chicago Ship and Sanitary Canal (IL/IL-1; Figure S3,Supporting Information) had the highest PFOS levels in thisregion, with concentrations ranging from 17.6 to 50.8 ng/L.Both of these waterways are extensively polluted with asubstantial portion of their flows derived from WWTP effluent.Further evaluation of this area would be helpful in deter-mining specific sources in this complex urban environment.
Missouri and Iowa Samples. Samples collected in Missouriand Iowa consistently had some of the lowest PFC measure-
TABLE 2. Sites with the 10 Highest Concentrations for C8, C4, and PFOS
site month C8 (ng/L) site month C4 (ng/L) site month PFOS (ng/L)
MS/WI-1 Aug 125 MS/IL-3 May 458 TR/MN-1a Jul 287TR/MN-1a Apr 50.5 MS/IL-3 Apr 420 MS/MN-8 Aug 226MS/WI-12b Aug 31.0 MS/IL-3 Mar 325 TR/MN-1a Apr 124MS/WI-7b Aug 30.7 MS/IL-4 Mar 161 MS/WI-12b Aug 61.7IL/IL-1 Apr 26.9 MS/IL-4 Apr 160 IL/IL-1 May 50.8TR/MN-2 Aug 23.2 MS/IL-5 May 158 MS/WI-4 Aug 37.1IL/IL-2 Apr 23.0 MS/IL-4 May 73.9 MS/WI-2 Aug 27.9TR/WI-4 Aug 18.0 TR/WI-4c Aug 48.7 IL/IL-1 Apr 27.4IL/IL-3 Apr 16.5 MS/IL-9 Mar 46.7 MS/WI-1 Aug 27.0IL/IL-2 May 16.3 MS/IL-7 Aug 47.6 TR/MN-2 Aug 24.0a Collected from a creek to the Wild Rice Lake Reservoir that potentially receives a runoff from a historical fire-training
site at the Duluth International Airport. This stream is not a part of the Upper Mississippi River Basin but within theCloquet River Watershed. b Collected at wastewater outfall. c Well water.
VOL. 44, NO. 11, 2010 / ENVIRONMENTAL SCIENCE & TECHNOLOGY 9 4107

ments recorded in this survey. For most of the target analytes,more than 90% of the sites showed concentrations belowLOQ. PFOS was found to be above the LOQ at 78% of thesample sites, but the only notable concentrations were 11.0ng/L and 15.2 ng/L from sites MO/MO-3 and TR/MO-1,respectively (Figure S4, Supporting Information) in thevicinity of Kansas City.
Mass Flux Estimation. As indicated in Figure 2, therewere many sampling points with localized increases in PFCconcentrations in the Basin. The overall trend was for theseincreases to be dissipated shortly downstream, suggestingsmall point source inputs relative to the ever-increasingvolume of the River. Figure 2 also indicates that theconcentrations of C8, PFOS, and PFBS are generally flat afterthe midportion of the Upper Mississippi River despite thecontinuous increase in flow. Since two-dimensional samplingwas not performed across the River, a true mass flux cannotbe calculated. However, it is still useful to calculate provisionaltotal mass flow estimates in order to help describe large-scale trends in transport. Figure S5 (Supporting Information)shows the estimated mass flux of C4, C8, PFBS, and PFOSin the main stream of the Upper Mississippi River in May2008. At the MS/IL-3 site near Cordova, IL, the largest localincrease occurred for C4, with large increases in C8, PFBS,and PFOS also being apparent. Calculations of the C4 fluxstabilize as the input from the Cordova area becomes morehomogeneous downstream, and it is interesting to note thata total loading of approximately 20 kg/day is maintainedeven after the confluence of the Ohio and Missouri Rivers.This suggests that there are no additional sources of C4 ofsimilar magnitude in the lower reaches of the basin and thatthis single source dominates C4 in this section of theMississippi River. The overall increase in all of the PFCs fromthe Minneapolis metropolitan area in Minnesota to thesouthern boundary of the Basin clearly suggests an increasingnumber of sources proceeding downstream. Several possibleexplanations of this observation can be considered: (1)multiple PFC discharges from private or public WWTP alongthe River and tributaries, (2) surface water runoff from cities
and farm fields reflecting area source inputs, and (3)groundwater input from agricultural areas. The importanceof any of these potential sources is unknown and would bea good subject of further research.
The modified method for 13 PFCs in surface water usedin this study showed acceptable performance characteristics,making it useful for large-scale monitoring surveys thatrequire long-range transport and relatively long-term storagewithout appreciable loss of target compounds. The resultsindicate multiple input sources and a continuous increasein PFC loading as the River proceeds through the Basin. Manylocalized areas with elevated PFC levels have been identified,indicating that PFC inputs are common and widespread.The relatively high concentration of the C4 acid in some ofthese samples likely reflects a shift toward lower molecularweight PFCs made by United States industries. These dataalso support the hypothesis that WWTPs can be sources ofPFCs.
AcknowledgmentsWe express great appreciation for Dave Hokanson of UpperMississippi River Basin Association, who coordinated thefield sampling. We also appreciate the field personnel,especially Laura Solem and Mark Ferry of Minnesota PollutionAgency; John Sullivan of Wisconsin Department of NaturalResources; Bill Ettinger, Joe Marenick, and Scott Shasteen ofIllinois Environmental Protection Agency; and Larry Shepardand Gary Welker of U.S. EPA Region 7 Water QualityMonitoring Team. This study was conducted with assistancefrom Cooperative Research and Development Agreements(CRADAs) with Waters Corporation (392-06), Wako PureChemical Industries, Ltd. (399-06), and GL Sciences, Inc. (407-07). This research was also supported in part by an appoint-ment to the Research Participation Program at the NationalExposure Research Laboratory administered by the Oak RidgeInstitute for Science and Education. Disclaimer: The UnitedStates Environmental Protection Agency through its Officeof Research and Development funded and managed theresearch described here. It has been subjected to Agency
FIGURE 2. Concentrations for perfluorobutanoic acid (C4 or PFBA), perfluorooctanoic acid (C8 or PFOA), perfluorobutanesulfonate(PFBS), and perfluorooctanesulfonate (PFOS) in the Upper Mississippi River (0 km point at the confluence of the Mississippi andOhio Rivers). Three-day averaged flow is depicted as the dotted line, with flow measured in cubic meters per second × 103.Confluence of other rivers at markers: (1) Minnesota River, (2) Wisconsin River, (3) Illinois River, and (4) Missouri River.
4108 9 ENVIRONMENTAL SCIENCE & TECHNOLOGY / VOL. 44, NO. 11, 2010

review and approved for publication. Mention of trade namesor commercial products does not constitute endorsementor recommendation for use.
Supporting Information AvailableAdditional method description; tables showing UPLC-MS/MS conditions, mass transitions of each analyte, methodperformance, and raw data for all samples; and figuresshowing sampling sites and estimated mass flux. This materialis available free of charge via the Internet at http://pubs.acs.org.
Literature Cited(1) Lewandowski, G.; Meissner, E.; Milchert, E. Special applications
of fluorinated organic compounds. J. Hazard. Mater. 2006, 136,385–391.
(2) Houde, M.; Martin, J. W.; Letcher, R. J.; Solomon, K. R.; Muir,D. C. Biological monitoring of polyfluoroalkyl substances: Areview. Environ. Sci. Technol. 2006, 40, 3463–3473.
(3) Fujii, S.; Polprasert, C.; Tanaka, S.; Lien, N. P. H.; Qiu, Y. NewPOPs in the water environment: Distribution, bioaccumulationand treatment of perfluorinated compounds - a review paper.J. Water Supply: Res. Technol.sAQUA 2007, 56, 313–326.
(4) Lau, C.; Anitole, K.; Hodes, C.; Lai, D.; Pfahles-Hutchens, A.;Seed, J. Perfluoroalkyl acids: A review of monitoring andtoxicological findings. Toxicol. Sci. 2007, 99, 366–394.
(5) Fromme, H.; Tittlemier, S. A.; Volkel, W.; Wilhelm, M.; Twardella,D. Perfluorinated compounds s exposure assessment for thegeneral population in western countries. Int. J. Hyg. Environ.Health 2009, 212, 239–270.
(6) Olsen, G. W.; Mair, D. C.; Church, T. R.; Ellefson, M. E.; Reagen,W. K.; Boyd, T. M.; Herron, R. M.; Medhdizadehkashi, Z.;Nobiletti, J. B.; Rios, J. A.; Butenhoff, J. L.; Zobel, L. R. Declinein perfluorooctanesulfonate and other polyfluoroalkyl chemicalsin American Red Cross adult blood donors, 2000-2006. Environ.Sci. Technol. 2008, 42, 4989–4995.
(7) U.S. Environmental Protection Agency. 2010/2015 PFOAstewardship program. http://www.epa.gov/oppt/pfoa/pubs/stewardship/index.html (Accessed on 16 March 2010).
(8) Saito, N.; Harada, K.; Inoue, K.; Sasaki, K.; Yoshinaga, T.; Koizumi,A. Perfluorooctanoate and perfluorooctane sulfonate concen-trations in surface water in Japan. J. Occup. Health 2004, 46,49–59.
(9) Emmett, E. A.; Shofer, F. S.; Zhang, H.; Freeman, D.; Desai, C.;Shaw, L. M. Community exposure to perfluorooctanoate:Relationships between serum concentrations and exposuresources. J. Occup. Environ. Med. 2006, 48, 759–770.
(10) Skutlarek, D.; Exner, M.; Farber, H. Perfluorinated surfactantsin surface and drinking waters. Environ Sci Pollut Res 2006, 13,299–307.
(11) Holzer, J.; Goen, T.; Rauchfuss, K.; Kraft, M.; Angerer, J.;Kleeschulte, P.; Wilhelm, M. One-year follow-up of perfluori-nated compounds in plasma of German residents from Arnsbergformerly exposed to PFOA-contaminated drinking water. Int.J. Hyg. Environ. Health 2009, 212, 499–504.
(12) Provisional health advisories for perfluorooctanoic acid (PFOA)and perfluorooctane sulfonate (PFOS); U.S. EnvironmentalProtection Agency: Washington, DC, 8 January 2009.
(13) Takagi, S.; Adachi, F.; Miyano, K.; Koizumi, Y.; Tanaka, H.;Mimura, M.; Watanabe, I.; Tanabe, S.; Kannan, K. Perfluorooc-tanesulfonate and perfluorooctanoate in raw and treated tapwater from Osaka, Japan. Chemosphere 2008, 72, 1409–1412.
(14) Loganathan, B. G.; Sajwan, K. S.; Sinclair, E.; Senthil Kumar, K.;Kannan, K. Perfluoroalkyl sulfonates and perfluorocarboxylatesin two wastewater treatment facilities in Kentucky and Georgia.Water Res. 2007, 41, 4611–4620.
(15) Yu, J.; Hu, J.; Tanaka, S.; Fujii, S. Perfluorooctane sulfonate (PFOS)and perfluorooctanoic acid (PFOA) in sewage treatment plants.Water Res. 2009, 43, 2399–2408.
(16) van Leeuwen, S. P.; Swart, C. P.; van der Veen, I.; de Boer, J.Significant improvements in the analysis of perfluorinatedcompounds in water and fish: Results from an interlaboratorymethod evaluation study. J. Chromatogr. A 2009, 1216, 401–409.
(17) Nakayama, S.; Strynar, M. J.; Helfant, L.; Egeghy, P.; Ye, X.;Lindstrom, A. B. Perfluorinated compounds in the Cape FearDrainage Basin in North Carolina. Environ. Sci. Technol. 2007,41, 5271–5276.
(18) Upper Mississippi River Basin Association. River and basin facts.http://www.umrba.org/index.htm (Accessed on 16 March 2010).
(19) R Development Core Team. R: A language and environment forstatistical computing; R Foundation for Statistical Computing:Vienna, Austria, 2009.
(20) Murakami, M.; Shinohara, H.; Takada, H. Evaluation of waste-water and street runoff as sources of perfluorinated surfactants(PFSs). Chemosphere 2009, 74, 487–493.
(21) Minnesota Department of Health. Perfluorochemicals in Min-nesota. http://www.health.state.mn.us/divs/eh/hazardous/topics/pfcs/index.html (Accessed on 16 March 2010).
(22) Moody, C. A.; Hebert, G. N.; Strauss, S. H.; Field, J. A. Occurrenceand persistence of perfluorooctanesulfonate and other perflu-orinated surfactants in groundwater at a fire-training area atWurtsmith Air Force Base, Michigan, USA. J. Environ. Monitor.2003, 5, 341–345.
ES100382Z
VOL. 44, NO. 11, 2010 / ENVIRONMENTAL SCIENCE & TECHNOLOGY 9 4109