determination of oxatomide in human plasma by high-performance liquid chromatography–electrospray...
TRANSCRIPT
Copyright © 2008 John Wiley & Sons, Ltd. Biomed. Chromatogr. 22: 746–752 (2008)DOI: 10.1002/bmc
746 X. She et al.ORIGINAL RESEARCH ORIGINAL RESEARCH
Copyright © 2008 John Wiley & Sons, Ltd.
BIOMEDICAL CHROMATOGRAPHYBiomed. Chromatogr. 22: 746–752 (2008)Published online 18 March 2008 in Wiley InterScience(www.interscience.wiley.com) DOI: 10.1002/bmc.992
Determination of oxatomide in human plasma byhigh-performance liquid chromatography–electrosprayionization mass spectrometry
Xiaodong She, Lili Wu, Huilin Wei, Weida Liu and Yun Chen*
Department of Pharmacology, Institute of Dermatology, Chinese Academy of Medical Sciences and Peking Union Medical College, Nanjing210042, People’s Republic of China
Received 5 November 2007; accepted 3 December 2007
ABSTRACT: A rapid, sensitive and specific high-performance liquid chromatography–electrospray ionization mass spectrometry(LC-ESI-MS) method has been developed and validated for the determination of oxatomide in human plasma. Flunarizine hydro-chloride was employed as the internal standard (IS). The analytes were chromatographically separated on a Shimadzu Shim-packVP-ODS C18 column (250 × 2.0 mm i.d.) with a mobile phase consisting of methanol and aqueous ammonium acetate solution(10 mM, pH 4.0; 85:15, v/v). Detection was performed on a single quadrupole mass spectrometer using an electrospray ionizationinterface with the selected-ion monitoring (SIM) mode. The method showed excellent linearity (r = 0.9995) over the concentrationrange of 0.5–500 ng/mL with good accuracy and precision. The intra- and inter-batch precisions were within 10% relative standarddeviation. The recoveries were more than 90%. The validated method was successfully applied to a preliminary pharmacokineticstudy of oxatomide in Chinese healthy male volunteers. Copyright © 2008 John Wiley & Sons, Ltd.
KEYWORDS: oxatomide; HPLC-ESI-MS; quantification; pharmacokinetics
*Correspondence to: Yun Chen, Institute of Dermatology, ChineseAcademy of Medical Sciences and Peking Union Medical College,Nanjing 210042, People’s Republic of China.E-mail: [email protected]
Contract/grant sponsor: School of Food Science, Henan Institute ofScience and Technology.Contract/grant sponsor: College of Pharmaceutical Science and Tech-nology, Tianjin University.
INTRODUCTION
Oxatomide (CAS 60607-34-3, 1-[3-[4-(diphenylmethyl)-1-piperazinyl]propyl]-2-benzimidazol-2 (3H)-one) is aneffective antiallergic drug which has been widely usedfor the treatment of diseases mediated by a type Iallergic reaction in the clinical field (Goto et al., 2005).Some pharmacological researches have demonstrated thatoxatomide acts as an H1 antagonist and inhibits severalfunctions of lymphocytes, monocytes, basophils andmacrophages, modulating the release of inflammatorymediators and cytokines such as histamine, leukotriene,arachidonic acid and platelet-activating factor (Maroneet al., 1999; Paulussen et al., 1996, 1998; Patella et al.,1996). These antiinflammatory activities contribute tobeneficial therapeutic effects of the drug in variousallergic and inflammatory disorders, including urticaria(La Rosa et al., 2001), atopic dermatitis (Boccazzi et al.,2001; Duse et al., 1998), allergic rhinitis (Locci and DelGiacco, 1991), conjunctivitis (Ciprandi et al., 1995),otitis media (Tanaka et al., 1995) and bronchial asthma(Giorgi et al., 1998; Chiu et al., 1997).
The therapeutic dose of oxatomide is only 30 mgevery day given orally, which results in a lower concen-tration in the elimination phase, so a sensitive analyticalmethod is needed for its determination in humanplasma. Few high-performance liquid chromatographicmethods employing fluorescence detection have beenestablished for the determination of oxatomide inhuman plasma (Benavenuti et al., 1992; Dani et al.,2002) and rat plasma (Kikuchi et al., 2002). However,the sample preparation and extraction procedures ofthe methods mentioned above are complex and time-consuming. To our knowledge, the quantification ofoxatomide in human plasma using mass spectrometricdetection has not so far been reported. In this paper,we describe a simple, selective and highly sensitivemethod using high-performance liquid chromatographycoupled with electrospray ionization single quadrupolemass spectrometry for the determination of oxatomidein human plasma. The method is validated over theconcentration range of 0.5–500 ng/mL for oxatomide,and it has been successfully applied to a preliminarypharmacokinetic study of oxatomide in healthy maleChinese volunteers.
EXPERIMENTAL
Chemicals. Oxatomide test tablets (batch no. 20061101) andthe oxatomide reference standard (99.98% purity) were suppliedand identified by GZSQ Pharmaceutical Co. Ltd (Longli,

Copyright © 2008 John Wiley & Sons, Ltd. Biomed. Chromatogr. 22: 746–752 (2008)DOI: 10.1002/bmc
Determination of oxatomide in human plasma 747ORIGINAL RESEARCH
China); flunarizine hydrochloride reference standard (internalstandard, 99.5% purity) was supplied and identified byZhengzhou Ruikang Pharmaceutical Co. Ltd (Zhengzhou,China). Methanol was chromatographic grade and was purchasedfrom VWR International Company (Darmstadt, Germany).Other chemicals were all of analytical grade. Water was puri-fied by redistillation before use.
LC-MS instrument and conditions. LC-MS analysis was per-formed on an HPLC-ESI-MS system consisting of a ShimadzuLC-10AD HPLC system equipped with an auto sampler(SIL-20AC) and a single quadrupole mass spectrometer withan ESI interface. Liquid chromatographic separation wasachieved on a Shimadzu Shim-pack VP-ODS C18 (250 × 2.0 mmi.d.) column, which was maintained at 40°C. The mobile phaseconsisting of 85% methanol and 15% (v/v) aqueous ammoniumacetate solution (10 mM, pH4.0) was pumped at an isocraticflow rate of 0.2 mL/min. The total run time was 7.5 min foreach injection.
The ESI source was set at positive ionization mode. The[M + H]+, m/z 427.10, for oxatomide and [M + H]+, m/z405.05, for flunarizine hydrochloride were selected as detect-ing ions, respectively. The MS operating conditions wereoptimized as follows: nebulizer gas rate, 1.5 L/min; CDLtemperature, 250°C; block temperature, 200°C; probe voltage,+ 4.5 kV. The quantification was performed via peak-arearatio. Data acquisition and processing were accomplishedusing Shimadzu LCMSsolution Version 3.30 for the LCMS-2010EV system.
Preparation of stock solutions. Stock solutions of oxatomideand flunarizine hydrochloride (IS) were prepared in methanolafter correcting for purity at the concentration of 1 mg/mL.These solutions were found to be stable for 2 months at 4°C.Working solutions of oxatomide were prepared daily in metha-nol by appropriate dilution to the final concentrations of 10,20, 100 and 200 ng/mL and 1, 2, 4 and 10 μg/mL The stocksolution of flunarizine hydrochloride was further diluted withmethanol to prepare the working internal standard solutioncontaining 1 μg/mL of flunarizine hydrochloride.
Sample preparation. Liquid–liquid extraction was chosenfor the sample preparation. A 0.5 mL aliquot of the collectedplasma sample from a human volunteer was pipetted into a10 mL glass centrifuge tube. The working internal standardsolution (30 μL × 1 μg/mL), sodium hydroxide solution (100 μL× 1 M) and 5.0 mL ethyl ether were added and then werevortexed for 2 min. After centrifugation of the samples at1330g for 10 min at room temperature, the upper organiclayer was transferred to another 10 mL centrifuge tube andevaporated to dryness under a gentle stream of nitrogen gasin a water bath at 40°C. The residues were then redissolvedin 200 μL mobile phase under vortex and centrifuged at20,627g for 8.0 min. Aliquots of 5 μL of the supernatant wereinjected into the LC-MS system.
Standard curves and quality control samples. Calibrationcurves were prepared by spiking blank plasma with theproper volume of one of the above-mentioned working solu-tions to produce the standard curve points equivalent to 0.5(25 μL × 10 ng/mL), 1 (25 μL × 20 ng/mL), 5 (25 μL × 100 ng/
mL), 10 (25 μL × 200 ng/mL), 50 (25 μL × 1 μg/mL), 100(25 μL × 2 μg/mL), 200 (25 μL × 4 μg/mL) and 500 (25 μL ×10 μg/mL) ng/mL of oxatomide. Each sample also contained60 (30 μL × 1 μg/mL) ng/mL of the internal standard. Thefollowing assay procedures were the same as that describedabove. Blank plasma sample (without IS) was also analyzed.
Quality control (QC) samples were prepared by spiking blankplasma with the proper volume of the corresponding standardsolution to produce a final concentration equivalent to low-level(1.0 ng/mL), middle-level (50 ng/mL) and high-level (400 ng/mL)oxatomide with 60 ng/mL of internal standard each. The follow-ing procedures were the same as that described above.
Biomedical method validation. The method validation assayswere carried out according to the United States Food andDrug Administration (FDA) bioanalytical method validationguidance (Food and Drug Administration, 2001).
Calibration curves were prepared by determining the best-fitof peak area ratios (peak area of analyte/peak area of inter-nal standard) versus concentration, and fitted to the equationR = bC + a by unweighted least-sqaure regression. Blank plasmasamples of healthy human used for testing the specificityof the method were obtained from six different sources. Thevisible interferences were tested with blank plasma samplesand plasma samples with oxatomide concentrations close tothe lower limit of quantification (LLOQ).
The potential matrix effect on the ionization of the analytewas evaluated by comparing the peak area of the analyte dis-solved in the supernatant of the processed blank plasma withthat of standard solutions at the same concentration. Threedifferent concentration levels of oxatomide (1, 50 and 400 ng/mL) were evaluated by analyzing five samples at each set. Thematrix effect of the internal standard (60 ng/mL in plasma) wasevaluated using the same method.
The lower limit of detection (LLOD) and the lower limit ofquantification (LLOQ) were determined as the concentra-tions with a signal-to-noise ratio of 3 and 10, respectively. Eachconcentration standard had to meet the following acceptablecriteria: no more than 20% deviation at LLOQ and no morethan 15% deviation for the standards above LLOQ.
The intra-batch precision and accuracy were determined byrepeated analysis of five spiked samples of oxatomide at eachQC level (1, 50 and 400 ng/mL) on one day (n = 5). Inter-batch precision and accuracy was determined by repeatedanalysis on three consecutive days (n = 5 series per day). Theconcentration of each sample was calculated using a standardcurve prepared and analyzed on the same day. The precisionwas defined as the RSD (relative standard deviation, %) andthe accuracy was expressed as a percentage of the measuredconcentration over the theoretical concentration. The accept-ance criteria for intra- and inter-batch precisions were within15% and accuracy did not exceed 15%.
The absolute extraction recovery of oxatomide was deter-mined by comparing the oxatomide/IS peak area ratiosobtained from extracted plasma samples with those from thestandard solutions at the same concentration. This procedurewas repeated (n = 5) at each QC level (1, 50 and 400 ng/mL).
Freeze and thaw stability. Two concentration levels of QCplasma samples (1 and 400 ng/mL) were tested after threefreeze (−20°C) and thaw (room temperature) cycles.

Copyright © 2008 John Wiley & Sons, Ltd. Biomed. Chromatogr. 22: 746–752 (2008)DOI: 10.1002/bmc
748 X. She et al.ORIGINAL RESEARCH
Short-term temperature stability. Two concentration levelsof QC plasma samples (1 and 400 ng/mL) were kept at roomtemperature for a period that exceeded the routine prepara-tion time of samples (around 24 h).
Long-term stability. Two concentration levels of QC plasmasamples (1 and 400 ng/mL) kept at low temperature (−20°C)were studied for a period of 15 days.
Post-preparative stability. The auto sampler stability wastested by reanalyzing extracted QC samples (1 and 400 ng/mL) kept under the auto sampler conditions (4°C) for 24 h.
Stock solution stability. The stabilities of oxatomide andinternal standard working solutions were evaluated at roomtemperature for 6 h.
RESULTS AND DISCUSSION
Selection of IS
It is necessary to use an internal standard to obtainhigh accuracy when a mass spectrometer is equippedwith HPLC as the detector. Flunarizine hydrochloridewas adopted in the end because of its similarity ofretention action, ionization and extraction efficiencyas well as less endogenous interference at m/z 405.05.The structures of oxatomide and flunarizine hydro-chloride are shown in Fig. 1.
Sample preparation
Liquid–liquid extraction was necessary and importantbecause this technique can not only purify but also con-centrate the sample. n-Hexane–isopropanol (95:5, v/v),ethyl acetate and ethyl ether were all tested and ethylether was finally adopted because of its high extractionefficiency and less interference. NaOH (0.1 M, 100 μL)was added to the plasma in order to accelerate the drugs’dissociation from the plasma and reduce interferencesince most endogenous materials are of acidic nature.
LC-MS optimization
Both the positive and negative modes were investigatedand the response of positive ions was stronger thannegative ions, which indicate that the positive modewas much more sensitive. Positive eletrospray ioniza-tion mass scan specta of oxatomide and IS are shown inFig. 2, respectively. According to the mass scan spectra,m/z 427.10 produced by the protonated molecule ion[M + H]+ of oxatomide and m/z 405.05 produced by thequasimolecule ion [M + H]+ of flunarizine were selectedfor monitoring.
The SIM (+) chromatograms extracted from supple-mented plasma are depicted in Fig. 3. As shown, the
Figure 1. Chemical structure of oxatomide (A) andflunarizine hydrochloride (B).
retention times of oxatomide and the IS were 4.0 and6.5 min, respectively. Good separation of analytes andshort retention times were obtained using an elutionsystem consisting of methanol and aqueous ammoniumacetate solution (10 mM, pH4.0; 85:15, v/v) as the mobilephase. The total HPLC/MS analysis time was 7.5 minper sample.
Assay specificity and matrix effect
No analyte-interfering peaks were observed due to thehigh selectivity of SIM. Drug-free plasma was extractedwith ethyl ether and the results were recorded. Figure 3shows the representative HPLC chromatogram for adrug-free plasma sample, indicating that no endogenouspeaks were present at the retention time (tR) ofoxatomide or of the IS. All the ratios of the peakarea of the analytes dissolved in the supernatant of theprocessed blank plasma compared with that of standardsolutions at the same concentrations between 85 and115%. The results showed that there were no signifi-cant differences in peak areas, which indicated that noco-eluting ‘invisible’ compounds significantly influencedthe ionization of oxatomide and IS.

Copyright © 2008 John Wiley & Sons, Ltd. Biomed. Chromatogr. 22: 746–752 (2008)DOI: 10.1002/bmc
Determination of oxatomide in human plasma 749ORIGINAL RESEARCH
Figure 2. Positive ion electrospray mass scan spectra of oxatomide (A)and flunarizine hydrochloride (B). This figure is available in colour onlineat www.interscience.wiley.com/journal/bmc
Table 1. Results of five calibration curves for oxatomide determining in human plasma
Added concentration (ng/mL)
Assay 0.5 1 5 10 50 100 200 500
Back-calculated 1 0.48 1.06 5.42 9.23 48.00 101.62 195.84 494.01concentration 2 0.51 0.97 4.77 10.69 47.13 104.17 189.56 516.93
3 0.48 1.06 5.32 10.49 49.88 90.24 194.17 491.104 0.48 1.09 4.86 10.72 46.23 98.31 193.50 506.165 0.49 1.03 5.49 9.11 52.10 98.38 188.40 498.61
Mean 0.49 1.04 5.17 10.05 48.67 98.55 192.29 501.36SD 0.01 0.05 0.33 0.81 2.35 5.25 3.17 10.40RSD (%) 2.42 4.38 6.46 8.01 4.82 5.32 1.65 2.07Accuracy (%) 98.10 103.32 109.85 91.12 104.20 98.38 94.20 99.72
Linearity of calibration curves and specificity
The method exhibited good linear response over theselected concentration range by linear regressionanalysis. Standard curves were constructed on five dif-ferent days. The mean standard curve was typicallydescribed by the least-square equation: R = 0.0228 × C+ 0.0009, r = 0.9995, where R corresponds to the peakarea ratio of oxatomide to the IS and C refers to theconcentration of oxatomide added to plasma over aconcentration range of 0.5–500.0 ng/mL. Results of fiverepresentative standard curves for oxatomide LC/MSdetermination are given in Table 1.
The lower limit of quantification for oxatomide was0.5 ng/mL (LLOQ) and the lower limit of detection(LLOD) was 0.2 ng/mL. Figure 4 shows the chromato-gram of an extracted sample that contained 0.5 ng/mL(LLOQ) of oxatomide.
Precision and accuracy
Data for intra-batch and inter-batch precision andaccuracy of the method for oxatomide are presentedin Table 2. The RSD values for intra-batch precisionand accuracy were, respectively, in the ranges 4.79–7.37and 94.97–103.42%, whereas the corresponding inter-batch values were 4.50–7.34 and 96.14–100.47%. Theresults revealed good precision and accuracy.
Extraction recovery
The extraction recovery determined for oxatomidewas shown to be consistent, precise and reproducible.The mean recoveries of the three concentration levels(1, 50 and 400 ng/mL) were 92.93, 91.53 and 92.71%,respectively, whereas the relative standard deviationswere 6.16, 5.02 and 2.96%, respectively.

Copyright © 2008 John Wiley & Sons, Ltd. Biomed. Chromatogr. 22: 746–752 (2008)DOI: 10.1002/bmc
750 X. She et al.ORIGINAL RESEARCH
Figure 3. The SIM (+) chromatograms of (A) blank plasma sample and(B) supplemented plasma sample. The retention times of oxatomide (50 ng/mL) and IS (60 ng/mL) were 4.0 and 6.5 min, respectively. This figure isavailable in colour online at www.interscience.wiley.com/journal/bmc
and auto sampler stability data of oxatomide. All the resultsshowed reliable stability behavior during these tests andthere were no stability-related problems during the rou-tine analysis of samples for the pharmacokinetic study.
Stability
Table 3 summarizes the freeze and thaw stability, short-term stability, long-term stability, post-preparative stability
Table 2. The precision and accuracy of the method for the determination of oxatomide in human plasma
Intra-batch (n = 5) Inter-batch (n = 5)
Detected DetectedAdded concentration concentrationconcentration (mean ± SD), Accuracy Precision (mean ± SD) Accuracy Precision(ng/mL) ng/mL (%) (%) (ng/mL) (%) (%)
1 1.03 ± 0.08 103.42 7.37 1.00 ± 0.07 100.47 7.3450 49.97 ± 2.68 99.94 5.36 49.52 ± 2.69 99.04 5.44
400 391.88 ± 18.79 94.97 4.79 384.57 ± 17.30 96.14 4.50

Copyright © 2008 John Wiley & Sons, Ltd. Biomed. Chromatogr. 22: 746–752 (2008)DOI: 10.1002/bmc
Determination of oxatomide in human plasma 751ORIGINAL RESEARCH
Table 3. Data showing stability of oxatomide in human plasma at different QC levels (n ===== 3)
Accuracy (mean ± SD, %)
1 400
Short-term stability (24 h, room temperature) 100.92 ± 8.81 96.48 ± 7.42Freeze and thaw stability (3 cycles, −20°C, 100.86 ± 3.81 94.72 ± 3.44room temperature)Long-term stability (15 days, −20°C) 92.59 ± 6.14 94.92 ± 7.37Post-preparative stability (24 h, room temperature) 96.14 ± 5.47 94.31 ± 8.94Auto sampler stability (24 h, 4°C) 91.91 ± 1.42 99.31 ± 7.16
Figure 4. The SIM (+) chromatograms of (A) LLOQ (0.5 ng/mL) and(B) plasma sample of a healthy volunteer. The retention times ofoxtomide (32.41 ng/mL) and the IS (60 ng/mL) were 4.0 and 6.5 min,respectively. This figure is available in colour online at www.interscience.wiley.com/journal/bmc
Copyright © 2008 John Wiley & Sons, Ltd. Biomed. Chromatogr. 22: 746–752 (2008)DOI: 10.1002/bmc
752 X. She et al.ORIGINAL RESEARCH
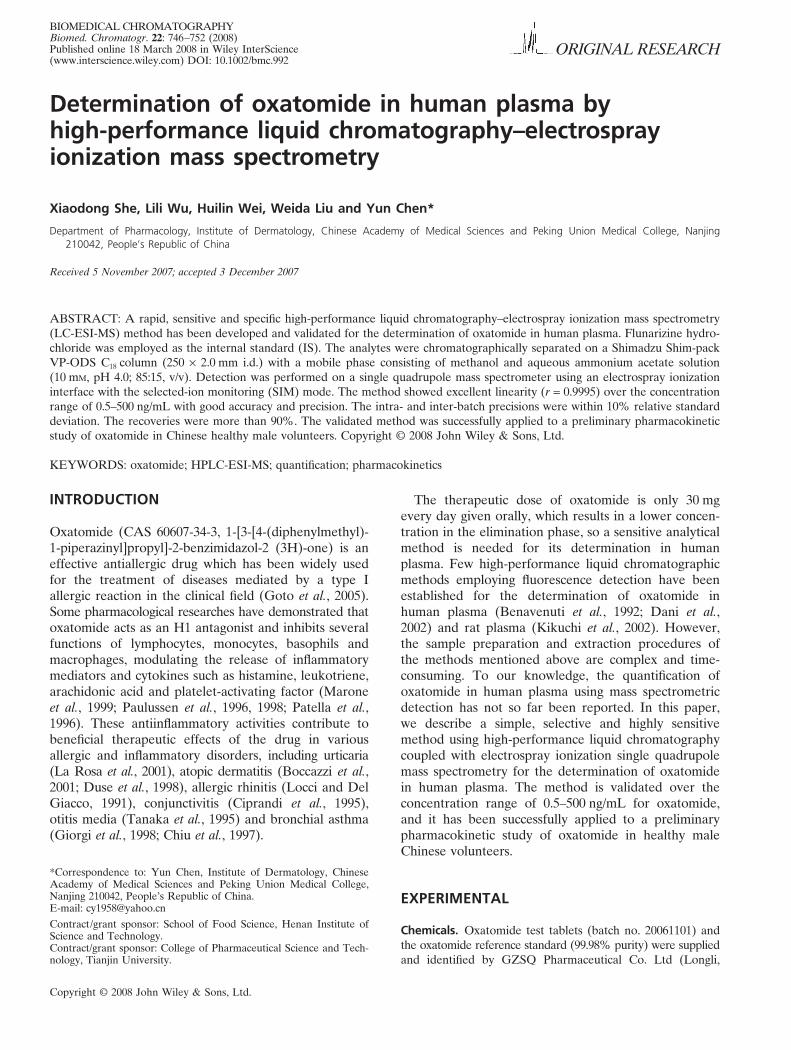
Figure 5. Mean drug plasma concentration–time curve ofoxatomide from four volunteers after oral administration.
REFERENCES
Benavenuti C, Broggini M, Botta V, Valenti M, Broccali G and Dalbo L.Pharmacokinetics of oxatomide given percutaneously to healthy volun-teers. Biopharmaceutics and Drug Disposition 1992; 13: 495–502.
Boccazzi A, Pugni L, Cesuti R and Rapuzzi S. Oxatomide in thetreatment of atopic dermatitis in breast-fed and very young infants.Minerva Pediatrica 2001; 53: 265–269.
Chiu CP, Huang JL, Lin TY, Shieh WB and Hsieh KH. Double-blindplacebo-controlled study of oxatomide in the treatment of child-hood asthma. Zhonghua Min Guo Xiao Er Ke Yi Xue Hui Za Zhi1997; 38: 14–20.
Ciprandi G, Buscaglia S, Pronzato C, Benvenuti C, Cavalli E,Bruzzone F and Canonica GW. Oxatomide reduces inflammatoryevents induced by allergen-specific conjunctival challenge. Annalsof Allergy Asthma and Immunology 1995; 75: 446–452.
Dani C, Martelli E, Bertini G, Filippi L, Pezzati M, Mazzetti L, CiuffiM, Zilletti L and Rubaltelli FF. Pharmacokinetics of oxatomide inpreterm infants. Drugs under Experimental and Clinical Research2002; 28: 207–210.
Duse M, Merlini R, Gardenghi R and Porteri V. Oxatomide in thetreatment of atopic dermatitis. Minerva Pediatrica 1998; 50: 359–365.
Food and Drug Administration, Center for Drug Evaluation andResearch (CDER). Guidance for Industry, Bioanalytical MethodValidation. US Department of Health and Human Service, May 2001.
Giorgi PL, Oggiano N, Kantar A, Coppa GV and Nicora M. Protec-tive effect of oxatomide in infantile bronchial asthma. Double-blindstudy vs placebo Minerva Pediatrica 1998; 50: 339–346.
Goto A, Ueda K, Inaba A, Nakajima H, Kobayashi H and Sakai K.Identification of human P450 isoforms involved in the metabolismof the antiallergic drug, oxatomide, and its kinetic parameters andinhibition constants. Biological and Pharmaceutical Bulletin 2005;28: 328–334.
Kikuchi K, Ohishi T, Masuike T, Ohmori K and Sakai K. High-performance liquid chromatographic determination of oxatomideand its metabolite and its application to pharmacokinetic study inrat plasma. Arzneimittelforschung 2002; 52: 754–763.
La Rosa M, Leonardi S, Marchese G, Corrias A, Barberio G,Oggiano N and Grimaldi I. Double-blind multicenter study on theefficacy and tolerability of cetirizine compared with oxatomide inchronic idiopathic urticaria in preschool children. Annals of AllergyAsthma and Immunology 2001; 87: 48–53.
Locci F and Del Giacco GS. Treatment of chronic idiopathic urticariawith topical preparations: controlled study of oxatomide gel versusdechlorpheniramine cream. Drugs Under Experimental and ClinicalResearch 1991; 17: 399–403.
Marone G, Granata F, Spadaro G, Onorati AM and Triggiani M.Antiinflammatory effects of oxatomide. Journal of InvestigationalAllergology and Clinical Immunology 1999; 9: 207–214.
Patella V, de Crescenzo G, Marino O, Spadaro G, Genovese Aand Marone G. Oxatomide inhibits the release of proinflammatorymediators from human basophils and mast cells. InternationalArchives of Allergy and Immunology 1996; 111: 23–29.
Paulussen JJ, Fischer MJ, Roelofsen EP, Horbach DA, de Mol NJand Janssen LH. Oxatomide and derivatives as inhibitors of media-tor release from a mast cell model. Structure–activity relationships.Arzneimittelforschung 1996; 46: 496–501.
Paulussen JJ, Fischer MJ, Roozendaal RL, van der Heijden VC,van Dijken P, de Mol NJ and Janssen LH. Effects of oxatomideand derivatives on high affinity IgE receptor-activated signaltransduction pathways in rat basophilic leukemia cells: role of pro-tein tyrosine hyperphosphorylation and inhibition of extracellularcalcium influx. Biochemical Pharmacology 1998; 56: 693–701.
Tanaka T, Kurono Y, Kawauchi H and Mogi G. Effect of oxatomideon otitis media with effusion—an experimental study. Acta oto-laryngologica 1995; 115: 532–538.
The stability of working solutions was tested at roomtemperature for 6 h. Based on the results obtained,these working solutions were stable within 6 h.
Application
The validated method was successfully applied to quantifyoxatomide concentration in a preliminary pharmacoki-netic study. After fasting overnight, four volunteerswere administered oxatomide tablet (containing 30 mgoxatomide) in the single dose study. Venous bloodsamples (3 mL) were collected immediately before doseand at 0.25, 0.5, 1.0, 1.5, 2.0, 3.0, 4.0, 5.0, 6.0, 8.0, 12.0,24.0, 36.0 and 48.0 h post-dosing. The plasma wasseparated by centrifugation at 1600g for 4 min within20 min after blood collection, and was stored at −20°Cuntil analyzed. A representative chromatogram of aplasma sample obtained at 2 h from a subject whoreceived a single oral dose is shown in Fig. 4. Themean plasma concentration–time curve of four volun-teers after oral administration of oxatomide is shown inFig. 5.
CONCLUSIONS
This paper first presented a rapid, specific and sensitiveLC-ESI-MS method for determination of oxatomidein human plasma with a total running time of 7.5 minfor each injection. The short analysis time makes themethod suitable for the analysis of a large numberof samples resulting from the pharmacokinetic, bio-availability or bioequivalence studies of oxatomidein humans. The method was successfully applied toquantify the concentration–time profile of oxatomidein a preliminary clinical pharmacokinetic study.