determination of organic acids in herbal beverages using a ... · goal develop an easy method to...
TRANSCRIPT

Goal Develop an easy method to identify and determine organic acids in herbal drinks using a compact high-pressure ion chromatography (HPIC) system coupled to a single quadrupole mass spectrometer IntroductionHerbal beverages are drinks that primarily contain extracts from parts of plants with aromatic properties. In recent years these beverages have become popular among people who are seeking specific health benefits from their diet. Amongst the active components of these beverages, organic acids are of particular interest to consumers.
The determination of organic acids plays an important role in revealing the possible beneficial effects of the herbal beverage. For example, malic acid is believed to promote “detoxification” by chelating aluminum and promoting its excretion.1 Organic acids affect the flavor and taste of the drink. Therefore, for product quality reasons, it is prudent to monitor the herbal beverage’s organic acid profile.
Authors Beibei Huang and Jeffrey Rohrer
Thermo FIsher Scientific Sunnyvale, CA
Keywords Dionex Integrion, RFIC system, Dionex IonPac AS11-HC-4µm column, ISQ EC single quadrupole mass spectrometer, organic acid, ion suppression
Determination of organic acids in herbal beverages using a compact ion chromatography system coupled with mass spectrometry
APPLICATION NOTE 72808

2
Traditionally, organic acids have been analyzed by gas chromatography (GC), liquid chromatography (LC), and ion chromatography (IC). However, several organic acids exhibit poor UV absorption and therefore lack sufficient sensitivity for detection when using LC. Also, herbal beverages contain other components—such as sugars and phenolic compounds—that are either at a much higher concentration or have much stronger UV absorption, and therefore can interfere with the detection of target analytes. Gas chromatography requires sample derivatization for organic acid analysis, which carries additional labor and expertise requirements. Ion chromatography with suppressed conductivity detection is the technique of choice to separate and detect a large variety of organic acids. However, some organic acids like succinate and malate do not separate with typical IC eluents.2 The addition of a mass spectrometer after the conductivity cell, however, facilitates the identification and accurate quantification of co-eluting organic acids.
The Thermo Scientific™ ISQ™ EC single quadrupole mass spectrometer (MS) increases analytical confidence by providing sensitivity, selectivity, and confirmation of identity.3 The ISQ EC MS can operate in Full Scan and Single Ion Monitoring (SIM) mode, to either scan a mass range for all detectable analytes or to focus on a specific compound. This work uses IC with suppressed conductivity and mass spectrometry detection for organic acid determinations. This dual detection approach increases the information available from the sample. Samples were separated with a high-resolution Thermo Scientific™ Dionex™ IonPac™ AS11-HC-4μm column set using a Thermo Scientific™ Dionex™ Integrion™ HPIC™ system with suppressed conductivity detection, and an ISQ EC MS. Co-eluting organic acids can be accurately quantified with mass spectrometric detection, eliminating the need for the addition of methanol to the hydroxide eluent to enhance separation. This application note demonstrates an easy IC-MS method for determination of organic acids in aloe, hawthorn/plum, and goji drinks, especially showing selectivity in detection for co-eluting compounds and peak confirmation.
ExperimentalEquipment and consumables
• Dionex Integrion HPIC system including:
– Eluent Generator
– Pump
– Degasser
– Conductivity Detector (CD)
– Column oven temperature control
– Detector-suppressor compartment temperature control
– Tablet control
• Thermo Scientific™ Dionex™ AS-AP Autosampler with Sample Syringe, 250 µL (P/N 074306) and Buffer line, 1.2 mL (P/N 074989)
• ISQ EC single quadrupole mass spectrometer (P/N ISQEC000IC)
• Thermo Scientific™ Dionex™ AXP Auxiliary Pump (P/N 063973)
• Peak™ Scientific Genius 1022 nitrogen generator (P/N 10-6022 (230 v))
• Thermo Scientific™ Dionex™ EGC 500 KOH Eluent Generator Cartridge (P/N 075778)
• Thermo Scientific™ Dionex™ CR-ATC 600 Continuously Regenerated Anion Trap Column (P/N 088662)
• Thermo Scientific™ Dionex™ AERS 500e Anion Electrolytically Regenerated Suppressor for External Water Mode (2 mm) (P/N 302662)
• Thermo Scientific™ Dionex™ IC PEEK Viper™ Fittings Kit (P/N 088798)
• Dionex AS-AP Autosampler Vials 10 mL (P/N 074228)
• Thermo Scientific™ Chromeleon™ Chromatography Data System (CDS) version 7.2 SR6
• Thermo Scientific™ Nalgene™ Syringe Filters, PES, 0.2 µm (Fisher Scientific P/N 09-740-61A)
• Air-Tite™ All-Plastic Norm-Ject™ Syringes, 5 mL, Sterile (Fisher Scientific P/N 14-817-28)
• Thermo Scientific Nalgene 1000 mL, 0.2 μm Nylon Filter Units (P/N 09-740-46)

3
Reagents and standardsReagentsDeionized (DI) water, Type I reagent grade, with 18 MΩ·cm resistivity or better filtered through a 0.2 µm filter immediately before use
Standards• D(–)-Quinic acid, +98%, ACROS Organics™ (Fisher
Scientific P/N AC160500250)
• Acetic acid, Glacial (Certified ACS Plus), Fisher BioReagents™ (Fisher Scientific P/N BP 2401-500)
• L(+)-Lactic acid, 90% solution in water, ACROS Organics (Fisher Scientific P/N AC189872500)
• Glycolic acid, 99%, ACROS Organics (Fisher Scientific P/N AC154510250)
• Formic acid, 99%, for analysis, ACROS Organics (Fisher Scientific P/N AC 270480250)
• L(–)-Malic acid, 99% (Fisher Scientific P/N AC15059)
• Pyruvic acid, Sodium Salt, +99%, ACROS Organics (Fisher Scientific P/N AC 132151000)
• Succinic acid (Crystalline/Certified), Fisher Chemical (Fisher Scientific P/N A294-500)
• Succinic acid (13C4, 99%), Cambridge Isotope Laboratories (CLM P/N CLM-1571-0.1)
• DL-Tartaric acid, 99.5%, ACROS Organics (Fisher Scientific P/N AC137871000)
• Malonic acid, 99%, ACROS Organics (Fisher Scientific P/N AC125262500)
• Oxalic acid dihydrate (Crystalline/Certified ACS), Fisher Chemical (Fisher Scientific, P/N A219-250)
• Fumaric acid, 99+%, ACROS Organics (Fisher Scientific P/N AC119751000)
• Citric acid anhydrous, Crystalline, USP (Fisher Scientific P/N A95)
*Note: Samples were purchased from a local store.
Conditions
IC System: Dionex Integrion HPIC system
MS Detector: ISQ EC single quadrupole mass spectrometer
Columns: Dionex IonPac AG11-HC-4-μm Guard, 2 × 50 mm (P/N 078036) Dionex IonPac AS11-HC-4-μm Analytical, 2 × 250 mm (P/N 078035)
Eluent Source: Dionex EGC 500 KOH Eluent Generator Cartridge with Thermo Scientific™ Dionex™ CR-ATC 600
Gradient: 1 mM KOH (0–17 min), 1–15 mM KOH (17–24 min), 15 mM KOH (24–35.3 min), 15–60 mM KOH (35.3–54.6 min), and 1 mM KOH (54.6–60 min)
Flow Rate: 0.38 mL/min
Injection Volume: 2.5 µL
Temperature: 30 ºC (column compartment), 20 ºC (detector compartment)
System Backpressure: ~3500 psi (100 psi = 0.6894 MPa)
Detection: Suppressed Conductivity, Dionex AERS 500e Anion Electrolytically Regenerated Suppressor (2 mm), AutoSuppression, 57 mA, external water mode via Dionex AXP Pump, external water flow rate (0.76 mL/min)
Background Conductance: ~ 0.3 µS/cm
Run Time: 60 min
Samples*• Aloe beverage Sample A
• Hawthorn/plum beverage Sample B
• Goji berries, used to prepare Sample C

4
Preparation of solutions and reagentsDeionized water with 18 MΩ·cm resistivity or better is used for eluent and standard preparation and for diluting samples. Individual stock standard solutions of 1000 mg/L are prepared gravimetrically from the reagents and DI water. A mixed standard solution
Mass Spectrometric Detection
Ionization Interface: Electrospray ionization (ESI), negative mode
Gas Control: Sheath gas pressure: 50 psi Aux gas pressure: 8 psi Sweep gas pressure: 0.0 psi
Source Voltage: -2500 V
Vaporizer Temperature: 450 ºC
Ion transfer Tube Temperature: 150 ºC
SIM Scan: Table 1
Full Scan: Mass Range: 20–200 m/z Source CID Voltage: 0 V
Groups: Chrom. Filter Peak Width: 25 s
Table 1. Advanced scan mode parameters
Scan Name Mass List
(amu)Dwell or Scan
Times (s)SIM Widths
(amu)Ion Polarity
Source CID Voltage
Acetate 59 0.8 0.3 Negative 0
Lactate-Oxalate 89 0.2 0.3 Negative 0
Formate 45 0.8 0.3 Negative 0
Glycolate 75 0.2 0.3 Negative 0
Quinate-Citrate 191 0.2 0.3 Negative 0
Malonate 103 0.2 0.3 Negative 0
Bicarbonate (HCO3) 61 0.2 0.3 Negative 0
Pyruvate 87 0.2 0.3 Negative 0
Succinate 117 0.2 0.3 Negative 0
Succinate ISTD* 121 0.2 0.3 Negative 0
Malate 133 0.2 0.3 Negative 0
Fumarate 115 0.2 0.3 Negative 0
Tartrate 149 0.2 0.3 Negative 0
*ISTD: Internal Standard
is prepared by diluting the individual stock standard solutions into a 100 mL volumetric flask with DI water. Calibration standards are prepared similarly by diluting the stock standards in DI water. Thirteen compounds and their masses listed in Table 2 are used to prepare 100 mL of 1000 mg/L stock solutions.
Table 2. Amounts of compounds used to prepare 100 mL of 1000 mg/L stock solutions
Anion Compound Mass (mg)
Quinate Quinic Acid 100.00
Lactate Lactic Acid 100.00
Acetate Acetic Acid 100.00
Formate Formic Acid 100.00
Glycolate Glycolic Acid 100.00
Pyruvate Pyruvic Acid, Sodium Salt 124.96
Succinate Succinic Acid 100.00
Malate Malic Acid, Disodium Salt 132.78
Tartrate Tartaric Acid 100.00
MalonateMalonic Acid, Disodium Salt
142.23
Oxalate Oxalic Acid Dihydrate 140.03
Fumarate Fumaric Acid 100.00
Citrate Citric Acid 100.00

5
The succinate ISTD is enriched with 13C, and the base mass peak is m/z 121. The 10,000 mg/L stock solution of succinate ISTD is prepared by dissolving 100 mg succinate ISTD into 10 mL DI water. The working solution of succinate ISTD at 100 mg/L is prepared gravimetrically by diluting the 1 mL stock standard solution into a 100 mL volumetric flask with DI water. The recommended internal standard concentration in each standard and sample is 100 μg/L, as indicated below.
Sample preparationFor goji samples, immerse 50 g dried goji berries in 1000 mL hot water overnight and allow to cool to room temperature. Centrifuge the goji solution at 6500–7500 g for 20 min, and pass the supernatant through a Nalgene syringe filter (0.2 µm). For the aloe and hawthorn/plum bottled beverages, centrifuge for 20 min, and then pass the supernatant through a Nalgene syringe filter (0.2 µm) and dilute 1:20 with DI water.
Internal standard method of use 1. Prepare 10 mL each of:
• Organic acid standards in water blank (no ISTD)
• Sample dilution
2. Add 10 μL 100 mg/L succinate ISTD to each 10 mL solution of standard and sample.
System configurationInstall and configure the Dionex AS-AP Autosampler in Push Mode. Follow the instructions in the Dionex AS-AP Autosampler Operator’s Manual (Document No. 065361) to calibrate the sample transfer line to ensure accurate and precise sample injections.
Install and hydrate the Dionex EGC 500 KOH cartridge, Dionex CR-ATC 600 Continuously Regenerated Anion Trap Column, and Dionex AERS 500e suppressor according to the product manual instructions.4-6 Note: The system pressure needs to be above 2000 psi for effective degassing of the KOH produced by the eluent generator. The Dionex AERS 500e suppressor is recommended for all applications where external water mode is employed, in particular, IC-MS applications. The ISQ EC mass spectrometer is installed according to the ISQ EC Operating Manual.7
Flow goes into the MS detector after passing through the electrolytically regenerated anion suppressor and the conductivity cell. Ionization improvements to the ISQ EC mass spectrometer’s electrospray source (HESI-II electrospray) eliminate the need for adding organic solvents to assist ionization and thus simplify operation.
Results and discussionSeparationThe Dionex IonPac AS11-HC-4µm column is a high-resolution, high-capacity anion exchange column, providing analyte separation that allows for the peak quantification of a large number of inorganic anions and organic acid anions from a single sample injection. The column is operated in the gradient mode using a hydroxide eluent. Certain organic solvents can be added to the hydroxide eluent to modify the ion exchange process, and thereby column selectivity, or improve sample solubility. Under aqueous eluent conditions, succinate and malate, acetate and glycolate, and malonate and tartrate form co-eluting pairs. The separation could be improved by adding methanol to the eluent. The organic solvent in the eluent, however, can reduce the sensitivity of conductivity measurements by up to half due to increased eluent viscosity, decreased ionization of organic acids, and, in some cases, lower peak efficiencies. Moreover, it increases the difficulty of operation by adding solvent to the aqueous eluent.
In this study, an easy IC-CD/MS method was developed to separate 13 common organic acids on a Dionex IonPac AS11-HC-4µm column set (Figure 1). An IC separation could resolve the majority of organic acids. The separation was enhanced with mass spectrometric detection in SIM mode. Co-eluting analytes were fully resolved in different SIM channels (Figure 1). The hydroxide eluent started with a low concentration (1 mM KOH) to separate the weakly retained anions, such as quinate, lactate, acetate/glycolate, and formate. After maintaining this concentration for 17 min, the eluent concentration was gradually increased to elute more strongly retained anions. The KOH concentration was increased to 15 mM at 24 min, and remained at 15 mM from 24 to 35.3 min, during which pyruvate, succinate/malate, bicarbonate, and malonate/tartrate eluted. After 35.3 min, a KOH gradient was executed from 15 mM to 60 mM at 54.6 min to elute fumarate, oxalate, and citrate.

6
Figure 1 (A and B). Conductivity and SIM chromatograms of 13 common organic acids (0.5 mg/L each). A) acetate and glycolate; B) quinate, lactate, formate, pyruvate, oxalate, and citrate.
0 10 20 30 40 50 60-0.100
0.600
µS/cm
-10,000
90,000
counts
1,500
6,000
counts
Minutes
Acetate m/z 59RT = 9.84 minArea Counts = 665
Glycolate m/z 75RT = 9.86 minArea Counts = 19,879
Acetate/Glycolate
A
0 10 20 30 40 50 60-0.1
0.6
50,000
300,000
-50,000
250,000
0
5,500
-10,000
100,000
µS/cm
counts
counts
counts
counts
Minutes
m/z 45
m/z 89
m/z 191
m/z 87
RT: 13.67 min - Formate - Area: 932
RT: 18.28 min - Pyruvate - Area: 36,617
RT: 9.15 min - Lactate - Area: 23,139
RT: 39.07 min - Oxalate - Area: 68,527
RT: 49.48 min- Citrate - Area: 54,215
QuinateLactate
FormatePyruvate
Oxalate Citrate
RT: 7.44 min - Quniate - Area: 45,112
B

7
Figure 1 (C and D). Conductivity and SIM chromatograms of 13 common organic acids (0.5 mg/L each). C) succinate, malate, malonate, and tartrate; D) oxalate and fumarate
32.4 40.0 44.4-50,000
0
250,000
RT: 39.07 min - Oxalate - Area: 68,527counts
-294,738
158,880RT: 39.69 min - Fumarate - Area: 38,862
counts
0.050
0.450
µS/cm
Minutes
OxalateFumarate
m/z 115
m/z 89
D
24.3 30.0 38.5-20,000
180,000
RT: 32.31 min - Tartrate - Area: 41,370
counts
-20,000
180,000
RT: 30.75 min - Succinate - Area: 32,883
-20,000
180,000
RT: 32.34 min - Malonate - Area: 37,497
-20,000
200,000
RT: 30.88 min - Malate - Area: 39,547
-15,000
70,000RT: 31.70 min - Bicarbonate - Area: 20,791
-0.280
0.534
µS/cm
Minutes
Succinate/malate
m/z 61
m/z 133
m/z 117
m/z 149
C
counts
counts
counts
counts
m/z 103
Malonate/tartrate
8
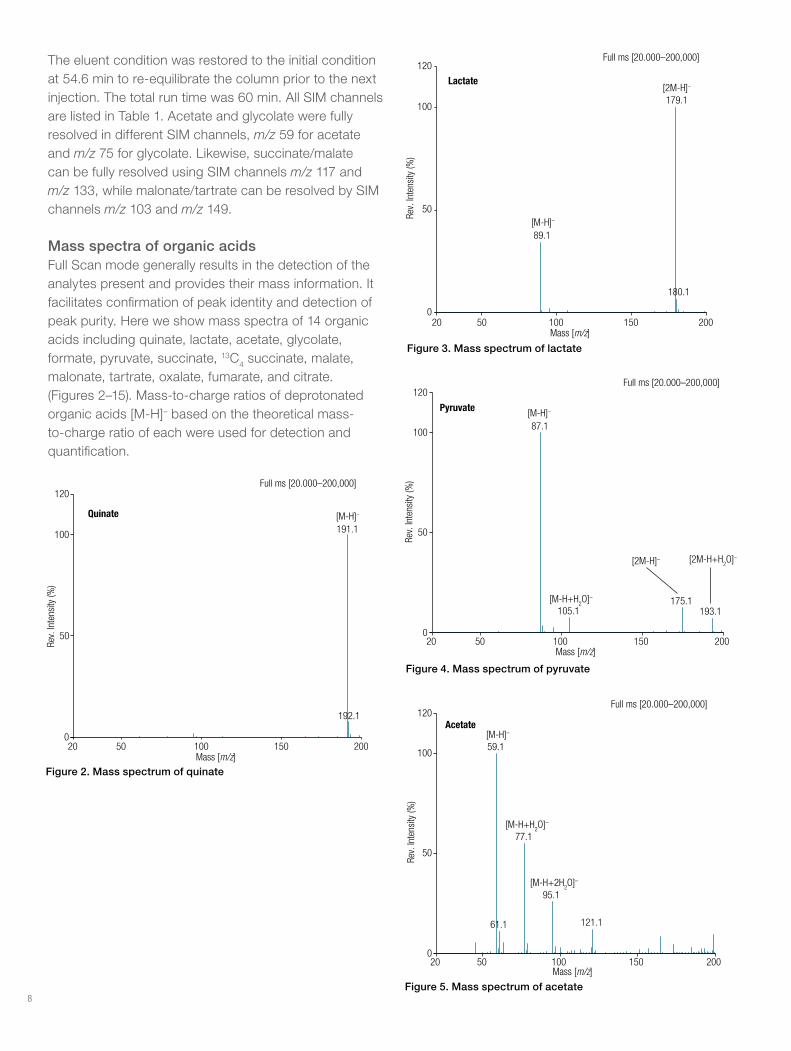
The eluent condition was restored to the initial condition at 54.6 min to re-equilibrate the column prior to the next injection. The total run time was 60 min. All SIM channels are listed in Table 1. Acetate and glycolate were fully resolved in different SIM channels, m/z 59 for acetate and m/z 75 for glycolate. Likewise, succinate/malate can be fully resolved using SIM channels m/z 117 and m/z 133, while malonate/tartrate can be resolved by SIM channels m/z 103 and m/z 149.
Mass spectra of organic acidsFull Scan mode generally results in the detection of the analytes present and provides their mass information. It facilitates confirmation of peak identity and detection of peak purity. Here we show mass spectra of 14 organic acids including quinate, lactate, acetate, glycolate, formate, pyruvate, succinate, 13C4 succinate, malate, malonate, tartrate, oxalate, fumarate, and citrate. (Figures 2–15). Mass-to-charge ratios of deprotonated organic acids [M-H]– based on the theoretical mass-to-charge ratio of each were used for detection and quantification.
Figure 2. Mass spectrum of quinate
20 50 100 150 2000
50
100
120
191.1
192.1
Quinate
Rev.
Inte
nsity
(%)
Mass [m/z]
Full ms [20.000–200,000]
[M-H]–
20 50 100 150 2000
50
100
120
89.1
179.1
180.1
Lactate
Rev.
Inte
nsity
(%)
Mass [m/z]
Full ms [20.000–200,000]
[M-H]–
[2M-H]–
20 50 100 150 2000
50
100
120
87.1
105.1175.1
193.1
PyruvateRe
v. In
tens
ity (%
)
Mass [m/z]
Full ms [20.000–200,000]
[M-H]–
[2M-H]– [2M-H+H2O]–
[M-H+H2O]–
Figure 3. Mass spectrum of lactate
Figure 4. Mass spectrum of pyruvate
20 50 100 150 2000
50
100
120
59.1
61.1
77.1
95.1
121.1
Acetate
Rev.
Inte
nsity
(%)
Mass [m/z]
Full ms [20.000–200,000]
[M-H]–
[M-H+H2O]–
[M-H+2H2O]–
Figure 5. Mass spectrum of acetate

9
20 50 100 150 2000
50
100
120
75.1
151.1
Glycolate
Rev.
Inte
nsity
(%)
Mass [m/z]
Full ms [20.000–200,000]
[M-H]–
[2M-H]–
20 50 100 150 2000
50
100
120
45.263.1
91.1
95.1
Formate
[M-H+H2O]–
Rev.
Inte
nsity
(%)
Mass [m/z]
Full ms [20.000–200,000]
[M-H]–
[2M-H]–
Figure 6. Mass spectrum of glycolate
Figure 7. Mass spectrum of formate
20 50 100 150 2000
50
100
120
133.1
Malate
Rev.
Inte
nsity
(%)
Mass [m/z]
Full ms [20.000–200,000]
[M-H]–
20 50 100 150 2000
50
100
120
117.1
Succinate
Rev.
Inte
nsity
(%)
Mass [m/z]
Full ms [20.000–200,000]
[M-H]–
20 50 100 150 2000
50
100
120
121.1
13C4 SuccinateRe
v. In
tens
ity (%
)
Mass [m/z]
Full ms [20.000–200,000]
[M-H]–
Figure 8. Mass spectrum of malate
Figure 9. Mass spectrum of succinate
Figure 10. Mass spectrum of 13C4 succinate
Figure 11. Mass spectrum of tartrate
20 50 100 150 2000
50
100
120
149.1
Tartrate
Rev.
Inte
nsity
(%)
Mass [m/z]
Full ms [20.000–200,000]
[M-H]–

10
Figure 12. Mass spectrum of malonate
Figure 13. Mass spectrum of oxalate
Figure 14. Mass spectrum of fumarate
Figure 15. Mass spectrum of citrate
20 50 100 150 2000
50
100
120
115.1
Fumarate
Rev.
Inte
nsity
(%)
Mass [m/z]
Full ms [20.000–200,000]
[M-H]–
20 50 100 150 2000
50
100
120
191.0
192.1
Full ms [20.000–200,000]
Citrate
Rev.
Inte
nsity
(%)
Mass [m/z]
[M-H]–
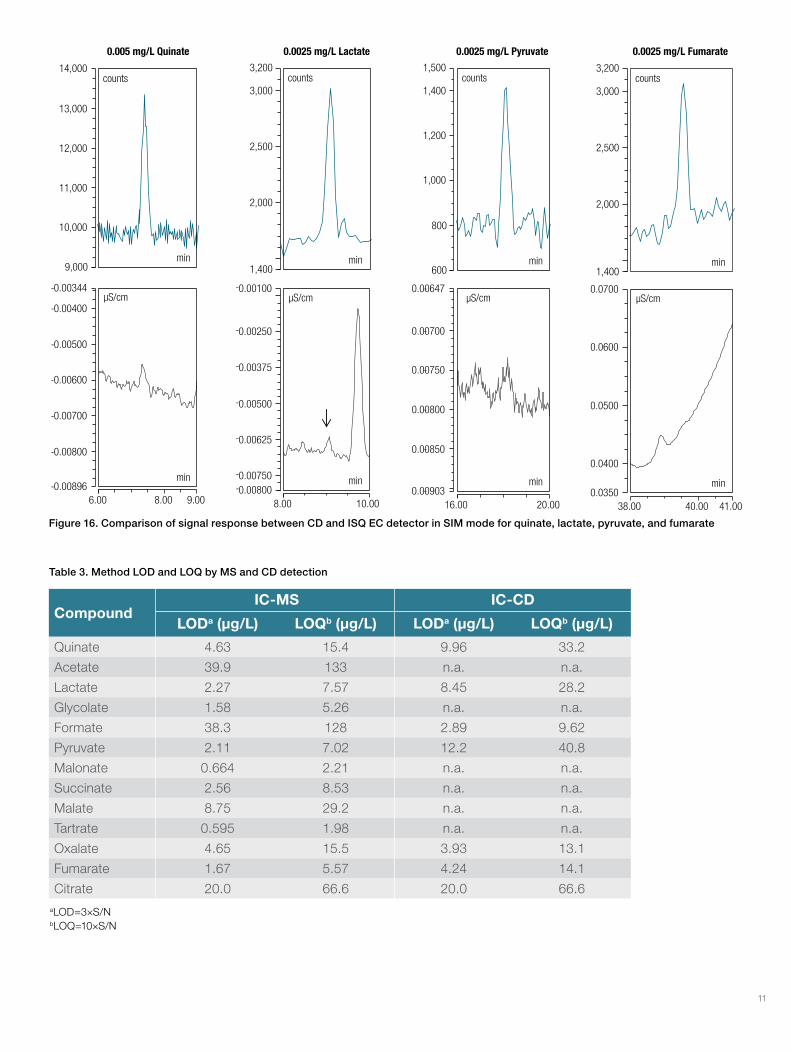
Limit of detection, limit of quantitation, and calibrationThe detection limits of suppressed conductivity detection and mass spectrometric detection were compared. Fisseha et al.8 reported improved signal-to-noise ratios (S/N) and the resolution of co-eluting acids by IC-MS for the qualitative evaluation of organic acids (OA) produced in a smog chamber. Our study evaluated the detection limits of 13 common OAs using IC-CD/MS. We found MS usually outperformed CD, especially for non-resolved OAs because MS gave us an opportunity to explore their sensitivity without chromatographic separation. Figure 16 shows the detection limits of some OAs using the ISQ EC MS are improved compared CD. However, MS did not enhance the sensitivity of formate, oxalate, and citrate compared with CD under the current MS conditions. Note: MS conditions can be optimized for the specific organic acid to improve its sensitivity.
Determination of S/N is performed by comparing measured signals from samples with known low concentrations of analyte with those of blank samples and by establishing the minimum concentration at which the analyte can be reliably detected. A S/N of 3:1 is generally considered acceptable for estimating the limit of detection (LOD), and a S/N of 10:1 for the limit of quantification (LOQ). The LOD and LOQ were then calculated from the average peak height of five injections of each of the standards with known low concentration. Due to co-elution, the CD detector was unable to differentiate succinate and malate, acetate and glycolate, or malonate and tartrate under this study’s separation conditions, so there are no LOD and LOQ by CD for those OAs. The results of LOD and LOQ by MS and CD are summarized in Table 3.
20 50 100 150 2000
50
100
120
103.1
Malonate
Rev.
Inte
nsity
(%)
Mass [m/z]
Full ms [20.000–200,000]
[M-H]–
20 50 100 150 2000
50
100
120
89.1
179.0
Oxalate
Rev.
Inte
nsity
(%)
Mass [m/z]
Full ms [20.000–200,000]
[M-H]–
[2M-H]–
11
6.00 8.00 9.00-0.00896
-0.00800
-0.00700
-0.00600
-0.00500
-0.00400
-0.00344
min
µS/cm
9,000
10,000
11,000
12,000
13,000
14,000
min
counts
0.005 mg/L Quinate
8.00 10.00
-0.00800
-0.00750
-0.00625
-0.00500
-0.00375
-0.00250
-0.00100
min
µS/cm
1,400
2,000
2,500
3,000
3,200
min
counts
38.00 40.00 41.000.0350
0.0400
0.0500
0.0600
0.0700
min
µS/cm
1,400
2,000
2,500
3,000
3,200
min
counts
16.00 20.00-0.00903
-0.00850
-0.00800
-0.00750
-0.00700
-0.00647
min
µS/cm
600
800
1,000
1,200
1,400
1,500
min
counts
0.0025 mg/L Lactate 0.0025 mg/L Pyruvate 0.0025 mg/L Fumarate
Figure 16. Comparison of signal response between CD and ISQ EC detector in SIM mode for quinate, lactate, pyruvate, and fumarate
CompoundIC-MS IC-CD
LODa (µg/L) LOQb (µg/L) LODa (µg/L) LOQb (µg/L)
Quinate 4.63 15.4 9.96 33.2
Acetate 39.9 133 n.a. n.a.
Lactate 2.27 7.57 8.45 28.2
Glycolate 1.58 5.26 n.a. n.a.
Formate 38.3 128 2.89 9.62
Pyruvate 2.11 7.02 12.2 40.8
Malonate 0.664 2.21 n.a. n.a.
Succinate 2.56 8.53 n.a. n.a.
Malate 8.75 29.2 n.a. n.a.
Tartrate 0.595 1.98 n.a. n.a.
Oxalate 4.65 15.5 3.93 13.1
Fumarate 1.67 5.57 4.24 14.1
Citrate 20.0 66.6 20.0 66.6aLOD=3×S/NbLOQ=10×S/N
Table 3. Method LOD and LOQ by MS and CD detection
12
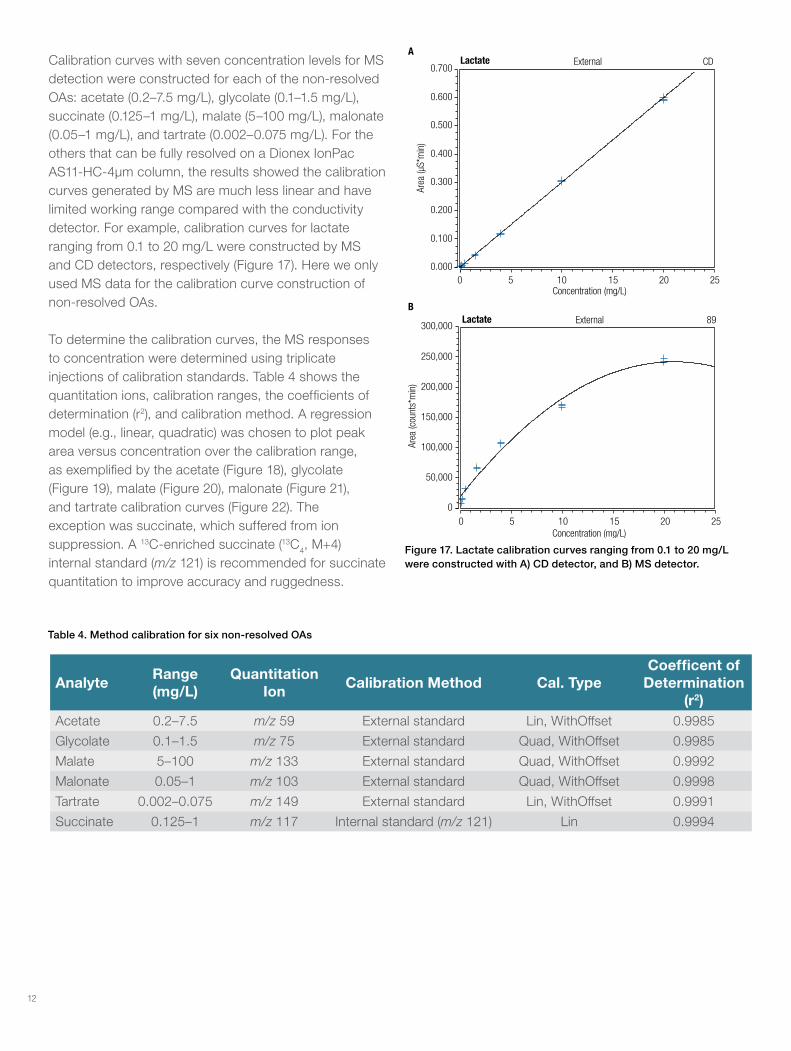
Calibration curves with seven concentration levels for MS detection were constructed for each of the non-resolved OAs: acetate (0.2–7.5 mg/L), glycolate (0.1–1.5 mg/L), succinate (0.125–1 mg/L), malate (5–100 mg/L), malonate (0.05–1 mg/L), and tartrate (0.002–0.075 mg/L). For the others that can be fully resolved on a Dionex IonPac AS11-HC-4µm column, the results showed the calibration curves generated by MS are much less linear and have limited working range compared with the conductivity detector. For example, calibration curves for lactate ranging from 0.1 to 20 mg/L were constructed by MS and CD detectors, respectively (Figure 17). Here we only used MS data for the calibration curve construction of non-resolved OAs.
To determine the calibration curves, the MS responses to concentration were determined using triplicate injections of calibration standards. Table 4 shows the quantitation ions, calibration ranges, the coefficients of determination (r2), and calibration method. A regression model (e.g., linear, quadratic) was chosen to plot peak area versus concentration over the calibration range, as exemplified by the acetate (Figure 18), glycolate (Figure 19), malate (Figure 20), malonate (Figure 21), and tartrate calibration curves (Figure 22). The exception was succinate, which suffered from ion suppression. A 13C-enriched succinate (13C4, M+4) internal standard (m/z 121) is recommended for succinate quantitation to improve accuracy and ruggedness.
Figure 17. Lactate calibration curves ranging from 0.1 to 20 mg/L were constructed with A) CD detector, and B) MS detector.
0 5 10 15 20 250.000
0.100
0.200
0.300
0.400
0.500
0.600
0.700External CDLactate
Area
(µS*
min
)
Concentration (mg/L)
A
0
50,000
100,000
150,000
200,000
250,000
300,000External 89Lactate
Concentration (mg/L)
Area
(cou
nts*
min
)
B
0 5 10 15 20 25
Table 4. Method calibration for six non-resolved OAs
AnalyteRange (mg/L)
Quantitation Ion
Calibration Method Cal. TypeCoefficent of
Determination (r2)
Acetate 0.2–7.5 m/z 59 External standard Lin, WithOffset 0.9985
Glycolate 0.1–1.5 m/z 75 External standard Quad, WithOffset 0.9985
Malate 5–100 m/z 133 External standard Quad, WithOffset 0.9992
Malonate 0.05–1 m/z 103 External standard Quad, WithOffset 0.9998
Tartrate 0.002–0.075 m/z 149 External standard Lin, WithOffset 0.9991
Succinate 0.125–1 m/z 117 Internal standard (m/z 121) Lin 0.9994

13
Figure 18. Acetate calibration curve ranging from 0.2 to 7.5 mg/L was constructed with the MS detector.
The calibration curves were constructed for succinate using the external standard method; Figure 23B displays succinate intensity over a series of concentrations when malate is at a comparingly high concentration (> 5 mg/L). The succinate plot has a linear section in the low concentration, followed by “saturation” with increasing concentration, and a small decrease in intensity at the highest concentration. It indicates that a high concentration of co-eluting malate greatly affects the calibration curve for succinate using the external standard method. Internal standard calibration is one of the most widely used techniques to compensate for ion suppression. An internal standard allows the response of a given analyte to be normalized, thus compensating for matrix effects and possible variations in injection, chromatography, and sample preparation.
0 2 4 6 80
5,000
10,000
15,000
20,000
25,000
30,000Acetate External 59
Concentration (mg/L)
Area
(cou
nts*
min
)
0.00 0.25 0.50 0.75 1.00 1.25 1.600
15,000
30,000
45,000
60,000
70,000Glycolate External 75
Concentration (mg/L)
Area
(cou
nts*
min
)
Figure 19. Glycolate calibration curve ranging from 0.1 to 1.5 mg/L was constructed with the MS detector.
0 20 40 60 80 100 1200
200,000
400,000
600,000
800,000
1,000,000
1,200,000
1,400,000Malate External 133
Concentration (mg/L)
Area
(cou
nts*
min
)
Figure 20. Malate calibration curve ranging from 5 to 100 mg/L was constructed with the MS detector.
0.00 0.25 0.50 0.75 1.00 1.200
12,500
25,000
37,500
5,0000
6,2500
75,00080,000
Malonate External 103
Concentration (mg/L)
Area
(cou
nts*
min
)
0.000 0.025 0.050 0.0800
1,000
2,000
3,000
4,000
5,000
6,000
7,000Tartrate External 149
Concentration (mg/L)
Area
(cou
nts*
min
)
Figure 21. Malonate calibration curve ranging from 0.05 to 1 mg/L was constructed with the MS detector.
Figure 22. Tartrate calibration curve ranging from 0.002 to 0.075 mg/L was constructed with the MS detector.

14
If a stable isotope-labeled analog is used as the internal standard, which has identical chemical and structural properties to those of the analyte, the analyte and internal standard will behave identically not only during chromatography but also during sample preparation. Isotopic analogs are therefore the best choice of internal standard to reduce signal variability and improve precision. Using 13C-enriched succinate as the internal standard resulted in reliable quantification and high precision for succinate calibration (Figure 23A).
Figure 23. Succinate calibration curve ranging from 0.125 to 1 mg/L using the internal standard (A) and external methods (B)
0.00 0.20 0.40 0.60 0.80 1.00 1.200
100
200
300
400
500
600
700
800% ISTDSuccinate Internal '121' 117
Concentration (mg/L)
A
0.00 0.20 0.40 0.60 0.80 1.00 1.200
5,000
10,000
15,000
20,000
25,000Succinate External 117
Concentration (mg/L)
B
Area
(cou
nts*
min
)Ion suppressionThe matrix effect phenomenon, as the result of co-eluting sample components, can affect the detection capability, precision, and accuracy for the analytes of interest.9 Ion suppression appears as one particular manifestation of matrix effects, which is associated with influencing the extent of analyte ionization. This change often is observed as a loss in response, and thus the term ionization suppression. In our study, ion suppression has been found to occur between succinate and malate, especially at high concentrations. Experimentally determined ion intensities at different concentrations of succinate with malate in solution are shown in Figure 24. In these experiments, the concentration of succinate was kept constant (e.g. 0.125 ppm) and the concentration of malate was increased from 0 to 100 ppm. The plots obtained in Figure 24 illustrate how succinate’s intensity is suppressed by the presence of a second analyte malate, which coelutes with succinate. When the succinate concentration is 50 ppm, the loss of intensity is from 4.7% to 62.1% as the of malate concentration increases from 0 ppm to 100 ppm; this is the smallest decrease observed. When succinate concentration is 0.125 ppm, the intensity decrease is highest at 88% when the malate concentration is 100 ppm. Similarly, succinate also suppressed the ion intensity of malate (Figure 25). When malate concentration is above 10 ppm, and succinate concentration is below 10 ppm, the ion suppression is not severe in that the ion intensity of malate decreases between 0.5 and 6.1%. The highest loss of malate intensity is observed with 1 ppm malate and 50 ppm succinate, a 56% loss.
0
100,000
200,000
300,000
400,000
500,000
600,000
700,000
800,000
0 20 40 60 80 100
Succ
inat
e in
tens
ity (c
ount
s)
Malate concentration (mg/L)
0.125 mg/L succinate
1 mg/L succinate
10 mg/L succinate
50 mg/L succinate
Figure 24. Change of ion intensity of succinate at constant concentration when malate is increased at concentrations ranging from 0 to 100 mg/L

15
positives, and deliver accurate quantification of non-resolved analytes using their mass-to-charge ratios.
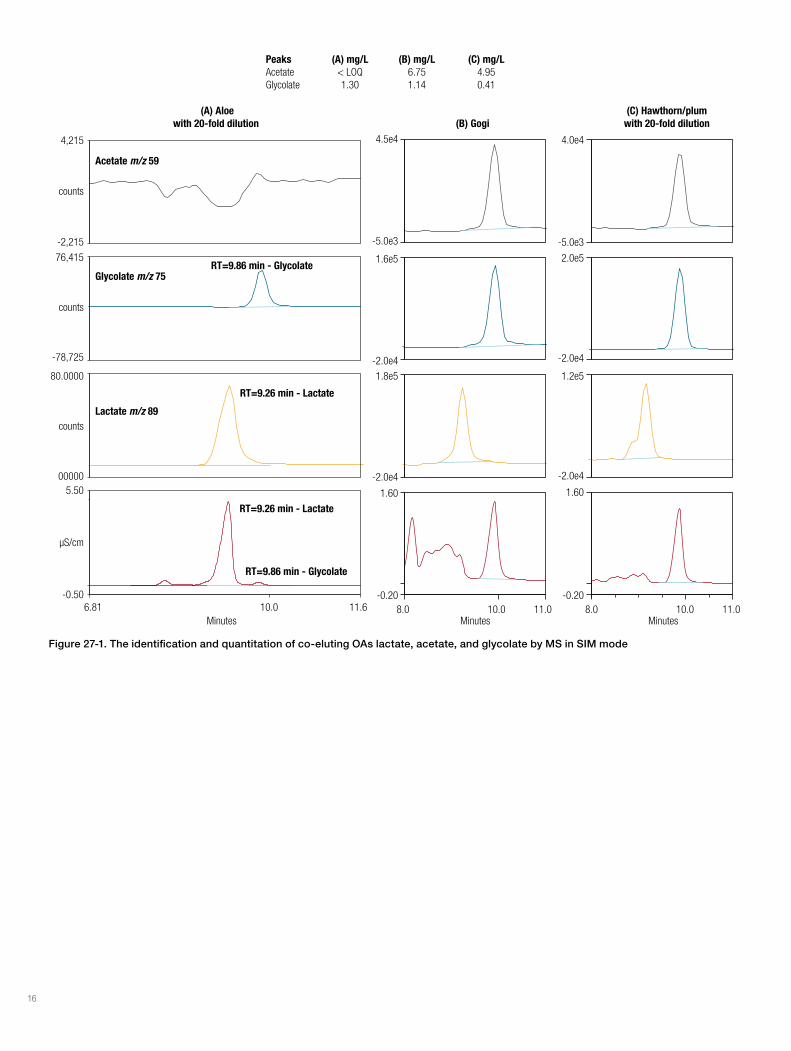
Figure 26 shows the analysis of aloe beverage with 20-fold dilution using Full Scan mode to identify OAs by comparing their retention times and mass spectra with those of reference substances. Figure 27 shows that the ISQ EC MS can deliver accurate quantification of co-eluting analytes in aloe, goji, and hawthorn/plum drinks using SIM mode. The MS data help to confirm the identities of OAs (Figures 27–29). There are differences in the organic acid compositions and contents of the herbal drink samples. Acetate was not detected by MS in the aloe drink, and acetate and glycolate were resolved by MS in SIM mode in gogi and hawthorn/plum drinks. The MS detector provided greater sensitivity for lactate than CD. Co-eluting OAs including malate/succinate and malonate/tartrate were well resolved by MS in SIM mode. The sensitivity of tartrate and malonate were increased with the MS detector. Quinate and fumarate were not detected by CD and MS in the aloe drink but were detected in the gogi and hawthorn/plum drinks.
Figure 25. Change of ion intensity of malate at constant concentration when succinate is increased at concentrations ranging from 0.125 to 50 mg/L
Figure 26. The identification of OAs using Full Scan mode by comparing their retention times (RT) and mass spectra with those of reference substances in aloe with 20-fold dilution
0
200,000
400,000
600,000
800,000
1,000,000
1,200,000
1,400,000
1,600,000
0 10 20 30 40 50
Mal
ate
inte
nsity
(cou
nts)
Succinate concentration (mg/L)
1 mg/L malate
10 mg/L malate
50 mg/L malate
100 mg/L malate
Sample analysisSample analysis was done in Full Scan and SIM modes to show that the ISQ EC MS can confirm the masses of chromatographic peaks, eliminate false negatives and
1.5 10.0 20.0 30.0 40.0 50.0 59.7-0.06
1.38
µS/c
m
Minutes
20 50 100 150 2000
50
100
120
89.1
179.1
Rev.
Inte
nsity
(%)
LactateRT=9.2 min
100 199
151.1
Full ms [20,000–200,000]
Mass [m/z]
20 50 100 150 2000
50
100
120
45.2
63.1
91.1
95.0
Formate RT=13.5 min
20 50 100 150 2000
50
100
12087.1
95.0105.1
175.0193.0
Pyruvate RT=18.1 min
20 50 100 1500
50
100
12089.1
Oxalate RT=38.7 min
20 50 1000
50
100
120
Citrate RT=49.2 min
21 50 150
75.1
0
50
100
120
GlycolateRT=9.8 min
Mass [m/z] Mass [m/z] Mass [m/z] Mass [m/z]
Mass [m/z]
Rev.
Inte
nsity
(%)
Rev.
Inte
nsity
(%)
Rev.
Inte
nsity
(%)
Rev.
Inte
nsity
(%)
Rev.
Inte
nsity
(%)
150 200
200
Full ms [20,000–200,000]Full ms [20,000–200,000]
Full ms [20,000–200,000] Full ms [20,000–200,000]
Full ms [20,000–200,000]
191.0
16
Figure 27-1. The identification and quantitation of co-eluting OAs lactate, acetate, and glycolate by MS in SIM mode
6.81 10.0 11.6-0.50
5.5000000
80.0000
-78,725
76,415
-2,215
4,215
Acetate m/z 59
Glycolate m/z 75
Lactate m/z 89
counts
counts
counts
µS/cm
RT=9.26 min - Lactate
RT=9.86 min - Glycolate
RT=9.86 min - Glycolate
RT=9.26 min - Lactate
8.0 10.0 11.0-0.20
1.60
-2.0e4
1.8e5
-2.0e4
1.6e5
-5.0e3
4.5e4
8.0 10.0 11.0-0.20
1.60
-2.0e4
1.2e5
-2.0e4
2.0e5
-5.0e3
4.0e4
Minutes
(C) Hawthorn/plumwith 20-fold dilution(B) Gogi
(A) Aloewith 20-fold dilution
MinutesMinutes
Peaks (A) mg/L (B) mg/L (C) mg/LAcetate < LOQ 6.75 4.95Glycolate 1.30 1.14 0.41

17
30.0 33.0
-5.0e3
3.0e4
-1.0e4
1.1e5
-5.0e4
2.5e5
-5.0e5
4.0e6
5.0e3
5.0e4
--1.0
9.0
30.0 33.0
-2.0e3
1.6e4
-1.0e4
8.0e4
-1.0e4
6.0e4
-2.0e5
1.8e6
1.0e4
6.0e4
--0.50
3.00
25.0 30.0 34.0
0.0e0
5.0e3-5.0e2
4.0e3
0.0e0
3.5e3
-2.0e5
1.4e6
1.0e4
6.0e4
-0.20
2.20
µS/cm
counts
counts
counts
counts
counts
m/z 61
m/z 133
m/z 103
m/z 117
m/z 149
RT: 31.65 min - Bicarbonate
RT: 30.82 min - Malate
RT: 32.22 min - Malonate
RT: 30.63 min - Succinate
RT: 32.20 min - Tartrate
? ? ?
(C) Hawthorn/plumwith 20-fold dilution(B) Gogi
(A) Aloewith 20-fold dilution
Peaks (A) mg/L (B) mg/L (C) mg/LMalate 7.42 42.89 11.05Succinate < LOQ 0.72 0.34Malonate < LOQ 0.63 0.16Tartrate 0.020 0.069 0.053
Minutes MinutesMinutes
Figure 27-2. The identification and quantitation of co-eluting OAs malate, malonate, bicarbonate, succinate, and tartrate by MS in SIM mode
The levels of all co-eluting OAs listed in Figure 27 were determined from their respective calibration curves by MS detection in SIM mode, except for succinate quantitation, which was determined by the internal standard method using 13C-enriched succinate.

18
0 10 20 30 40 50 60-2.0
16.0
-1,000,000
11,000,000-100000
800,000
-1000
6,000-5000
40,000
Minutes)
µS/cm
counts
counts
counts
countsm/z 87
m/z 45
m/z 89
m/z 191
RT: 49.32 min - Citrate
RT: 18.17 min - Pyruvate
RT: 13.60 min - Formate
RT: 9.2 min - Lactate
RT: 39.00 min - Oxalate
Lactate
Formate
Pyruvate
Oxalate
Citrate
(A) Aloe beverage with 20-fold dilution
Figure 28A. The identification of quinate, pyruvate, formate, lactate, oxalate, and citrate was confirmed by MS in aloe beverage with 20-fold dilution. Quinate was not detected by CD and MS.

19
0 10.0 20.0 30.0 40.0 50.0 60.0-5.0
55.0
-2.0e6
1.6e7
-5.0e4
3.5e5
-2.0e3
1.4e4
-1.0e4
1.0e5
counts
counts
counts
counts
Minutes
RT: 18.23 min - Pyruvate
RT: 13.65 min - Formate
RT: 9.22 min - Lactate
RT: 39.02 min - Oxalate
RT: 7.43 min - Quinate
RT: 49.30 min - Citrate
µS/cm
(B) Gogi drink
m/z 87
m/z 45
m/z 89
m/z 191
Figure 28B. The identification of quinate, pyruvate, formate, lactate, oxalate, and citrate was confirmed by MS in Gogi drinks.

20
0 10.0 20.0 30.0 40.0 50.0 60.0-5.0
30.0
-2.0e6
1.6e7
-2.0e4
2.0e5
-1.0e3
9.0e3
-1.0e4
1.0e5
Minutes
RT: 18.17 min - Pyruvatecounts
counts
counts
counts
µS/cm
RT: 13.62 min - Formate
RT: 9.16 min - Lactate
RT: 39.02 min - Oxalate
RT: 7.45 min - Quinate
RT: 49.26 min - Citrate
m/z 87
m/z 45
m/z 89
m/z 191
(C) Hawthorn/plum beverage with 20-fold dilution
Figure 28C. The identification of quinate, pyruvate, formate, lactate, oxalate, and citrate was confirmed by MS in Hawthorn/plum beverage with 20-fold dilution.

21
36.9 40.0 42.9-2.0e4
1.6e5
-2.0e3
1.2e4
0.04
0.24
µS/cm
counts
counts
RT: 38.89 min - Oxalate
37.0 40.0 41.0-5.0e4
3.5e5
-1.0e4
1.0e5
0.00
0.70
37.0 40.0 41.0-2.0e4
2.0e5
-1.0e3
1.0e4
0.00
0.35
RT: 39.64 min - Fumarate
(C) Hawthorn/plum beveragewith 20-fold dilution(B) Gogi drink
(A) Aloe beverage with 20-fold dilution
m/z 115
m/z 89
Minutes MinutesMinutes
Figure 29. The identification of oxalate and fumarate was confirmed by MS in (A) Aloe beverage with 20-fold dilution. Fumarate was not detectable by CD and MS. (B) Gogi drink, (C) Hawthorn/plum beverage with 20-fold dilution
ConclusionThis work uses a Dionex IonPac AS11-HC-4µm column on an Integrion IC system that electrolytically generated the eluent for separation coupled to an ISQ EC single quadrupole mass spectrometer. Co-eluting OAs including acetate/glycolate, malate/succinate, and malonate/tartrate were accurately quantified with MS detection. The results showed that this IC-MS method allows the accurate direct determination of OAs in aloe, hawthorn/
plum, and goji drinks, especially showing selectivity in detection for co-eluting OAs and confirmation of identity. The ISQ EC MS provides lower detection limits for most of organic acids except for formate and citrate than conductivity detection alone. A 13C-enriched succinate (13C4, M+4) internal standard (m/z 121) is recommended to be used for succinate quantitation to improve accuracy and ruggedness when ion suppression occurs.
©2018 Thermo Fisher Scientific Inc. All rights reserved. All trademarks are the property of Thermo Fisher Scientific and its subsidiaries unless otherwise specified. Peak is a trademark of Peak Scientific. Air-Tite and Norm-Ject are trademarks of Air-Tite Products Co., Inc. This information is presented as an example of the capabilities of Thermo Fisher Scientific products. It is not intended to encourage use of these products in any manners that might infringe the intellectual property rights of others. Specifications, terms and pricing are subject to change. Not all products are available in all countries. Please consult your local sales representatives for details. AN72808-EN 0918S
Find out more at thermofisher.com/ICMS
References1. Domingo, J., Gomez, M., Llobet, J., et al. J Toxicol Clin Toxicol. 1988, 26, 67–79.
2. Thermo Scientific Application Note 1157: Determination of Organic Acids in Kombucha Using a High-Pressure Ion Chromatography System. [Online] https://assets.thermofisher.com/TFS-Assets/CMD/Application-Notes/AN-1157-HPIC-Organic-Acids-Kombucha-AN72118-EN.pdf (accessed June. 25, 2018).
3. Thermo Scientific Application Brief 72363: Detection of common organic acids using a compact ion chromatography system coupled with mass spectrometry. [Online] https://assets.thermofisher.com/TFS-Assets/CMD/Application-Notes/AB-72363-IC-MS-Organic-Acids-AB72363-EN.pdf (access June. 25, 2018)
4. Thermo Fisher Scientific. Product Manual for Eluent Generator Cartridges. Doc. No 065018, Revision 05, Sunnyvale, CA, 2014.
5. Thermo Fisher Scientific. Product Manual for Continuously Regenerated Trap Columns (CR-TC). Doc. No 031910, Sunnyvale, CA, 2010.
6. Thermo Fisher Scientific. Product Manual for Dionex ERS 500 suppressor. Doc No 031956 Revision 11, 2017.
7. Thermo Fisher Scientific. ISQ EC Mass Spectrometer Operating Manual. Doc No. 1R120591-0002 Revision A, 2017.
8. Fisseha, R.; Dommen, J.; Sax, M.; Paulsen, D.; Kalberer, M.; Maurer, R.; Hofler, F.; Weingartner, E.; Baltensperger, U. Anal. Chem. 2004, 76, 6535−654.
9. Kebarle, P. and Tang, L. Anal. Chem. 1993, 65, 972A–86A.