determination of optimum height for counter flow cooling tower
TRANSCRIPT

Asian Journal of Applied Science and Engineering, Volume 2, No 2 (2013) ISSN 2305-915X
Copyright © 2012, Asian Business Consortium | AJASE Page 33
Determination of Optimum Height for Counter
Flow Cooling Tower
Ashraf Kotb
Department of Mechanical Power Engineering, Ain Shams University, Cairo, EGYPT
ABSTRACT
A model for counter flow cooling tower is present with treatments to recover the simplifications in the literature. The Bosnjakovic formula, mutative water and air properties are used to relax the constraints. The finite volumes of water and moist air are defined separately in opposite flow directions. Mass and energy balances are evaluated for control volume; heat and mass transfer are considered between control volumes. The model is validated with experimental data from literature. The model determines the cooling tower optimum height, evaporation rate and distribution of air and water temperatures, humidity, water flow and Lewis factor along the tower height. It is concluded that: the height is affected by the inlet air humidity; the heat transfer mode is dominated by evaporation, and Lewis factor ranges from 0.91 to 0.924. Key Words: Cooling Tower, Height, Evaporation Rate, Lewis Factor, One Dimensional
1 INTRODUCTION
cooling tower is heat rejection equipment. Its main function is to extract waste heat from warm water to the atmosphere. Heat rejection in cooling tower is specified as convection between the fine droplets of water and the surrounding air, and also as
evaporation which allows a small portion of water to evaporate into moving air, the process involves both heat and mass transfer. Cooling towers are widely used in the power generation units, refrigeration and air conditioning industries [1]. Cooling towers can be classified by the movement of water and air as counter-flow and cross-flow types. Moreover, they can also be classified by means of air flow into mechanical draft and natural draft types. A lot of work has been done for modeling cooling towers mathematically in the past century. Walker [22] proposed a basic theory of cooling tower operation. Merkel [15] developed the first practical theory including the differential equations of heat and mass transfer, which has been well received as the basis for most work on cooling tower modeling and analysis [1-10-5-18-14]. In Merkel‟ smodel, the Lew is factor is assumed as unity, this assumption may cause Merkel‟s model to underestimate the effective tower volume by 5-15% [20].The influence of the Lewis factor diminishes when the inlet ambient air is relatively hot and humid [8]. For
A

Asian Journal of Applied Science and Engineering, Volume 2, No 2 (2013) ISSN 2305-915X
Copyright © 2012, Asian Business Consortium | AJASE Page 34
increasing Lewis factor, the heat rejection rate increases, the water outlet temperature decreases and the water evaporation rate decreases [12]. Kroger [12] expressed the equation for the tower performance calculation using the Poppe method, which was developed for actual unsaturated and supersaturated air before exiting cooling towers. Furthermore, the influence of Lewis factor on the performance of wet cooling towers was proposed [8]. The results showed that it decreased when the inlet air was relatively hot and humid. The Lewis factor is proportional to the heat transfer rate. Jameel [7] and Thirapong [21] assumed Lewis factor to be unity, constant specific heats of air and water and constant heat and mass transfer coefficients. In Merkel‟s model, the water loss of evaporation is neglected in energy balance and saturated air at the exit. These assumptions made the results inaccurate. Zubair [24] investigated the performance characteristics through the counter-flow cooling tower, the results showed that a majority mode of heat transfer rate is evaporation, where it was 62.5% of the total heat transfer rate at the bottom and about 90% of that at the top of the tower. Since evaporation is by far the most effective factor in cooling towers, the accuracy of the predicted conditions are directly dependent on it. For this purpose, it is quite common to include the evaporation term in the model [16]. Most of the modeling results in the literature were validated with the experimental work of Simpson [19]; Xiao [23] validated the results with those of Simpson [19] for five experimental data. In this study, a mathematical model for the counter-flow cooling tower is introduced with several distinctive treatments to recover the most of the simplifications in the literature. First, the mutative water and air specific heats are used to relax the constraints. Second, instead of considering the Lew is factor to be unity, the formulation in Bosnjakovic [3] is applied. Thirdly, the finite volume method is applied, where the control volumes of water and moist air are defined separately, with opposite flow directions. Mass and energy balances are evaluated for each control volume, and the heat and mass transfer are considered between each pair of the water and moist-air control volumes. The steady-state performance of the proposed model is validated with experimental data from literature. The mathematical model solution determines the optimum height of the cooling tower, evaporation rate and distribution of air temperature, relative humidity, water temperature, water flow rate and Lewis factor along the cooling tower height.
2 MATHEMATICAL MODEL
The processes of heat and mass transfer through the counter-flow cooling tower (Figure 1 A) are mathematically modeled with the finite volume method. The control volume is shown in Figure1 B, C for water and moist air where the flows are in opposite directions. The modeling methodology is governed by the following assumptions [2-9-13]:
1. One-dimensional flow. 2. Steady-state and steady flow conditions. 3. Uniform cross-sectional area. 4. Heat and mass transfer are in the direction normal to the water/air flow only. 5. Heat and mass transfer through the tower walls to the surroundings are negligible. 6. Heat transfer from the forced/induced draft fan to air and water is neglected. 7. Water loss by drift is negligible. 8. The process is isobaric at standard atmospheric value. 9. Potential and kinetic energies are neglected.

Asian Journal of Applied Science and Engineering, Volume 2, No 2 (2013) ISSN 2305-915X
Copyright © 2012, Asian Business Consortium | AJASE Page 35
Figure 1:
A. Schematic Representation of Cooling Tower. B. Model of Cooling Tower.
C. Control volume of counter flow cooling tower
2.1 GOVERNING EQUATIONS
The conservation of mass flow rates for the dry air, moisture content and water through the control volume yields:
)md-m(mdx)(xmmmxm w
.
w
.
a
.
a
.
w
.
a
.
a
.
(1)
The conservation of mass flow rates for the control volume verifies that; the mass transfer appears in decreasing the water flow rate and increasing the moisture content of the air as a result of evaporation as in Equation (2):
dxmmd a
.
w
.
(2)
Also, the mass transfer flow rate from the water as a result of evaporation into the air is re-expressed by the definition of the mass transfer coefficient and the difference in the concentrations of the moisture content of the air as in Equation (3) [16]:
dV x)-(x a ρ hdxm satcama
.
(3)
Since, the control volume is defined as:dH AdV , Then Equation (3) is simplified to
be in the form of Equation (4):
x)-(x
m
A a ρ h
dH
dxsat
a
.
cam (4)
The conservation of energy rates for moist air and water through the control volume yields:

Asian Journal of Applied Science and Engineering, Volume 2, No 2 (2013) ISSN 2305-915X
Copyright © 2012, Asian Business Consortium | AJASE Page 36
)dh)(hmdm()dh(hmhmhm www
.
w
.
aaa
.
aa
.
ww
.
(5)
Neglecting the second order derivatives )0dh m(d ww
.
which simplify Equation (5)
to Equation (6):
w
.
www
.
aa
.
mdhdhmdhm (6)
By inserting Equation (2) into Equation (6) leads to Equation (7).
dx mhdhmdhm a
.
www
.
aa
.
(7)
Equation (7) contains three terms, the first term aa
.
dh mwhich represents the total rate of
heat transferred to the moist air, while the second term ww
.
dh m represents the rate of
heat transfer from the water to the air and appears as sensible heating, on the other hand,
the third term dx m h a
.
w represents the rate of heat transfer from the water to the air and appears as a humidification. Therefore, one can say that; the rate of heat transferred from the falling water to uprising air is transferred as a result of convection and is associated with mass transfer from water to air as in Equation (8):
mcaa
.
dQdQdhm (8)
While, the rates of heats transfer by convection and evaporation are re-written as in Equation (9):
dV h x)(x a ρ hdV )T(T a hdhm vsatcamawccaa
.
(9)
Equation (9) is simplified to be:
x)(x
m
h A a ρ h )T(T
m
A a h
dH
dhsat
a
.
vcamaw
a
.
cca (10)
Using both Lewis factor aam
c
Cp ρ h
hLe
and the cooling tower characteristics
cam a ρ hKa , then Equations (4) and (10) are re-written as follows:
x)-(x
m
AKa
dH
dxsat
a
.
(11)

Asian Journal of Applied Science and Engineering, Volume 2, No 2 (2013) ISSN 2305-915X
Copyright © 2012, Asian Business Consortium | AJASE Page 37
vsatawa
a
.
a h x)(x )T(T Cp Le
m
AKa
dH
dh
(12)
Equation (7) is re-written as follows:
dxhdh
C m
mdT wa
ww
.
a
.
w (13)
The set of Equations (2), (11), (12) and (13) govern the processes of heat and mass transfer through the counter-flow cooling tower. 2.2 Lewis Factor and Cooling Tower Characteristics The governing Equations (11) and (12) contain both Lewis factor and the cooling tower characteristics. 2.2.1 Lewis Factor
Lewis factor is an indication of the relative rates of heat and mass transfer in an evaporative process. Bosnjakovic [3] developed an empirical relation for the Lewis factor for unsaturated air–water vapor systems as in Equation (14).
0.622x/0.622xln
10.622x/0.622x865.0Le
sat
sat667.0
(14)
2.2.2 Cooling Tower Characteristics The cooling tower characteristic, a “degree of difficulty” to cooling is represented by the Merkel Equation [4]as in Equation (14):
HWT
CWT aa\
w
.
whh
dT
m
VKa
(15)
The Merkel Equation primarily says that at any point in the tower, heat and water vapor are transferred into the air due to (approximately) the difference in the enthalpy of the air at the surface of the water and the main stream of the air. Thus, the driving force at any point is the vertical distance between the two operating lines. Therefore, the performance demanded from the cooling tower is the inverse of this difference. 2.3 Psychometrics and Thermo physical Properties
The cooling tower is an air breathing thermodynamic system, where its performance is affected by the conditions of the ambient air. Mathematical modeling of cooling tower has to consider the psychometrics of air, for both the dry air and its associated water vapor; the main properties such as pressures; temperatures, and enthalpies have to be well defined also the relative humidity and moisture content.

Asian Journal of Applied Science and Engineering, Volume 2, No 2 (2013) ISSN 2305-915X
Copyright © 2012, Asian Business Consortium | AJASE Page 38
The saturation pressure (Pa) of water vapor in the dry air at the given temperature is a function only of temperature (K) and can be calculated from Equation (16) [6]:
5i
0i6
1iis ln(T)CTC)ln(P
(16)
For the temperature range of 173.16 T 273.15 K
Co C1 C2 C3
-5.6745359x10³ 6.3925247 -9.6778430x10⁻³ 6.2215701x10⁻⁷
C4 C5 C6
2.0747825x10⁻⁹ -9.4840240x10⁻¹³ 4.1630159
For the temperature range of 273.16 T 473.15 K
Co C1 C2 C3
-5.8002206x10³ 1.3914993 -4.8640239x10⁻² 4.1764768x10⁻⁵
C4 C5 C6
-1.4452093x10⁻⁸ 0 6.5459673
Relative humidity (%) is the ratio of the moist air‟s absolute humidity to the absolute humidity of saturated air at the same temperature and it is formulated as in Equation (17).
s
v
P
P 100
(17)
The moisture content of a given moist air sample is defined as the ratio of the mass of water vapor to the mass of dry air contained in the sample as in Equation (18).
v
v
P-P
P 62198.0x
(18)
For lower pressures, the specific enthalpy of water vapor (J/kg) is approximately linear function of temperature (oC) as in Equation (19) [17]:
T Cp2501300h vv (19)
The specific heat of water vapor(J/kg.K) is a function of temperature as follows [11].
6-135-103v Tx1091332.5 Tx1046784.2T 31334.210x 1.3605 Cp
The specific enthalpy of moist air (J/kg) is approximately linear function of temperature (oC) as in Equation (20) [17]:
vaa hx T Cph
(20) The specific heat of dry air(J/kg.K) is a function of temperature as follows [11].
3-72-4-13a T02.705209x1- T07.083814x1T 10x 3.161783-10x 1.045356 Cp
Also, the specific heat of water (J/kg.K) is a function of temperature as follows [11].
6-132-23w T2.17582x10 T5.11283x10T 2.80627x10108.15599x C

Asian Journal of Applied Science and Engineering, Volume 2, No 2 (2013) ISSN 2305-915X
Copyright © 2012, Asian Business Consortium | AJASE Page 39
2.3 Numerical Formulation The mathematical model is numerically formulated based on the explicit scheme. Where the cooling tower is divided into equal numbers of control volumes (nmax), the first control volume (I=1) represents the lower boundary conditions at the air entrance level; the last control (I=nmax) represents the upper boundary conditions at the air exit level. Therefore, Equations (2), (11), (12) and (13) are respectively numerically formulated as follows:
1-I1-Isat
a
.1-II x-x
m
ΔH AKa x x
(21)
1Iv1-I1Isat1-Ia1Iw1-Ia1-I
a
.1Ia Ia h xx TT Cp Le
m
ΔH AKa hh
(22)
xxhhh
C m
mTT 1II1Iw1IaIa
w
1-I
w
.
a
.
1IwIw
(23)
1IIa
.
1I
w
.
I
w
.
xxmmm
(24)
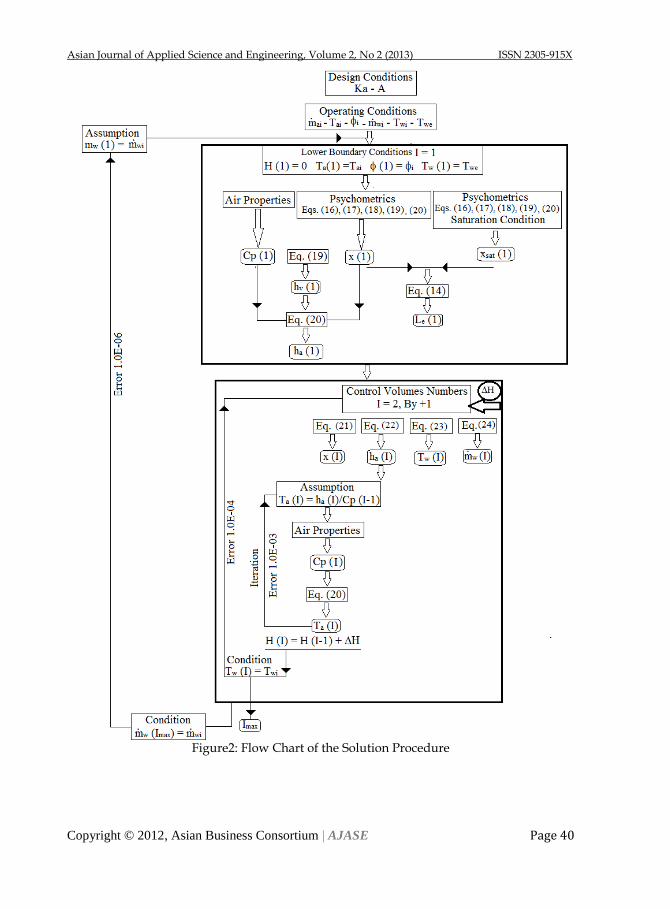
Equations (21), (22), (23) and (24) are applied for the control volumes where (I) varies from (2) to (nmax-1). The solution procedure is based on the problem statement, where for the known design and operating conditions as illustrated in Table (1) are well known, while the solution is prepared and proceeds to determine the optimum height of the cooling tower, evaporation rate and distribution of air temperature, relative humidity, water temperature, water flow rate and Lewis factor along the cooling tower height. Therefore, the flow chart of the solution procedure is shown in Figure 2, and a computer program is constructed in VISUAL FORTRAN environment.
Table 1: Illustration of Design and Operating Conditions
Design Conditions Operating Conditions
A Ka
a
.
m aiT iφ iw
.
m wiT weT
Asian Journal of Applied Science and Engineering, Volume 2, No 2 (2013) ISSN 2305-915X
Copyright © 2012, Asian Business Consortium | AJASE Page 40
Figure2: Flow Chart of the Solution Procedure
Asian Journal of Applied Science and Engineering, Volume 2, No 2 (2013) ISSN 2305-915X
Copyright © 2012, Asian Business Consortium | AJASE Page 41
3 MODEL SOLUTION
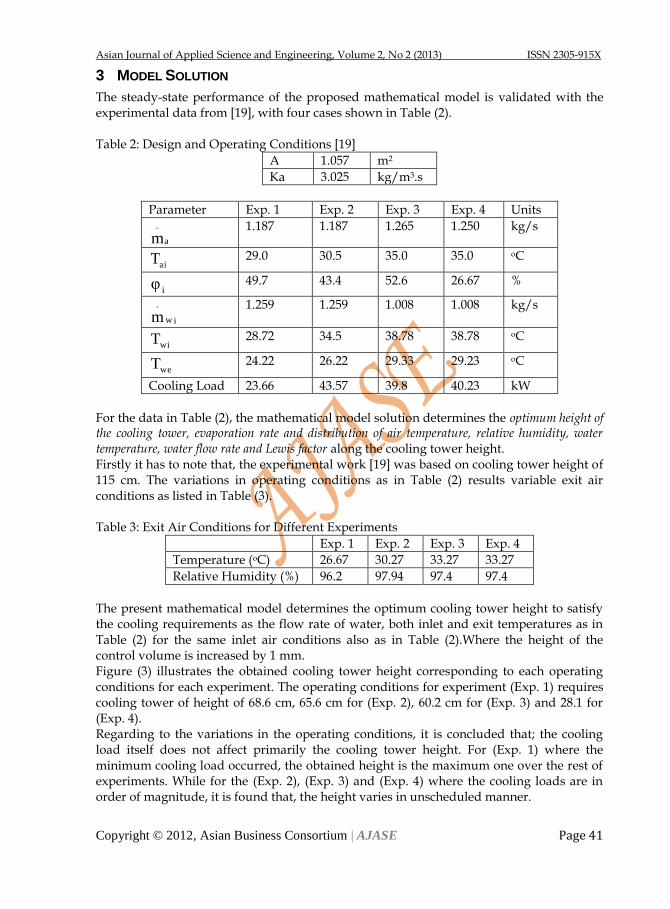
The steady-state performance of the proposed mathematical model is validated with the experimental data from [19], with four cases shown in Table (2). Table 2: Design and Operating Conditions [19]
A 1.057 m2
Ka 3.025 kg/m3.s
Parameter Exp. 1 Exp. 2 Exp. 3 Exp. 4 Units
a
.
m 1.187 1.187 1.265 1.250 kg/s
aiT 29.0 30.5 35.0 35.0 oC
iφ 49.7 43.4 52.6 26.67 %
iw
.
m 1.259 1.259 1.008 1.008 kg/s
wiT 28.72 34.5 38.78 38.78 oC
weT 24.22 26.22 29.33 29.23 oC
Cooling Load
23.66 43.57 39.8 40.23 kW
For the data in Table (2), the mathematical model solution determines the optimum height of the cooling tower, evaporation rate and distribution of air temperature, relative humidity, water temperature, water flow rate and Lewis factor along the cooling tower height. Firstly it has to note that, the experimental work [19] was based on cooling tower height of 115 cm. The variations in operating conditions as in Table (2) results variable exit air conditions as listed in Table (3). Table 3: Exit Air Conditions for Different Experiments
Exp. 1 Exp. 2 Exp. 3 Exp. 4
Temperature (oC) 26.67 30.27 33.27 33.27
Relative Humidity (%) 96.2 97.94 97.4 97.4
The present mathematical model determines the optimum cooling tower height to satisfy the cooling requirements as the flow rate of water, both inlet and exit temperatures as in Table (2) for the same inlet air conditions also as in Table (2).Where the height of the control volume is increased by 1 mm. Figure (3) illustrates the obtained cooling tower height corresponding to each operating conditions for each experiment. The operating conditions for experiment (Exp. 1) requires cooling tower of height of 68.6 cm, 65.6 cm for (Exp. 2), 60.2 cm for (Exp. 3) and 28.1 for (Exp. 4). Regarding to the variations in the operating conditions, it is concluded that; the cooling load itself does not affect primarily the cooling tower height. For (Exp. 1) where the minimum cooling load occurred, the obtained height is the maximum one over the rest of experiments. While for the (Exp. 2), (Exp. 3) and (Exp. 4) where the cooling loads are in order of magnitude, it is found that, the height varies in unscheduled manner.

Asian Journal of Applied Science and Engineering, Volume 2, No 2 (2013) ISSN 2305-915X
Copyright © 2012, Asian Business Consortium | AJASE Page 42
One can deduce that, the parameter that mainly affects the cooling tower height is the relative humidity of the inlet air. It is illustrated from the operating conditions that for the first three experiments; the inlet air relative humidity are close, but the case is different for (Exp. 4), where the inlet air relative humidity is 26.67 % which is much lower than the corresponding values for the first three experiments and the corresponding obtained height is the much lower and it is 28.1 cm. Therefore, the present results recommend designers to have much more attention about the sensitivity of the cooling tower height to the inlet air relative humidity. Figure (4) illustrates the distribution of the dry bulb temperature of air along the cooling tower height for the four experiments. The distribution profile shows that, the temperature is decreased to certain height of the cooling tower followed by an increase till the exit of the cooling tower. The obtained profile for the temperature distribution along the height of cooling tower is identical to that found in the literature [21] as in Figure (5). Figure (6) illustrates the distribution of the water temperature along the cooling tower height for the four experiments. The distribution profile shows that, the temperature is decreased from the inlet to exit follows the counter flow schedules. It is noted that, the present model obeys the operating conditions such as the inlet and exit water temperatures. Figure (7) combines both Figure (4) and Figure (6) together, for each experiment, both the air and water temperature profiles intersect at a point somewhere through the cooling tower height. This intersection causes the profile of air temperature as in Figure (4). Before this intersection point, the water temperature is less than the air temperature, which causes transfer of heat from air to water. While after this intersection point, the water temperature is higher than the air temperature, which causes transfer of heat from water to air. Then, one can say that, the convection heat transfer may occur in both opposite and normal directions. But as the convection heat varies in the transfer direction, the evaporation heat transfer which is indicated in terms of relative humidity of air recovers the convection effect when the transfer is in the opposite direction. This is illustrated in Figure (8), which illustrates the increase in the air relative humidity of air along over the cooling tower height. Then, it is concluded that the heat transfer mode in the cooling tower is dominated by the evaporation heat transfer. Figure (9) illustrates the distribution of water flow rate along the cooling tower height, as illustrated the water flow rate is decreased from its inlet at the top of the cooling tower to the exit from the bottom of the cooling tower. This decrease occurs as a result of continuous evaporation from the water to the air. The total rate of evaporated water to the air is shown in Figure (10) for the four experiments. As mentioned in the literature, one of the modeling enhancements is to consider the variation in Lewis number which shown in Figure (11) along the cooling tower height for the four experiments. But it is also noted that, the one dimensional consideration of Lewis number and for the operating conditions, one can deduce that, the Lewis number is in the range of 0.91 to 0.924.

Asian Journal of Applied Science and Engineering, Volume 2, No 2 (2013) ISSN 2305-915X
Copyright © 2012, Asian Business Consortium | AJASE Page 43
Figure 3: Cooling Water Height for Different Experimental Conditions.
Figure 4: Distribution of Air Temperature along the Height of the Cooling Tower for Different Experimental Conditions.
Figure 5: Temperature Profiles of Water and Air, and Humidity Ratio throughthe Cooling Tower [23] Tdb: Dry bulb Temperature Twb: Wet Bulb Temperature Tw: Water Temperature : Humidity ratio

Asian Journal of Applied Science and Engineering, Volume 2, No 2 (2013) ISSN 2305-915X
Copyright © 2012, Asian Business Consortium | AJASE Page 44
Figure 6: Distribution of Water Temperature along the Height of the Cooling Tower for Different Experimental Conditions.
Figure 7: Distribution of Air and Water Temperature along the Height of the Cooling Tower for Different Experimental Conditions.

Asian Journal of Applied Science and Engineering, Volume 2, No 2 (2013) ISSN 2305-915X
Copyright © 2012, Asian Business Consortium | AJASE Page 45
Figure8: Distribution of Air Relative Humidity along the Height of the Cooling Tower for Different Experimental Conditions.
Figure9: Distribution of Water Flow Rate along the Height of the Cooling Tower for Different Experimental Conditions.
Figure 10: Water Evaporation Rate for Different Experimental Conditions.

Asian Journal of Applied Science and Engineering, Volume 2, No 2 (2013) ISSN 2305-915X
Copyright © 2012, Asian Business Consortium | AJASE Page 46
Figure11: Distribution of Lewis Number along the Height of the Cooling Tower for Different Experimental Conditions.
4 CONCLUSIONS
The present mathematical model for the counter-flow cooling tower is validated with experimental data and it is concluded that: 1. The cooling load does not affect primarily the cooling tower height. 2. The cooling tower height is mainly affected by the relative humidity of the inlet air. 3. The heat transfer mode in the cooling tower is dominated by the evaporation heat
transfer. 4. Lewis factor is in the range from 0.91 to 0.924.
REFERENCES
[1] ASHRAE Handbook, “HVAC Systems and Equipment (SI)”, American Society of Heating, Refrigeration and Air Conditioning Engineers, Inc.. ASHRAE (2008).
[2] Bendapudi, S., Braun, J. E., and Groll, E. A.,“A Comparison of Moving-Boundary and Finite-Volume Formulations for Transients in Centrifugal Chillers”, International Journal of Refrigeration 31: 1437-1452. (2008).
[3] Bosnjakovic F., “Technische Thermodinamik”, Theodor Steinkopf, Dresden, (1965). [4] Donald R. Baker, Howard A. Shryock, „A Comprehensive Approach to the Analysis of
Cooling Tower Performance”, Technical Bulletin, R-61-P-13, Journal o Heat Transfer, August (1961).
[5] Elsarrag, E., “Experimental Study and Predictions of An Induced Draft Ceramic Tile Packing Cooling Tower”, Energy Conversion and Management 47: 2034-2043. (2006).
[6] Hyland R. W., Wexler J., “Formulations for the Thermodynamic Properties of the Saturated Phases of H2O from 173.15 K to 473.15 K”, ASHRAE Transactions, 89(2A), 500–519, (1983).
[7] Jameel Ur, Rehman Khan, M. Yaqub, Syed M. Zubair,“Performance Characteristics of Counter Flow Wet Cooling Towers”, Energy Conversion andManagement 44 2073–2091,(2003).
[8] Johannes C. Kloppers, Detlev G. Kröger, “The Lewis factor and its influence on the performance prediction of wet-cooling towers”, International Journal of Thermal Sciences 44 879–884, (2005).

Asian Journal of Applied Science and Engineering, Volume 2, No 2 (2013) ISSN 2305-915X
Copyright © 2012, Asian Business Consortium | AJASE Page 47
[9] Khan JR, Zubair SM., “An improved design and rating analyses of counter flow wet cooling towers”. ASME J Heat Transf;123:770–8,(2001)
[10] Khan, J.-U.-R., Yaqub, M., and Zubair, S. M., “Performance Characteristics of Counter Flow Wet Cooling Towers”. Energy Conversion and Management 44: 2073-2091. (2003).
[11] Kroger D. G., “Air Cooled Heat Exchangers and Cooling Towers”, PennWell Corp., Tulsa, Oklahoma, 2004.
[12] Kroger D.G., Kloppers J.C., “Cooling tower performance evaluation: markel, poppe, and e-NTU methods of analysis”, ASME Journal of Engineering for Gas Turbines and Power 127 (2005) 1–7.
[13] Kuehn T. H., Ramsey J. W., Threlkeld J. L., “Thermal Environmental Engineering”, third ed., Prentice-Hall, New Jersey, 1998.
[14] Lucas, M., Martinez, P. J., and Viedma, A., Experimental Study on The Thermal Performance of A Mechanical Cooling Tower with Different Drift Eliminators. Energy Conversion and Management 50: 490-497. (2009).
[15] Merkel, F. Verdunstungskuhlung, VDI Forschungsarbeiten, Berlin, No. 275. (1925). [16] Osterle F., “On the analysis of counter-flow cooling towers”, International Journal of Heat
and Mass Transfer 34 (1991) 1316–1318. [17] PSYCHROMETRICS, IN ASHRAE HANDBOOK, 1989. [18] Qureshi, B. A. and S. M. Zubair “A Complete Model of Wet Cooling Towers with Fouling
in Fills”. Applied Thermal Engineering 26: 1982-1989. (2006). [19] Simpson, W. M. and T. K. Sherwood Performance of Small Mechanical Draft Cooling
Towers. Refrigerating Engineering 52(6): 535-543, 574-576. (1946). [20] Sutherland, J. W. Analysis of Mechanical-Draught Counterflow Air/Water Cooling
Towers. ASME Transactions Journal of Heat Transfer 105:576-583. (1983). [21] Thirapong Muangoi, WanchaiAsvapoositkul, SomachaiWongwises, “An Exergy Analysis
on the Performance of a Counterflow Wet Cooling Tower”, Elsevier, 2006. [22] Walker, W. H., Lewis, W. K., and Mcadams, W. H., “Principles of Chemical Engineering”.
New York, McGraw-Hill (1923).. [23] Xiao Li1, Yaoyu Li, and John E. Seem, “DYNAMIC MODELING OF MECHANICAL
DRAFT COUNTER-FLOW WET COOLING TOWER WITH MODELICA” Fourth National Conference of IBPSA-USA New York City, New York August 11 – 13, 2010 SimBuild 193:200
[24] Zubair S. M., Khan J.R., Yaqub M., “Performance characteristics of counter flow wet cooling towers”, Energy Conversion and Management 44 (13) (2003) 2073–2091.
Asian Business Consortium is an independent research house committed to publishing and delivering superior, Peer-reviewed standard research
AJASE? www.ajase.weebly.com
High quality editorial board
Rigorous and rapid peer review
Open Access & high citation rate
Will apply for ISI track in the near future