determination of olefi n content in gasoline according to ... · determination of olefi n content...
TRANSCRIPT

Determination of Olefi n Content in Gasoline According to ASTM D6550
Application Note
AuthorsMartina Noll-Borchers, Timo HölscherSIM Scientifi c Instruments Manufacturer GmbHOberhausen, Germany
Energy & Chemicals
AbstractThis Application Note demonstrates the determination of the olefi n content in gasoline using the Agilent 1260 Infi nity Analytical SFC System with the SIM Flame Ionization Detector (FID). Combining the SFC system with this FID meets all requirements of the ASTM D6550 method such as the required retention time precision for time-based column switching, good area precision, and calibration function.
Edgar Naegele, Markus BeckerAgilent Technologies, Inc.Waldbronn, Germany

2
The complete solution can be ordered through SIM Scientifi c Instruments Manufacturer GmbH, Oberhausen, Germany.
Analytical columnPursuit XRs 5 Si, 4.6 × 250 mm (p/n A6006250X046)
ChromSpher 5 Lipids (silver loaded), 4.6 × 30 mm (G7601-85000)
SoftwareAgilent OpenLab CDS ChemStation Edition, Rev. C.01.05
SFC/FID confi gurationThe outlet of the column is connected to the upper T-piece to the FID (Figure 1). For purging the backpressure regulator (BPR), hexane is permanently pumped from pump head B of the binary pump. To maintain constant backpressure and a continuously operating system, a restriction capillary is integrated between pump head B and the lower T-piece of the FID.
ExperimentalInstrumentationAn Agilent 1260 Infi nity Analytical SFC System with the following confi guration was used:
• Agilent 1260 Infi nity Binary SFC Pump
• Two Agilent 1290 Infi nity Thermostatted Column Compartments with valve drives and 2-position/6-port Quick-Change valves
• Agilent 1260 Infi nity SFC Control Module
• CTC Analytics LC-Injector HTC PAL (50 cm width) modifi ed with 4-port valve (internal 0.5 µL loop) and DLW
• SIM Flame Ionization Detector
• Restrictor for hexane purging path: PEEKsil, 100 µm id, 20 cm
IntroductionOlefi nic hydrocarbons present in gasoline contribute to photochemical reactions in the atmosphere. This results in the formation of photochemical smog in susceptible urban areas. A specifi cation of the maximum allowable limit of olefi ns in motor gasoline was defi ned by the California Air Resources Board (CARB)1. An appropriate analytical test method that can be used by regulators and producers2 for the determination of total olefi ns is described in ASTM D6550.
SIM Scientifi c Instruments Manufacturer GmbH (Germany) has developed a fl ame ionization detector (FID) for the Agilent 1260 Infi nity Analytical SFC System to enhance the range of applications, for example, to meet petrochemical requirements described in ASTM method D5186. The starting point of the FID development was the determination of aromatic compounds in diesel fuels, as published in ASTM method D5186. The system performance could be verifi ed according to the requirements in this test method that enables the separation of mono- and polynuclear aromatics in fuel samples using a FID3,4.
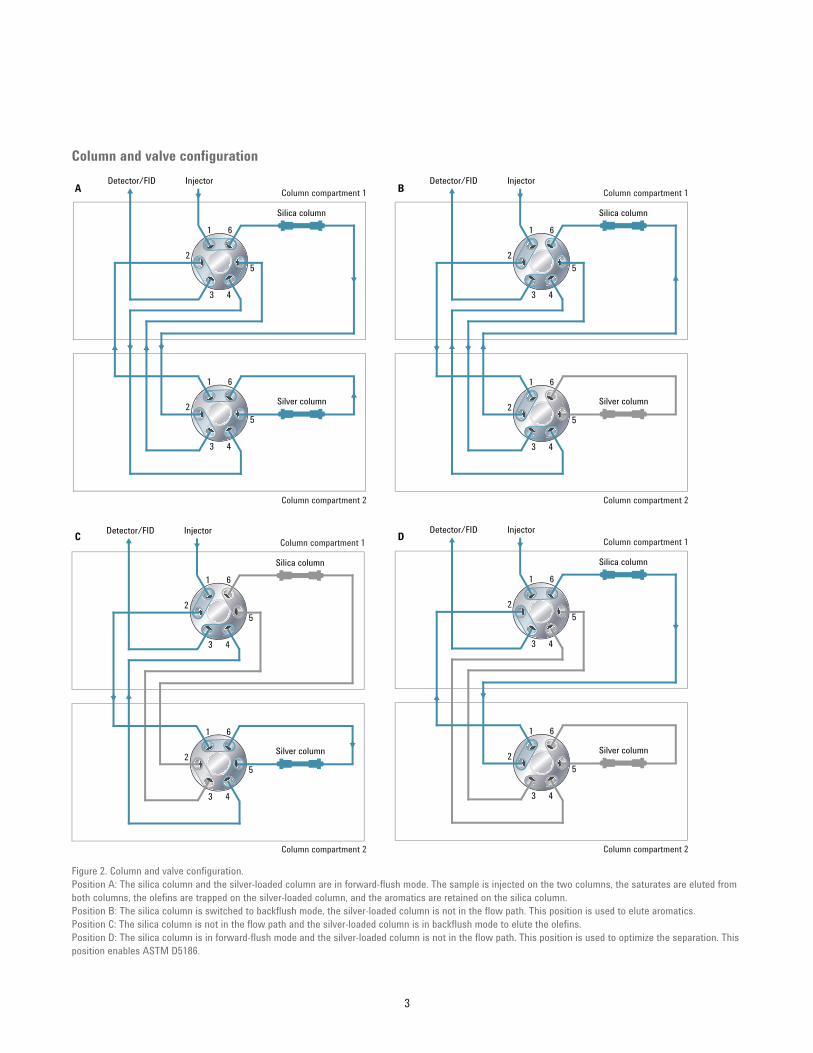
This Application Note demonstrates the determination of the olefi n content in gasoline using the 1260 Infi nity Analytical SFC System with the SIM FID. The ASTM D6550 requires an SFC analysis with a set of two chromatographic columns connected in series, and a valve switching solution. Together with specifi ed column switching times, the olefi ns can be separated and quantifi ed. The fi rst column is packed with high-surface-area silica particles, and the second column contains silver ions. In the forward-fl ow mode, saturates pass through both columns, whereby the olefi ns are trapped on the silver-loaded column, and the aromatics and oxygenates are retained on the silica column. Aromatic compounds and oxygenates are then eluted from the silica column to the detector in backfl ush mode. Finally, the olefi ns are backfl ushed from the silver-loaded column to the detector. Figure 1. Connection of the SFC/FID module with the LC instrument.
From column (eluent flow)
From pump head B (hexane purge flow) through restriction
FID
3
Column and valve confi guration
A
C D
B
6
Silica column
InjectorDetector/FIDColumn compartment 1
1
2
3 4
5
Silver column
61
2
3 4
5
6
Silica column
InjectorDetector/FIDColumn compartment 1
Column compartment 2 Column compartment 2
Column compartment 2
1
2
3 4
5
61
2
3 4
5
Silver column
6
Silica column
InjectorDetector/FIDColumn compartment 1
Column compartment 2
1
2
3 4
5
61
2
3 4
5
Silver column
6
Silica column
InjectorDetector/FIDColumn compartment 1
1
2
3 4
5
61
2
3 4
5
Silver column
Figure 2. Column and valve confi guration.Position A: The silica column and the silver-loaded column are in forward-fl ush mode. The sample is injected on the two columns, the saturates are eluted from both columns, the olefi ns are trapped on the silver-loaded column, and the aromatics are retained on the silica column.Position B: The silica column is switched to backfl ush mode, the silver-loaded column is not in the fl ow path. This position is used to elute aromatics.Position C: The silica column is not in the fl ow path and the silver-loaded column is in backfl ush mode to elute the olefi ns.Position D: The silica column is in forward-fl ush mode and the silver-loaded column is not in the fl ow path. This position is used to optimize the separation. This position enables ASTM D5186.

4
SFC MethodAgilent 1260 Infi nity Binary SFC PumpSolvent A CO2 (precompressed), 99.998 %Solvent B Hexane, 0.5 % (used for purging the BPR only, not used as eluent). Depending on the composition of the sample, it might be
necessary to purge the BPR with a higher amount of hexane (for example, setting in the software to 50 % eluent B) from time to time. Flow rate 2.2 mL/minAgilent 1260 Infi nity SFC Control ModuleBPR temperature 25 °CBPR pressure 150 barAgilent 1290 Infi nity Thermostatted Column CompartmentColumn temperature silica column
25 °C
Column temperature silver-loaded column
80 °C
Valve positions (Figure 2)Valve position A At 0 minutesValve position B At 2.0 minutesValve position A At 6 minutesValve position C At 6.5 minutesCTC Analytics LC-Injector HTC PALInjection volume 0.5 µL (loop)Injection cycle Preclean with solvent 1 (hexane) 1
Preclean with sample 1Filling speed (µL/s) 10Filling strokes 3Inject to LC Vlv1Injection speed (µL/s) 5Pre-inject delay (ms) 500Post inject delay (ms) 500Post clean with solvent 1 (hexane) 2Valve clean with solvent 1 1 (all other parameters not listed are set to zero)
FIDTemperature 300 °CGases Hydrogen (H2) 50 mL/min
Air 500 mL/minMake-up gas (N2) 50 mL/min
5
Chemicals and solutionsSamples and standards were prepared according to guidance published in the ASTM method.
Component DescriptionFID gases Hydrogen, air, and nitrogen (as make-up gas)Eluent Carbon dioxide (purity > 99.998 %, pressurized in a cylinder without DIP tube according to the specifi cations of the SFC module)Purge solution for backpressure regulator
Hexane (not used as modifi er, pumped with channel B of the binary pump)
Performance Test Mixture (PTM)
Quantitative mixture prepared according to section 7.7 of the ASTM method from fi ne chemicals (Sigma-Aldrich) with the following composition (approximate values):80 mass% hexane (n-C6)10 mass% toluene (T)10 mass% 3-methyl-2-pentene, cis/trans-mixture (3M2PE)
Calibration mixture A) Quantitative mixture prepared from fi ne chemicals (Sigma-Aldrich) with the following composition (approximate values):70 mass% hexane (n-C6)10 mass% toluene (T)20 mass% 3-methyl-2-pentene, cis/trans-mixture (3M2PE)
B) Quantitative mixture prepared according to section 8.2.4 of the ASTM method from fi ne chemicals (Sigma-Aldrich) with the following composition (approximate values):70 mass% gasoline20 mass% mixture of olefi ns (for example, Olefi n Mix, Sigma-Aldrich p/n 44589, suitable for ASTM methods)10 mass% toluene (T)
These stock solutions were diluted in a 1:2 pattern down to 1.25 % olefi n with gasoline: olefi n content 20, 10, 5, 2.5, 1.25 mass%.Petrol (gasoline) Puriss., b.p. 90–100 °CGasoline Obtained from a local gas station
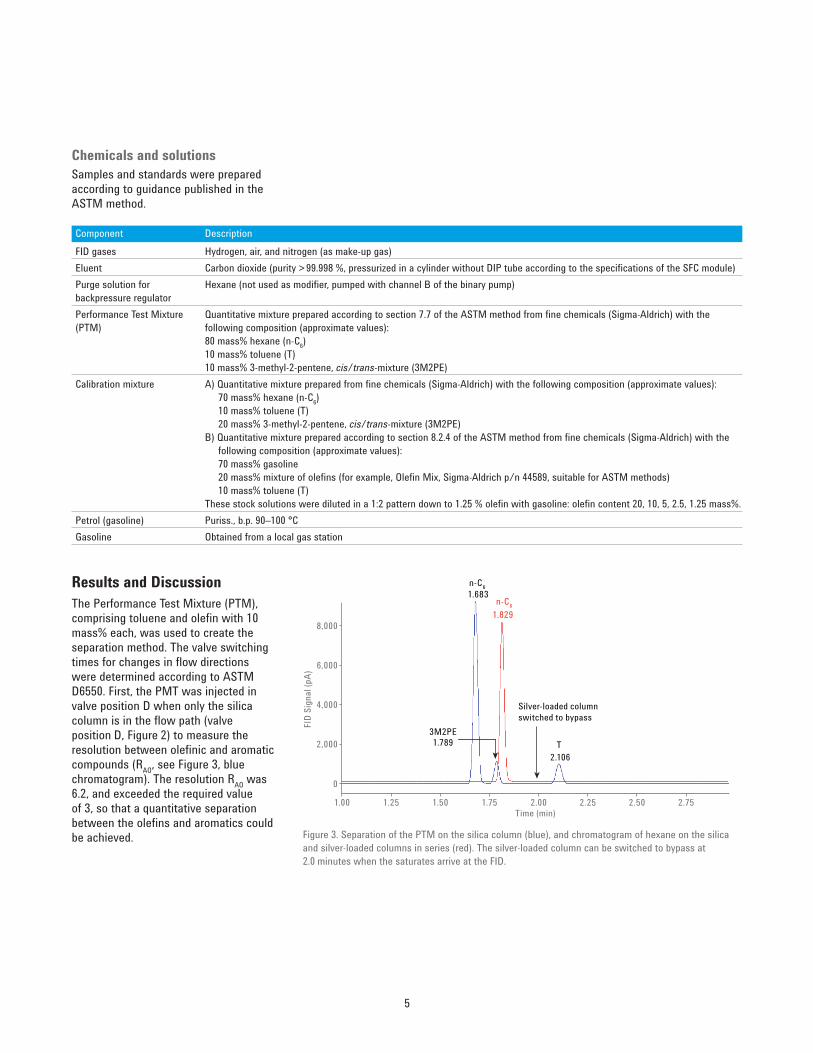
Results and DiscussionThe Performance Test Mixture (PTM), comprising toluene and olefi n with 10 mass% each, was used to create the separation method. The valve switching times for changes in fl ow directions were determined according to ASTM D6550. First, the PMT was injected in valve position D when only the silica column is in the fl ow path (valve position D, Figure 2) to measure the resolution between olefi nic and aromatic compounds (RAO, see Figure 3, blue chromatogram). The resolution RAO was 6.2, and exceeded the required value of 3, so that a quantitative separation between the olefi ns and aromatics could be achieved. Figure 3. Separation of the PTM on the silica column (blue), and chromatogram of hexane on the silica
and silver-loaded columns in series (red). The silver-loaded column can be switched to bypass at 2.0 minutes when the saturates arrive at the FID.
Time (min)1.00 1.25 1.50 1.75 2.00 2.25 2.50 2.75
0
2,000
4,000
6,000
8,000
FID
Sign
al (p
A)
1.683n-C6
T3M2PE
n-C6
1.7892.106
1.829
Silver-loaded column switched to bypass

6
In the second step, valve position A was used to fi nd the retention time of the saturated hydrocarbons (hexane) from the silica and the silver-loaded column in forward-fl ush mode (Figure 3, red chromatogram). As a result of these chromatograms, the time point to switch the silica column to backfl ush mode (valve position B) was determined to be 2.0 minutes, so that the aromatics can be eluted by backfl ush mode before they enter the silver-loaded column.
Subsequent switching times were determined according to the requirements in the ASTM standard. After elution of the aromatics from the silica column in backfl ush mode, the columns were switched back to starting position A for 0.5 minutes to clean off saturated and polar residues. Then, the valves were switched to position C at 6.5 minutes for the elution of the olefi ns from the silver-loaded column in backfl ush mode (Figure 4). In the fi nal method, the olefi n compound eluted at 7.166 minutes.
The performance of the system was tested by 10 injections of the PTM and calculation of the retention time and area precision of the three substances representative for saturates (n-hexane), aromatics (toluene) and olefi ns (3M2PE) (Figure 5 and Table 1). For the olefi n representative, the retention time repeatability was 0.04 % and the area repeatability was 1.26 %.
Good retention time repeatability is important for the quantifi cation of the olefi ns because column switching is performed on a time basis. The values over a period of several days were also signifi cantly below the limit of 0.5 %.
Time (min)0 1 2 3 4 5 6 7 8 9
0
1,000
2,000
3,000
4,000
5,000
6,000
7,000
8,000
9,000
FID
Sign
al (p
A)
1.800n-C6
TB3M2PE4.0207.166
A C A
Time (min)0 1 2 3 4 5 6 7 8 9
06080
100120140
FID
Sign
al (p
A)
1.800
3M2PE
4.020
7.166
Figure 4. Separation of the PTM with the fi nal method. The letters signify the valve position chosen at that time (n-hexane: retention time with both columns in-series 1.800 minutes, toluene: retention time with silica column backfl ush mode 4.020 minutes, olefi n: retention time with silver-loaded column in backfl ush mode at 7.166 minutes (see inset).
Figure 5. Overlay of 10 injections of the PTM (detailed display of the olefi n region of the chromatogram) to show retention time and area precision performance of the separated olefi n 3M2PE.
Time (min)6.0 6.5 7.0 7.5 8.0 8.5 9.0
40
50
60
70
80
90
100
FID
Sign
al (p
A)
3M2PE
Table 1. Retention time (RT) and area RSD (%) performance.
Hexane Toluene Olefi n 3M2PERT Area RT Area RT Area
Average 1.80 16161 4.02 2198.6 7.16 2059.5SD 0.002 130.6 0.002 17.7 0.003 26.0RSD (%) 0.13 0.81 0.04 0.80 0.04 1.26

7
The compounds of the PTM (calibration mixture A, see Chemicals and solutions) were also used to generate a calibration function. A dilution of this mixture containing 20 mass% olefi n by a 1:2 dilution pattern was used to generate the calibration levels at 20, 10, 5, 2.5, and 1.25 mass% olefi n in hexane, that itself was free from aromatics and olefi ns (Figure 6A). Together with a blank, each calibration level was injected nine times. The calculated calibration function had a linearity of 0.99997 (Figure 6B). This complied with the calibration shown in ASTM D6550, which shows a linearity of 0.9972.
To obtain proof of the method, a multi-olefi n sample was measured with a second SFC/FID system. The multi-olefi n sample, comprising 25 olefi ns, was diluted in pure gasoline (petrol) to 20 mass%, and injected directly (Figure 7). The petrol used for the dilution was completely free of olefi nic residues and aromatic residues. This obtained mixture (calibration mixture B) was also suitable to calibrate the SFC/FID instrument, as described above with comparable results (data not shown).
Figure 7. Multi-olefi n sample comprising 25 olefi ns (20 mass%), diluted in pure gasoline (petrol).
Time (min)6.5 7.0 7.5 8.0 8.5 9.0 9.5
25
0
50
75
100
125
150
175
200
FID
Sign
al (p
A)
A
0 5
3M2PE, FID signaly = 383.16xR2 = 0.99997
10 15 20 25
1,000
0
2,000
3,000
4,000
5,000
6,000
7,000
8,000 B
Figure 6. Calibration of the SFC/FID for the determination of olefi ns. A) Chromatograms of blank and the fi ve calibration levels of the olefi n 3M2PE in the PTM. B) Related calibration function for the olefi n 3M2PE (calculated from six measurements of each level).
Time (min)2 4 6 8
0
200
400
600
800
1,000Olefin mixture, 25 compounds, 20 mass%Petrol, puriss, b.p. 90–100 °C
FID
Sign
al (p
A)
7.235

www.agilent.com/chem
This information is subject to change without notice.
© Agilent Technologies, Inc., 2015Published in the USA, December 1, 20155991-6434EN
Finally, an actual gasoline sample was analyzed with the fi rst SFC/FID instrument (20 times, Figure 8A). The olefi ns at 7.02 minutes, the olefi n content, determined directly from the calibration function, was 12.8 mass% with 1.54 % RSD (equaling 0.2 mass% olefi n). The repeatability limit for this concentration stated in the ASTM standard is 0.7 mass%. This value shall not be exceeded in more than one case in twenty. The plot of the individual results shows that 19 results were within a difference of 0.6 mass%, which agreed to this requirement (Figure 8B).
ConclusionThis Application Note demonstrates the usability of the Agilent 1260 Infi nity Analytical SFC System in combination with the SIM-FID for the determination of olefi ns in gasoline according to ASTM D6550. The olefi n content of a gasoline sample was separated from saturated and aromatic hydrocarbons by means of two different columns, and a valve-switching solution for separation in forward fl ush and elution in backfl ush mode. The olefi ns were quantifi ed between 1.25 and 20 mass% with good linearity. In addition to test solutions, real gasoline samples were measured to confi rm the repeatability limits of the ASTM method.
References1. California Air Resources Board, The
California Reformulated Gasoline Regulations, Title 13, California Code of Regulations, Sections 2250-2273.5 Refl ecting Amendments Effective August 29, 2008.
2. American Society for Testing and Materials (ASTM): ASTM D6550-10 (2009), Standard Test Method for Determination of Olefi n Content of Gasoline by Supercritical-Fluid Chromatography, http://www.astm.org/Standards/D6550.htm (accessed June 1, 2015).
0 1 2 3 4 5 6 7 8 90
2,000
4,000
6,000
8,000
A
B
FID S
ignal
(pA)
Time (min)
Saturates
Aromatics Olefins
0 1 2 3 4 5 6 7 8 90
100
200
300
400
FID S
ignal
(pA)
Time (min)
Olefins
0 5 10 15 2012.012.212.412.612.813.013.213.4
Mas
s%
Sample no.
D = 0.6 mass%
Figure 8. Real gasoline sample analyzed according to the fi nal test method. A) Overlay of 20 injections. B) Olefi n content of 20 successive analyses to proof the repeatability limit.
3. American Society for Testing and Materials (ASTM): ASTM D 5186-03 (2009), Standard Test Method for Determination of the Aromatic Content and Polynuclear Aromatic Content of Diesel Fuels and Aviation Turbine Fuels By Supercritical Fluid Chromatography, http://www.astm.org/Standards/D5186.htm (accessed June 1, 2015).
4. Noll-Borchers, M., Hölscher, T., Naegele, E., Becker, M., Determination of Aromatic Content in Diesel Fuel According to ASTM D5186, Agilent Technologies Application Note, publication number 5991-5682EN, 2015.