determination of factors affecting the price of gold: a …€¦ · · 2015-02-14determination of...
TRANSCRIPT

Business and Economics Research Journal
Volume 2 Number 4 2011
pp. 37-50
ISSN: 1309-2448
www.berjournal.com
Determination of Factors Affecting the Price of Gold: A Study of
MGARCH Model
Cengiz Toramana Çağatay Başarırb Mehmet Fatih Bayramoğluc
aProf. Dr., Balikesir University, Department of Business Administration, Balikesir, Turkiye, [email protected]
bLecturer, Balikesir University Bandirma Vocational School Department of Economics and Administrative Sciences, Bandirma, Turkiye, [email protected]
cLecturer, Dogus University Vocational School, Istanbul, Turkiye, [email protected]
Abstract: Recently, increase of the gold prices attracts interest again together with the affects of the latest financial crisis. Main objective of this study is to determine factors affecting the gold prices. The study includes montly data between June, 1992 and March, 2010. Oil prices, USA exchange rate, USA inflation rate, USA real interest rate data are included in the model as variables. According to emprical findings, highest correlation is found between gold prices and USA exchange rate negatively. Secondly, a positive correlation is found between gold prices and oil prices.
Keywords: Gold Prices, Dow Jones Index, Oil Prices, MGARCH Model, CCC Model
JEL Classification: G12, C22, E31
1. Introduction
Gold is a precious metal which is used both as a property and as a financial assset. Importance of gold has come until today increasing its value and the area of usage. Gold was the fundemantal of the money system in the past and then became a reserve tool pegged to Dolar following the Bretton Woods. After 1973 some European Countries let their exchange rate float against dollar and convertibility of dolar against the gold ended and under these circumstances gold has lost the property of being a mean of exchange and become a personal saving tool and a part of Central Bank Reserves.
In the recent years, demand of gold has expanded with the widespread use of gold both in the industrial goods and in the jewelery sector. However, developments in the financial sector and the alternative financial instruments have decreased the importance of gold as a store of value. Afterwards, demand of gold tends to increase in the recent years, after the financial crises and individuals need for more secure investment tools. Consequently, price of gold boomed once again under this condition.
Objective of this study is estimating the gold prices with the variables that are addressed to affect the gold prices in the literature.
In the first part of the study, a detailed literatured review is made. Then, the model and the data set are explained. Consequently, data is anaylsed and evidence is investigated.

Determination of Factors Affecting the Price of Gold: A Study of MGARCH Model
Business and Economics Research Journal 2(4)2011
38
2. Literature Review
There are many studies investigating the price of gold in the literature. Although various different variables are used in these studies, it is observed that gold prices are regressed against USA dollar and stock return in general.
Abken (1980), under the assumption of rational gold market, investigated how fast and at which direction the market responds to a new information, and whether the gold prices reflect the current information or whether time is needed to see the effects. For this purpose, gold prices are taken as endogenous variables and lagged values of gold prices and interest rates is taken as exogenous varibles in a regression anaylsis. Monthly data between 1973-January and 1979- December show that the explatoriness ratio of the regression equaliton is low. When similiar relationship is seeked between future prices and future spot prices, the explatoriness ratio improves significantly.
Koutsoyiannis (1983) found that the gold prices are affected by the USA economy rather than woldwide economic conditions. It is stated that US dollar is the Exchange rate providing the international liqudity, gold prices are expressed in US dollars and raw oil prices are quoted in US dollars. Therefor, a negative raltionship between US dollar and gold prices are found.
Another study investigating the relationship between gold prices and Exchange rates are made by Dooley et al. (1992). Monthly data between 1976–1990 is used to search USA, UK, France, Germany and Japon curriencies. After bulding a VAR model, it is found that the parity between US dollar and the other currencies explain the changes in gold prices. Dooley et al. (1995) excluded the data of France and stated that the new findings coincide with the former study.
Harmston (1998), tested the relationship between UK, USA, France, Germany and Japon purchasing power parity and gold price fluctuations between 1870 and 1996. Results show that fluctuations are seen in the gold prices due to country crises and global crises but gold keeps its purchasing power being used a store of value.
Christie-David et al. (2000) followed the news reports for 23 months between 1992 and 1995 in order to show the effects of macroeconomics news reports on gold prices. In this study, newsletters of vaious macroeconomic variables, lagged values of local government bonds, future prices of gold and silver is used. Consequently, it is found that all the precious metal instuments are affected positivle by news about capacity use rate. Gold prices affected the news about producer price index, consumer price index and GDP and both gold and silver prices are affected by the news about unempolyment ratio. Moreover, it is observed that news about budget deficits have no significant effect on gold prices.
Smith (2001) investigated the relationship between gold price and stock exchange price index using daily, weekly and monthlt data begining from 1991 to 2001. Four gold prices and six stock exchange indices were included in the study. A short run relationship was observed in the relavant period between gold price and stock exchange price index.
Smith (2002), in a further study, used the data between 1991 and 2001 in order to determine the short run and long run relationship of gold price and stock exchange prices. Three gold price values taken from London Stock Exchange at 10.30, 15.00 and end of day

C.Toraman - C.Basarir - M.F.Bayramoglu
Business and Economics Research Journal 2(4)2011
39
and 18 different stock exchange index, Japan, United Kingdom, Germany, France, Swiss, Netherlands, Italy, Spain, Sweden, Belgium, Finland, Denmark, Greece, Portugal, Norway, Austria, Turkey and Ireland, were tested. While a weak and negative relationship was found between gold prices and stock exchange prices in the short run, no significant relationship was observed in the long run.
Another study was made by Ghosh et al. (2002) using monthly data between 1976 and 1999 investigating the affects of worldwide inflation level, USA inflation level, woldwide income, value of US Dollar and random shocks on gold prices with a VAR model. It was concluded that gold prices are related with US Inflation level, interest rates and dollar exchange rate. Furthermore, a long run relationship was found betweeen gold prices and US Consumer Price Index as a result of the cointegration analysis.
Vural (2003) tested the sensitivity of gold prices among various variables (USD/Euro parity, Dow Jones industial production index, oil prices, interest rates,silver and copper prices) building a multivariate regression model using montly data between 1990 and 2003. As a result, gold prices were positively related with silver, oil and copper prices; negatively correlated with interest rates, USD/Euro parity and Dow Jones industial production index.
Tully and Lucey (2007) used and APGARCH model in order to investigate affects of some macroeconomic variables on gold prices. In the 1984- 2003 period, a relationship was found between daily and future prices of gold and US Dollar.
Sjaastad (2008) investigated the relationsihp between and forward gold prices and exchange rates. Spot and forward exchange rates between US Dollar, GB Pound, Japon Yen and Deutche Mark were included in the study and a high positive relationship was found between spot and forward prices. While the European Money Market was dominant in the Gold Price Market in 1990’s, later US Dollar played leading role. In addition, gold manufacturer countries like Australia, South Africa and Russia were found to have no significant affect on gold prices. Furhermore, while previous studies stated that gold was not a store of value against woldwide inflation, conversly in this study gold was suggested a store of value.
Öztürk and Açıkalın (2008) found a long run relationship between gold prices and consumer price index with a Granger Cointegration test using monthly data between 1995 and 2006.
Topçu (2010) examined the relationship between gold prices and Dow Jones industrial production index, US Dollar exchange rate, oil prices, US Inflation rate, Global Money Supply (M3) from 1995 to 2009. As a result of the multivariate regression analysis, returns of Dow Jones industial production index and US Dollars positively affect the return of gold; and global Money supply negativley affects the return of gold. While a postive relationship was found between the return of oil prices and inflation and the return of gold, no statistically significant evidence was found. Similiarly, a postive relationship was found bewteen the price of gold and interest rates was found but, no statistically significant evidence was found.

Determination of Factors Affecting the Price of Gold: A Study of MGARCH Model
Business and Economics Research Journal 2(4)2011
40
3. Methodolgy
3.1. Data Set and Variables
In this study, an MGARCH model is tested in order to find variables affecting gold prices. Following the previous studies, oil prices, dollar index, Dow Jones Industrial Production Index, USA reel Interest Rates and USA inflation rate are considered as the variables determining pricr of gold. The study includes monthy data begining from January 1992 to March 2010. Data set can be seen in Table 1:
3.2. The Model
Linear regression model assumes that error terms of population regression function (Vi) have constant variance. This assumption is defined as homoscedasticity. But when time series analysis is considered, this assumption is violated. As a consequance, parameters may have big standart error terms and low significance. Widely used models used for modelling heteroscedasticity are Engle (1982)’s ARCH (Autoregressive conditional heteroskedasticity) model and Bollerslev (1986)’s GARCH (Genarelized Autoregressive Conditional Heteroskedasticity) models. Different models such as Exponential GARCH (EGARCH), ARCH-M (ARCH in mean), T-ARCH (Treshold ARCH), C-ARCH (Junction ARCH), PARCH (Asymmetric ARCH) are derivated afterwards.
3.2.1. ARCH Model
Conditional variance term is considered under an uncertain environment. While unconditional variance is a constant in traditional model, conditional variance is defined as a function of lagged values of random varible.
An ARCH model is defined as:
Table 1: Data Set
Variable Definition
RGOLD Gold Prices Price of 1 ounce of gold in US dollars in London Gold Market. Return of gold is calculated and used.
ROIL Oil Prices Price of Brent Oil in US. Return of oil is calculated and used.
RUSD Dollar Index Major Currencies Dollar Index as return
RDOW Dow Jones Industrial Production Index
Dow Jones Industrial Production Index as Return
INT Interest Rate USA Real Interest Rate (Real Fed Funds Rate)(Differenced)
CPI Inflation Rate USA Annual Inflation Rate (in Consumer Prices) (Differenced)
C.Toraman - C.Basarir - M.F.Bayramoglu
Business and Economics Research Journal 2(4)2011
41
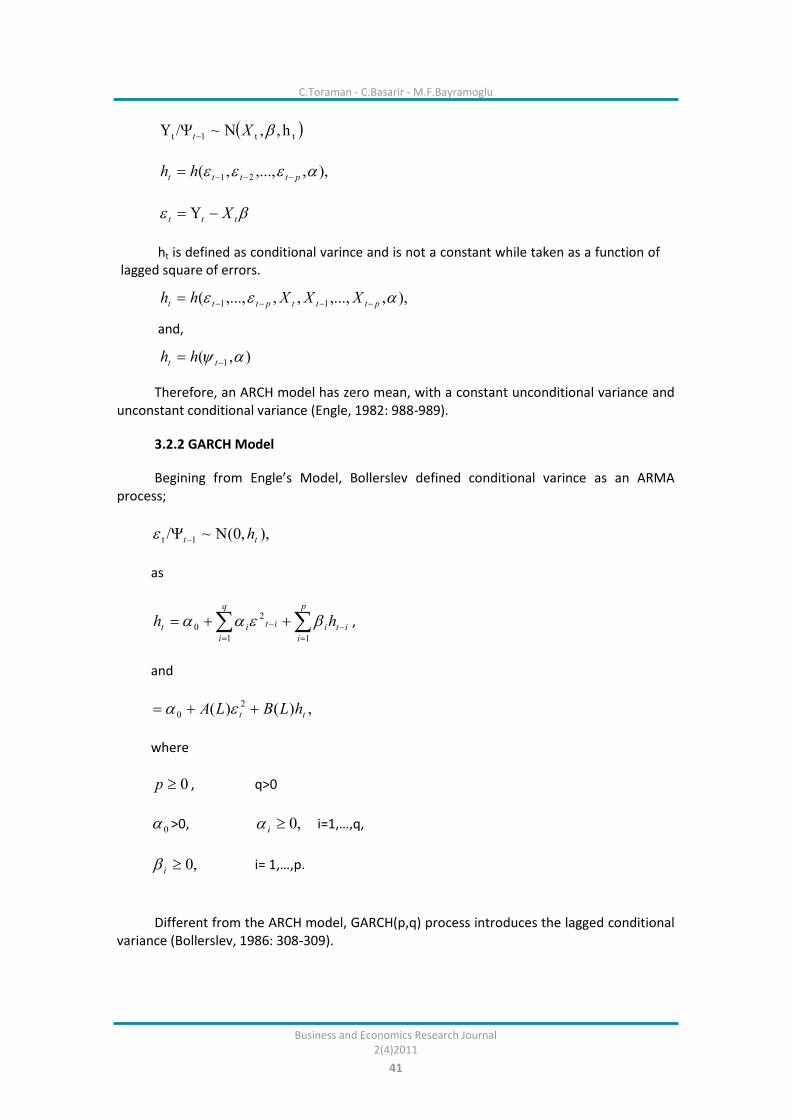
Therefore, an ARCH model has zero mean, with a constant unconditional variance and unconstant conditional variance (Engle, 1982: 988-989).
3.2.2 GARCH Model
Begining from Engle’s Model, Bollerslev defined conditional varince as an ARMA process;
Different from the ARCH model, GARCH(p,q) process introduces the lagged conditional variance (Bollerslev, 1986: 308-309).
tt1t h,,N~/ Xt
),,,...,,( 21 ptttt hh
ttt X
ht is defined as conditional varince and is not a constant while taken as a function of lagged square of errors.
),,,...,,,,...,( 11 ptttpttt XXXhh
and,
),( 1 tt hh
),,0(N~/ 1t tt h
as
q
i
p
i
itiitit hh1 1
2
0 ,
and
,)()( 2
0 tt hLBLA
where
0p , q>0
0 >0, ,0i i=1,…,q,
,0i i= 1,…,p.

Determination of Factors Affecting the Price of Gold: A Study of MGARCH Model
Business and Economics Research Journal 2(4)2011
42
3.2.3 Multivariate GARCH Model
Multivariate GARCH model emphesizes the interaction of return volatilities of more than one varible in a constant period. It is also possible to investigate effectiveness of risk relationships among different variables. Kraft and Engle (1982) suggested the multivariate GARCH model and error terms are defined as;
With constraints in Diagonal VEC (Vector Error Correction), Engle and Kroner(1995) suggested BEKK (Baba, Engle, Kraft, Kroner) and CCC (Constant Conditional Correlations) models can be used for estimating multivariate GARCH model. A CCC model is used in this study. Bollerslev (1990) created an MGARCH model with constant correlations and proportion of conditional covariances and their conditional standart errors. With this constraint, a simplier and clear estimation becomes possible.
CCC model is defined as,
4. Empirical Evidence
Volatilities of the variables are can be seen in Graph 1. RGOLD has a peak in 1999 and an increasing volatility after 2006. This series is more volatile in 2002, 2006 and 2008, and peaks are followed by deeps. It can be seen as an indicater of speculative fluctuations. Volatility of ROIL also increses after 1999 and afterwards mant peaks and deeps are observed. RUSD and RDOW series have also sharp peaks and deeps. While a non-stationaty structure is observed in INT and CPI, an increasing trend is seen in CPI.
Njptujtuj .,.........1,...,,.........1,
While jjtiitijttt hhRDDH ;
2/12/1
11 .... NNttt hhdiagD
Hij can be defined as any univariate GARCH model and,
ijR is a symettric and positive definite matrice of
iii ,1
R is a matrice including constant conditional correlations ij .Bollerslev’s CCC model
defines a GARCH(1,1) model for each conditional variance of tD .
This CCC model, 1,1
2, tiiitiiitt hwh Ni ,.....1 , has N(N + 5)/2 parameters.
tH will be positive defined if and only if all the conditional variances of N are positive and R
is positivelt defined. Conditional correlations can be calculated with this model. (Bauwens, L. et al. 2003: 11).

C.Toraman - C.Basarir - M.F.Bayramoglu
Business and Economics Research Journal 2(4)2011
43
Graph 1: Volatility of the Variables
Descriptive statistics can be seen in Table 2. According to J-Bera statistic, none of the series except for RUSD has normal distribution. ROIL, RDOW and INT series are left skewed. In addition, RGOLD and ROIL series is peak and CPI and INT series is flat. Furthermore, an ARCH effect can be seen in RGOLD, ROIL and CPI series as a result of ARCH - LM test.
Augmented Dickey-Fuller (ADF) and Philips Perron (PP) tests show the stability of the series in Table 3. RGOLD, ROIL, RUSD and RDOW series are stationary and INT and CPI series are non-stationary. As a result, fist differences of INT and CPI series are used in the model.
-15
-10
-5
0
5
10
15
20
92 94 96 98 00 02 04 06 08
RGOLD
-40
-30
-20
-10
0
10
20
30
92 94 96 98 00 02 04 06 08
ROIL
-6
-4
-2
0
2
4
6
8
92 94 96 98 00 02 04 06 08
RUSD
-20
-15
-10
-5
0
5
10
15
92 94 96 98 00 02 04 06 08
RDOW
0
1
2
3
4
5
6
7
92 94 96 98 00 02 04 06 08
INT
120
140
160
180
200
220
240
92 94 96 98 00 02 04 06 08
CPI

Determination of Factors Affecting the Price of Gold: A Study of MGARCH Model
Business and Economics Research Journal 2(4)2011
44
Correlation coefficients can be seen in Table 4. RUSD has the highest correlation coefficient followed by DCPI. ROIL, RDOW and DINT series have relatively low correlation coefficients. While RUSD and RDOW series show a negative correlation, DCPI, ROIL and DINT have positive correlation.
After the determination of the correlation coefficients, a CCC model is built in order to determine the variables effecting gold prices. Reliability of the model should be tested after model estimation. Many univariate tests can be used for this aim and also a constrained number of multivariate tests can also be made. In literature, tests for evaluating conditional
Table 2: Descriptive Statistics
RGOLD ROIL RUSD RDOW INT CPI
Mean
0.520
0.670 -0.059
0.550
3.680
176.580
Standard Deviation
3.590
8.860
1.690
4.300
1.890
23.720
Skewness
0.390 -0.710 -0.020 -0.850 -0.430 0.210
Kurtosis
5.170
4.090
3.640
4.810
1.880 1.860
J-Bera
48.700
29.620
3.800
56.170
18.350 13.380
Probability
0.000
0.000
0.148
0.000
0.000 0.001
ARCH - LM
10.430
18.870
0.690
5.071
0.057 34.700
Table 3: ADF and PP Unit Root Tests
TEST RGOLD ROIL RUSD RDOW INT CPI
ADF(c) -13.70(0) -12.20(0) -10.17(0) -14.01(0) -1.46(2) 0.15(2)
ADF(t) -14.13(0) -12.20(0) -10.20(0) -14.12(0) -2.05(2) -2.90(2)
PP (c) -13.69 -12.20 -10.25 -14.04 -1.22 0.055
PP(t) -14.13 -12.19 -10.17 -14.13 -1.78 -2.66
* Lag period is shown in parenthesis
* result with constant and without trend
* result with constant and with trend
Table 4: Correlation Coefficients
Variable RGOLD ROIL RUSD RDOW DINT DCPI
RGOLD
1.000000
ROIL
0.171172 1.000000
RUSD
-0.459179 -0.264427 1.000000
RDOW
-0.115472 0.004854 -0.176308 1.000000
DINT
0.010949 0.238851 -0.074453 0.035081 1.000000
DCPI
0.186239 0.551402 -0.197718 -0.008251 0.196682 1.000000

C.Toraman - C.Basarir - M.F.Bayramoglu
Business and Economics Research Journal 2(4)2011
45
variance model (heteroscedasticity X) can be divided into 3 categories: (1) Box-Pierce Ljung Portmanteau Test, (2) Tests based on error terms, (3) Lagrange Multiplies Tests (Bauwens, et al., 2003: 24-25).
In order to evaluate the estimated model, distributions of the standard errors are tested and error terms are found to have normal distribution. Distribution of the error terms are shown in Table 1. Another criterion to have an idea about this distribution is the Q-Q Graphs of the error terms. As can be seen in Appendix 2, graphs show the same result.
Q and Q2 statistics are calculated in order to see autocorrelation and heteroscedasticity and also ARCH - LM test is consulted. Results can be seen in Table 5.
When we look at Q statistic, no autocorrelation can be seen between the error terms after the estimation of the model. Q2 statistic shows that there is no heteroscedasticity problem for the error terms. For the ARCH - LM test, results of the test statistic (n.R²) is smaller than the critical value at 0,05 significance level (3,841), consequently ARCH effect disappears.
Under these circumstances, conditional correlation coefficients of the model is calculated and shown in the Table 6:
When we look at the conditional correlation coefficients of the model, similar to the first calculation, RUSD has the highest correlation coefficient with a bigger and negative coefficient (-0.47). It can be seen as a negative relationship between the return of dollar and the return of gold. When we compare table 4 and table 6, it is seen that conditional correlation coefficients are 0.02 higher than the unconditional correlation coefficients.
Table 5: Ljung Box Q, Q2 and ARCH - LM Statistic of the Standard Errors
RGOLD ROIL RUSD RDOW DINT DCPI
Q(36) 26.99 48.39 36.37 26.88 41.94 161.29
Q2(24) 20.10 28.34 20.26 9.89 29.86 14.50
ARCH - LM 0.001 2.798 1.438 0.512 0.446 0.017
Table 6: Conditional Correlation Coefficients
RGOLD ROIL RUSD RDOW DINT DCPI
RGOLD 1.000000
ROIL 0.153518 1.000000
RUSD -0.476277 -0.278687 1.000000
RDOW -0.079788 -0.001537 -0.128204 1.000000
DINT -0.035815 0.209359 0.002860 -0.025268 1.000000
DCPI 0.151790 0.454666 -0.147494 -0.072282 0.099945 1.000000

Determination of Factors Affecting the Price of Gold: A Study of MGARCH Model
Business and Economics Research Journal 2(4)2011
46
When we compare Table 4 and Table 6, conditional correlation coefficient between the return of gold and the inflation rate decreased by 0.03 point according to unconditional correlation coefficient and become 0.15. This shows a positive and weak relationship between the return of gold and the inflation rate. Conditional correlation coefficient between the return of gold and Dow Jones Industrial Production Index (-0.07) shows “Very weak negative correlation”. These coefficients decrease by 0.04 when we compare with unconditional relationship. Conditional correlation coefficient between the return of gold and the interest rate decreased by 0.04 point according to unconditional correlation coefficient and turn to be negative, but in both cases the relationship is insignificant. While significance from the highest relationship to the lowest for unconditional correlation coefficients is RUSD, DCPI, ROIL, RDOW and DINT, for the conditional correlation coefficients it is RUSD, ROIL, DCPI, RDOW and DINT.
5. Conclusion
In this study, variables that are thought to affect the gold prices are analyzed with a MGARCH model including the data from 1992 and 2010. Oil prices, USA exchange rate, USA inflation rate, USA reel interest rate data are included in the model as variables. First differences of USA exchange rate and real interest rates are taken and return series of the other variables are used. An MGARCH model is estimated by CCC model for the reason that it gives the best results for the estimation of the coefficients. According to empirical findings,
Table 7: Evaluation of Negative Correlation Coefficients
Coefficient Value Evaluation
Negative 0.00 – 0.20 Very weak negative correlation
Negative 0.20 – 0.40 Weak, low negative correlation
(not very significant)
Negative 0.40 – 0.70 Moderate negative correlation
Negative 0.70 – 0.90 Strong, high negative correlation
Negative 0.90 – 1.00 Very strong negative correlation
Source: OANDA fxTrade Infocenter, “FX Correlations”, http://fxtradeinfocenter.oand a.com/charts_ data/fxcorrelations, (19.08.2010).
Table 8: Evaluation of Positive Correlation Coefficients
Coefficient Value Evaluation
Positive 0.00 – 0.20 Very weak positive correlation
Positive 0.20 – 0.40
Weak, low positive correlation (not very significant)
Positive 0.40 – 0.70 Moderate positive correlation
Positive 0.70 – 0.90 Strong, high positive correlation
Positive 0.90 – 1.00 Very strong positive correlation
Source: OANDA fxTrade Infocenter, “FX Correlations”, http://fxtradeinfocenter.oand a.com/charts_ data/fxcorrelations, (19.08.2010).

C.Toraman - C.Basarir - M.F.Bayramoglu
Business and Economics Research Journal 2(4)2011
47
highest correlation is found between gold prices and USA exchange rate negatively. Secondly, a positive correlation is found between gold prices and oil prices.
According to the findings, a negative and significant relationship is found between the return of gold and the return of USA Dollar, the rest of the variables have no significant relationship with the return of gold. This result is valid both for the conditional and unconditional correlation relationship.
On the contrary to this study, significant relationship was found between the variables in the previous studies. But the results are similar to Topcu (2010) that found there is no significant relationship between oil prices and return of gold and inflation rate and the return of gold.
Similarly, Tully and Lucey (2007) found gold prices are the factor of USA Dollar and other variables have effects at a lower level. Results of Tully and Lucey (2007) are parallels to our study.
As a consequence, in the relevant period, return of gold show a non-linear change, in other words, market is non-linear. When the market is efficient, linearity can be considered, but when there is an inefficient market, relationships are non-linear. As a result of this study, gold market can be evaluated as inefficient. There are many studies showing the same consequences both for the developed and developing countries. On this account, this study motivates the analysis showing the non-linear relationship of the market besides the linear relationship.
References
Abken, P. (1979). The Economics of Gold Price Movements Economic Review, Federal Reserve Bank of Richmond, 3–13.
Bauewens, L., Laurent, S. and Rombouts, J.V.K. (2003). Multivariate GARCH Models: A Survey, Core Discussion Paper, 31.
Bollerslev, T. (1986). Generalised Autoregressive Conditional Heteroskedasticity, Journal of Econometrics, 31, 307–327.
Bollerslev, T. (1990). Modelling the Coherence in Short-Run Nominal Exchange Rate: A Multivariate Generalized ARCH Approach, Review of Economics and Statistics, 72, 498–505.
Bollerslev, T., Chou, R. Y. and Kroner, K. F. (1992). ARCH Modelling in Finance: A Review of the Theory and Empirical Evidence, Journal of Econometrics, 52, 5–59.
Dooley, M.P., Isard, P. and Taylor, M.P. (1992). Exchange Rates, Country Preferences and Gold, IMF Working Paper.
Dooley, M.P., Isard, P. and Taylor, M.P. (1995). Exchange Rates, Country Specific Shocks and Gold, Applied Financial Economics, 5, 121–129.
EIA (2010), http://tonto.eia.doe.gov/dnav/pet/hist/leafhandler. Ashx?N=Pet &S=Rbrte=M (12.05.2010)
Enders, W. (1995). Applied Econometric Time Series, John Wiley&Sons Inc, Canada.

Determination of Factors Affecting the Price of Gold: A Study of MGARCH Model
Business and Economics Research Journal 2(4)2011
48
Engle, R. (1982). Autoregressive Conditional Heteroscedasticity with Estimates of the Variance of United Kingdom Inflation, Econometrica, 50, 987–1007.
Engle, R. (1995). ARCH. Selected Readings, Oxford: Oxford University Pres.
Engle, R. (2001). GARCH 101: The Use of ARCH/GARCH Models in Applied Econometrics, Journal of Economic Perspective, 15, 157–168.
Engle, R. and Kroner, K. (1995). Multivariate Simultaneous Generalized ARCH, Econometric Theory, 11, 122–150
Federal Reserve Bank (2010). http://www.federalreserve.gov/econresdata/releases/ statisticsdata.htm (08.06.2010).
GFMS (2010). http://www.gfms.co.uk/precious_metals_mining_cost_services.htm, (08.06.2010)
Ghosh, D., Levin, E.J., Macmillan, P. and Wright, R.E. (2002). Gold As An Inflation Hedge?, University of St. Andrews, Department of Economics, Discussion Paper Series.
Harmston, S. (1998), Gold as a Store of Value, World Gold Council Resarch Study, 22.
Koutsoyiannis, A. (1983). A Short-Run Pricing Model for a Speculative Asset, Tested with Data from the Gold Bullion Market, Applied Economics, 15, 563–581.
Lawrance, C. (2003). Why is Gold Different from Other Assets? An Emprical Investigation, World Gold Council Resarch Study.
Oanda Fxtrade Infocenter, FX Correlations, http://fxtradeinfocenter.oanda.com/chart s_data/fxcorrelations, (19.08.2010).
Öztürk, F. ve Açıkalın, S. (2008). Is Gold A Hedge Against Turkish Lira?, South East European Journal of Economics and Business, 3, 35–40.
Sjaastad, L.A. (2008). The Price of Gold and the Exchange Rates: Once Again, http://www.business.uwa.edu.au/school/disciplines/economics/?A=98660.
Smith, G. (2001). The Price of Gold and Stock Price Indices for the United States,http://www.gold.org/value/stats/research/pdf/gold&usstockindicesdec2001%fina.pdf.
Smith, G. (2002). The Price of Gold and Stock Price Indices in Europe and Japan, http://www.gold.org/value/stats/research/pdf/gold&eujpstockindicesfeb2002.pdf
SPK (2010). http://www.spk.gov.tr/yayingoster.aspx?yid=1016&ct=f&action=displayfi le&ext=.pdf (30.04.2010)
TCMB (2010). http://evds.tcmb.gov.tr/cbt.html (11.05.2010)
Tkacz, G. (2007). Gold Prices and Inflation, Bank of Canada, Working Paper.
Topçu, A. (2010). Altın Fiyatlarını Etkileyen Faktörler, SPK Araştırma Raporu, Ankara.
Tully, E. and Lucey, B. M. (2005). An APGARCH Investigation of the Main Influences on the Gold Price. Available At Ssrn: http://ssrn.com/abstract=792205.
Vural, M.G. (2003). Altın Piyasası ve Altın Fiyatlarını Etkileyen Faktörler, TCMB Uzmanlık Yeterlilik Tezi, Ankara.
World Gold Council (2010).http://www.research.gold.prg/prices/monthly/ (11.05.201 0).

C.Toraman - C.Basarir - M.F.Bayramoglu
Business and Economics Research Journal 2(4)2011
49
Appendix 1: The Prediction of the Standardized Distribution of Error Terms obtained from the Model
-15
-10
-5
0
5
10
15
20
92 94 96 98 00 02 04 06 08
RESID01
-40
-30
-20
-10
0
10
20
30
92 94 96 98 00 02 04 06 08
RESID02
-6
-4
-2
0
2
4
6
8
92 94 96 98 00 02 04 06 08
RESID03
-20
-15
-10
-5
0
5
10
92 94 96 98 00 02 04 06 08
RESID04
-1.2
-0.8
-0.4
0.0
0.4
0.8
92 94 96 98 00 02 04 06 08
RESID05
-6
-4
-2
0
2
4
92 94 96 98 00 02 04 06 08
RESID06

Determination of Factors Affecting the Price of Gold: A Study of MGARCH Model
Business and Economics Research Journal 2(4)2011
50
Appendix 2: Q-Q Graphics of Standart Errors
-10
-5
0
5
10
15
-20 -10 0 10 20
Quantiles of RESID01
Quantile
s of
Norm
al
-30
-20
-10
0
10
20
30
-40 -20 0 20 40
Quantiles of RESID02Q
uantile
s of
Norm
al
-6
-4
-2
0
2
4
6
-8 -4 0 4 8
Quantiles of RESID03
Quantile
s of
Norm
al
-15
-10
-5
0
5
10
15
-20 -10 0 10
Quantiles of RESID04
Quantile
s of
Norm
al
-.6
-.4
-.2
.0
.2
.4
.6
-1.0 -0.5 0.0 0.5 1.0
Quantiles of RESID05
Quantile
s of
Norm
al
-2
-1
0
1
2
3
-6 -4 -2 0 2 4
Quantiles of RESID06
Quantile
s of
Norm
al