determination of emotional state through …
TRANSCRIPT

DETERMINATION OF EMOTIONAL STATE THROUGH PHYSIOLOGICAL
MEASUREMENT
by
Lee B. Hinkle, B.S.
A thesis submitted to the Graduate Council of
Texas State University in partial fulfillment
of the requirements for the degree of
Master of Science
with a Major in Computer Science
December 2016
Committee Members:
Vangelis Metsis, Chair
Mina Guirguis
Yijuan Lu

COPYRIGHT
by
Lee B. Hinkle
2016

FAIR USE AND AUTHOR’S PERMISSION STATEMENT
Fair Use
This work is protected by the Copyright Laws of the United States (Public Law 94-553,
section 107). Consistent with fair use as defined in the Copyright Laws, brief quotations
from this material are allowed with proper acknowledgment. Use of this material for
financial gain without the author’s express written permission is not allowed.
Duplication Permission
As the copyright holder of this work I, Lee B. Hinkle, authorize duplication of this work,
in whole or in part, for educational or scholarly purposes only.

DEDICATION
To the memory of my mother and father, Irene M. and Glenber L. Hinkle who
consistently stressed the importance of education and helping others.

v
ACKNOWLEDGEMENTS
One of my favorite metaphors is “we stand on the shoulders of giants”. The
work presented here is the result of the efforts of many people who have generously
shared their knowledge and support with me directly and indirectly. As I sit here writing
on a Friday night I am reminded that the research and discovery is the fun part but real
value comes from documenting the information so it can be used by others. I am
particularly grateful to those who teach and share their knowledge broadly.
I want to thank my advisor Dr. Vangelis Metsis for establishing the Intelligent
Multimodal Computing and Sensing lab which I am proud to be a part of as both student
and a researcher. I am grateful for his guidance on deeply technical topics as well as
presentations and papers. My fellow researcher and frequent lunch buddy Kamrad
Roudposhti was always willing to help me with MATLAB and machine learning
principles. I learned a great deal during our frequent brain storming sessions at the
whiteboard. I would like to thank a full cast of fellow researchers and students with
whom I have enjoyed spirited discussions and in some cases collaborated with on
graduate projects: Alakh Biniwale, Sahar Azimi, Jayadharini Jaiganesh, Justin May,
Xiaoqing Liao, Iaonnis Rigas, Priyank Trivedi, Adam Anderson, Thomas Hsiao.
I would like to thank Dr. Yijuan Lu and Dr. Mina Guirguis for agreeing to serve
on my committee. Molly O’Neil generously provided me with many great pointers and
bits of advice and also serves as an inspiration through the care she shows for her

vi
students and the effort she puts into teaching. Susan Alexander helped me immensely
with the purchasing and receipt of equipment, many times from non-traditional suppliers.
Shannon Hicks was always helpful when I really didn’t know who else to ask.
I would like to thank Texas State University for offering options for those of us
working in industry to continue our education at the Graduate Level. The Support Grant
Fellowship awarded to me by the Graduate College was critical for the purchase of the
virtual reality and recording equipment and is very much appreciated. I am hopeful that
this equipment will serve the needs of future Computer Science students for many years.
I would like to thank Dr. Kenneth Smith for the use of the Virtual Reality Lab and
David Morely for helping me with some of the early and very critical VR runs.
Although we have only met via email I would like to thank Bernard Tarver at
Great Lakes Neurotechnologies for his prompt and patient replies to my frequent
questions regarding the BioRadio.
Finally, I would like to thank my wife Christine for her support while returned to
full time student status and focused on my studies and research. I would also like to
thank my wonderful daughters; Paige lent me the original Oculus DK2 while Shawn
shared her MATLAB experiences and opinions.

vii
TABLE OF CONTENTS
Page
ACKNOWLEDGEMENTS ................................................................................................ v
LIST OF TABLES ............................................................................................................. ix
LIST OF FIGURES ............................................................................................................ x
LIST OF ABBREVIATIONS ........................................................................................... xii
ABSTRACT ..................................................................................................................... xiii
CHAPTER
1 INTRODUCTION ............................................................................................... 1
1.1 Motivation ............................................................................................. 2 1.2 Challenges ............................................................................................. 3 1.3 Applications .......................................................................................... 4
2 BACKGROUND AND RELATED WORK ....................................................... 6
2.1 Human Emotional Response ................................................................. 7
2.2 Physiological Signals ............................................................................ 7 2.2.1 Electrical Physiological Signals ............................................. 8
2.2.1 Non-Electrical Physiological Signals .................................. 10 2.3 Emotional Classification Labels ......................................................... 11 2.4 Experimental Elicitation of Emotional Response ............................... 12
2.5 Data Processing and Feature Extraction ............................................. 15
3 METHODOLOGY ............................................................................................ 17
3.1 Experimental Design for Elicitation of Response ............................... 17
3.2 Data Collection ................................................................................... 20
3.2.1 Physiological Signals Measured .......................................... 20 3.2.2 Skin Preparation and Electrode Placement .......................... 22
3.3. BioRadio mounting and cabling ........................................................ 25 3.3.1 Video Collection and Event Markers ................................... 28 3.3.2 Subject Feedback Regarding Arousal and Valence ............. 28

viii
3.4 Signal Processing and Classification .................................................. 30 3.4.1 Data Export .......................................................................... 30 3.4.2 Data Import, Table Join, and Labeling ................................ 32 3.4.3 Feature Extraction ................................................................ 36
3.5 Institutional Review Board ................................................................. 36
4 EXPERIMENTS AND RESULTS .................................................................... 38
4.1 Self-Reported Data – Range of Responses during Simulations.......... 38 4.2 Initial Signal Analysis and Data Conversion ...................................... 42
4.2.1 Rose and I Movie ................................................................. 43 4.2.2 Roller Coaster ...................................................................... 49
4.2.3 Pendulum Swing .................................................................. 55 4.3 Feature Extraction and Segment Size ................................................. 61
4.3.1 Simple Mean and Standard Deviation Feature Extraction ... 61 4.3.2 Temporal and Frequency Based Feature Extraction ............ 64 4.3.3 Domain Specific Feature Extraction .................................... 65
4.4 Feature Selection ................................................................................. 67 4.4.1 Simple Mean and Standard Deviation Feature Selection .... 67
4.4.2 Temporal and Frequency Based Feature Selection .............. 67 4.4.3 Domain Specific Feature Extraction .................................... 68
4.5 Classification Accuracy ...................................................................... 68
5 CONCLUSION .................................................................................................. 70
LITERATURE CITED ..................................................................................................... 72

ix
LIST OF TABLES
Table Page
1. Electrical Physiological Signal Names and Sensor Types ............................................ 10
2. Non-Invasive Physiological Signal Names and Sensor Types (partial list) ................. 11
3. Emotion Elicitation Techniques and States .................................................................. 14
4. Physiological Signals Recorded .................................................................................... 21
5. Summary of Subject Reponses ..................................................................................... 38
6. Subject 1-3 Detailed Responses .................................................................................... 39
7. Subject 4-5 Detailed Responses .................................................................................... 39
8. MATLAB Classifier Accuracy with 5 fold cross-validation, 1 second epoch,
and mean + standard deviation features ................................................................ 63
9. MATLAB Classifier Accuracy with 5 fold cross-validation, 5 second epoch,
and mean + standard deviation features ................................................................ 64
10. List of Temporal and Frequency Based Features ....................................................... 65

x
LIST OF FIGURES
Figure Page
1. Placement of Electrodes on Left and Right Hands ....................................................... 23
2. Placement of Electrodes on Face .................................................................................. 24
3. “Head” BioRadio mounting improvements .................................................................. 26
4. Body BioRadio mounting with Back Support Belt ...................................................... 27
5. Emotion and Range Subject Response Form – too complex ........................................ 29
6. Directory Listing showing Data Files and Size after Export ........................................ 31
7. Raw Subject 1 Data after Import as MATLAB Table .................................................. 32
8. Screenshot of Excel Spreadsheet used for Timing Synchronization ............................ 34
9. Sequence Diagram of Import from .csv ........................................................................ 35
10. Subject Responses marked on Arousal-Valence axis ................................................. 40
11. Summary of all Subject Responses marked on Arousal-Valence axis ....................... 41
12. Side by side screenshot of Signal Data shown in BioCapture Software ..................... 42
13. Subject Heart Rate during Rose and I Segment .......................................................... 44
14. Peripheral Blood Volume during Rose and I Segment ............................................... 45
15. EEG during Rose and I Segment ................................................................................ 46
16. EMG during Rose and I Segment ............................................................................... 47
17. GSR during Rose and I Segment ................................................................................ 48
18. Peripheral Temperature during Rose and I Segment .................................................. 49
xi
19. Subject Heart Rate during Roller Coaster Segment .................................................... 50
20. Subject Peripheral Blood Pulse Volume Roller Coaster Segment .............................. 51
21. Subject EEG f4 during Roller Coaster Segment ......................................................... 52
22. Subject EMG signal during Roller Coaster Segment ................................................. 53
23. Subject Galvanic Skin Response signal during Roller Coaster Segment ................... 54
24. Subject Peripheral Skin Temperature during Roller Coaster Segment ....................... 55
25. Subject Heart Rate during Pendulum Swing Segment ............................................... 56
26. Subject Peripheral Blood Pulse Volume Pendulum Swing Segment ......................... 57
27. Subject EEG f4 during Pendulum Swing Segment..................................................... 58
28. Subject EMG signal during Pendulum Swing Segment ............................................. 59
29. Subject Galvanic Skin Response signal during Pendulum Swing Segment ............... 60
30. Subject Peripheral Skin Temperature Pendulum Swing Segment .............................. 61

xii
LIST OF ABBREVIATIONS
Abbreviation Description
Ag/AgCl Silver/Silver Chloride
CSV Comma Separated Value
ECG Electrocardiogram
EDA Electrodermal Activity
EEG Electroencephalogram
EMG Electromyography
EOG Electrooculography
GSR Galvanic Skin Response
HRV Heart Rate Variability
kNN k-th Nearest Neighbor
PPG Photoplethysmogram
PPV Pulse Pressure Variation
PulseOx Pulse Oximetry
RIP Respiratory Inductance Plethysmography
SKT Skin Temperature
SpO2 Oxygen saturation of arterial hemoglobin
SVM Support Vector Machine

xiii
ABSTRACT
The goal of this thesis is to develop and evaluate methods of emotional response
classification using human physiological data. With the continued development of
automated systems that interact closely with humans in a more natural manner the ability
of such systems to determine the emotional state of nearby subjects and adapt
accordingly is increasingly important. Applications include the broad area of affective
computing as well as more specific areas such as evaluating the effectiveness of virtual
reality based treatment for social phobias. In this work, various non-invasive sensors are
used to collect physiological data during virtual reality simulations. Feature extraction,
feature selection, and machine learning is performed on the data to determine which
signals and algorithms produce the most accurate classification of the subject’s emotional
response to the simulations.
1
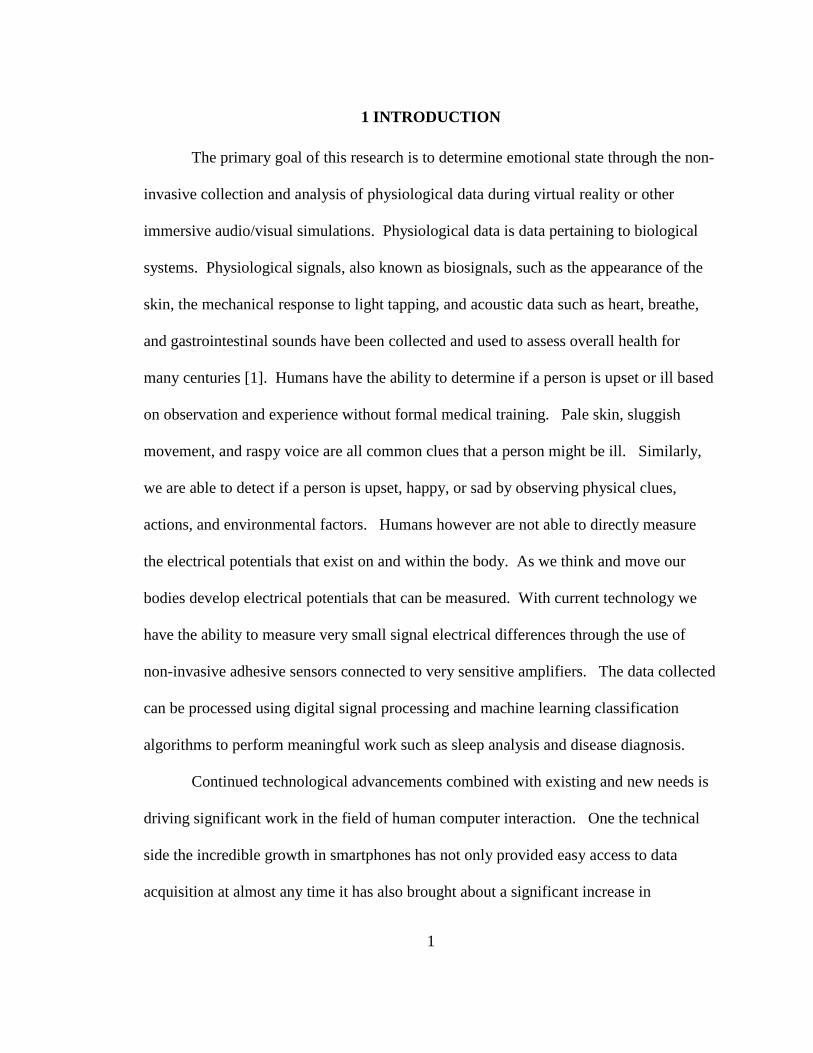
1 INTRODUCTION
The primary goal of this research is to determine emotional state through the non-
invasive collection and analysis of physiological data during virtual reality or other
immersive audio/visual simulations. Physiological data is data pertaining to biological
systems. Physiological signals, also known as biosignals, such as the appearance of the
skin, the mechanical response to light tapping, and acoustic data such as heart, breathe,
and gastrointestinal sounds have been collected and used to assess overall health for
many centuries [1]. Humans have the ability to determine if a person is upset or ill based
on observation and experience without formal medical training. Pale skin, sluggish
movement, and raspy voice are all common clues that a person might be ill. Similarly,
we are able to detect if a person is upset, happy, or sad by observing physical clues,
actions, and environmental factors. Humans however are not able to directly measure
the electrical potentials that exist on and within the body. As we think and move our
bodies develop electrical potentials that can be measured. With current technology we
have the ability to measure very small signal electrical differences through the use of
non-invasive adhesive sensors connected to very sensitive amplifiers. The data collected
can be processed using digital signal processing and machine learning classification
algorithms to perform meaningful work such as sleep analysis and disease diagnosis.
Continued technological advancements combined with existing and new needs is
driving significant work in the field of human computer interaction. One the technical
side the incredible growth in smartphones has not only provided easy access to data
acquisition at almost any time it has also brought about a significant increase in
2
performance while lowering of cost of many sensors. Cameras, ambient light detectors,
and accelerometer/gyroscope combination sensors have all benefited significantly due to
the popularity of smartphones. When incorporated into a smartphone or wearable device
these sensors can provide significant information about the owner’s activities and the
environment surrounding them. Additionally, significant improvements in processing
power due to the availability of cloud based computing and massively parallel graphical
processing units allow us to run much more sophisticated and computationally complex
algorithms on ever increasing amounts of collected sensor data.
This research will be applicable to many real-world problems including: the
evaluation of the effectiveness of various addiction treatments, the study of the impact of
media and/or audio/visual stimuli such as gaming, and the ability to monitor emergency
responders during crisis simulations.
1.1 Motivation
There are multiple technological and demographic changes that highlight the need
for evermore human aware computing. As more automated systems replace roles
previously performed by humans it will be beneficial to provide the systems with some
level of simulated empathy. This ability to adapt based on human emotion has been
termed Affective Computing by Rosalind Picard [2]. The driverless car is an appropriate
and familiar example of an emerging computing category that will benefit from
additional information regarding the passengers and bystanders emotional state. Another
example is home health devices and even robotic assistants where natural language
interfaces can lower the barrier and obvious divide between human and computer.

3
Today many facilities are outfitted with emergency defibrillators which upon removal
from the storage container provide spoken instructions on how to properly connect to the
person requiring assistance. Once connected data sensor will be used to control the
actions of the defibrillator or provide further vocal instructions. Lowering the barrier
and facilitating more natural interaction between humans and the device will clearly
improve the outcome in what is likely a life-or-death situation.
1.2 Challenges
In the following sections greater depth and detail will be provided on some of the
challenges that can lead to poor prediction of emotional response. One of, if not the, key
challenges is the obtainment of accurate measurements. There are a number of aspects
that need to be considered. Some are inherent in the biology of the subjects; these
include the fact that the signals themselves are very small and the body generates a
variety of different electrical potentials in response to brain activity, muscle activity, and
involuntary reactions to stimuli [3]. On the sensor side there is a constant struggle
between the need for very good electrical conductivity to the skin and the non-invasive
least intrusive goals for a system which would ideally be used continuously. For
example, highly accurate measurement of muscle activity typically entails the use of a
needle electrode in the muscle itself [4]. For the best non-invasive signal on the skin
surface, skin preparation such as an alcohol scrub to remove dead cells and a strong
adhesive electrode with pre-applied electrolyte gel is typically used. If the location has
hair it may be shaved beforehand to facilitate a better connection and lessen the difficulty
in removal of the electrode [5]. Given these hassles widespread adoption is unlikely.

4
However, it is easy to foresee that electrodes will be incorporated into clothing, jewelry,
and other worn accessories. Currently the signals available through these types of
sensors are far weaker and noisier than securely attached disposable electrodes [6].
Similarly, the results for replacing a gelled EEG electrode, one of the most cumbersome
electrodes due to the quantity required along with hair interference for skin preparation
are improving. [7]
This research is focused on the evaluation of current techniques from a technical
perspective however, there are significant personal and privacy issues that will need to be
addressed as data from sources such as webcams, wearable devices, and smartphones are
used to give systems and their developers the ability to classify a person’s emotional
state. Stephen Fairclough provides a brief introduction to some of these considerations
in his argument for stronger privacy protections of physiological data [8].
1.3 Applications
As machines become more human-like through emerging capabilities such as
natural language recognition and response and they are used even more pervasively to
complete tasks currently performed by humans such as home health care the importance
of proper emotion state classification will increase [9]. For example, a taxi driver would
be able to tell if a passenger appears uncomfortable and potentially nauseous. In that
case the driver would likely take action such as providing fresh air, describing the current
traffic situation and expected arrival time, or even modifying the route to limit the
number of turns and curves. As self-driving cars replace this human task, it will be
essential to have the capability to use the information regarding the passengers emotional

5
and physical well-being to perform the proper actions to ensure that their comfort is
maximized and needs are met.
Despite many advances in sensor technologies, amplification techniques, filtering
and machine learning algorithms the ability to predict emotional response is still quite
low even with fairly cumbersome sensors, in controlled environments, and with limited
classification labels [10]. However, the number of sensors worn or near a person will
continue to increase significantly. Ultimately accurate prediction will likely require a
significant amount of sensor fusion [11] with input not only from a number of sensors but
also from a number of different types of sensors. With so many sensors techniques to
eliminate noisy or erroneous data will have to be developed and improved so that a single
bad sensor does not disrupt the accuracy of the entire system. Three broad categories of
sensors are in use today to detect physiological data [12]. These include imaging via
cameras, surface electrical sensors as described here, and the 6-axis
accelerometer/gyroscope combination sensor [13] that is present in virtually every
modern smartphone and tablet [14].

6
2 BACKGROUND AND RELATED WORK
Human observable physiological data plays and important role in many areas
ranging from social interaction, parenting, and the practice of medicine. The discovery of
the electrical nature of living organisms and improvements in the ability to measure very
small signal electrical differences have enabled the collection of physiological data that is
useful for sleep analysis [15] and disease diagnosis [16]. Early work regarding
emotional states includes that by Ekman and Friesen on universal facial behaviors. This
study used six emotional states: happiness, anger, sadness, disgust, surprise, and fear
[17]. The interactions of the sympathetic and parasympathetic nervous system cause
physiological changes that are measurable. Work in this area includes Emotion
Classification based on Bio-Signals, [18] which measured electrodermal activity (skin
resistance), electrocardiograph (heart activity), peripheral temperature, and blood oxygen
levels. Image processing and machine learning techniques have been used to classify
emption based on facial images and voice recordings [19].
From end to end the process of classification of human state followed by the
research studies surveyed can be summarized as:
Collect Data preferably utilizing multiple subjects who are experiencing a wide
range of emotions.
Process the data to remove noise and erroneous samples.
Add labels with the emotional state information.
Parse the data into fixed time segments e.g. 2.56 seconds for 50 Hz sampling
yields 128 data points.

7
Perform feature extraction on each data type and time segment e.g. the mean
value and fundamental frequency.
Separate the data into training and testing portions. Typically, the training data
is significantly larger, a common split is 70% training, 30% testing.
Use the training data to train the targeted classifier.
Use the trained classifier to predict the emotional state of the testing data
samples.
Compare the predicted and actual results to establish the accuracy of the
predictions. Actual versus predicted results are shown in a confusion matrix
from which an overall accuracy and error rate can be computed.
2.1 Human Emotional Response
The prediction of human emotional response via biosignals is based on the
relationship between the parasympathetic and sympathetic branches of the autonomic
nervous system [20] [21] [22] [23]. Further details of the signals used are provided in
the following sections.
2.2 Physiological Signals
This research includes only physiological signals that can be measured non-
invasively. Specifically, sensors which involved puncturing of the skin or contact with
mucosal membranes (e.g. oral thermometer) were excluded when determining the signals
to be monitored. The remaining signals can be separated into two distinct categories –
electrical biosignals and physical biosignals. The electrical signals are monitored via
adhesive electrodes connected to a highly sensitive amplifier. The physical signals are

8
monitored with a variety of sensors which sense some physical aspect of the subject such
as movement or surface skin temperature.
2.2.1 Electrical Physiological Signals
Significant information can be gained through the collection of electrical
physiological data. The most commonly accessed electrical physiological signals are
summarized in Table 1 and include:
Electroencephalogram (EEG): An external measure of the activity occurring in the
brain. EEG signals are categorized based on location of measurement and frequency.
They are among the most difficult electrical signals to measure due to the low signal
amplitude, the difficulty in securing electrodes through the hair and to the scalp, and the
likelihood of other signals such as facial muscle movement induced EMG to overwhelm
the EEG signal [24].
Electrocardiogram (ECG): A measure of the electrical activity driving the heart [25].
Typically measured as a differential signal across the heart with electrodes placed on both
wrists or both shoulders with a ground reference on the elbow. For medical applications
additional electrodes are typically placed at predefined locations on the chest; the
resulting signals provide insight in the sequence of contractions of the heart.
Electrodermal Activity (EDA): Electrodermal activity is historically referred to as
Galvanic Skin Resistance (GSR). It is commonly recognized as a key signal in lie
detector equipment [26] that includes two electrodes strapped to the tips of two fingers on
the same hand. The fundamental observation is that during periods of increased arousal
the electrical conductance of the skin decreases especially when measured across the

9
palm of the hand or sole of the foot [27]. It is one of the earliest electrical physiological
signals to be associated with changes in emotions.
Electromyography (EMG): A measure of the electrical potential between two points
along a muscle which indicates the level of muscle activity. Due to the inherent
electrical resistance of the skin surface EMG measurements have limitations over needle
based electrodes but meet the non-invasive criteria. To detect emotion response EMG
measurements are typically made on muscles that tense under stress such as the jaw and
shoulder muscles [28].
Electrooculography (EOG): The eyeball exhibits a voltage potential from front to back.
By analyzing signals obtained from electrodes placed above/below and left/right of the
eye the position and movement of the eye can be calculated [29]. This is especially
useful for sleep studies where eye movement cannot be determined visually. Because
the eye is so closely coupled to our vision system which represents a significant portion
of our brain factors such as speed of movement and duration of held gaze are likely more
important to emotional state than the actual direction the subject is looking.

10
Table 1: Electrical Physiological Signal Names and Sensor Types
Signal Name Sensor Type
Sensor
Location
Physiological Data
Electroencephalogram
(EEG)
Ag/AgCl
electrode
Scalp Brain Activity
Electrocardiogram
(ECG)
Disposable
electrode
Wrists or
Chest
Heart Rate, Heart Rate
Variability
Electrodermal Activity
(EDA) aka GSR
Finger
Electrode
Hand or Foot
Skin Resistance, Sweat
Gland Activity
Electromyography
(EMG)
Disposable
electrode
Arms, Legs,
Face
Muscle Activity
Electrooculography
(EOG)
Ag/AgCl
electrode
Face Eye Movement, Position
2.2.1 Non-Electrical Physiological Signals
The common electrical signals described previously represent only a subset of the
possible physiological measurements that can be made. Many wrist or waist-worn
fitness trackers can accurately measure movement and therefore they are able determine
the number of steps taken. Mechanical or digital thermometers are frequently used to
measure body core temperature. A partial list of non-electrical physiological
measurements is in Table 2. In the field of emotion recognition and classification image

11
processing and machine learning techniques can be used on images of a person’s face to
classify emotion. Similar techniques have been applied to voice.
Table 2: Non-Invasive Physiological Signal Names and Sensor Types (partial list)
Signal Name Sensor Type Sensor
Location
Physiological Data
Photoplethysmogram
(PPG)
Photoelectric
Pulse Oximeter
Finger,
Earlobe
Heartrate, Blood
Oxygen Level
Respiration Belt, Flow
Sensor
Chest, Face Respiration Rate,
Volume
Pupil Imaging Near Eye Pupil Dilation, Eye
Movement
Position Accelerometer,
Gyroscope
Torso, Head,
Limbs
Movement
Peripheral Temperature
(SKT)
Thermistor Hand Skin Temperature
2.3 Emotional Classification Labels
As mentioned previously the goal of this research is to accurately determine a
person’s emotional state. It follows therefore that some standard and widely recognized
set of emotional state labels should be used. Unfortunately, there is not general
agreement on a single set of labels that can correctly and accurately reflect a person’s
range of emotions and categorize them completely.

12
There does seem to be general agreement that two broad indicators underpin
emotional state classification. The first is a measure of arousal or overall physiological
activity. Minimum arousal would be reflective of calm, relaxed, bored states while high
arousal would indicate excitement or fear. The second attribute is valence which is a
measure of positive versus negative emotion. For example, is a person is in a highly
aroused state they might be experiencing extreme joy or extreme terror. This difference
would be reflected in the value of the valence [30].
One measure of the difficulty for an emotional classification problem is the
number of possible outcomes, specifically the number of distinct emotional states that are
to be determined. A binary classifier might obtain 50% accuracy by selecting only a
single output state given an input of random data. Similarly, a classifier with six
potential outcomes would achieve an accuracy of only 16.7% by pure chance. Given the
wide variably and lack of clear consensus in the industry the labels used in classification
by the studies that reported results varies considerably. The classification labels are listed
in Table 3.
2.4 Experimental Elicitation of Emotional Response
The generation of intense physiological responses spanning a range of emotions is
a challenge. Ethical aspects and subject health must be taken into account when
planning experiments. Some of the least upsetting stimuli include colors, music, and
self-directed thought experiments e.g. “Imagine a time when you were very happy”.
With such an experimental setup the degree to which the emotion is experienced and
consequently the level of physiological response will be limited [31]. In order to elicit

13
stronger emotional responses different and likely more upsetting or deceitful techniques
have been used. This type of experimental setup necessitates a careful and thorough
review by an independent Institutional Review Board (IRB) to insure the protection of
the research subjects.
One surveyed study [32] utilized the existing International affective picture
system (IAPS) photoset which is available upon request and approval from the National
Institute of Mental Health Center for Emotion and Attention at the University of Florida
[33]. Several benefits of this photo set include its availability and broad usage and its
well-developed classification and categorization of the images. In order to induce a range
of emotions the photoset include images which may be disturbing and therefore careful
experimental procedures must be followed to insure proper outcomes and protect the
subjects.
Two related studies utilized video game techniques [34] [35]. Given the ubiquity
of video games and simulated environments this experimental setup poses less risk with
the tradeoff that the range of emotions may be reduced. Of particular note is that [34]
utilized the expertise of three trained physiologists to perform the labeling of the
subjects’ emotions based on the game scenario and direct observation of the subject.
Other experimental techniques employed by the studies surveyed include film
clips, a board game, startling noises, and music. Other possible methods of inducing an
emotional response include placing the hand in ice water also known as the “cold
pressor” test [36], public speaking, “floor drop” or other startling scenarios within VR
environments.

14
A summary of the techniques used by the surveyed studies during experimentation is
included in Table 3.
Table 3: Emotion Elicitation Techniques and States
Ref. Technique Assessment Emotional States (Labels)
[32] IAPS Photoset Based on IAPS
classification
Arousal and Valence
[18] Film clips, a
game, unexpected
noise
Subject Self-
Reporting
Joy, Sadness, Anger, Fear,
Surprise, Neutral
[34] Simulated (VR)
Driving
Experienced
Psychologists
Arousal and Valence + High Stress,
Low Stress, Disappointment,
Euphoria
[37] Music from
Existing Corpus
Subject Self-
Reporting
Anger, Joy, Sadness, Pleasure
[35] Video Game –
NHL 2003
against Friend,
Stranger,
Computer
Self-Reporting plus
Survey Questions
Boredom, Challenge, Excitement,
Frustration, Fun
[38] Film Fragments Prior Classification
of Film Fragments
and Self-Reporting
Neutral, Positive, Mixed, Negative
15
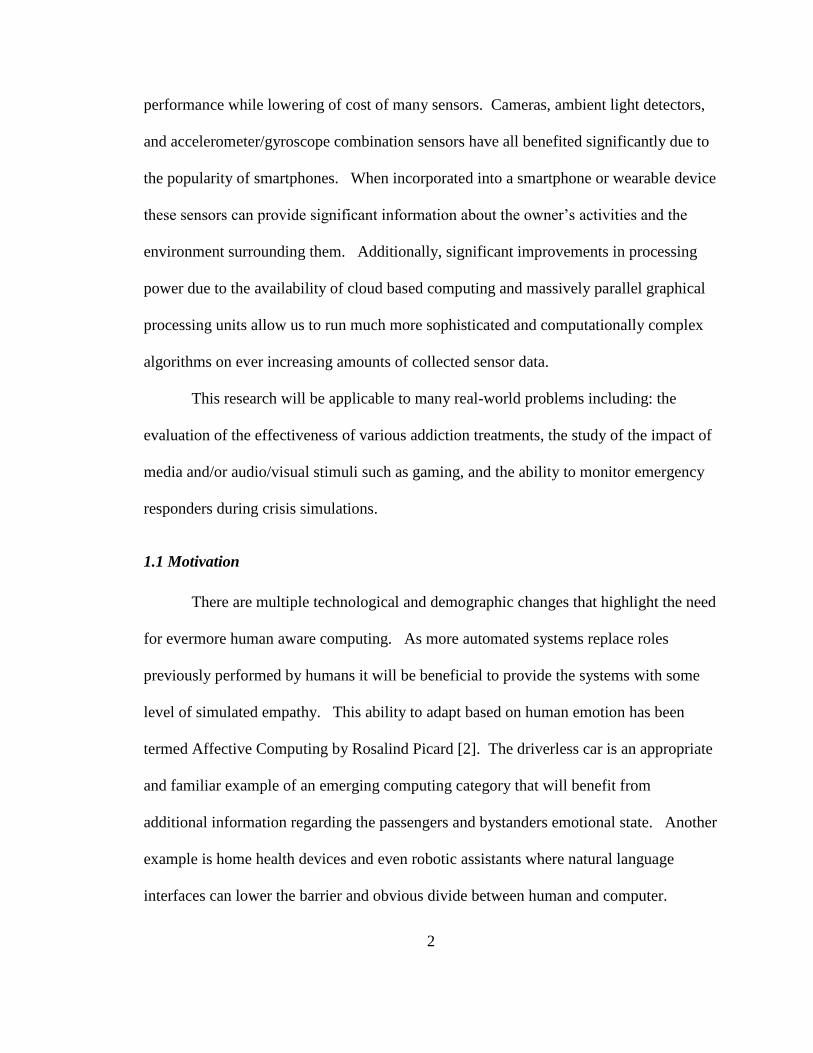
2.5 Data Processing and Feature Extraction
Since the signals measured are very small the effect of noise must be mitigated.
Electrical systems in the facilities where the data is collected usually operate at 50 or
60Hz and therefore a band pass or notch filter is typically employed to eliminate any
noise inducted via the building wiring and resulting electromagnetic fields [39].
Many of the studies reviewed employed fairly standard feature extraction
techniques that are applicable to time based signals. Typical features include the mean
value, root mean squared (RMS) value, mean max amplitude, rise duration, and heart
rate. Proper feature extraction is a key component of the process to insure good results
and includes some amount of domain knowledge. For example, heart rate can increase
for non-emotional reasons such as increased physical activity. It has been shown that
heart rate variability – the difference in timing between adjacent beat has been shown to
have some level of correlation to the level of arousal present [40].
There are a number of machine learning classifiers available [41]. The topic of
machine learning and classifiers is extensive, only a brief overview will be provided here.
In a typical case the classifier is provided with an array consisting of multiple columns
which contain attributes that have a measured value or calculated feature and one column
with the label for training sets [42]. For a classic home price prediction example
attributes might be total square footage and number of bedrooms. In this example the
label would be last selling price and this would also be the value to be predicted for new
samples. Each row of the input matrix represents a sample. When the training data is
input into the classifier it determines the best set of values to fit the provided labels.
Three of the most popular machine learning classifiers are:

16
k-Nearest Neighbor – the predicted value is the most prevalent value among the k
samples that are closest to the input value in multidimensional space [43].
Support Vector Machines – the multidimensional solution space is separated by
hyperplanes that are determine based on the training data. The input data prediction is
determined by its location relative to the hyperplane divided space [44].
Artificial Neural Networks – modeled after the human brain these classifiers are
constructed of neuron like nodes which can take multiple inputs to determine a single
output [45]. The output of each node is typically connected to multiple additional nodes.
The prediction accuracy when using electrical physiological signals and machine
learning techniques is typically low especially in juxtaposition with some current
successes in the areas of voice recognition, facial recognition, and spam filtering [46]
[47].

17
3 METHODOLOGY
The general activities included in this research are: Eliciting Emotional Response
and Data Collection, Data Processing, Labeling, and Feature Extraction, Feature
Selection, Training and Validation of Multiple Classifiers, Evaluation Using New Subject
Data. Additional detail on each of these steps is provided in the following sections.
3.1 Experimental Design for Elicitation of Response
The Virtual Reality sessions were chosen from applications available for the Oculus
Rift [48] that were also compatible with the Oculus DK2 headset with the following
general criteria:
Readily available content – free on Oculus web store
Range of relaxing to exciting, while avoiding disturbing or mature content
Both passive (movies, demos) and active (games) subject involvement.
The targeted total time wearing the VR headset was slightly more than 60 minutes.
Early experiments showed that after approximately 1 hour subjects began to tire of the
VR environment. The final session was a game which could be terminated at any time
based on the subject’s fatigue and desired to continue. The total time required to
describe and launch the application plus the recording of subject’s responses after each
session so the actual in VR time was significantly less. The total time required per
subject was approximate 2 ½ hours. This included skin preparation and application of
the adhesive electrodes, connection of the electrodes to the BioRadio, adjusting and
donning the RIP bands, and mounting of both radios as well as removal of the equipment
after the conclusion of the VR sessions.

18
Session 1: Introduction to Virtual Reality Movie/Demo
This is a short film/animation that introduces the 3D capabilities of the VR
headset. It was selected at the first session in order to get the subject used to the Virtual
Reality headset and provide time to verify that all the sensors were recording properly.
It contains several short 3D movies and is in general neutral.
Session 2: The Rose and I Movie
A short animated VR film by Penrose Studios that made its World Premiere in the
New Frontier section at the Sundance Film Festival 2016. It is largely relaxing and
pleasant with one potentially startling event where the flower “coughs.”
Session 3: Discovery VR Action Videos
The application contains a number of videos and the following two were selected:
Video 1 “Get Ready for the Drop” is a 360° Video of a Rollercoaster ride
Video 2 “Jump into the Unknown” is 360° Video of a Rope Pendulum Swing
As both the rollercoaster and the pendulum swing would be considered “thrill” rides
these were chosen to represent more exciting segments. In addition, the pendulum swing
contained scenes that would be unsettling to someone with a fear of heights.
Session 4: InCell Game
An interactive game where you ride along a tubular track and try to capture white
and green objects while avoiding red obstacles. This application was chosen to represent

19
game play where concentration is required and positive and negative consequences could
be observed.
Session 5: Lost Movie
The second 3D Virtual Reality movie which takes place in a dark forest with
multiple startling events such as a bird swooping by. It was anticipated that this movie
would score higher arousal marks than the previous Rose and I movie.
Session 6: Dream Deck
A 3D Virtual Reality demo including multiple short demos. The city scene, alien
encounter, and dinosaur were specifically singled out for subject response with the intent
of invoking emotions including fear (of heights), anxiety (non-human experience), and a
frightening (charging dinosaur) emotions.
Session 7: Lucky’s Tale Game
A 3D adventure game using 3rd person perspective in a VR environment. This
was chosen as the final session that the subject might find enjoyable and interactive. The
subjects were given the option of stopping at any time or continuing to finish a full game
which took approximately 15 minutes. For all the game the hope is that some in-game
event will elicit an emotional response that can be analyzed however given the variation
in game play this is very difficult to guarantee and the timing can vary considerably.
20
3.2 Data Collection
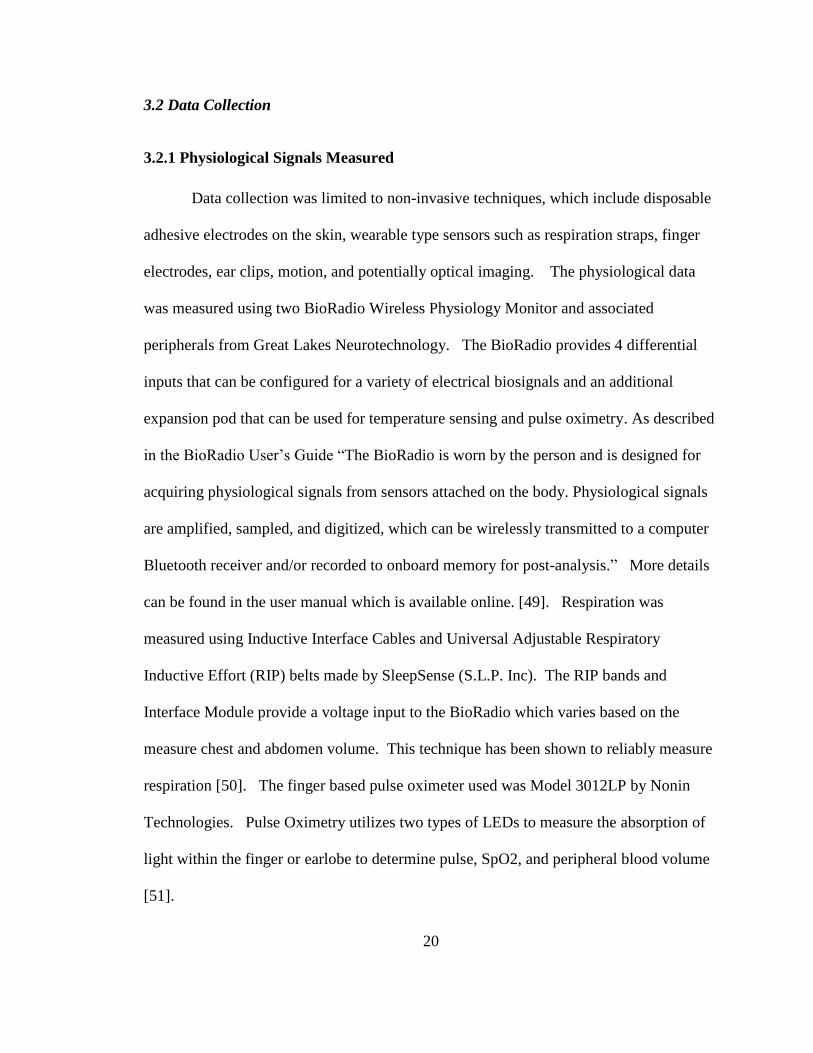
3.2.1 Physiological Signals Measured
Data collection was limited to non-invasive techniques, which include disposable
adhesive electrodes on the skin, wearable type sensors such as respiration straps, finger
electrodes, ear clips, motion, and potentially optical imaging. The physiological data
was measured using two BioRadio Wireless Physiology Monitor and associated
peripherals from Great Lakes Neurotechnology. The BioRadio provides 4 differential
inputs that can be configured for a variety of electrical biosignals and an additional
expansion pod that can be used for temperature sensing and pulse oximetry. As described
in the BioRadio User’s Guide “The BioRadio is worn by the person and is designed for
acquiring physiological signals from sensors attached on the body. Physiological signals
are amplified, sampled, and digitized, which can be wirelessly transmitted to a computer
Bluetooth receiver and/or recorded to onboard memory for post-analysis.” More details
can be found in the user manual which is available online. [49]. Respiration was
measured using Inductive Interface Cables and Universal Adjustable Respiratory
Inductive Effort (RIP) belts made by SleepSense (S.L.P. Inc). The RIP bands and
Interface Module provide a voltage input to the BioRadio which varies based on the
measure chest and abdomen volume. This technique has been shown to reliably measure
respiration [50]. The finger based pulse oximeter used was Model 3012LP by Nonin
Technologies. Pulse Oximetry utilizes two types of LEDs to measure the absorption of
light within the finger or earlobe to determine pulse, SpO2, and peripheral blood volume
[51].

21
Table 4: Physiological Signals Recorded
Radio Signal Location Qty
H_Ch1 EEG f4 High right forehead 1
H_Ch2 EOG - Horizontal Outside of eyes 1
H_Ch3 EOG - Vertical Above and below right eye 1
H_Ch4 EMG – Zygomaticus “smile” muscle Right cheek 1
H_int Accel XYZ, Gyro XYZ Rear of head 6
B_Ch1 GSR (Electrodermal Activity) Right index & pointer finger 1
B_Ch2 ECG Left and right wrists 1
B_Ch3 Chest Respiration (RIP) Chest strap 1
B_Ch4 Abdomen Respiration (RIP) Stomach strap 1
B_Aux Peripheral Temperature Right pinkie finger 1
B_Aux Heart Rate via PulseOx Right ring finger 1
B_Aux Blood Volume (PPG) via PulseOx Right ring finger 1
B_Aux Blood Oxygen (SpO2) via PulseOx Right ring finger 1
B_int Accel XYZ, Gyro XYZ Right waist 6

22
3.2.2 Skin Preparation and Electrode Placement
Each subject was provided with an instruction sheet guiding them in the skin
preparation and electrode application. They were asked to clean the skin where the
electrode will be attached with an alcohol swab to remove any oils, lotions, makeup, etc.
as well as dead skin. They were specifically told that was not necessary to scrub
vigorously. They were also instructed to take care particularly around the eyes and
installed the under eye electrode down far enough to avoid the sensitive under eye skin.

23
After the alcohol was allowed to dry, the cloth electrodes were removed from the
backing (it helps if the facilitator removes the electrode and hands it to the subject) and
applied to the skin as shown below.
Wrist/Hands
1 Middle segment of right index finger, palm side
2 Middle segment of right pointer finger, palm side
3 Left wrist, palm side
4 Right wrist, palm side
5 Right elbow
Figure 1: Placement of Electrodes on Left and Right Hands

24
Face
6 High on right forehead near hairline
7 Center of forehead ~2 cm above brow line
8 Above right eye and eyebrow
9 Right of right eye
10 Below right eye - careful not too close - skin is sensitive here
11 Most prominent point of right cheek bone
12 Above and slightly to right of mouth “dimple” area
13 Left of left eye
IMPORTANT: This diagram is mirrored for use while looking in mirror
Figure 2: Placement of Electrodes on Face

25
The electrodes used in this study were MVAP-II Electrodes containing a
Silver/Silver Chloride Sensing Element with Hydro Gel and manufactured by MVAP
Medical Supplies 1415 Lawrence Drive, Newbury Park, CA 91320. During early testing
two other electrode types were evaluated: The Skintact Premier 3415 by Leonhard Lang
GmbH and TD-141C square cloth electrodes from Florida Research Instruments. The
Skintact electrodes adhered well but were uncomfortable to remove after testing. The
Florida Research Instruments electrodes were more comfortable but came off several
times during evaluation. These observations are noted for the adhesive only; no
comparison of the relative electrical signal performance was made.
3.3. BioRadio mounting and cabling
A seemingly simple but significant issue was mounting the BioRadio uniformly
and securely. The BioRadio is equipped with a removable belt clip however since the
accelerometer and gyroscope are internal to the radio a uniform mounting independent of
clothing was desired. The characteristics of the radio attached to an elastic waist band
might vary significantly versus one clipped to a tighter belt.
For the head radio the first attempts were to simply clip the radio onto the straps
of the Oculus DK2. The Oculus is fairly immobile on the head however the BioRadio
moved significantly when just clipped to the strap. A big improvement in mounting was
made by using a plastic mounting bracket modified from an inexpensive LED headlamp
which was secured to the straps at the cross point directly in the back of the head. The
BioRadio clip was still used but given the thickness of the plastic bracket the radio’s

26
movement independent of the head was significantly reduced as shown in the right hand
picture in Figure 3.
Figure 3: “Head” BioRadio mounting improvements
In order to eliminate the possibility of clothing affecting the motion capture of the
“body” radio a back supporting belt was utilized. This belt attaches securely around the
waist and the Velcro closures were used to hold the body radio tightly against the right
side of the waist. Additionally, it was possible to also use the Velcro flaps to secure the
cables and sensor pods associated with the RIP belts.

27
Figure 4: Body BioRadio mounting with Back Support Belt
As can be seen in these photographs, cable management remained somewhat
cumbersome. This is a problem for several reasons. First the subject’s movement is
somewhat limited. This did not prove to be an issue for these activities that consisted
only of sitting and standing in a limited area but it will be a greater problem as movement
is increased. Directly related to this is the fact that the cable can become snagged and
disconnect during the activities. This required special attention especially with respect to
the ergonomic armrests and adjustment knobs on the chair. Finally cable movement can
induce noise into the signals. Best practices include taping or affixing the cables tightly
to the body but this was not practical in a non-medical setting. Future setups would
benefit from a fixed harness where the cables are joined into less cumbersome bundles.
Once wireless transmission and device power reaches maturity eliminating the cables
completely through the use of Bluetooth LE enabled sensors would result in a much more
pleasant experience for the subject.

28
3.3.1 Video Collection and Event Markers
All data collection experiments were recorded with a high definition video
recorder and external microphone. This video and audio record proved very valuable
when labeling the sessions. In addition, the marker functionality of the BioRadio was
used to mark key segments such as the start of a VR application in the data set.
3.3.2 Subject Feedback Regarding Arousal and Valence
Initial experimentation showed that getting consistent and reliable feedback from
the subject is challenging. It is quite difficult to describe many of the experiences in
consistent emotional terms. Indeed, the question “How did that make you feel?” is an
opened ended on often used in therapy. Even members of the research team who were
familiar with the classification of emotion and the arousal-valence model struggled to
enunciate what types of emotion a specific video or game induced.
Initial attempts to simplify this process included several variation of multiple
choice selections. One was specifically based on the six universal emotion categories
used by Ekman and Friesen [3] which are: happiness, anger, sadness, disgust, surprise,
and fear. Unfortunately, while these emotions may be present in all subjects they did not
cover the range of emotion reported during the experimentation. After watching what
could be best described as either a relaxing or boring video there is no best fit response
available with these six categories.

29
Figure 5: Emotion and Range Subject Response Form – too complex
Figure 5 shows a second iteration, which included a listing of emotions along with
a ranking. Subjects were asked to complete the table after each session. Two
fundamental issues arouse with the use of this form. First the revised categories still did
not match with the subject’s expressed emotion during the simulation. Second the
addition of a range considerably lengthened the time that subjects required to complete
the feedback.
Another issue arose once the testing was moved exclusively to the Virtual Reality
environment. The initial thinking was that the subjects would welcome a brief break
between the 3 to 8 minute sessions to remove the Virtual Reality headset and complete
the survey form. However, the frequent removal of the headset proved to be annoying
and broke the flow of the simulations. Once “inside” the Virtual Reality world it was
much preferred to continue with the sessions. Furthermore, many of the electrodes and
wires are located on the face and hands so the removal of the headset was much more
30
cumbersome than it would be during traditional usage. This also increased the risk that
one of the cables or electrodes could be disconnected.
The final methodology employed was a simplified version of the arousal-valence
model. Instead of removing the headset to fill out a form, the subject was asked verbally
the following questions after each session:
Did you find this [movie, game, demo] exciting, relaxing, or neutral?
Did you find this [movie, game, demo] pleasant, unpleasant, or neutral?
While there was still some hesitation on the subject’s part especially during longer
sessions that had multiple parts this simplified oral response method worked much better
than the prior methods.
3.4 Signal Processing and Classification
3.4.1 Data Export
The collected data was stored on a laptop running Windows 10 and two instances
of the BioCapture program. Each instance of BioCapture linked to one radio: Instance
on left was linked to the head radio, instance on right was linked to the body radio. For
consistency the recording was started on the head radio first and then on the body radio.
The typical offset involved with switching instances and setting up the second recording
was approximately 17 seconds. The keyboard was configured for a marker in the head
radio instance of BioCapture. All marker data was captured in the head instance. The
naming convention used was Sx_VRy[H,B].bcrx for subject x and session y and Head,
Body.

31
After the session was completed the files were exported from the BioCapture
program into standard comma delimited text (.csv) format. Two versions were exported,
one with RealTime information (used for synchronization) and an ElapsedTime version
(smaller and easier to handle in MATLAB).
Given the 250 Hz sampling rate each minute of collected data generated 15,000
rows in the table. The total number of rows depends on the session length and ranges
from approximately 70,000 to 140,000 rows for sessions 1 - 6. Due to the fact that it was
left to the subject as to how long to continue Session 7 has a broader range and can
exceed 250,000 rows if the subject completes the entire game. The head configuration
has 13 columns and the body configuration has 16 columns.
Figure 6: Directory Listing showing Data Files and Size after Export

32
3.4.2 Data Import, Table Join, and Labeling
After conversion to .csv format each of the 14 data files (7 sessions x 2 for Head
and Body) was imported in to a MATLAB table and stored on the University server.
MATLAB Version R2016a was used for this analysis. Product details can be found on
the MathWorks website [52]
Figure 7: Raw Subject 1 Data after Import as MATLAB Table
Since the head and body recording are separate they need to be joined prior to
classification. Unfortunately, there is no common signal nor ability to add a marker in
each file. There are known techniques of synchronizing the files based on cross
correlation however given that each of the signals is discrete and the times involved are
based on human reaction the files were synchronized using the real time data available
via the BioRadio. Specifically, an offset was calculated by subtracting the delay from
33
the start of the head recording to the start of the body recording and this was used to align
the rows prior to performing a table join. In addition, the start and stop times were also
used to discard the setup and takedown segments of each session.
A separate table containing column vectors with the subject and session data was
also created. This metadata was present in the file name and would be lost when all of
the data was combined. The table and its column vectors were joined to the initial table.
Classification labeling within each segment was much more manual and required the time
information gleaned from the video. A point was made to include a start mark (by
pressing the ‘S’ button on the laptop) in the head file that was audibly and visually visible
in the video. Since this data was also clearly present in the data file it served as the
alignment index between the video data and the signal data. For several of the sessions
the activities were further broken down into segments as previously described in the
subject self-reporting section. The video was viewed and time manually input into a
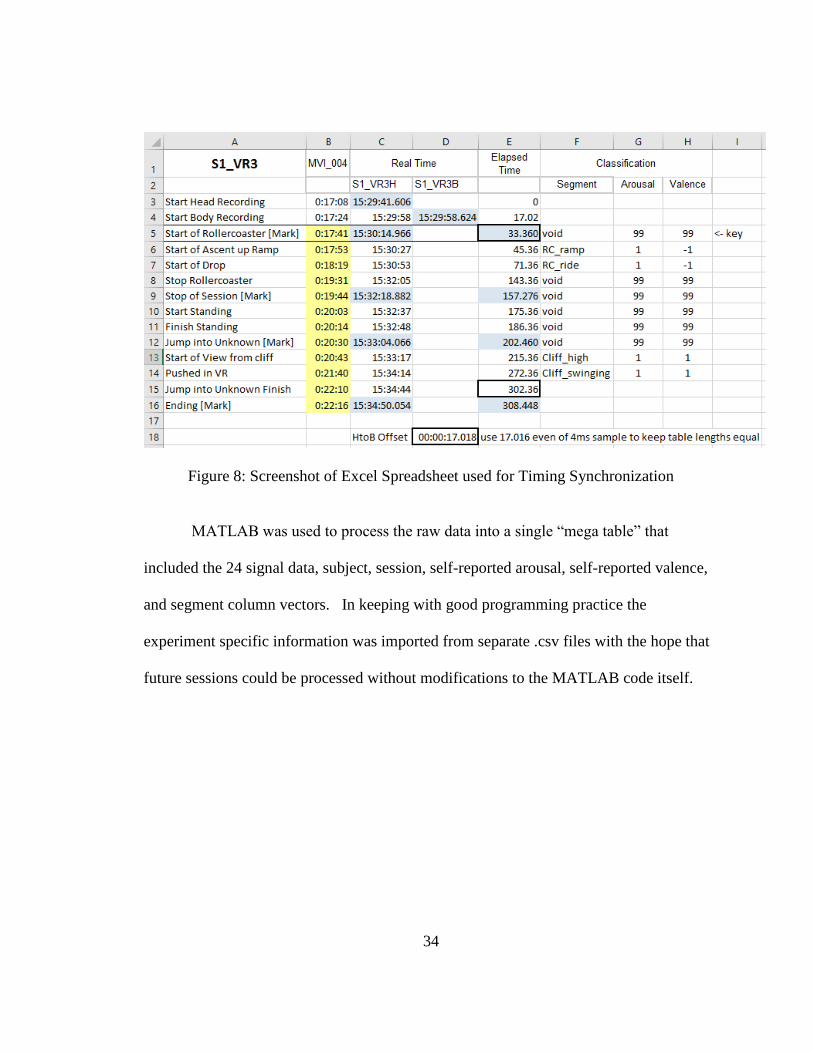
spreadsheet to convert to elapsed time in the data file.
34
Figure 8: Screenshot of Excel Spreadsheet used for Timing Synchronization
MATLAB was used to process the raw data into a single “mega table” that
included the 24 signal data, subject, session, self-reported arousal, self-reported valence,
and segment column vectors. In keeping with good programming practice the
experiment specific information was imported from separate .csv files with the hope that
future sessions could be processed without modifications to the MATLAB code itself.

35
Figure 9: Sequence Diagram of Import from .csv

36
3.4.3 Feature Extraction
Feature extraction was performed in a series of several experiments once the
dataset was available. For the very first runs a simple mean and standard deviation
feature table was built. Given the 24 time based signal present in the dataset this yielded
a table containing 48 feature vectors. A time sweep was performed from 1 second to 20
seconds to see what epoch size yielded the best results.
A second more complex set of feature extraction was performed using existing
code from the research group that extracted a total of 90 features for each signal.
3.5 Institutional Review Board
As this research involved human subjects, review and approval by the Texas State
Intuitional Review Board was required.
“Texas State University, by action of the President, has established an institutional review
board (IRB) to review human subject research. This board is supported by The Office of
Research Integrity and Compliance (ORIC). The IRB reviews research that is conducted
or supported by the Texas State University faculty, students or staff in order to determine
that the rights and welfare of the human subjects are adequately protected. The IRB is
guided by the ethical principles described in the 'Belmont Report' and by the regulations
of the U.S. Department of Health and Human Services found at Title 45 Code of Federal
Regulations, Part 46. Texas State maintains an approved Federal wide Assurance
(FWA00000191) of Compliance with the Office for Human Research Protection
(OHRP).” [53]

37
Application #2016M7258 Version #1 was approved 7/12/2016 and expires 6/30/2017.
All subjects signed an informed consent form prior to the virtual reality sessions.
Subjects were briefed on the content and approximate duration of each session
immediately prior to the session during the data collection. Subjects were periodically
reminded that they were free to stop at any time without repercussion or harm to the
research. Subjects were also told to be aware of the possibility of nausea and
read/accepted the in session Oculus health warning.
The collected dataset does not contain subject names or other known identifiable
information. All data is stored on the Texas State TRACS system with controlled access
by Dr. Vangelis Metsis.

38
4 EXPERIMENTS AND RESULTS
4.1 Self-Reported Data – Range of Responses during Simulations
Table 5: Summary of Subject Reponses
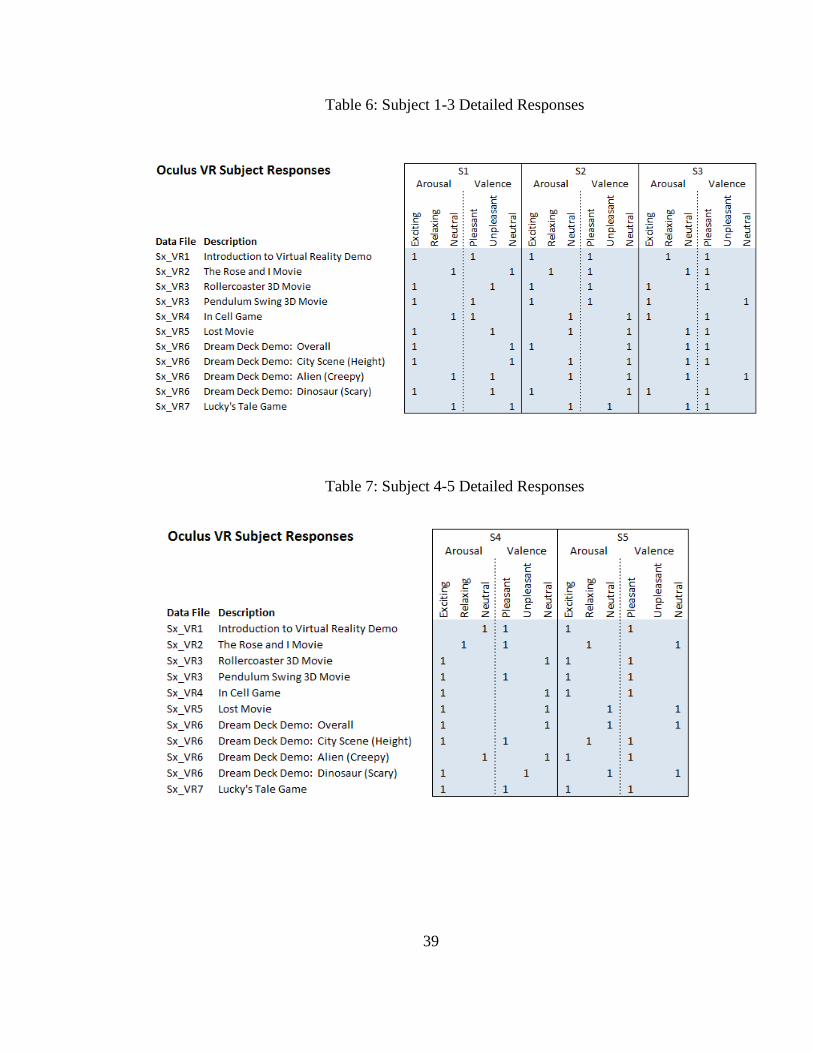
The subject self-reported data to the questions described in Section 3.3.3 are
shown in Table 5. The results are very asymmetrical with the majority of the segments
rated as ‘Exciting’ and ‘Pleasant’. This is likely due to the conservative selection of
stimuli and the limited number of subjects. For example, only one subject expressed any
trepidation regarding heights and therefore the Pendulum Swing and City Scene which
both involved a view from very high perspective with a large potential drop off was not
rated as unpleasant. By subject data is shown in Table 6 and Table 7.
39
Table 6: Subject 1-3 Detailed Responses
Table 7: Subject 4-5 Detailed Responses

40
Figure 10: Subject Responses marked on Arousal-Valence axis

41
Figure 10 shows the individual subject responses represented on a 3 x 3 grid which
reflect the arousal (y-axis) and valence (x-axis) of the rated response.
Figure 11: Summary of all Subject Responses marked on Arousal-Valence axis
Figure 11 shows the sum of the total subject responses represented on a 3 x 3 grid which
reflect the arousal (y-axis) and valence (x-axis) of the rated response.
42
4.2 Initial Signal Analysis and Data Conversion
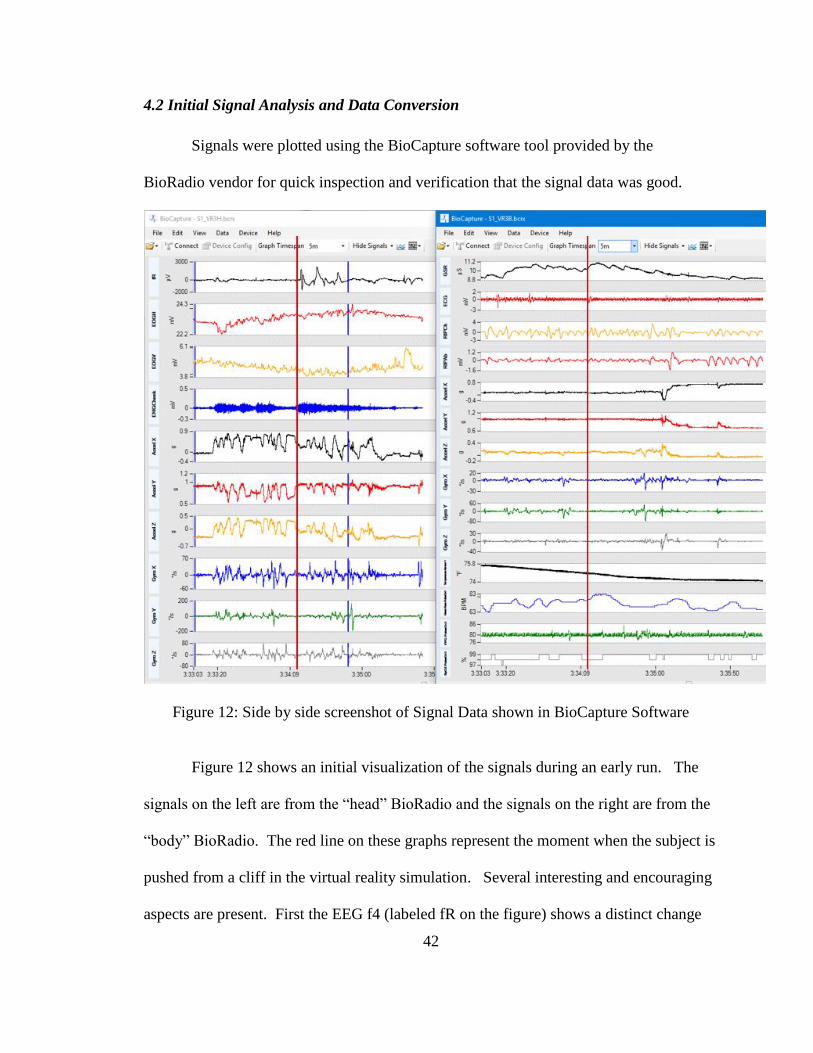
Signals were plotted using the BioCapture software tool provided by the
BioRadio vendor for quick inspection and verification that the signal data was good.
Figure 12: Side by side screenshot of Signal Data shown in BioCapture Software
Figure 12 shows an initial visualization of the signals during an early run. The
signals on the left are from the “head” BioRadio and the signals on the right are from the
“body” BioRadio. The red line on these graphs represent the moment when the subject is
pushed from a cliff in the virtual reality simulation. Several interesting and encouraging
aspects are present. First the EEG f4 (labeled fR on the figure) shows a distinct change

43
after the “push”. This is in the absence of a significant change in EOGV and EOGH
which could also affect the EEG measurement. The EMG cheek signal shows an
increase which would be associated with a smile, laugh, or potentially jaw clench. The
GSR is increasing for a period of several seconds which is consistent with a stress or
excitement reaction. Finally, the heart rate rises also consistent with an increase in
arousal.
4.2.1 Rose and I Movie
The Rose and I Movie was rated as pleasant and relaxing or neutral by all
subjects. As such we would not anticipate any significant reactions or events during the
course of the session. The graphs below show six selected signals and represent a
baseline for comparison. The session itself is approximately 4 minutes long, the graphs
show a 90 second window which is similar in duration to the rollercoaster and pendulum
swing sessions. At the 45 second mark there is a scene in the movie where a flower
sneezes and the main character is startled.

44
Figure 13: Subject Heart Rate during Rose and I Segment
The heart rate remains relatively low and unchanged throughout this video as expected.
There is a difference in the base heart rate among the subjects that is evident during this
typically relaxing session.

45
Figure 14: Peripheral Blood Volume during Rose and I Segment
The peripheral blood pulse volume exhibits some variation but with no discernable
pattern related to the session stimuli.

46
Figure 15: EEG during Rose and I Segment
The EEG f4 signal exhibits some variation but with no discernable pattern related to the
session stimuli.

47
Figure 16: EMG during Rose and I Segment
The EMG signal exhibits some variation but with no discernable pattern related to the
session stimuli.

48
Figure 17: GSR during Rose and I Segment
Subject 3 shows a potential response at time 20 seconds however there is no in session
stimuli at this point. Subject 4 shows a response at time 45 seconds which is at the time
of the previously mentioned sneeze/startle scene. Subject 2 and 3 have potential
responses as well but less pronounced. No response can be seen in Subject 1 data.
Unfortunately, Subject 5’s data in invalid due to a disconnection of the finger electrode.

49
Figure 18: Peripheral Temperature during Rose and I Segment
The peripheral skin temperature for Subjects 1,3,4, and 5 increases during this session
while Subject 2 decreases. This is in contrast to the tendency of the peripheral
temperature to decrease during the rollercoaster and pendulum swing segments.
4.2.2 Roller Coaster
The rollercoaster segment includes climbing the ramp from time 0 to 24 seconds
with the remainder of the time being the actual ride. Subject 2 reported mild nausea
immediately following the ramp segment.
50
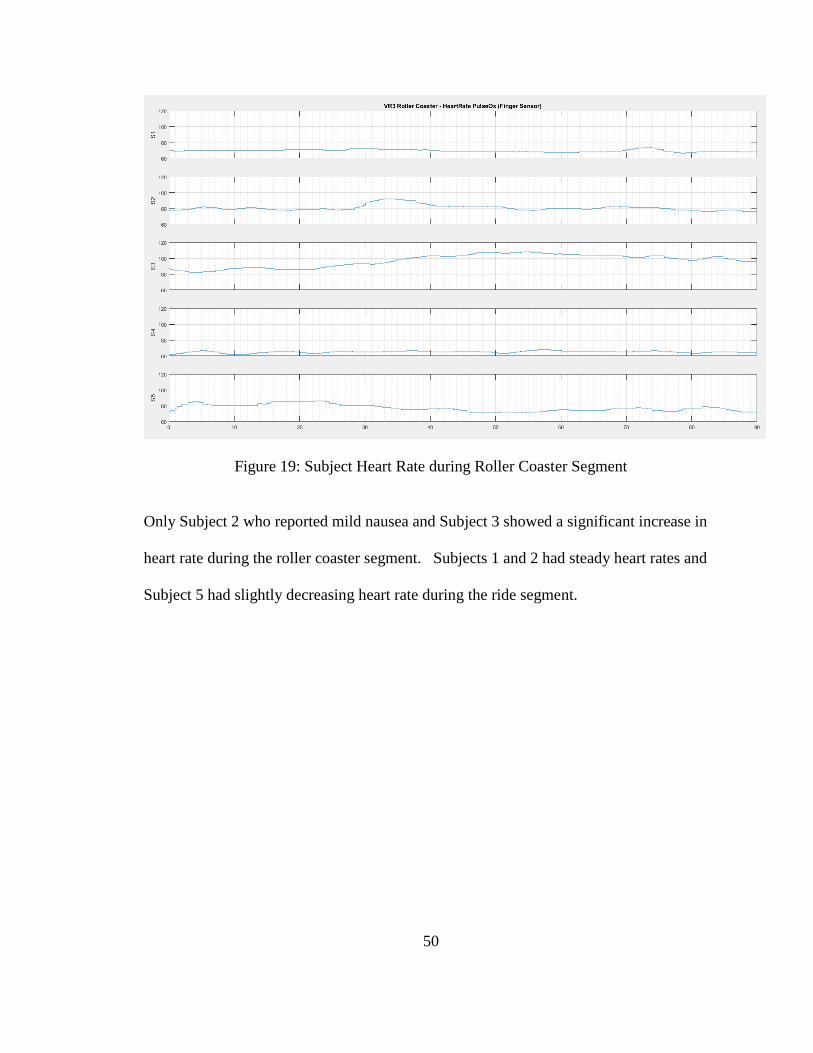
Figure 19: Subject Heart Rate during Roller Coaster Segment
Only Subject 2 who reported mild nausea and Subject 3 showed a significant increase in
heart rate during the roller coaster segment. Subjects 1 and 2 had steady heart rates and
Subject 5 had slightly decreasing heart rate during the ride segment.
51
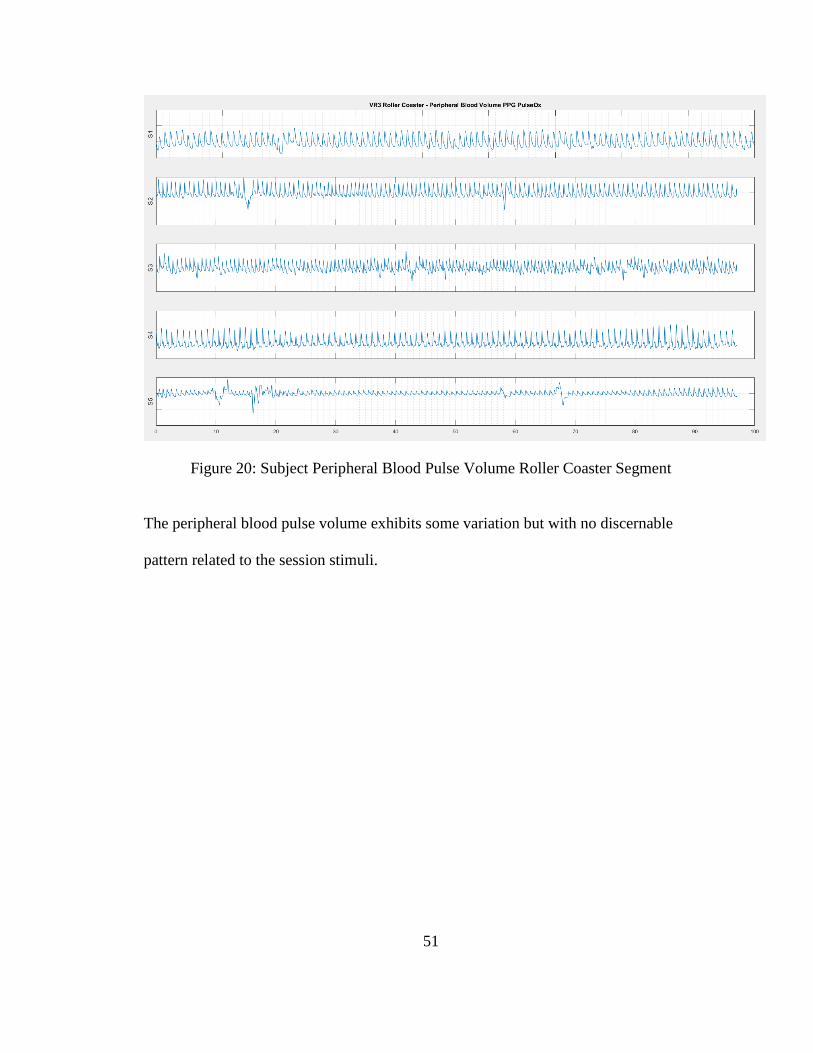
Figure 20: Subject Peripheral Blood Pulse Volume Roller Coaster Segment
The peripheral blood pulse volume exhibits some variation but with no discernable
pattern related to the session stimuli.
52
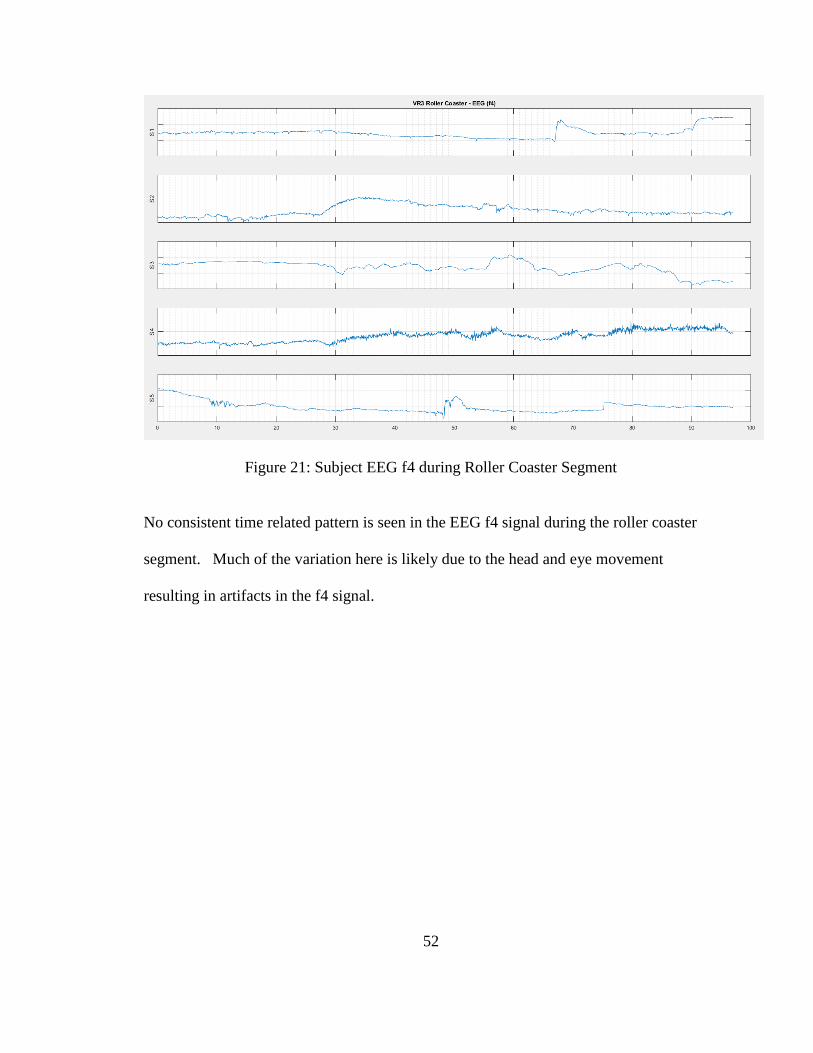
Figure 21: Subject EEG f4 during Roller Coaster Segment
No consistent time related pattern is seen in the EEG f4 signal during the roller coaster
segment. Much of the variation here is likely due to the head and eye movement
resulting in artifacts in the f4 signal.

53
Figure 22: Subject EMG signal during Roller Coaster Segment
The EMG signal for S2 and S3 increases significantly at the point of the first drop
however the DC component is less meaningful and needs to be filtered out.

54
Figure 23: Subject Galvanic Skin Response signal during Roller Coaster Segment
The Galvanic Skin Response for all 4 Subjects increases about the time of the roller
coaster reaching the top of the ramp and during the first drop. Unfortunately, Subject 5’s
electrode came loose and the data is invalid.

55
Figure 24: Subject Peripheral Skin Temperature during Roller Coaster Segment
The peripheral skin temperature for all subjects trended down during this session.
4.2.3 Pendulum Swing
This session was intended to cause height related anxiety. Subject 1 was the only
participant who expressed a moderate fear of heights and consequently this segment was
ranked pleasant and exciting by 4 of the 5 participants. The most significant event
occurs at 57 seconds on the following graphs; it is when the participant is pushed off of
the cliff in the virtual reality simulation.
56
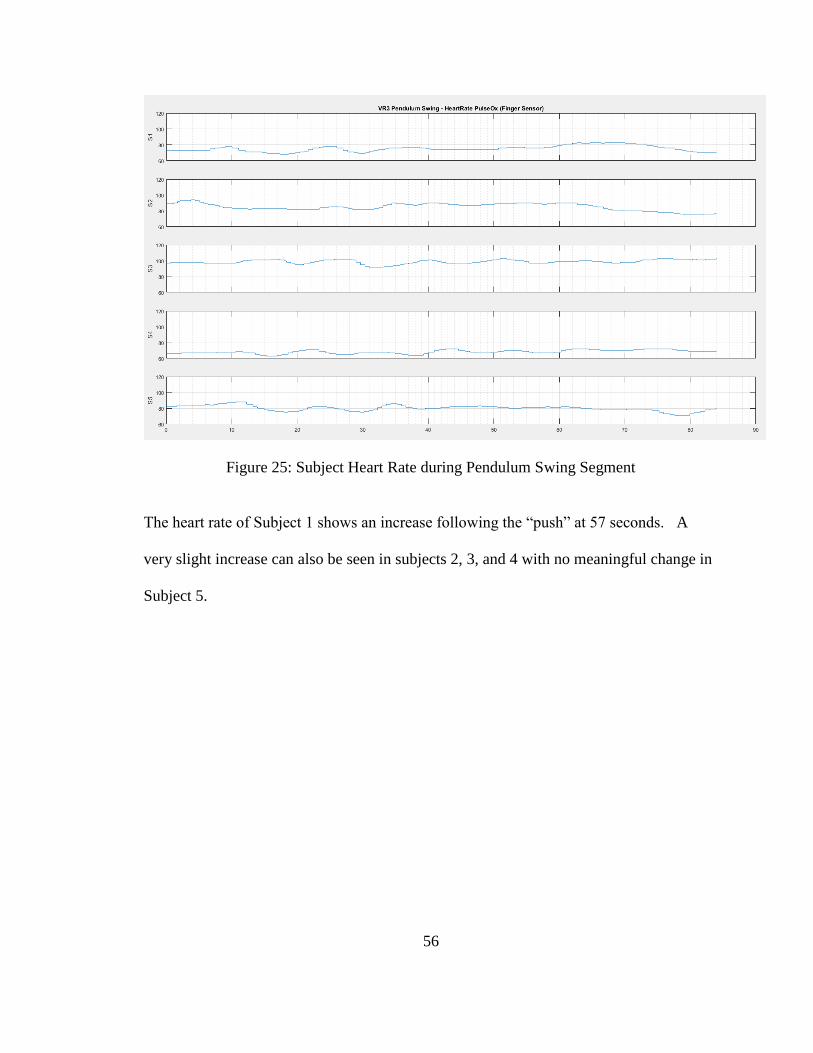
Figure 25: Subject Heart Rate during Pendulum Swing Segment
The heart rate of Subject 1 shows an increase following the “push” at 57 seconds. A
very slight increase can also be seen in subjects 2, 3, and 4 with no meaningful change in
Subject 5.

57
Figure 26: Subject Peripheral Blood Pulse Volume Pendulum Swing Segment
Peripheral blood pulse volume appears to decrease slightly in Subject 4 at the 57 second
“push” point but no clear trend can be seen across all subjects.
58
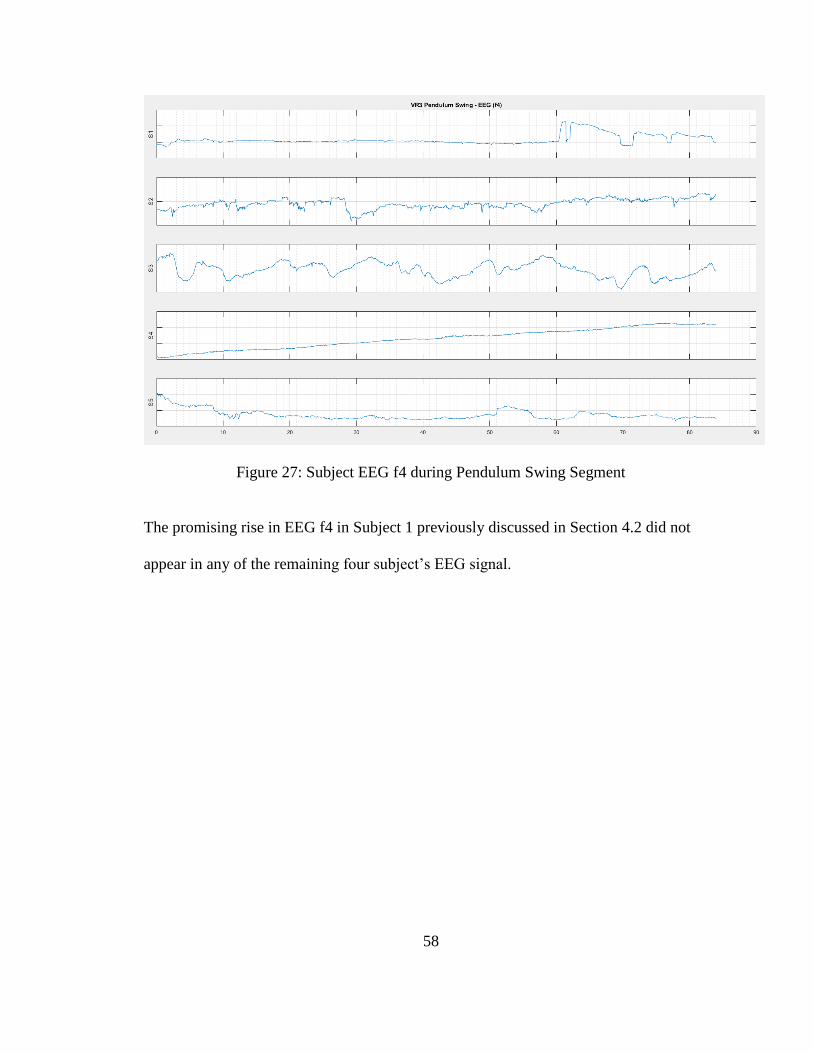
Figure 27: Subject EEG f4 during Pendulum Swing Segment
The promising rise in EEG f4 in Subject 1 previously discussed in Section 4.2 did not
appear in any of the remaining four subject’s EEG signal.

59
Figure 28: Subject EMG signal during Pendulum Swing Segment
The EMG signal charted here (auto-scaled) shows no specific markers at the 57 second
“push” point. For Subject 1 there appeared to be an increase in EMG at this time as
described in Section 3.3. That graph was also auto-scaled but across a much shorter time
window. Further processing of the EMG signal to remove the low frequency DC voltage
component is needed.

60
Figure 29: Subject Galvanic Skin Response signal during Pendulum Swing Segment
Subjects 2 and 4 seem to exhibit a galvanic skin response with a timing and that is
consistent with the “push” at the 57 second point. However, no clear rise/fall is seen in
Subjects 1, 3, and 5.

61
Figure 30: Subject Peripheral Skin Temperature Pendulum Swing Segment
The peripheral skin temperature for all subjects trended down during this session. There
is no specific response at the 57 second “push” event. This segment was completed
standing and it is possible that this had an impact causing the general downward trend in
the peripheral skin temperature. Further investigation regarding the effect of sitting
versus standing is warranted.
4.3 Feature Extraction and Segment Size
4.3.1 Simple Mean and Standard Deviation Feature Extraction
For initial quick analysis very simple mean and standard deviation features were
extracted with a 1 second (250 sample) window. The resulting MATLAB table

62
contained 48 features, 2 for each of the 24 time based input signals. The response class
was the session – in this case the relaxing VR2 and the exciting VR3 sessions.
The table was input in to the MATLAB classification tool [54] and all available
classifiers were run and evaluated with 5-fold cross validation for a range of epoch sizes.
While the accuracy is higher for a 1 second epoch this is likely due to overfitting as the
physiological signals and emotional response will not very significantly in such a short
time span. In addition, because data from all 5 subjects is used during the cross
validation the results are much higher than found during hold-one-out analysis where the
test set consists of the data from a subject who is not included in the training set.

63
Table 8: MATLAB Classifier Accuracy with 5 fold cross-validation, 1 second
epoch, and mean + standard deviation features
64
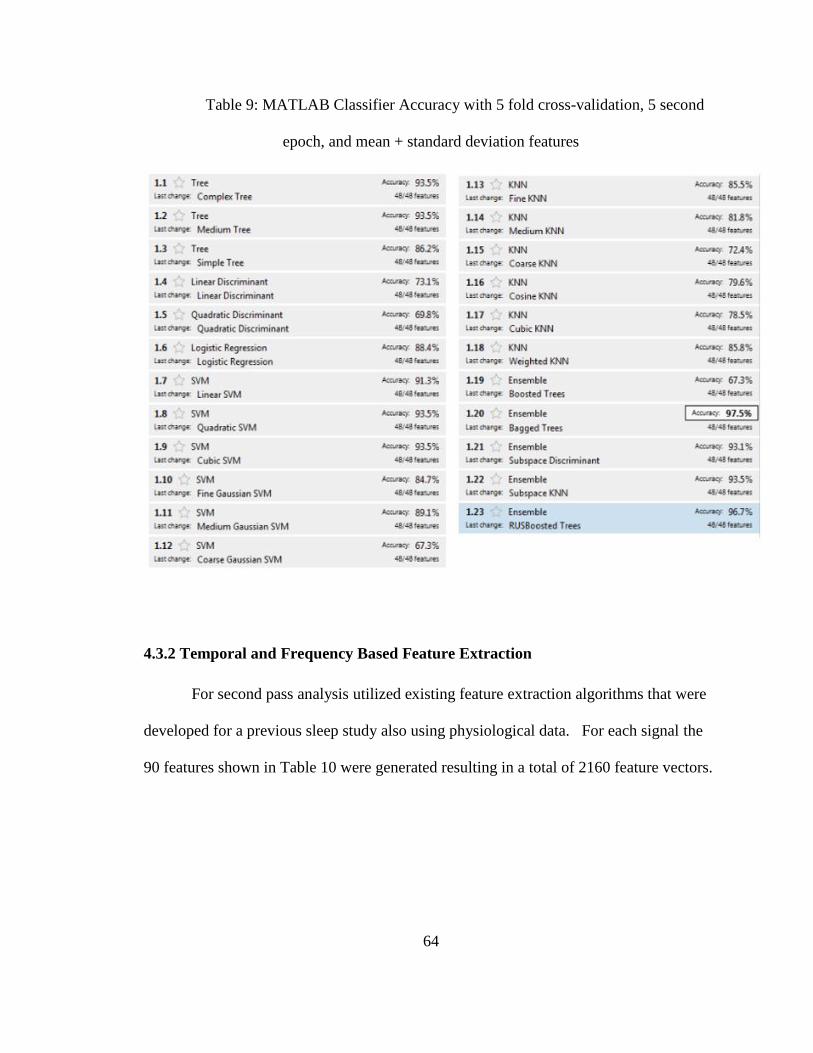
Table 9: MATLAB Classifier Accuracy with 5 fold cross-validation, 5 second
epoch, and mean + standard deviation features
4.3.2 Temporal and Frequency Based Feature Extraction
For second pass analysis utilized existing feature extraction algorithms that were
developed for a previous sleep study also using physiological data. For each signal the
90 features shown in Table 10 were generated resulting in a total of 2160 feature vectors.

65
Table 10: List of Temporal and Frequency Based Features
4.3.3 Domain Specific Feature Extraction
For the final pass feature extraction algorithms were developed based on existing
knowledge regarding the behavior of the physiological signals with respect to emotional
response. Each of the 15 features were computed by subject and are described briefly
below.

66
meanHR – the mean of the heart rate as reported by the pulse oximeter is calculated for
each epoch and is normalized by subtracting the mean of the subject’s heartrate for the
entire dataset (the base heart rate)
magPPV – the magnitude of the peripheral blood volume as reported by the pulse
oximeter was calculated for each epoch by subtracting the minimum value from the
maximum value.
slopeGSR – the slope of the electrodermal activity (EDA) or skin resistance was
calculated by subtracting the value of the last sample in the epoch from the value of the
first sample in the epoch.
meanGSR – the mean value of the skin resistance was calculated as the average of all
samples within each epoch.
slopePT – the slope of the peripheral skin temperature (SKT) was calculated for each
epoch by subtracting the minimum value from the maximum value.
mECGHR – the mean heartrate based on the ECG signal was calculated by counting the
number of peaks which were greater than 0.5 seconds apart during each epoch.
HRV – heart rate variability is a better predictor of emotion than raw heartrate [55]. The
variability of the heart rate was computed by taking the maximum distance between
adjacent peaks minus the minimum distance between adjacent peaks divided by the
average distance between peaks for a given epoch.
minHRV – is calculated as HRV except the min peak distance only is used.
maxHRV – is calculated as HRV except the max peak distance only is used.
respA, respC – a similar peak counting method as mECGHR is applied with a 2 second
peak to peak minimum for the abdomen and chest RIP signals.

67
respVA, respVC – the minimum peak to peak distance divided by the mean peak to peak
distance is computed for each epoch from the abdomen and chest RIP signals.
meanfR – the mean value of the f4 EEG signal is computed. This signal is previously
normalized by subject
magEMG – the magnitude of the EMG signal is calculated by subtracting the minimum
value in the epoch from the maximum value in the epoch.
The results using this mix of features were better than those using the simple
mean/standard deviation features and the temporal and frequency based features. The
highest results were achieved via feature selection and will be discussed in the next two
sections.
4.4 Feature Selection
4.4.1 Simple Mean and Standard Deviation Feature Selection
For the simple mean and standard deviation feature set only a few feature
selection experiments were run. The accelerometer and gyroscope data from both the
head and body radios were eliminated and did not significantly impact the results. Most
of the feature selection efforts were on the large temporal and frequency based feature set
and the smaller but varied domain based feature set which will be detailed in the next two
sections.
4.4.2 Temporal and Frequency Based Feature Selection
Feature selection was performed on the 2160 features individually using a sparse
technique as it was not possible to run feature selection on all features simultaneously.

68
The resulting 161 features identified were then again processed with a sparse technique
resulting in 30 final features.
4.4.3 Domain Specific Feature Extraction
Multiple combinations of features were run during the development of the domain
based features as well as some automated testing. The accuracy was found to be highest
with the following set of features: meanHR, magPPV, slopeGSR, mECGHR, HRV.
When each feature was evaluated individually the top 3 performing features were
meanHR, magPPV, and HRV. With leave one out analysis the best results were achieved
when the slopePT feature was removed. For a complete description of these features
see section 4.3.3.
4.5 Classification Accuracy
As discussed earlier the classification accuracy results calculated using 5 fold
cross-validation in the MATLAB Classification learner were much higher than leave on
out by subject results. Given the small dataset and the goals of the research to be able to
determine emotional response on new subjects the validation used for the following
results was based on hold one out by subject. Specifically, for each subject a test set
was built containing that subjects 24 time based signal data along with their reported
arousal response. Given the limitations of the response data, valence was not used and
arousal was classified as binary with 1 corresponding to an “exciting” response and a 0
corresponding to a “neutral” or “relaxing” response. The default MATLAB r2016a
SVM classifier was used with a 10 second epoch.

69
For the simple mean and standard deviation feature set utilizing all 48 features
(without feature selection) the hold one out accuracy was 74%. Using all 2160 temporal
and frequency based features the hold one out accuracy was 57%. After feature selection
to 30 total features the temporal and frequency based feature set hold one out accuracy
was 72%.
The highest overall hold one out accuracy of 80% was achieved using a Support
Vector Machine and the following five features: meanHR, magPPV, slopeGSR,
mECGHR, HRV.
70
5 CONCLUSION
Experimental design is critical to the success of this research. Testing the stimuli
and subject self-reporting responses prior to the more complex experiments with the full
sensor setup would be beneficial. Unfortunately, this will likely require a much larger
subject population as some level of desensitization will occur therefore it would be best
to perform the data collection on subjects who have not previously participated in the
virtual reality simulations. In order to better cover the relaxing portion of the arousal-
valence space, calming or meditative segments should be added. More challenging will
be the identification of emotionally unpleasant stimulus. Given the immersive nature of
the virtual reality environment care must be taken not to cause undue stress with explicit
or unsettling content. A thorough IRB review of the stimulus, subject selection, and
procedures would be warranted with this type of content.
Much larger number of subjects with multiple runs are needed. Some
physiological signals varied significantly between subjects with no universal telltale
markers found. If possible, selecting subjects based on presence or absence of sensitivity
to the intended stimuli would be beneficial. For example, a dataset with 50% of the
subjects expressing a fear of heights and 50% having no fear of heights engaged in a
virtual reality simulation that involves height and drop simulations would be very
interesting.
In order to increase the number of subjects several elements will need to be
improved. Less cumbersome equipment with better cable management and/or wireless
sensors along with sensors built into headset or other wearable type garments instead of
adhesive type electrodes would make the simulations much more pleasant and also

71
decrease the required setup time. Event marking should be as automated as possible.
Video recording with remote audio capabilities was invaluable for this preliminary
research but reviewing each video to determine event label start and stop points required
a large amount of time. This manual technique also increases the risk of error and timing
inaccuracies.
Feature extraction using both simple and complex techniques that were not
domain specific did not yield robust results when tested on subject data not in the training
set. Domain knowledge will likely need to be incorporated for each type of signal. For
example, the rise and recovery of a GSR event is well documented and fairly easy to spot
visually on a graph however specific feature extraction will be required to form a marker
for this type of event in the feature table. In addition, motion is likely not relevant for
the direct prediction of emotional response, however it could prove to be valuable in
detecting and eliminating noise and motion related artifacts from the signals that are
relevant.
With the continued progress in sensing technology and through the application of
machine learning on large datasets, the classification of human emotion will help guide
therapy, training, and the development of improved experiences with automated systems
that include affective computing capabilities.

72
LITERATURE CITED
[1] E. Kaniusas, Biomedical Signals and Sensors I: Linking Physiological Phenomena
and Biosignals, Heidelberg, Germany: Springer Verlag GmbH, 2012.
[2] R. W. Picard, Affective Computing, Cambridge: MIT Press, 1997.
[3] R. Ortner, E. Grunbacher and C. Guger, "State of the Art in Sensors, Signals and
Signal Processing," Guger Technologies OG, Graz, Austria, 2013.
[4] M. J. Jamal, Signal acquisition using surface EMG and circuit design considerations
for robotic prosthesis, INTECH Open Access Publisher, 2012.
[5] S. Day, Important factors in surface EMG measurement, Bortec Biomedical Ltd
publishers, 2002.
[6] E. P. Scilingo, A. Gemignani, R. Paradiso, N. Taccini, B. Ghelarducci and D. De
Rossi, "Performance evaluation of sensing fabrics for monitoring physiological and
biomechanical variables," IEEE Transactions on information technology in
biomedicine 9.3, pp. 345-352, 2005.
[7] C. Guger, G. Krausz, B. Allison and G. Edlinger, "Comparision of dry and gel based
electrodes for P300 brain-computer interfaces," Frontiers in Neuroscience, pp. 1-6,
2012.
[8] S. Fairclough, "Physiological data must remain confidential," Nature, pp. 263-263,
2014.
[9] I. Korhonen, J. Parkka and M. Van Gils, "Health monitoring in the home of the

73
future," IEEE Engineering in medicine and biology, vol. 3, no. 22, pp. 66-73, 2003.
[10] G. Valenza and E. P. Scilingo, Autonomic nervous system dynamics for mood and
emotional-state recognition: Significant advances in data acquisition, signal
processing and classification, Switzerland: Springer International Publishing, 2014.
[11] L. Xiao, S. Boyd and S. Lall, "A scheme for robust distributed sensor fusion based
on average consensus," In IPSN 2005. Fourth International Symposium on
Information Processing in Sensor Networks, pp. 63-70, 2005.
[12] A. Pantelopoulos and N. G. Bourbakis, "A survey on wearable sensor-based systems
for health monitoring and prognosis," IEEE Transactions on Systems, Man, and
Cybernetics, Part C (Applications and Reviews), vol. 1, no. 40, pp. 1-12, 2010.
[13] V. Kaarjakari, Practical MEMS: Design of microsystems, accelerometers,
gyroscopes, RF MEMS, optical MEMS, and microfluidic systems, Las Vegas: Small
Gear Publishing, 2009.
[14] N. D. Lane, E. Miluzzo, H. Lu, D. Peebles, T. Choudhury and A. Campbell, "A
survey of mobile phone sensing," IEEE Communications, vol. 48, no. 9, pp. 140-
150, 2010.
[15] Z. Xu, J. Hilton, G. Gates, S. Jelic, Y. Stern, M. Bartels, R. DeMeersman and R.
Basner, "Increased sympathetic and decreased parasympathetic cardiovascular
modulation in normal humans with acute sleep deprivation," Journal of applied
physiology, vol. 6, no. 98, pp. 2024-2032, 2005.
[16] W. H. Spriggs, Essentials Of Polysomnography: A Training Guide and Reference

74
For Sleep Technicians 2nd Edition, Burlington: Jones & Bartlett Learning, 2015.
[17] P. &. F. W. V. Ekman, "Constants Across Cultures in the Face and Emotion,"
Journal of Personality and Social Psychology, Vol 17(2), pp. 124-129, 1971.
[18] E.-H. Jang, B.-J. Park, S.-H. Kim, M.-A. Chung, M.-S. Park and J.-H. Sohn,
"Emotion Classification based on Bio-Signals: Emotion Recognition using Machine
Learning Algorithms," Proceeding of the 2014 International Conference on
Information Science, Electronics and Electrical Engineering, pp. 1373-1376, 2014.
[19] K. Gouizi, F. B. Reguig and C. Maaoui, "Emotion recognition from physiological
signals," Journal of medical engineering & technology, Vols. 6-7, no. 35, pp. 300-
307, 2011.
[20] P. Ekman, R. W. Levenson and W. V. Friesen, "Autonomic nervous system activity
distinguishes among emotions," Science, pp. 1208-1210, 1983.
[21] P. Rainville, A. Bechara, N. Naqvi and A. R. Damasio, "Basic emotions are
associated with distinct patterns of cardiorespiratory activity," International Journal
of Psychophysiology 61, no. 1, pp. 5-18, 2006.
[22] C. Collet, E. Vernet-Maury, G. Delhomme and A. Dittmar, "Autonomic nervous
system response patterns specificity to basic emotions," Journal of the Autonomic
Nervous System 62, no. 1-2, pp. 45-57, 1997.
[23] F. Canento, A. Fred, H. Silva, H. Gamboa and A. Lourenco, "Multimodal biosignal
sensor data handling for emotion recognition," IEEE In Sensors, pp. 647-650, 2011.
[24] R. W. Leon, I. Karacan and C. J. Hursch, Electroencephalography (EEG) of human

75
sleep: clinical applications, John Wiley & Sons, 1974.
[25] J. Sztajzel, "Heart rate variability: a noninvasive electrocardiographic method to
measure the autonomic nervous system," Swiss medical weekly, no. 134, pp. 514-
522, 2004.
[26] D. T. Lykken, "The GSR in the detection of guilt," Journal of Applied Psychology,
vol. 43, no. 6, p. 385, 1959.
[27] J. Block, "A study of affective responsiveness in a lie-detection situation," The
Journal of Abnormal and Social Psychology, vol. 1, no. 55, p. 11, 1957.
[28] J. T. Cacioppo, R. E. Petty, M. E. Losch and H. S. Kim, "Electromyographic activity
over facial muscle regions can differentiate the valence and intensity of affective
reactions," Journal of personality and social psychology, vol. 2, no. 50, p. 260, 1986.
[29] A. E. Kaufman, A. Bandopadhay and B. D. Shaviv, "An eye tracking computer user
interface," IEEE 1993 Symposium on Research Frontiers, pp. 120-121, 1993.
[30] E. A. Kesinger, "Remembering emotional experiences: The contribution of valence
and arousal," Reviews in the Neurosciences, vol. 4, no. 15, pp. 241-252, 2004.
[31] A. Gerrards-Hesse, K. Spies and F. Hesse, "Experimental Inductions of emotional
states and their effectiveness: A review," British Journal of Psychology, pp. 55-78,
1994.
[32] A. Haag, S. Goronzy, P. Schaich and J. Williams, "Emotion recognition using bio-
sensors: First steps towards an automatic system," In Tutorial and research
workshop on affective dialogue systems, pp. 36-48, 2004.
76
[33] P. Lang, B. Cuthbert and M. Bradley, "International affective picture system (IAPS):
Affective ratings of pictures and instruction manual. Technical Report A-8,"
University of Florida, Gainesville, FL, 2008.
[34] C. D. Katsis, N. Katertsidis, G. Gainiatsas and D. I. Fotiadis, "Toward Emotion
Recognition in Car-Racing Drivers: A Biosignal Processing Approach," IEEE
Transactions on Systems, Man, and Cybernetics - Part A: Systems and Humans, Vol.
38, no. 3, pp. 502-512, 2008.
[35] R. L. Mandryk, M. S. Atkins and K. M. Inkpen, "A Continuous and Objective
Evaluation of Emotional Experience with Interactive Play Environments,"
Proceedings of the SIGCHI Conference on Human Factors in Computing Systems,
pp. 1027-1036, 2006.
[36] L. Mitchell, R. A. MacDonald and E. Brodie, "Temperature and the Cold Pressor
Test," The Journal of Pain, pp. 233-238, 2004.
[37] C. Zong and M. Chetouani, "Hilbert-Huang Transform based Physiological Signals
Analysis for Emotion Recognition," Proceeding of the 9th IEEE International
Symposium on Signal Processing and Information (ISSPIT), p. 334 – 339, 2009.
[38] E. L. van den Broek, V. Lisy, J. H. Janssen, J. H. Westerink, M. H. Schut and K.
Tuinenbreijer, "Affective Man-Machine Interface: Unveiling Human Emotions
through Biosignals," BIOSTEC 2009, Communications in Computer and Information
Science (CCIS), pp. 21-47, 2009.
[39] P. M. Agante and J. P. Marques De Sa, "ECG noise filtering using wavelets with
soft-thresholding methods," IEEE, pp. 535-538, 1999.

77
[40] J. Goldie, C. McGregor and B. Murphy, "Determining levels of arousal using
electrocardiography: a study of HRV during transcranial magnetic stimulation," In
2010 Annual International Conference of the IEEE Engineering in Medicine and
Biology, pp. 1198-1201, 2010.
[41] J. Bell, Machine Learning: Hands-On for Developers and Technical Professionals,
Indianapolis: John Wiley and Sons, Inc, 2014.
[42] Y. S. Abu-Mostafa, M. Magdon-Ismail and H.-T. Lin, Learning from Data,
AMLbook, 2012.
[43] G. Tsoumakas and I. Katakis, Multi-label classification: An overview, Thessaloniki:
Dept. of Informatics, Aristotle University of Thessaloniki, 2006.
[44] L. Wang, Support vector machines: theory and applications, Vol 177, Spring Science
and Business Media, 2005.
[45] T. Mitchell, "Artifical Neural Networks," Machine Learning, pp. 81-127, 1997.
[46] S. Nicu, I. Cohen, T. Gevers and T. S. Huang, "Multimodal approaches for emotion
recognition: a survey," International Society for Optics and Photonics, pp. 56-67,
2005.
[47] T. S. Guzella and W. M. Caminhas, "A review of machine learning approaches to
spam filtering," Expert Systems with Applications, vol. 7, no. 36, pp. 10206-10222,
2009.
[48] "Oculus Rift Applications," 15 September 2016. [Online]. Available:
https://www.oculus.com/experiences/rift/.

78
[49] "BioRadio User Guide Rev E," 15 January 2016. [Online]. Available:
https://glneurotech.com/bioradio/wp-content/uploads/2015/02/392-0050-Rev-E-
BioRadio-User-Guide.pdf.
[50] P.-Y. Carry, P. Baconnier, A. Eberhard, P. Cotte and G. Benchetrit, "Evaluation of
respiratory inductive plethysmography: accuracy for analysis of respiratory
waveforms," CHEST Journal, vol. 4, no. 111, pp. 910-915, 1997.
[51] J. E. Sinex, "Pulse oximetry: principles and limitations," The American journal of
emergency medicine, vol. 1, no. 17, pp. 59-66, 1999.
[52] "MATLAB Product Overview," 15 January 2016. [Online]. Available:
https://www.mathworks.com/products/matlab/index.html.
[53] "Institutional Review Board," Texas State University, [Online]. Available:
http://www.txstate.edu/research/orc/IRB-Resources.html. [Accessed 4 November
2016].
[54] "Signal Processing and Machine Learning Techniques for Sensor Data Analytics,"
MathWorks, 1 September 2015. [Online]. Available:
https://www.mathworks.com/videos/signal-processing-and-machine-learning-
techniques-for-sensor-data-analytics-107549.html. [Accessed 18 January 2016].
[55] R. Lane, K. McRae, E. Reiman, K. Chen, G. Ahern and J. Thayer, "Neural correlates
of heart rate variability during emotion," Neuroimage, vol. 1, no. 44, pp. 213-222,
2009.
[56] X.-A. Fan, L.-X. Bi and Z.-L. Chen, "Using EEG to detect drivers' emotion with

79
Bayesian Networks," Machine Learning and Cybernetics (ICMLC), vol. 3, IEEE, pp.
1177-1181, 2010.
[57] H. Sim, W.-H. Lee and J.-Y. Kim, "A Study on Emotion Classification utilizing Bio-
Signal (PPG, GSR, RESP)," Advanced Science and Technology Letters, Vol. 87, pp.
73-77, 2015.