determination of diffusivities in the rustler …
TRANSCRIPT

DETERMINATION OF DIFFUSIVITIES IN THE
RUSTLER FORMATION FROM EXPLORATORY-
SHAFT CONSTRUCTION AT THE WASTE ISOLATION
PILOT PLANT IN SOUTHEASTERN NEW MEXICO
By Ken Stevens and Walt Beyeler
U.S. GEOLOGICAL SURVEY
Water-Resources Investigations Report 85-4020
Albuquerque, New Mexico
1985

UNITED STATES DEPARTMENT OF THE INTERIOR
DONALD PAUL HODEL, Secretary
GEOLOGICAL SURVEY
Dallas L. Peck, Director
For additional information write to:
District ChiefU.S. Geological Survey, WRDWestern Bank Building, Rm 720505 Marquette NWAlbuquerque, New Mexico 87102
For sale by:
Open-File Services SectionBranch of DistributionU.S. Geological Survey, MS 306Box 25425, Denver Federal CenterDenver, Colorado 80225(303) 236-7476
11

CONTENTS
Page
Abstract 1
Introduction 2
Purpose and scope 2
Description of the study area 4
Geology 4 Hydrologic test pads 6
Hydrologic test pad HI 7Hydrologic test pad H2 7Hydrologic test pad H3 7
Chronology of exploratory-shaft construction 12 Construction-generated stresses 12
Estimation of brine density used to stabilizeopen shaft 13
Conceptual flow model 16
Hydrology of the Rustler Formation 16
Hydrologic flow boundaries 16 Flow in fractured rock -16
Flood-wave response 17
Description of the cylindrical model 19
Results 22
Diffusivities in the Magenta Dolomite Member of theRustler Formation at hydrologic test pads HI and H3 22
Diffusivities in the Culebra Dolomite Member of theRustler Formation at hydrologic test pads HI and H3 24
Diffusivities in the Rustler Formation at hydrologictest pad H2b 26
Discussion 28
Conclusions 30
Selected references 31
ill

ILLUSTRATIONS
Page
Figure 1. Map showing the location of Waste Isolation Pilot Plant (WIPP) site, exploratory shaft, and hydrologic test pads Hi, H2, and H3 3
2* Stratigraphic section showing the five subdivisionsof the Rustler Formation at the WIPP site 5
3. Diagram showing construction and completion detailsand specifications of hydrologic test pad HI / 8
4. Selected geophysical logs for hydrologic test pad HI 9
5» Diagram showing construction and completion details, specifications, and core descriptions of observation well H2b at hydrologic test pad H2 10
6. Diagram showing construction and completion detailsand specifications of hydrologic test pad H3 11
7. Graph showing the exploratory-shaft simulatedstresses in the Magenta and Culebra Dolomite Membersof the Rustler Formation at the WIPP site 13
8. Diagrammatic section of the conceptual model used to analyze the Magenta and Culebra Dolomite Members of the Rustler Formation at the WIPP site 18
9. Diagram showing rotation and expansion of a two- dimensional finite-difference grid into a radial- flow grid 20
10. Diagrammatic section showing row and columndiscretization used in the cylindrical model of the Magenta and Culebra Dolomite Members of the Rustler Formation at the WIPP site 21
11. Hydrographs showing measured and simulated responses in the Magenta Dolomite Member of the Rustler Formation from hydrologic test pads HI and H3 (July 1981 through January 1982) 23
12. Hydrographs showing measured and simulated responses in the Culebra Dolomite Member of the Rustler Formation from hydrologic test pads HI and H3 (July 1981 through January 1982) 25
IV

ILLUSTRATIONS - Concluded
Page
Figure 13. Hydrographs showing simulated responses in the Magenta and Culebra Dolomite Members of the Rustler Formation and the measured response in hydrologic test pad H2b (July 1981 through January1QQON _ _ _ _ ______________ _______ _ __________LjQf. ) -. -. -. -»-. -. . . .__...._ _ 27
TABLES
Table 1.
2.
3.
4.
Summary of diffusivity values used to simulate hydrographs at hydrologic test pads HI and H3 in the Magenta Dolomite Member of Rustler Formation
Summary of diffusivity values used to simulate hydrographs at hydrologic test pads HI and H3 in the Culebra Dolomite Member of Rustler Formation
Summary of diffusivity values used to simulate hydrographs at hydrologic test pad H2b in the Magenta Dolomite Member and Culebra Dolomite Member of Rustler Formation
22
24
26
Values of diffusivity calculated for the Magenta Dolomite Member and Culebra Dolomite Member of Rustler Formation using hydraulic coefficients reported by Mercer (1983, p. 105, table 7) 29
CONVERSION FACTORS
Figures for measurements in this report are given in inch-pound units only. The following table contains factors for converting to metric units.
Multiply inch-pound units
inchfootmileacresquare milefoot per dayfoot per milefoot squared per secondfoot squared per dayacre-footgallon per minute
By
25.40.30481.609
4,0472.5900.30480.18940.09290.0929
1,2330.0631
To obtain metric unit
millimetermeterkilometersquare metersquare kilometermeter per daymeter per kilometermeter squared per secondmeter squared per daycubic meterliter per second

DETERMINATION OF DIFFUSIVITIES
IN THE RUSTLER FORMATION FROM EXPLORATORY-SHAFT
CONSTRUCTION AT THE WASTE ISOLATION PILOT PLANT
IN SOUTHEASTERN NEW MEXICO
By Ken Stevens and Walt Beyeler
ABSTRACT
The construction of an exploratory shaft 12 feet in diameter into the Salado Formation (repository horizon for transuranic waste material) at the Waste Isolation Pilot Plant site in southeastern New Mexico affected water levels in water-bearing zones above the repository horizon. The responses in the water-bearing zones were recorded at hydrologic test pads HI, H2b, and H3. Interpretation of the construction history of the exploratory shaft produced an approximation of construction-generated hydraulic stresses at the shaft. The magnitude of these stresses was estimated using the hydrographs from hydrologic test pad HI. Whereas flow rates from the Magenta Dolomite and Culebra Dolomite Members of the Rustler Formation into the exploratory shaft were unknown, the ratio of transmissivity to storage (diffusivity) was determined by mathematically simulating the hydrologic stresses with a flood- wave-response digital model.
In the Magenta Dolomite Member, the time of occurrence of the initial slope break, amplitude, and slope of the hydrograph recorded at test pad HI were matched to a set of type curves generated using a diffusivity of 0.03 foot squared per second. In the Culebra Dolomite Member at hydrologic test pad HI, the timing was matched with a diffusivity of 0.5 foot squared per second. The slope and amplitude of the response were also matched with a diffusivity of 0.5 foot squared per second. In the Culebra at hydrologic test pad H2b, the diffusivity value obtained from matching the time of the response was less than 1.0 foot squared per second and the diffusivity value obtained from matching the amplitude and slope was more than 0.5 foot squared per second. In the Culebra at hydrologic test pad H3, the diffusivity value from the response time was 1.0 foot squared per second and the diffusivity values from the amplitude and slope were 0.5 foot squared per second.

These results indicate that the Magenta Dolomite and Culebra Dolomite Members of the Rustler Formation can be modeled as homogeneous, isotropic, and confined water-bearing zones. One simple and consistent explanation, but by no means the only explanation, of the lack of a single diffusivity value in the Culebra water-bearing zone is that local effects in or near the observation wells at the hydrologic test pads dampen the amplitude of water- level changes.
INTRODUCTION
The U.S. Department of Energy is beginning the construction phase for a repository for transuranic waste in the bedded salts of the Salado Formation of Permian age in southeastern New Mexico (fig. 1). The repository, known as the Waste Isolation Pilot Plant (WIPP), is designed to demonstrate disposal technology for transuranic wastes.
At the WIPP, water-bearing zones with little permeability or storage (Magenta Dolomite and Culebra Dolomite Members of the Rustler Formation) occur above the repository horizon. Because these zones represent a potential path for the transport of radionuclides, there is a need to evaluate their regional hydrologic properties. This information, when determined, may be used in the design and construction of a monitoring-well network.
The construction of an exploratory shaft 12 feet in diameter through the overlying Dewey Lake Red Beds and Rustler Formation into the Salado Formation at the WIPP site affected water levels in the Rustler Formation. The observed water-level changes presented an opportunity to apply flood-wave response techniques to estimate diffusivity values (transmissivity divided by storage coefficient) of the water-bearing zones above the repository horizon.
Purpose and Scope
The purpose of this report is to refine estimates of hydraulic coefficients of the water-bearing zones in the Rustler Formation.
This investigation describes the procedures and interprets the results of modeling the Magenta Dolomite and Culebra Dolomite Members of the Rustler Formation at the WIPP site. The modeling effort simulated water levels measured by the U.S. Geological Survey during and after the construction of the exploratory shaft from June 1981 to December 1981 at hydrologic test pads HI and H3 and observation well H2b at test pad H2 (referred to as hydrologic test pad H2b in this report).

I04°I5' 104° 00' I03°45'
T.
22 S.
ZONE H BOUNDARY
20
EXPLORATORY SHAFT ^
EXCLUSIVE USE AREA BOUNDARY
©HYDROLOGIC TEST PAD H2
O HYDROLOGIC TEST PAD HI
HYDROLOGIC TEST PAD H3
Figure 1.--Location of Waste Isolation Pilot Plant (WIPP) site, exploratory
shaft, and hydrologic test pads H1, H2, and H3.

DESCRIPTION OF THE STUDY AREA
Geology
The following discussion has been paraphrased from Mercer (1983). The discussion is limited to geologic information that is necessary for understanding the hydrogeology of the Magenta Dolomite and Culebra Dolomite Members of the Rustler Formation.
Sedimentary rocks that crop out within the WIPP site area range in age from Permian to Quaternary. The oldest rocks crop out to the west and successively younger rocks crop out to the east. Detailed stratigraphy is based on information obtained from drill holes because the rocks generally are covered by Quaternary caliche and semi-stabilized and active dune sand. Rocks down to 5,000 feet of depth consist mainly of Permian sandstones, evaporites, and red beds, but also include some Triassic sandstone and Tertiary and Quaternary deposits.
The oldest and deepest formations reported at the WIPP site are included in the Guadalupian Delaware Mountain Group, which forms the basin floor for the Ochoan evaporite sequence. The Ochoan Series within the basin predominantly is halite and anhydrite but_ also contains potash, limestone, dolomite, and fine-grained elastics. The Ochoan Series includes, in ascending order, the Castile, Salado (repository location), and Rustler Formations and the Dewey Lake Red Beds. The units above the Dewey Lake Red Beds include the Triassic Santa Rosa Sandstone and the Chinle Formation, small outliers of the Tertiary Ogallala Formation, and discontinuous bolson deposits of the Quaternary Gatuna Formation. A thin caliche caprock of Holocene age extends across most of the study area and locally is overlain by both shifting and semi-stabilized dune sands. Holocene alluvium is present along the Pecos River.
Late Tertiary subsidence in the WIPP area was followed by regional uplift that caused eastward tilting of the beds. This structural deformation was later modified by local subsidence and karst development in the study area due to near-surface salt dissolution in the Permian evaporites.
Five subdivisions of the Rustler Formation are shown in the stratigraphic section of figure 2. The Rustler Formation, named by Richardson (1904), is the youngest unit in the Ochoan evaporite sequence. The Rustler is a key marker bed of the Upper Permian in Texas and New Mexico. This formation is one of the most extensively investigated formations at the WIPP because it contains the most productive water-bearing zones in the study area.

yyy^y^>^\vi*7?/V////////.\ \
\ \ \ \
\ \\ \ \\ \ \ \
\\\ \ v\\\ \\vv\~v
ill 1 I V"V/W*VvwvV> "ga:**
Dune sand with patches of cal iche
Gatuna Formation
Dewey Lake Red Beds
Forty-niner Member
Magenta Dolomite Member
Tamarisk Member
Culebra Dolomite Member
Unrfamed part
Sal ado Formation
V)D
o:
QUATER NARY
PERMIAN
EXPLANATION
Sandstone
Caliche
Si 1 tstone
(wi th some hali te)
Dolomi te
Gypsum
Anhydri te
Halite
(Not to scale) Modified from Vine (1963)
Figure 2.--The five subdivisions of the Rustler Formation at the WIPP site

In the vicinity of the WIPP, Vine (1963, p. B-14) has described a five fold division of the Rustler (fig. 2). The division includes: (1) At the base, an unnamed part of clayey siltstone and very fine grained sandstone with thin interbeds of anhydrite and halite in its upper part; (2) the Culebra Dolomite Member, a unit of thin-bedded, solution-pitted, finely crystalline dolomite; (3) the Tamarisk Member, anhydrite with a single thin interbed of unconsolidated clayey silt (residuum from a thick seam of halite and associated polyhalitic siltstone); (4) the Magenta Dolomite Member, a unit of thinly cross-laminated, fine-grained dolomite; and (5) the Forty-niner Member, anhydrite with a single thin interbed of unconsolidated clayey silt (residuum from a much thicker seam of clayey and silty halite). The anhydrite beds may be partially altered to gypsum in places where dissolution has occurred.
The Culebra Dolomite Member consists of 25 to 30 feet of microcrystalline dolomite. It characteristically contains many small spherical cavities that range from about 0.08 to about 0.80 inch in diameter and may be partly filled with secondary gypsum and calcite. Although many cavities are open, they do not appear to be interconnected except along fractures. Underlying the Culebra Member there is either a clayey halite or a clayey residue, depending on whether the halite has undergone dissolution. Dissolution and removal of this halite bed is directly associated with subsidence, fracturing, and the occurrence of permeable zones in the Culebra. In the outcrops, the dolomite also may be locally brecciated or deformed by dissolution and collapse.
The Magenta Dolomite Member ranges from 20 to 30 feet in thickness and is characterized by alternating wavy laminae of silty dolomite and anhydrite (altered in places to gypsum). The dolomite is detrital in origin and is bounded above and below by anhydrite, which may be altered to gypsum along the contact with the dolomite.
Hydrologic Test Pads
The sequence of hydrologic test-pad construction at the WIPP generally followed the procedure described by Mercer and Orr (1979) and is paraphrased here. The air-rotary drilling method was used to drill the holes designed for hydrologic observation at the WIPP site (HI, H2b, and H3). This method differs from standard rotary drilling in that the drilling fluid or mud gel used to cool the bit and remove cuttings is replaced by compressed air that is pumped down the drill pipe and moves back up the annular space between the drill pipe and the borehole wall. Dry compressed air is used unless moist zones or liquid are encountered, at which time soap and water are added to assist in removal of the cuttings. The air method was used to make it easier to identify water-bearing zones and to decrease the potential for formation plugging that sometimes occurs when using bentonite-based drilling fluids.

Geophysical logs were made in the open boreholes. These logs provide detailed information on lithologic changes, formation characteristics, potential water-bearing zones, and borehole-diameter changes. The logs were used for the selection of open intervals in the boreholes and to provide information on hole conditions in the selection of packer seats.
Cased holes were perforated with jet shots (shaped explosive charges) 0.5 inch in diameter with three holes per foot of casing. Because of difficulties that occur when perforating casing in dry holes, the perforating tool was generally cushioned by water, which was bailed or swabbed after the tool was fired.
Hydrologic Test Pad HI
The final well-construction, completion, and specifications data of hydrologic test pad HI are shown in figure 3» The Compensated Densilog*, Dual Laterolog, Micro-laterolog, and Compensated Neutron log for this well are shown in figure 4.
Hydrologic Test Pad H2
The final well-construction, completion, specifications data, and core descriptions of observation well H2b at hydrologic test pad H2 are shown in figure 5. The Compensated Densilog, Dual Laterolog, Micro-laterolog, and Compensated Neutron log from hydrologic test pad H2 (observation well H2c) are available in Mercer and Orr (1979, p. 59, fig. 11).
Hydrologic Test Pad H3
The final well-construction, completion, and specifications data of hydrologic test pad H3 are shown in figure 6. The Compensated Densilog, Dual Laterolog, Micro-laterolog, and Compensated Neutron log are available in Mercer and Orr (1979, p. 42, fig. 7).
*Use of the trade name in this report is for identification purposes only and does not constitute endorsement by the U.S. Geological Survey.

CL
n
O^
O a OJ
CL
3C
00
UD c O O 3
in O 3 QJ
Q-
O
O in
Oi
CL.
in
T) CD
O
OEPTH
BELO
W LA
ND -
SURFACE,
IN FE
ET
5?
a. a
.
M O
C
O
C
I i-l
09
CO
l-h
U>
Q.
i-l
01
rt>ri
a>
r1-
H-
(-
ft.
ft.
ft
ft
Q.
9
ft
a>
ftft
3
ft
01
it
o. M
c
01 n
n
t*
ft
Ml
3
(B
W
"O
(5 -
H-
rt
'a
to ft
rt
H-1
O
It(B
-a
o
OO
>-
l O
O
£ a
H.
p 3

COMP
ANY
WELL
I
Dre
sse
r A
tlas
LO
CA
TIO
N^
2O
/FRO
M
WO
RTH
LIN
E,
1084'
FRO
M
EAST
L
INE
SE
CTI
ON
g?
TO
WN
SHIP
22
S.
RAN
GE
3\
E.
PER
MAN
ENT
DAT
UM
IS
LA
ND
S
UR
FAC
E,
ELE
VA
TIO
N
3W
3.2
FE
ET
ME
AS
UR
ING
P
OIN
T IS
K
ELL
Y
BU
SHIN
G
WH
ICH
IS
7.9
FE
ET
AB
OVE
PE
RM
AN
ENT
DA
TUM
VO
U- cc => Ul
CQ
DEN
S I L
OG
BULK D
ENSI
TY,
IN GR
AMS
PER
CUBI
C CE
NTIM
ETER
2.
0 2.5
I I
I T
op
of
Dew
eyLa
ke
Red
Bed
s -
From
M
erc
er
and
Orr
. 19
79
Top
Of
Rust
ler
Fom
otio
n
3.0
30
O
COMPENSATED
NEUTRON
PORO
SITY
, IN PERCENT
20
10
0
MlCRO-LATEROLOG
RESI
STIV
ITY,
IN
OHMS-METER
DUAL
LATEROLOG
RESISTIVITY,
IN
OHMS-METER
Top
of
Sa
iad
o
or m
otio
n
I I
I T
op
of
Dew
eyLa
ke
Red
Bed
s
Top
of
Ru
stle
r ~
Fo
rma
tion
TTuF
ebra
Dol
omite
fop
of
Ru
stle
r sa
lt
Top
of
Saia
do
brm
atio
ni_
___
.10
1.0
1010
0 10
00
.10
1.0
1010
0 IO
OO
Top
of
Dew
ey L
ake
Red
Bee
'
Top
of __
Rus
tler
_F
orm
ation
Dol
omite
Top
of
Rust
ler
salt
Top
of
Sa
iad
o
^Fo
rma
tion
I I
I
Top
of
Dew
ey L
ake
Red
B
eds
JTop
of
Rust
ler _
For
mat
ion
Mag
enta
D
olom
ite"M
embe
r
salt
resi
due _
Figu
re ^.
--Se
lect
ed geophysical
logs for
hydrologic te
st pad
HI

0
3*» feet
kS7 feet i515 feet '
V
5i*0 feet Zi/i
62k feet *
61*2 feet
AS MODIFIED FOR AS CONSTRUCTED HYDROLOGIC DATA
COLLECTION LAND SURFACESurficial deposits J[
and A Gatuna Formation/
Dewey Lake
Red Beds
I
c Magenta Dolomite \_ Member* * >^^ck"" Culebra Dolomite
\) VI
XX X XXX if
0 , JSp Bottom 10% -inch cas.lng ~ 33 feet
*
-inch drill hole "~10 3/» -inch casing
(33 feet)
: -Cement grout 8 3/4 -inch drill hole
r with 6% -inch
%
/Perforated interval 510-538 feet ' (three '/z -inch jet shots per foot)
1
casing (0-609)
All ffft %,-inch core hole A 3/4 -inch core hole
Total depth661 feet
LOCATION: 720 feet from north line, 3,584 feet from east line, section 29, Township 22 South, Range 31 East, Eddy County, New Mexico
ELEVATION: 3,377.1 feet (ground level)
DEPTH DRILLED: 795 feet
DATE COMPLETED: February 5, 1977
DRILLING CONTRACTOR: Pennsylvania Drilling Company, Carlsbad, New Mexico
DRILLING METHOD: Auger 18-inch hole (0-33 feet); Rotary 8 3/4-inch hole with air and air mist(33-611 feet); Core 4 3/4-inch hole with air mist (611-661 feet) (cut 2 1/4-inch diameter core)
WELL CASING RECORD: 10 3/4-inch outside diameter casing (0-33 feet) cemented to surface;6 5/8-inch outside diameter steel casing, 24 pounds, 1.43 gallons per foot (0-609 feet), centralizers at 406 feet and 568 feet, cemented to surface
CORE DESCRIPTION:
Depth (feet)
611 - 624.2 624.2 - 642.0
642.0 - 644.0 644.0 - 652.0 652.0 - 660.7
Description
Dense gray anhydrite, massive to bandedBrown sllty dolomite with selenitic fracture fillings and crystals,
pitted and fractured from 629.5 to 642.0 feet Gray raudstoneRed-brown selenitic siltstone Dense gray anhydrite
Modified from Mercer and Orr, 1979
Figure 5.--ConstructIon and completion details, specifications, and core
descriptions of observation well H2b at hydrologic test
pad H2.
10

o
22 feet
502 feet 3 560 feet '
CQ/i faot- L.po*t r ec L j~
670 feet ~ i/i
69** feet *
820 feet _..'
AS MODIFIED FOR AS CONSTRUCTED HYDROLOGIC DATA
COLLECTION LAND SURFACE
Surficial deposits/ and / i
Gatuna Formation/
Dewey Lake
Red Beds
Magenta Dolomite \c Member ^o . <r
E Culebra Dolomite ^^"o Mel'I^l____<H
Top of Rustler sal tr
Salado Formation
1
XXXX
XXXX
XXXX
Axxxxxx/xxxxxx
/XXXXXX'xxxxxx
ii 1!T^Bottom 10/4 " inch casing 1 38 feet '
4 2 3/6 - inch tubing
i- inch dri 11 hole j_ wi th 10 3/4 -i nchi casing (38 feet)
Cement grout 8 34~inch drill hole
.Perforated interval (56A-592 feet): /(three '/2 - inch jet shots per foot)
T .Inflatable production packer, ']/ 652 feet to centerr{
j -Perforated interval (675-703 feet)/ (three y2 -inch jet shots per foot)
Jnflatable bridge plug / 795 feet to center
^-Perforated interval (813-837 feet) (three '/2 -inch jet shots per foot)
Top of cement plug 86*» feet
wi th 6 S/B - inchcasing (0-890
f
v^^^ Total depth89*» feet
LOCATION: 3,200 feec from north line, 140 feet from east line, section 29, Township 22 South, Range 31 East, Eddy County, New Mexico
ELEVATION: 3,388.7 feet (ground level)
DEPTH DRILLED: 894 feet (864 feet to top cement plug)
DATE COMPLETED: August 12, 1976
DRILLING CONTRACTOR: Pennsylvania Drilling Company, Carlsbad, New Mexico
DRILLING METHOD: Auger 18-inch hole (0-38 feet)Rotary 7 7/8-inch hole with air and air mist (38-894 feet) Ream 8 3/4-inch hole (38-894 feet) Rotary cement plug (864-894 feet)
WELL CASING RECORD: 10 3/4-inch outside diameter steel surface pipe (0-38 feet) cemented tosurface, 6 5/8-inch outside diameter steel casing, 24 pounds, 1.43 gallons per foot (0-891 feet) cemented to surface.
Modified from Mercer and Orr, 1979
Figure 6.--Construct ion and completion details and specifications of
hydrologic test pad H3.
11

Chronology of Exploratory-Shaft Construction
A detailed history of the exploratory-shaft construction was reported by Fenix and Scisson (1982). A synopsis of drilling events relevant to this report is supplied below:
06-24-81 Reverse rotary drilling rig moved onto the site.07-04-81 Drilling began.07-27-81 Drilled into the top of the Magenta Dolomite Member
of the Rustler Formation; ground-water flow is from Magenta Dolomite Member into the borehole.,
07-29-81 Drilled through the bottom of the Magenta Dolomite Member.
08-07-81 Drilled into the top of the Culebra Dolomite Member of the Rustler Formation; ground-water flow is from Culebra Dolomite Member into the borehole.
08-09-81 Drilled through the bottom of the Culebra Dolomite Member.
08-09-81 Drilling-fluid level in borehole falls below the bottomof the Magenta Dolomite Member; ground-water flow from the Magenta Dolomite Member into borehole is unrestricted.
08-15-81 Drilling-fluid level in borehole falls below the bottomof the Culebra Dolomite Member; ground-water flow from the Culebra Dolomite Member into the borehole is unrestricted.
10-24-81 Drilling stopped at 2300 feet below land surface.Borehole filled with brine to about 254 feet below land surface. Drill pipe pulled from borehole.
10-25-81 Brine continually added to borehole. Density to of the brine unknown. Occassional reports of
11-15-81 fluid level.11-16-81 Casing lowered into the borehole. Brine
to level in borehole maintained near ground level.12-03-81
12-04-81 Cementing.12-06-81 Access to Culebra Dolomite Member sealed with cement.12-07-81 Access to Magenta Dolomite Member sealed with cement.
Construction-Generated Stresses
The simulated stresses applied to the model of the Magenta Dolomite and Culebra Dolomite Members at the location of the exploratory shaft are shown in figure 7. The datum used for each water-bearing zone (fig. 7) is the reported static depth to water in the water-bearing zone at hydrologic test pad HI (J. W. Mercer, U.S. Geological Survey, oral commun., 1983). All calculations are made to this datum.
12

h- o z < O. OO. i
X O C£ UJUJ X
h- < UJUJ I U. UJ
> Z. UJ
UJ UJ CJ h- z. < < 3: x o o
UJ <> h-UJ CO_l
I UJa: xUJ h-
<C co
750
500
250
-250
-500
CEMENT _
MAGENTA DOLOMITE MEMBER
CULEBRA DOLOMITE MEMBER
DRILL BIT PENETRATES
MEMBER
/I
.DRILL BIT BELOW MEMBER
DRILLING FLUID BELOW MEMBER
CASING INSTALLATION
I_______I________fJULY AUG. SEPT. OCT.
1981NOV. DEC. JAN.
Figure 7.--The exploratory-shaft simulated stresses in the Magenta and Culebra
Dolomite Members of the Rustler Formation at the WIPP site.
Estimation of Brine Density Used to Stabilize Open Shaft
The ratio of the density of the brine fluid to the density of the formation fluids was estimated to be 1.3. This number was determined by assuming that: (1) The time interval between the drill bit penetrating a water-bearing zone and the first response measured at hydrologic test pad HI had to be reproduced in the model; and (2) the timing, amplitude, and slope simulations of the hydrographs at HI in the model had to be made with no more than one value of diffusivity in each water-bearing zone.
The maximum stress required to match both the timing of the response at test pad HI as well as the amplitude and slope of the response was made by increasing the calculated stress at the modeled shaft when the casing string was lowered by a factor of 1.3. The increase in stress was assumed to represent the greater density of the brine in the shaft used to support the casing string than the water present in the water-bearing zone. The calculated density ratio of 1.3 between the brine to the water in the water bearing zone is reasonable because the brine density is known to be greater than the water in the water-bearing zone. Exactly how much greater is unknown, the density of the brine fluid was never measured.
13

To account for the lack of density information on the brine fluid, a possible ratio of brine density to formation-fluid density had to be established. The ratio of densities was estimated from the difference between the reported weight of the casing string while it was being lowered into the exploratory-shaft borehole (and partially supported by fluid in the borehole) and the estimated casing-string weight. The density ratio that was calculated and supplied the needed 100 feet of additional stress at the exploratory shaft was 1.3. This value was used to make the final stress hydrographs shown in figure 7.
Events on 07-27-81
The drill bit penetrated the top of the Magenta Dolomite Member. The ground-water head in the Magenta Dolomite Member at the borehole decreased from 0 feet (static water level) to -260 feet. To calculate the initial head change, the following procedure was used.
In a reverse rotary drilling system, drilling fluids are circulated up the drill pipe and down the annulus formed between the outside of the drill pipe and the borehole wall. During the drilling of the exploratory shaft, about 100 feet of drilling fluid was kept above the drill bit (J. W. Mercer, U.S. Geological Survey, oral comtnun., 1983). When the drill bit penetrated the top of the Magenta Dolomite Member, the head at the drill bit was calculated as the difference in pressure between the depth of the drill bit and the water-bearing zone, which was calculated as the difference in feet between the static water level (about 270 feet below land surface) and the bottom of the water-bearing zone (about 630 feet below land surface) plus 100 feet from the drilling fluid, which equals about -260 feet below the static water level. The -260 feet was decreased on a daily basis to -366 feet. This was to account for the drill bit cutting deeper into the Rustler Formation.
Events on 08-09-81
The drilling-fluid level was below the bottom of the Magenta Dolomite Member. The pressure in the borehole was -360 feet. The hydraulic head in the borehole was the difference between the static water level and the bottom of the water-bearing zone, or about -360 feet. The -360 feet represents the minimum pressure possible in the borehole.
Events on 10-24-81
Drilling stopped at 2,300 feet below land surface. The borehole was filled with brine to about 254 feet below land surface. The reported brine level of 254 feet below land surface was changed to an equivalent formation head of +130 feet above the static water level using the brine and formation- fluid density ratio of 1.3.
14

The bottom of the water-bearing unit is 630 feet below land surface and the brine level was reported at 254 feet below land surface: 630 feet minus 254 feet is 376 feet. Multiplying the 376 feet of brine by the assumed density ratio of 1.3 yields about 490 feet in equivalent formation head; 630 feet minus 490 feet is 140 feet, or a water level 140 feet below land surface. The static water level was assumed to be about 270 feet below land surface. The difference between 270 feet and 140 feet is 130 feet above static water level, or the pressure is +130 feet in freshwater-equivalent formation head in the borehole.
Events from 10-25-81 to 11-15-81
The density of the fluid in the borehole was unknown. Occasional reports of the fluid level in the borehole were made by Fenix and Scisson (1982). The reported fluid levels were changed to an equivalent formation head using a density ratio of 1.3 times the water in the Magenta Dolomite Member.
Events from 11-16-81 to 12-03-81
The casing was lowered into the borehole and was partially supported by the brine in the borehole. An assumption was made that the brine either overflowed the borehole while casing was being lowered or the brine level was at ground level. Brine density was assumed to be 1.3 times the water in the water-bearing unit.
The bottom of the water-bearing unit is 630 feet below land surface. Multiplying 630 feet by 1.3 yields an equivalent formation head of about 820 feet. Static water level is 360 feet above the bottom of the water-bearing unit; subtracting 360 feet from 820 feet yields 460 feet. The equivalent formation head is +460 feet.
Events on 12-04-81
Cementing of the annular space between the casing and borehole wall began on December 4, 1981. The column of brine in the well was assumed to be either overflowing onto the land surface or at land surface. The equivalent formation head was assumed to be +460 feet.
Events on 12-07-81
The Magenta Dolomite Member was sealed with cement. The equivalent formation head in the Magenta was +460 feet. The modeled borehole was changed from a specified-head boundary that varied with time to a no-flow boundary and the +460 head was allowed to dissipate into the water-bearing zone.
15

CONCEPTUAL FLOW MODEL
Hydrology of the Rustler Formation
Hydrologic Flow Boundaries
The hydrologic units below, between, and above the Magenta Dolomite and Culebra Dolomite Members of the Rustler Formation (fig. 2) have been reported as impermeable. Mercer (1983, p. 79) wrote "In the WIPP site area, the presence of impermeable interbeds of halite and anhydrite and the differences in static head and water quality probably indicate restricted vertical hydraulic connection between units." A diagrammatic cross section of the flow model of the Rustler used in this report is shown in figure 8; the model has no-flow boundaries between the water-bearing units.
The choice of confined aquifers as models of the flow system in the Rustler Formation (fig. 8) cannot be made without stating an important caution: the effect of a well that is open to the Magenta Dolomite and Culebra Dolomite Members is to hydraulically connect discrete water-bearing units with different characteristics. The construction of a well open to both water-bearing units affects the hydrology of both units. The radial symmetry assumed in the cylindrical model precluded a mathematical correction of intraborehole flow at hydrologic test pad H2b.
Flow in Fractured Rock
The most widely used methods to determine hydraulic coefficients at the WIPP have been the single-well test and the multiple-well test. However, because of short test duration or small applied stress, only information on the unit near exploratory wells has been determined. On a well by well basis, the hydraulic coefficients of the water-bearing units in the Rustler Formation are variable. For example, Mercer (1983, table 7) reports the transmissivity of the Culebra Dolomite Member as 0.07 foot squared per day at HI, 0.4 foot squared per day at H2b, and 19 feet squared per day at H3; storage is reported to be 10~4 at HI and 10~9 at H2b.
The variability of the results from tests at the WIPP and the reported fractures in core samples indicate that the Magenta Dolomite and Culebra Dolomite Members are fractured. Flow models of fractured rock units can be developed using the idea of dual porosity. In a dual-porosity model (Barenblatt and others, 1960; StreItsova-Adams, 1978), primary hydraulic conductivity is from a system of fractures interconnected on a regional scale. Storage primarily is from the rock matrix.
The response of a dual-porosity system to a stress can be considered in three time periods. (1) The initial period occurs when flow is in the rock fractures. For example, in a single well, flow would be between the wellbore and fractures in the vicinity of the wellbore (local fractures). Flow from the regional system of fractures and rock matrix is essentially zero. Variations in local fracture density can cause significant differences in calculated transmissivities and storage coefficients. (2) The transition
16
period occurs when flow between the wellbore and the local fractures becomes dominated by the regional system of fractures and rock matrix. Flow in the regional system of fractures and rock matrix increases and becomes fully developed. Drawdown during transition flow when plotted on log-log paper as fracture pressure versus time has a similar shape to Boulton's (1963) set of type curves for delayed yield in an unconfined aquifer (Gringarten, 1982, p. 252). (3) Average values of hydraulic characteristics of the regional system of fractures and rock matrix can be determined when combined flow occurs. Homogeneous porous-medium solutions (for example, a flood-wave response model) might be appropriate during this period. Flow from the local fractures into wells and flow between the regional system of fractures and matrix is essentially in equilibrium. The problem in applying a homogeneous porous- medium procedure to a dual-porosity flow system is knowing the required length of time needed to approach a fully developed flow condition. The time element is important in making interpretations of data.
Assuming a flow condition for which homogeneous porous-medium solutions can be applied, the timing, amplitude, and rate of change of water levels is a function of: (1) the average hydraulic coefficients of the water-bearing zones, and (2) the construction-generated stresses. These can be simulated using the U.S. Geological Survey two-dimensional ground-water model (Trescott and others, 1976).
Flood-Wave Response
The construction of the exploratory shaft resulted in a flow of water to and from the borehole and water-bearing zones in the Rustler Formation during a 5-month period in 1981 . It was assumed that the length of time was great enough so that a flood-wave response model (Finder and others, 1969) could be applied. In this procedure a set of type curves is generated. Each set of curves represents the computed change in water level at an observation point due to a known stress. The diffusivity of a water-bearing zone is obtained by choosing the type curve that best matches the response at the observation point. An important assumption made about applying the flood-wave response procedure was that if the assumed stresses are wrong, for example, by a factor of two, the results are still proportional to the diffusivity. The error from the assumed stresses, in this example, could be corrected by multiplying the calculated diffusivity by one-half.
In applying the flood-wave response model to the Rustler Formation, it was assumed that the head changes resulted from the applied construction stresses. This assumption made it necessary to try to eliminate as much of the pre-construction water-level trends at hydrologic test pads HI and H3 as possible and to discard water-level data after ventilation-shaft construction began in January 1982.
The flood-wave response technique employed was to: (1) Decide on a conceptual flow model (fig. 8); .(2) approximate the construction-generated stresses (fig. 7); (3) develop families of type curves at the modeled hydrologic test pad locations using diffusivity as the principal coefficient; and (4) match the measured water-level data to type curves (figs. 11-15).
17

81
oc
oO
(D
cr(0~\ v>O
:r(D
c -i(D
ooI Io
OOu o(D
TJ rt Ca>
C. 3v> Ort Q. 0)(D
C in (Da.
Q> _,
Nr^ (t) 3-(D rt
E »-o ^

DESCRIPTION OF THE CYLINDRICAL MODEL
Determining hydraulic characteristics of the water-bearing zones in the Rustler Formation can be simplified by assuming that the area of interest at the WIPP has radial symmetry. This assumption permits the use of data from hydrologic test pads HI, H2b, and H3 in a wedge-shaped cylindrical model whose apex passes through the exploratory shaft. Land (1977) used a similar procedure to determine the hydraulic properties of a layered aquifer in Florida .
The necessary boundary conditions to make a cylindrical model of the WIPP area can be conveniently placed into a finite-difference grid using the two- dimensional ground-water model of Trescott and others (1976). The model uses a row and column discretization of the area being simulated. Head distribution in the water-bearing zone is solved by a finite-difference form of the continuous differential equation:
dh d dh dh (Kxx b dP +dj (Kyy b dP = S-^7 + W (x, y, t)
h K , Kyy are the principal components of the hydraulic-conductivity (L/t); S is the value of specific yield (dimensionless) ; b is the
in which Ktensorthickness of the water-bearing zone (L); and W is the rate of discharge parunit area.
The assumptions that make this mathematical model reasonable include:
(1) All flow in the water-bearing zone is coplanar with the model.(2) Anisotropy of the water-bearing zone (if any) is aligned with the row
and column axes of the discretization.(3) No spatial or temporal variations in fluid viscosity
or density exist.(4) The head distribution approximately satisfies a harmonic function,
so that node-centered values can be assumed to be equal to block-averaged values.
The standard x-y coordinate directions in the two-dimensional ground- water model are rotated into a vertical plane. The y coordinate direction is made parallel to the z coordinate direction. The model then is used to simulate head distribution in an r-z coordinate system. The modification simulates water flowing horizontally into the exploratory shaft. The rotation of a model grid with a standard x-y coordinate system into an r-z coordinate system is shown in figure 9. The apex of the wedge corresponds to the center of the exploratory shaft. For a homogeneous hydrologic unit, the model transmissivity is a linear function of the radius and of the simulation angle. A similar linear transformation is applied to the storage coefficient to represent the increase in subtended area with increasing radius. Because
19

the hydrologic unit thickness (z dimension) is treated as a width by the model, the specified aquifer coefficients correspond to hydraulic conductivity and specific storage rather than transmissivity and storage coefficient.
Three criteria were used to evaluate the success of a model run using the assumed stresses on the water-bearing zones during the construction of the exploratory shaft: (1) the reproduction of the peak amplitudes observed in the hydrographs at the hydrologic test pads, (2) the reproduction of the hydrograph slopes, and (3) the timing of the change in slope resulting from changes in stress. Model runs were matched to the recorded hydrographs at each hydrologic test pad. Diffusivity values were selected for each of the three criteria for each hydrograph. It would have been possible, for example, to select three diffusivity values for each hydrograph.
An illustration showing the row and column discretization of the cylindrical model is not practical. The modeled thickness is 200 feet and the modeled length is 72,975 feet (13.8 miles). A diagrammatic section of the important features of the model grid is shown in figure 10.
©
Figure 9.--Rotation and expansion of a two-dimensional finite-difference grid
into a radial-flow grid.
20

50 C
in
n- (D n
2
Ol in
o QJ
3QJ
OJ
3
PI-
Q.
n-
O
:r
c
n>
n>
s:
cr n- n> 3
cr
LQ C I I 50 i Q.
O i -
3
u.
z
Q.
3
OIT
-
CD O
<
28
00
P-
O
CO UJ o
2700
2600
EDGE OF
CELLS
WITH
EX
PLOR
ATOR
Y SH
AFT
COLUMN 25
EDGE OF CE
LLWI
TH HYDROLOGIC
TEST
PAD
HI
34EDGE OF CE
LLWI
TH HYDROLOGIC
TEST
PA
D H2B
38ED
GE OF CE
LL
WITH
HYDROLOGIC
TEST
PA
D H3
50
10 15 20
MAGENTA DOLOMITE
yy/yy
yyyy
yyyy
yyyy
/y///y
yyy//
//yyy
y/s
CULEBRA
DOLO
MITE
yy/y
/yy/
////y
//////
yyyy
yyyy
y/y/
y///'
y/y/
y/.,
6.3
1750
" 3578
DISTANCE FR
OM CE
NTER
OP
EXPLORATORY
SHAF
T,
IN FEET
43
78
72,9
75

RESULTS
The best overall calibrations of the model that reproduced the three criteria at hydrologic test pads HI, H2b, and H3 are shown in figures 11-13. The diffusivity values of the Magenta and Culebra Dolomite Members at hydrologic test pads HI and H3 are summarized in tables 1 and 2. A summary of bounding diffusivity values at hydrologic test pad H2b, which was open to both the Magenta and Culebra Dolomite Members, is given in table 3.
Diffusiviti.es in the Magenta Dolomite Member of the Rustler Formation at Hydrologic Test Pads HI and H3
The measured and simulated hydrographs in the Magenta Dolomite Member at hydrologic test pads HI and H3 are shown in figure 11. The best overall calibration of the model for HI was achieved using a diffusivity value of 0.03 foot squared per second. The measured hydrograph at H3 shows no response to the exploratory-shaft construction. For H3, the best overall calibration of the model was assumed to be made at the maximum value of diffusivity that did not produce a significant water-level response. Diffusivity values less than 0.1 foot squared per second met this criterion.
Table 1. Summary of diffusivity values used to simulate hydrographs at hydrologic test pads HI and H3 in the Magenta Dolomite Member of Rustler Formation*.
[All values in feet squared per second]
Hydrologic Slope Amplitude Timing test pad (rate of decline) (magnitude of decline) (first change)
HI 0.03 0.03 0.03
H3 less than 0.1 less than 0.1 less than 0.1
*Brine density assumed to be 1.3 times the water-bearing-zone fluid density.
22

co nUJ OH- UJ _i uj< 1 UJ ( CC CQ 1 3: 2:LJ O
UJ CD UJ
Z 1uj o0. 0
H- < ( 03 Z
LJ J CD-J <
t£.Q
250
H-IS UJO UJ _l U.UJCD Z
ocH uT 255< o
u.0 OC( raX 1- Qo. zLJ <° "" 260
1
nno
*~
oooo
u-j
_iu.uz
i1
, .-
a:o
J
oooc
MEAS
VvX
O Qej-H-ZUJCD
y
"JO UJ Q _l
<E Si pi <! SC2
r> CO u_ _J _J -2 < 0 U. CI o \ a c
0
j r 3 CO CO1 Z <
0OH- <° < z <I
Of
* Z i 1-I UJ _1 Z _J 202: _i uj _i ur Oj 0 c
ti> i : z zJ UJ3 CO 2:
oo a:<oc<<uj
><>ooo
URED
SIMULATED
o-c
RES
o z: 02
L JI i
^Orw^XK.
^fc«^T>
PONSE
RESPONSE WITHDIFFUSIVITY = 0.03 FOOT SQUARED PER SECOND
JULY AUG SEPT OCT NOV DEC
^-^5
JAN
240(
O " '_l U.UJ03 Z
QCUJ - 1- UJ
;|£ 245u.
0 CC
COX ( Q0. Z UJ < Q 1
250
i
- ^^^
_ O CJ
1 1 I
_-- ' MEASURED RESPONSE
*~-~
-
SIMULATED RESPONSE WITH DIFFUSIVITY = LESS THANO.I
JULY AUG
FOOT SQUARED PER SECOND
SEPT OCT NOV DEC JAN
1981 1982 1981 1982
HYDROLOGIC TEST PAD H1 HYDROLOGIC TEST PAD H3
Figure 11.--Hydrographs showing measured and simulated responses in
the Magenta Dolomite Member of the Rustler Formation
from hydrologic test pads HI and H3 (July 1981 through
January 1982).
23

Diffusiviti.es in the Culebra Dolomite Member of the Rustler Formation at Hydrologic Test Pads HI and H3
The measured and simulated hydrographs in the Culebra Dolomite Member at hydrologic test pads HI and H3 are shown in figure 12. At HI, a diffusivity value of 0.5 foot squared per second (table 2) satisfied all three criteria. At H3, the amplitude and slope matches were made with a diffusivity value of 0.5 foot squared per second. The timing match was made with a diffusivity value of 1.0 foot squared per second (table 2).
No single diffusivity value satisfied all three criteria at hydrologic test pad H3. Because the reconstructed stresses from the exploratory-shaft construction (fig. 7) were calibrated using the measured hydrograph at hydrologic test pad HI, no independent procedure was available to check the results.
Table 2* Summary of diffusivity values used to simulate hydrographs at hydrologic test pads HI and H3 in the Culebra Dolomite Member of Rustler Formation*
[All values in feet squared per second]
Hydrologic Slope Amplitude Timing test pad (rate of decline) (magnitude of decline) (first change)
HI 0.5 0.5 0.5
H3 0.5 0.5 1.0
*Brine density assumed to be 1.3 times the water-bearing-zone fluid density.
24

DEPT
H TO
WA
TER
BELO
W LA
ND SU
RFAC
E,
IN FEET
to
Ln
Q> O.
Q>
Q.
IE c_
c < VJD
OO
O c in OO
it
(0 3 cr
n> O -h it 3" n> >0 c
in o.
O in o
to c n ro i i 1C O
IQ -»
d)
T) O" in in 3-
O in C n n> o. CL
in 3 C n> Q.
(T)
in T) O 3
in n> in o c (T) cr
O
DO
O O
O o H
m CO H D I D
DO
O r~
O
O o H m CO H I
CO
DR
ILL
B
IT
PE
NE
TR
AT
ES
C
UL
EB
RA
D
OL
OM
ITE
DR
ILL
ING
F
LU
ID
BE
LO
W
CU
LE
BR
A
DO
LO
MIT
E
CA
SIN
G
INS
TA
LL
AT
ION
CE
ME
NT
C
AS
INO
DEPTH
TO WA
TER
BELO
W LAND SU
RFAC
E,
IN FE
ET
DR
ILL
B
IT P
EN
ET
RA
TE
S
CU
LE
BR
A
DO
LO
MIT
E
DR
ILL
ING
F
LU
ID
BE
LO
W
CU
LE
BR
A
DO
LO
MIT
E
CA
SIN
G
INS
TA
LL
AT
ION
CE
ME
NT
C
AS
ING
Diffusivities in the Rustler Formation at Hydrologic Test Pad H2b
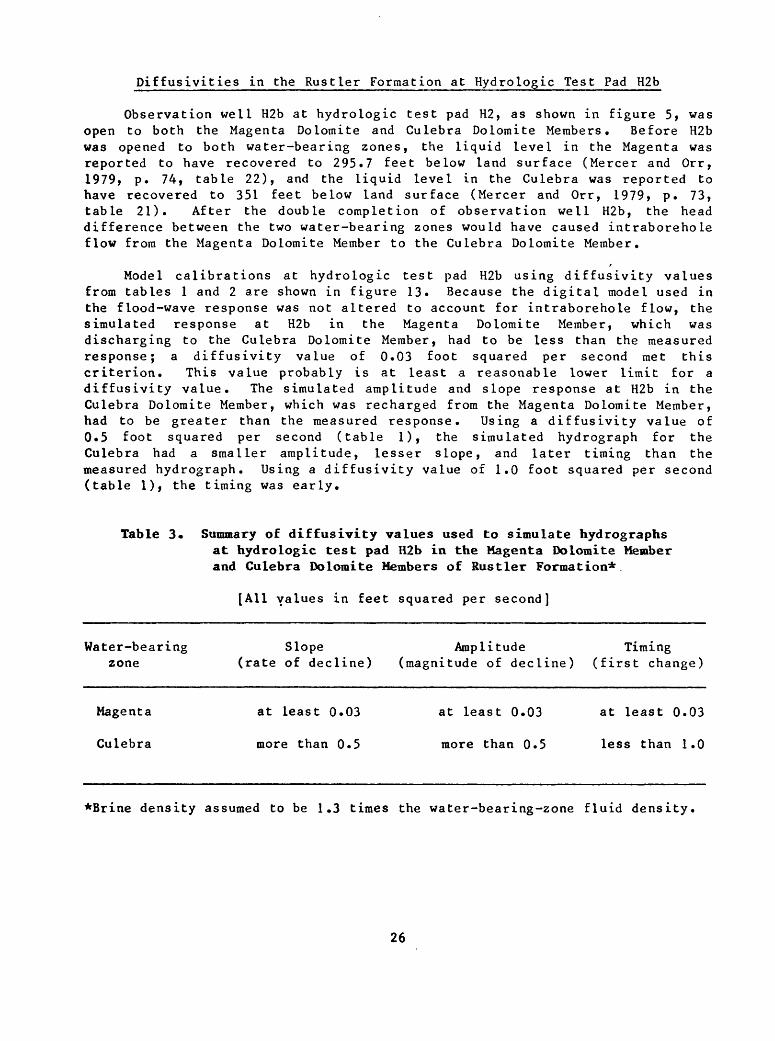
Observation well H2b at hydrologic test pad H2, as shown in figure 5, was open to both the Magenta Dolomite and Culebra Dolomite Members. Before H2b was opened to both water-bearing zones, the liquid level in the Magenta was reported to have recovered to 295.7 feet below land surface (Mercer and Orr, 1979, p. 74, table 22), and the liquid level in the Culebra was reported to have recovered to 351 feet below land surface (Mercer and Orr, 1979, p. 73, table 21). After the double completion of observation well H2b, the head difference between the two water-bearing zones would have caused intraborehole flow from the Magenta Dolomite Member to the Culebra Dolomite Member.
Model calibrations at hydrologic test pad H2b using diffusivity values from tables 1 and 2 are shown in figure 13. Because the digital model used in the flood-wave response was not altered to account for intraborehole flow, the simulated response at H2b in the Magenta Dolomite Member, which was discharging to the Culebra Dolomite Member, had to be less than the measured response; a diffusivity value of 0.03 foot squared per second met this criterion. This value probably is at least a reasonable lower limit for a diffusivity value. The simulated amplitude and slope response at H2b in the Culebra Dolomite Member, which was recharged from the Magenta Dolomite Member, had to be greater than the measured response. Using a diffusivity value of 0.5 foot squared per second (table 1), the simulated hydrograph for the Culebra had a smaller amplitude, lesser slope, and later timing than the measured hydrograph. Using a diffusivity value of 1.0 foot squared per second (table 1), the timing was early.
Table 3* Summary of diffusivity values used to simulate hydrographs at hydrologic test pad H2b in the Magenta Dolomite Member and Culebra Dolomite Members of Rustler Formation*.
[All values in feet squared per second]
Water-bearing Slope Amplitude Timingzone (rate of decline) (magnitude of decline) (first change)
Magenta
Culebra
at least 0.03
more than 0»5
at least 0.03
more than 0.5
at least 0.03
less than 1.0
*Brine density assumed to be 1.3 times the water-bearing-zone fluid density.
26

BEGIN DRIL
335
h-
£ 340z
LU 0
2J 345CO
a
2
o d 350CQ
a:UJt-
^
g 355aca.UJ 0
360
JNG-
1 1 1 1 [
t
A
arDaq2poooooooo ocoo< ^DA°
o /A a A /
o / AD JQ
D 5^
A D 4a
A \/A \^' /
. , ,\lJ A S 0 N D
> O
^J _
-
-
J
CEM
O
O
A
1981 1982
CEMENT CASING
CASING INSTALLATION
MEASURED RESPONSE
SIMULATED RESPONSE IN MAGENTA DOLOMITE MEMBER WITH DIFFUSIVITY = 0.03 FOOT SQUARED PER SECOND
SIMULATED RESPONSE IN CULEBRA DOLOMITE MEMBER WITH DIFFUSIVITY = 0.5 FOOT SQUARED PER SECOND
SIMULATED RESPONSE IN CULEBRA DOLOMITE MEMBER WITH DIFFUSIVITY = 1.0 FOOT SQUARE PER SECOND
Figure 13.--Hydrographs showing simulated responses in the Magenta
and Culebra Dolomite Members of the Rustler Formation
and the measured response in hydrologic test pad H2b
(July 1981 through January 1982).
27
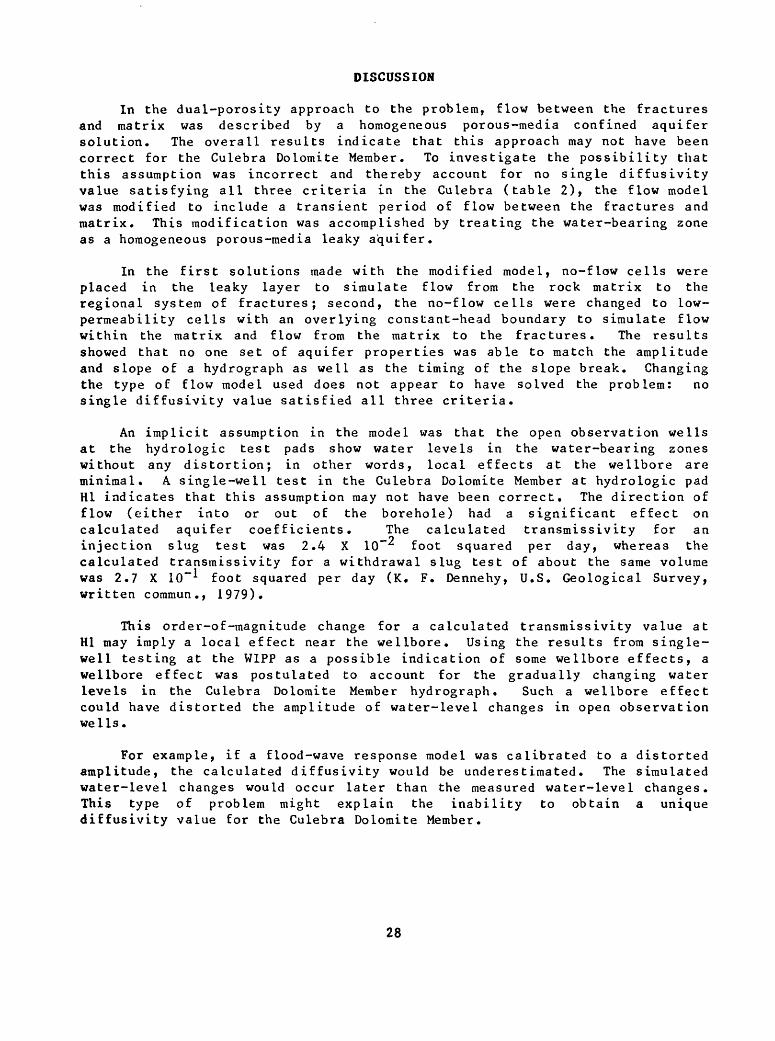
DISCUSSION
In the dual-porosity approach to the problem, flow between the fractures and matrix was described by a homogeneous porous-media confined aquifer solution. The overall results indicate that this approach may not have been correct for the Culebra Dolomite Member, To investigate the possibility that this assumption was incorrect and thereby account for no single diffusivity value satisfying all three criteria in the Culebra (table 2), the flow model was modified to include a transient period of flow between the fractures and matrix. This modification was accomplished by treating the water-bearing zone as a homogeneous porous-media leaky aquifer.
In the first solutions made with the modified model, no-flow cells were placed in the leaky layer to simulate flow from the rock matrix to the regional system of fractures; second, the no-flow cells were changed to low- permeability cells with an overlying constant-head boundary to simulate flow within the matrix and flow from the matrix to the fractures. The results showed that no one set of aquifer properties was able to match the amplitude and slope of a hydrograph as well as the timing of the slope break. Changing the type of flow model used does not appear to have solved the problem: no single diffusivity value satisfied all three criteria.
An implicit assumption in the model was that the open observation wells at the hydrologic test pads show water levels in the water-bearing zones without any distortion; in other words, local effects at the wellbore are minimal. A single-well test in the Culebra Dolomite Member at hydrologic pad HI indicates that this assumption may not have been correct. The direction of flow (either into or out of the borehole) had a significant effect on calculated aquifer coefficients. The calculated transmissivity for an injection slug test was 2.4 X 10 foot squared per day, whereas the calculated transmissivity for a withdrawal slug test of about the same volume was 2.7 X 10~1 foot squared per day (K. F. Dennehy, U.S. Geological Survey, written commun., 1979).
This order-of-magnitude change for a calculated transmissivity value at HI may imply a local effect near the wellbore. Using the results from single- well testing at the WIPP as a possible indication of some wellbore effects, a wellbore effect was postulated to account for the gradually changing water levels in the Culebra Dolomite Member hydrograph. Such a wellbore effect could have distorted the amplitude of water-level changes in open observation we 1Is.
For example, if a flood-wave response model was calibrated to a distorted amplitude, the calculated diffusivity would be underestimated. The simulated water-level changes would occur later than the measured water-level changes. This type of problem might explain the inability to obtain a unique diffusivity value for the Culebra Dolomite Member.
28

Diffusivity values calculated using the values of transraissivity and storage coefficient reported by Mercer (1983, p. 105, table 7) from single well slug tests are shown in table 4. A value of 1 X 10"^ was assumed for tests where a storage coefficient was not reported.
Table 4. Values of diffusivity calculated for the MagentaDolomite Member and Culebra Dolomite Member of the Rustler Formation using hydraulic coefficients reported by Mercer (1983, p. 105, table 7)
[All.values in feet squared per second]
Water-bearing zone HI H2b H3
Magenta Dolomite Member
Culebra Dolomite Member
0.01*
0.01 4,600
0.12
2.20*
*Storage coefficient assumed to be 1 X 10
The diffusivity values in table 4 do not show the consistency that the values in tables 1, 2, and 3 show. However, the large range in the calculated values in table 4 are consistent with a fractured rock unit. Since the tests had a small magnitude of stress and short duration, they reflect the differences between local fracture density at each well rather than average values.
The values simulated with the flood-wave response model for HI and H3 are the same for the Magenta Dolomite Member and differ by a factor of two for the Culebra Dolomite Member. The consistency of the results imply that average values of hydraulic coefficients were calculated for the Magenta Dolomite and Culebra Dolomite.
29

CONCLUSIONS
The following conclusions can be drawn from this investigation:
1. On a regional scale, both the Magenta Dolomite and Culebra Dolomite Members of the Rustler Formation can be modeled by considering them to be homogeneous, isotropic, and confined hydrologic units.
2. A fracture-flow, dual-porosity concept is consistent with analytical results and measured data.
3. Magenta Dolomite Member diffusivity is estimated to be 0.03 foot squared per second. Culebra Dolomite Member diffusivity is estimated to be 0.5 to 1.0 foot squared per second.
4. Wellbore effects in the Culebra Dolomite Member may explain the inability to obtain a unique diffusivity result.
30

SELECTED REFERENCES
Adams, J. E., 1944, Upper Permian Ochoa series of Delaware Basin of westTexas and southeastern New Mexico: American Association of Petroleum Geologists Bulletin, v. 28, no. 11, p. 1596-1625.
Barenblatt, G. I., Zheltov, I. P., and Kochina, I. N., 1960, Basic conceptsin the theory of seepage of homogeneous liquids in fissured rocks: New York, Journal of Applied Mathematics and Mechanics, v. 24, no. 5» p. 1286-1303.
Boulton, N. S., 1963, Analysis of data from non-equilibrium pumping testsallowing for delayed yield from storage: Proceedings of the Institute of Civil Engineering, v. 26, p. 469-482.
Bredehoeft, J. D., and Papadopulos, S. S., 1980, A method for determining the hydraulic properties of tight formations: Water Resources Research, v. 16, no. 1, p. 233-238.
Cooper, H. H., Bredehoeft, J. D., and Papadopulos, S. S., 1967, Response ofa finite-diameter well to an instantaneous charge of water: Water Resources Research, v. 3, no. 1, p. 263-269.
Daily, J. W., and Harleman, D. R. F., 1973, Fluid dynamics: Reading, Mass., Addison-Wesley, 454 p.
Dennehy, K. F., and Davis, P. A., 1981, Hydrologic testing of tight zones in southeastern New Mexico: Ground Water, v. 19, no. 5, p. 482-489.
D'Appolonia Consulting Engineers, 1983, Correlation of drill hole and shaftlogs, Waste Isolation Pilot Plant (WIPP) Project, Southeastern New Mexico, Supporting document No. 8 for TME3177: Albuquerque, N. Mex., consultant's report prepared for U.S. Department of Energy, var. pg.
Fenix and Scisson, Inc., 1982, SPDV Exploratory shaft hole history:Albuquerque, N. Mex., consultant's report prepared for U.S. Department of Energy, 37 p.
Gonzales, D. D., 1983, Hydrogeochemical parameters of fluid-bearing zones inthe Rustler and Bell Canyon Formations: Waste Isolation Pilot Plant (WIPP), Southeast New Mexico (SENM): Sandia National Laboratories, SAND83-0210, 37 p.
Gringarten, A. C., 1982, Flow-test evaluation of fractured reservoirs,in Narasimhan, T. N., ed., Recent trends in hydrogeology: Geological Society of America Special Paper 189, p. 237-263.
Grubb, H. F., and Zehner, H. H., 1973, Aquifer diffusivity of the OhioRiver alluvial aquifer by the flood-wave response method: Journal of Research of the U.S. Geological Survey, v. 1, no. 5, p. 597-601.
31

SELECTED REFERENCES - CONCLUDED
Kernodle, J. M., 1977, Theoretical drawdown due to simulated pumpage fromthe Ohio River alluvial aquifer near Siloam, Kentucky: U.S. Geological Survey Water-Resources Investigations 77-24, 39 p.
Land, L. F., 1977, Utilizing a digital model to determine the hydraulicproperties of a layered aquifer: Ground Water, v. 15, no. 2, p. 153-159.
Mercer, J. W., and Orr, B. R., 1979, Interim data report on the geohydrologyof the proposed Waste Isolation Pilot Plant site, southeast New Mexico: U.S. Geological Survey Water-Resources Investigations 79-98, 178 p.
Mercer, J. W, 1983, Geohydrology of the proposed Waste Isolation Pilot Plantsite, Los Medanos area, southeastern New Mexico: U.S. Geological Survey Water-Resources Investigations 83-4016, 113 p.
Neuzil, C. E., 1982, On conducting the modified 'Slug 1 test in tight formations: Water Resources Research, v. 18, no. 2, p. 439-441.
Papadopulos, S. S., and Cooper, H. H., 1967, Drawdown in a well of large diameter: Water Resources Research, v. 3, no. 1, p. 241-244.
Papadopulos, S. S., Bredehoeft, J. D., and Cooper, H. H., 1973, On theanalysis of "slug test" data: Water Resources Research, v. 9, no. 4, p. 1087-1089.
Pinder, G. F., Bredehoeft, J. D., and Cooper, H. H., 1969, Determination ofaquifer diffusivity from aquifer response to fluctuations in river stage: Water Resources Research, v. 5, no. 4, p. 850-855.
Richardson, G. B., 1904, Report of a reconnaissance in Trans-Pecos Texas,north of Texas and Pacific Railway: University of Texas Mineral Survey Bulletin 9, 119 p.
Streltsova-Adams, T. D., 1978, Well hydraulics in heterogeneous aquiferformations, in Chow, Ven Te, ed., Advances in hydroscience: New York, Academic Press, v. 11, p. 357-423.
Trescott, P. C., Pinder, G. F., and Larson, S. P., 1976, Finite-differencemodel for aquifer simulation in two dimensions with results of numerical experiments: Techniques of Water-Resources Investigations of the U.S. Geological Survey, chapter Cl, book 7, 116 p.
Vine, J. D., 1963, Surface geology of the Nash Draw quadrangle, Eddy County, New Mexico: U.S. Geological Survey Bulletin 1141-B, 46 p.
32