determination of b 2 stress indices for thin-walled
TRANSCRIPT

Transactions, SMiRT-23
Manchester, United Kingdom - August 10-14, 2015
Division II, Paper ID 056
DETERMINATION OF B2 STRESS INDICES FOR THIN-WALLED
STRAIGHT PIPES WITH D/T > 50
Henry Schau1, Wolfgang Hienstorfer2, and Michael Johannes3
1 Head of Structural Analyses, TÜV SÜD Energietechnik GmbH, Mannheim, Germany 2 Head of Structural Analyses, TÜV SÜD Energietechnik GmbH, Filderstadt, Germany 3 Professional Expert for Structural Analysis, TÜV SÜD Energietechnik GmbH, Mannheim, Germany
ABSTRACT
The B2 stress indices of thin-walled straight pipes with D/t-ratios (D - outside diameter, t - wall thickness) in the range 40 ≤ D/t ≤ 120 are determined using FE analyses. The analyses were performed for pipes made of ideal elastic-plastic materials and for a few chosen steels. The B2 index is calculated from the maximal bending moments obtained by nonlinear FE analyses. A method for the calculation of the B2 index for thin-walled straight pipes is derived. The analyses show that the type of imperfection, the ovality due to bending,the D/t ratio and the yield stress have significant influences on the B2 indices. The nominal bending stress of pipes with D/t > 50 and an ovality of 1% is at the point of instability smaller than the yield stress. Hence, the failure occurs by buckling in the elastic range with small rotation angles. This is in agreement with the experimental results. Curves for the dependence of B2 from the D/t ratio are given. For ideal elastic-plastic pipes with D/t = 100 and a possible technical ovality of 1% the B2 index is 1.42 for a yield stress of 200 MPa and 1.93 for 600 MPa. In general, there is a good formal agreement between the calculated values and the values of the ASME BPVC. For the description of the temperature dependence of the B2 index an alternative procedure is proposed. Finally, the influence of the B2 stress indices on the safety of piping systems with D/t > 50 is discussed.
INTRODUCTION
The design of piping components for primary loads in modern nuclear codes, such as the ASME Boiler and Pressure Vessel Code (the ASME Code), the French RCC-M and the German KTA 3201.2 and 3211.2, are based on the following formula:
with (1)
B1 and B2 are the primary stress indices for the internal pressure p and the primary bending moment M (d - inside diameter, I - moment of inertia, σallowable - allowable stress). The stress indices B1 and B2 are used to modify nominal stress equations for straight pipes so that the behaviour of piping components such as elbows can be controlled using the same stress limits as for straight pipes. Initially, the stress indices were only valid for piping components with dimensions D/t ≤ 50. With the 2008 Edition of the ASME Code the range for the dimensions was extended to D/t ≤ 100. For the range 50 < D/t ≤ 100 the B1 indices in Table NB-3681(a)-1 are valid and the B2 indices should be multiplied by a correction factor NB-3683.2 (c). These enhancements were included in the 2013 Editions of the German KTA 3201.2 and 3211.2. The background for these corrections is the different failure mechanism of thin-walled piping components. Following Rod-abaugh (2002) the test data for straight pipes indicate that for D/t > 50 the mode of plastic failure may be “buckling” rather than limit load. Since imperfections and nonlinear material properties have a strong in-
fluence on the plastic buckling, the effects of these values on the B2 stress index are studied in this paper with the help of nonlinear Finite Element (FE) analyses.

23rd Conference on Structural Mechanics in Reactor Technology
Manchester, United Kingdom - August 10-14, 2015 Division II
DETERMINATION OF B2 FOR THIN-WALLED PIPES
The ASME Code does not give an appropriate method for determining the stress indices. A new method to calculate the B2 stress index is given by Matzen and Tan (2000). This method is based on the simple con-sideration that the allowable stresses in (1) must be equal for any piping component and a straight pipe of the same material and basic geometric sizes:
With (1) it follows for p = 0:
(B2 pipe - B2 index for the straight pipe, B2 comp - B2 index for the considered piping component) Since B2 pipe = 1 for a straight pipe:
(2)
According to the ASME Code, the verification of the primary loads can also be done with the collapse load (CL) defined by the twice elastic slope method according to the NB-3213.25 or the instability load (IL) according to the NB-3213.26. Since the allowable loads differ from the collapse or instability loads only by a safety factor, the allowable moments in Equation (2) can be replaced by the collapse moment MCL or instability moment MIL. These result in the following equations:
for collapse loads (3)
for instability loads (4)
(pipe - straight pipe as reference, comp - considered component)
In some cases, especially for a failure by local buckling, it is not possible to determine the collapse load. Since the instability loads can always be determined these loads will used. The basic approach in the ASME Code, that B2 is always 1 for straight pipes, is only valid for pipes of ideal elastic-plastic material and without an ovalisation of the cross section due to bending. In fact, the B2 index depends on many values, such as material and geometrical properties, failure mode and imperfections. Hence, Equation (4) has to be modified to enable the studies of these effects in particular for straight pipes. From the previous considerations follows the approach to treat thin-walled straight pipes with D/t > 50 as a pipe component. The reference moment designated with “pipe” in (4) is the instability load for a straight pipe of the same material and geometric properties where a failure by buckling and ovalisation is sup-pressed. For a straight pipe made of ideal elastic-plastic material with the yield stress σy the appropriate instability load is given by the plastic moment Mpl
( - plastic section modulus). (5)
23rd Conference on Structural Mechanics in Reactor Technology
Manchester, United Kingdom - August 10-14, 2015 Division II
From Equations (4) and (5) follows:
(6)
Equation (6) is applied to calculate the B2 stress index for ideal elastic-plastic pipes. Yu et al. (1999) are using a similar equation (with collapse loads) for the determination of the B2 index. For other plastic prop-erties a simple approximation for the reference value is the plastic moment given by Equation (5), where for σy the yield stress or for materials not exhibiting a definite yield point the 0.2% offset yield stress (proof stress) is used. This yield stress is, in particular for austenitic steels, rather an empirical approach and from a mechanical or theoretical point of view difficult to justify. To verify this approach the dependence of the B2 index from D/t is to be determined. The obtained B2 indices must converge to 1.0 for small D/t ratios. Otherwise, the yield stress is to be corrected by a (constant) factor. A similar method was applied to get the corrections for thin-walled piping components with 50 < D/t ≤ 100 in the ASME Code. These corrections
are based on the investigations in the General Electric Report (1978). FINITE ELEMENT MODEL AND ANALYSES
The analyses use the implicit code of the FE program Abaqus and take geometric (large displacement and strain) and material nonlinearities into account. The FE models use S4 shell elements and are symmetric to the plane of bending. The mesh (60 elements on the compression and 30 elements on the tension side over the circumference) is downsized axial to the centre. The considered pipes have an outside diameter of 200 mm and lengths from 1000 to 4000 mm. The D/t ratio varies from 40 to 120. On one end of the pipe the rotation is applied to the master node, which is connected to the pipe end by rigid coupling conditions; on the other end the nodes are fixed. The corresponding bending moment is obtained from the reaction moment of the master node. Since the local buckling often causes numerical problems, the RIKS method is applied in these cases. The usual procedure for the plastic buckling analyses is described e.g. in the Abaqus manuals and consists of two steps. First, the elastic buckling modes and normalized displacements for pipes with different lengths of the buckling region under a moment load are calculated. In the next step the normalized displacements of the obtained buckling modes are scaled and used as initial imperfections (multiple small wrinkles) for the nonlinear analyses. Additionally, the following imperfections are used: - analytically defined single buckles with a constant width of 50 mm or variable widths between 78.5 mm
for D/t = 40 and 45.7 mm for D/t = 120 (scaled in relation to D/t = 100 with following Timoshenko and Gere (2005)),
- a reduced wall thickness of 15% (width 24 mm), and - a circular line contact on the compression side (simple model for a clamp with a gap). The single buckles are defined by the following expression:
(α, β - parameter, λ - half width) (7)
The value δr is the radial deviation from the ideal circular geometry (z - axial coordinate from the middle, φ - circumferential angle to the plane of bending). The geometric parameters β and λ are derived from the elastic buckling modes. The size of the local deviation from the ideal circular cross-section and also of the (geometric) imperfection is characterized by the ovality:
(8)
(Dmax - maximal outside diameter, Dmin - minimal outside diameter)

23rd Conference on Structural Mechanics in Reactor Technology
Manchester, United Kingdom - August 10-14, 2015 Division II
The ASME Code, Section I, PG-5.4.2 states “Pipe having a tolerance of ±1% on either the O.D. or the I.D.”.
The KTA 3201.2 and 3211.2 specifies a maximal ovality of 2% for pipes. The ASTM A530 gives a maximal ovality of 1.5% for thin-walled pipes with D/t > 33. Therefore, imperfections with an ovality of 1% are mainly used in the analyses. In the calculations the ideal elastic-plastic material model and real material models (true stress/strain) for a few chosen steels are used. Table 1 shows relevant material properties for these steels (E - modulus of elasticity, σu - ultimate tensile strength).
Table 1: Important material properties of the steels
Material E in GPa σy in MPa σu in MPa Material data
X6CrNiNb18-10 200 240 588 Mutz (2011)
AISI 304L 205 272 592 Wilkins (2002)
22NiMoCr3-7 210 468 620 Bernauer et al. (1999)
20MnMoNi5-5 205 506 666 Reicherter (2011)
RESULTS FROM THE FINITE ELEMENT ANALYSES For the first calculations pipes made of ideal elastic-plastic material (ideal elastic-plastic pipes) are used. Figures 1 and 2 show two typical failure modes for pipes (length L = 2000 mm, E = 200 GPa, σy = 200 MPa, single buckle as imperfection O = 1%) with D/t = 40 and 70 (part of the pipe). The pipe with D/t = 40 fails with a simple kink and symmetrical stresses. The pipe with D/t = 70 fails by (plastic) buckling with three wrinkles and non-symmetrical stresses. These shapes are in a good agreement with the numerical and ex-perimental obtained shapes given by Kyriakides and Corona (2007).
Figure 1. Typical failure mode for an imperfect (buckle, O = 1%), ideal elastic-plastic pipe with D/t = 40
Figure 2. Typical failure mode for an imperfect (buckle, O = 1%), ideal elastic-plastic pipe with D/t = 70
Figure 3 shows the B2 index as a function of the D/t ratio for an ideal elastic-plastic pipe with the same properties for different imperfections. The typical slope of the curves is around 0.036, the maximum slope reaches 0.062. The curves for a single buckle (width 50 mm) with O = 0.5 and 1% envelop most of the values. Therefore, both of these imperfections are used in further studies.

23rd Conference on Structural Mechanics in Reactor Technology
Manchester, United Kingdom - August 10-14, 2015 Division II
Figure 3. B2 index for an ideal elastic-plastic pipe with σy = 200 MPa as a function of the D/t ratio for different kinds of imperfection
Figure 4 shows the B2 index as a function of the D/t ratio for an ideal elastic-plastic pipe with the same properties (single buckle with O = 1%) but different pipe lengths. There are no relevant differences between a pipe with a length of 2000 and 4000 mm. For the pipe with a length of 1000 mm the suppression of the ovalisation at the ends stabilizes the pipe and the boundary conditions have a significant influence. The following analyses use pipes with a length of 2000 mm. Figure 5 shows the B2 index as a function of the ovality for an ideal elastic-plastic pipe with D/t = 100 (E = 200 GPa, σy = 200 MPa, buckle). For small ovalities the B2 values increase rapidly, whereas for larger B2 values there is a smaller increase.
Figure 4. B2 index for an ideal elastic-plastic pipe with D/t = 100 and σy = 200 MPa as a function of the length
Figure 5. B2 index for an ideal elastic-plastic pipe with D/t = 100 and σy = 200 MPa as a function of the ovality
23rd Conference on Structural Mechanics in Reactor Technology
Manchester, United Kingdom - August 10-14, 2015 Division II
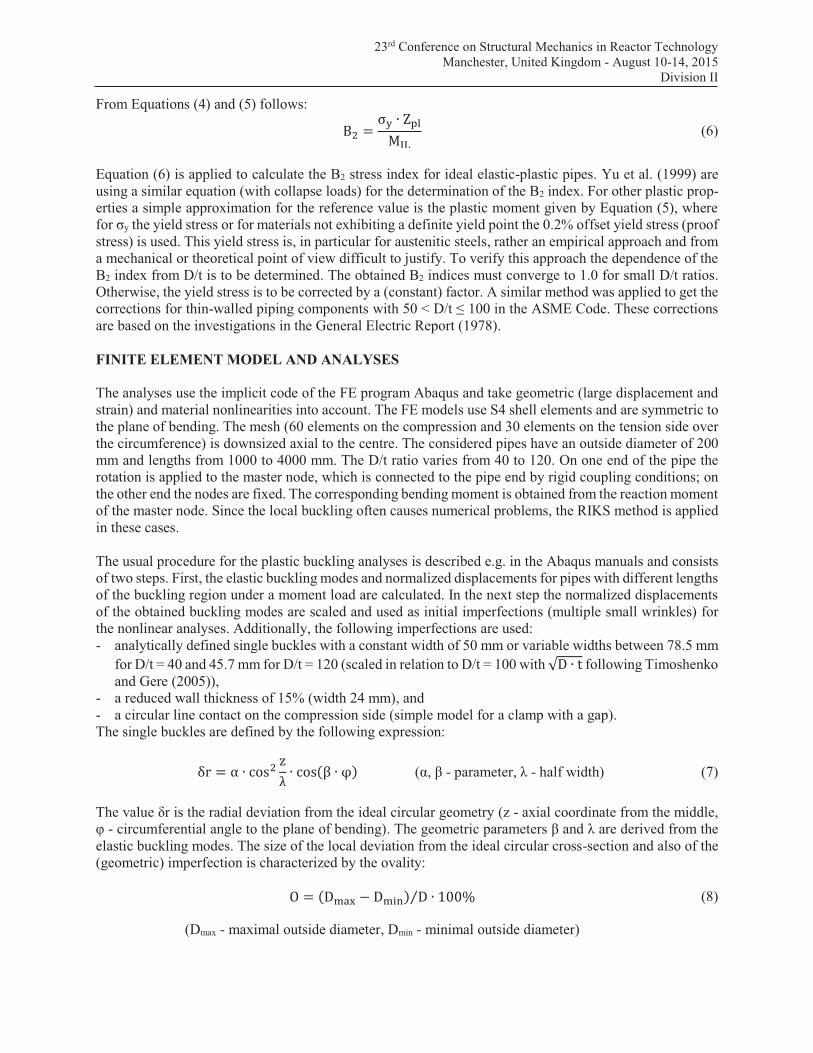
Figures 6 and 7 show the B2 index as a function of the D/t ratio for ideal elastic-plastic pipes with different yield stresses and a single buckle with an ovality of 0.5 and 1% as imperfection. The curves are nearly linear with slopes from 0.0035 to 0.0075 for O = 0.5% and 0.0057 to 0.0121 for O = 1%.
Figure 6. B2 as a function of the D/t ratio for an ideal elastic-plastic pipe with a single buckle O = 0.5%
Figure 7. B2 as a function of the D/t ratio for an ideal elastic-plastic pipe with a single buckle O = 1%
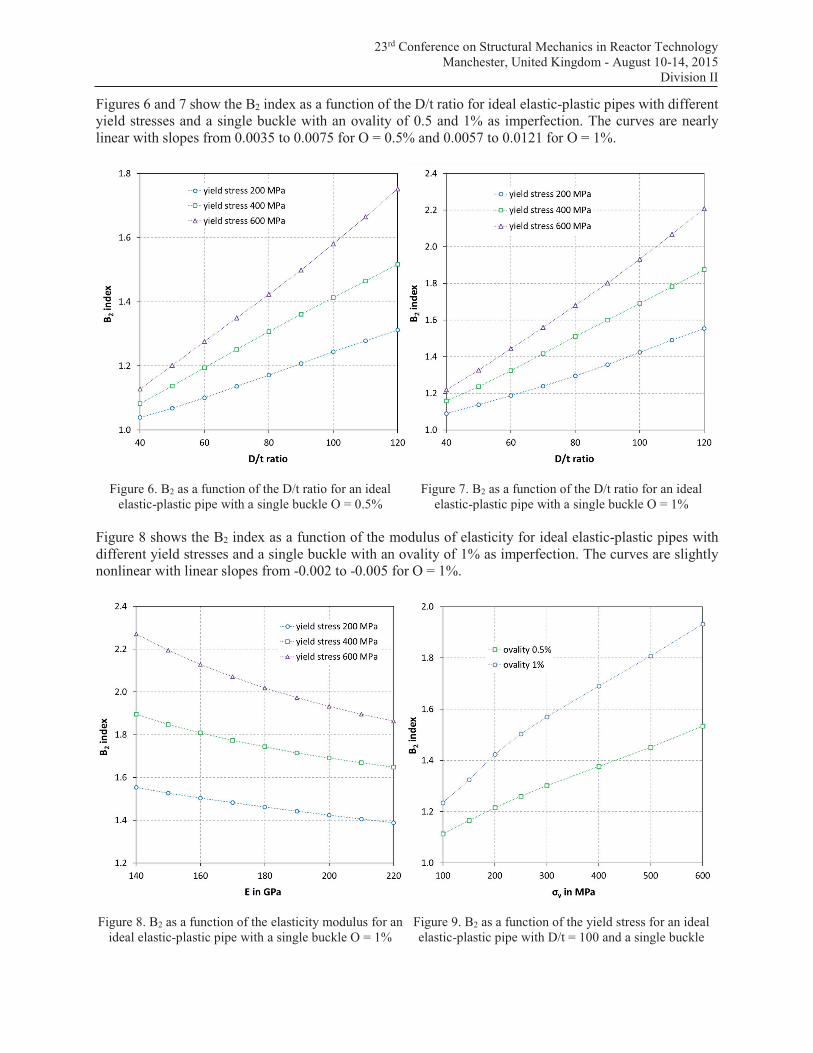
Figure 8 shows the B2 index as a function of the modulus of elasticity for ideal elastic-plastic pipes with different yield stresses and a single buckle with an ovality of 1% as imperfection. The curves are slightly nonlinear with linear slopes from -0.002 to -0.005 for O = 1%.
Figure 8. B2 as a function of the elasticity modulus for an ideal elastic-plastic pipe with a single buckle O = 1%
Figure 9. B2 as a function of the yield stress for an ideal elastic-plastic pipe with D/t = 100 and a single buckle
23rd Conference on Structural Mechanics in Reactor Technology
Manchester, United Kingdom - August 10-14, 2015 Division II
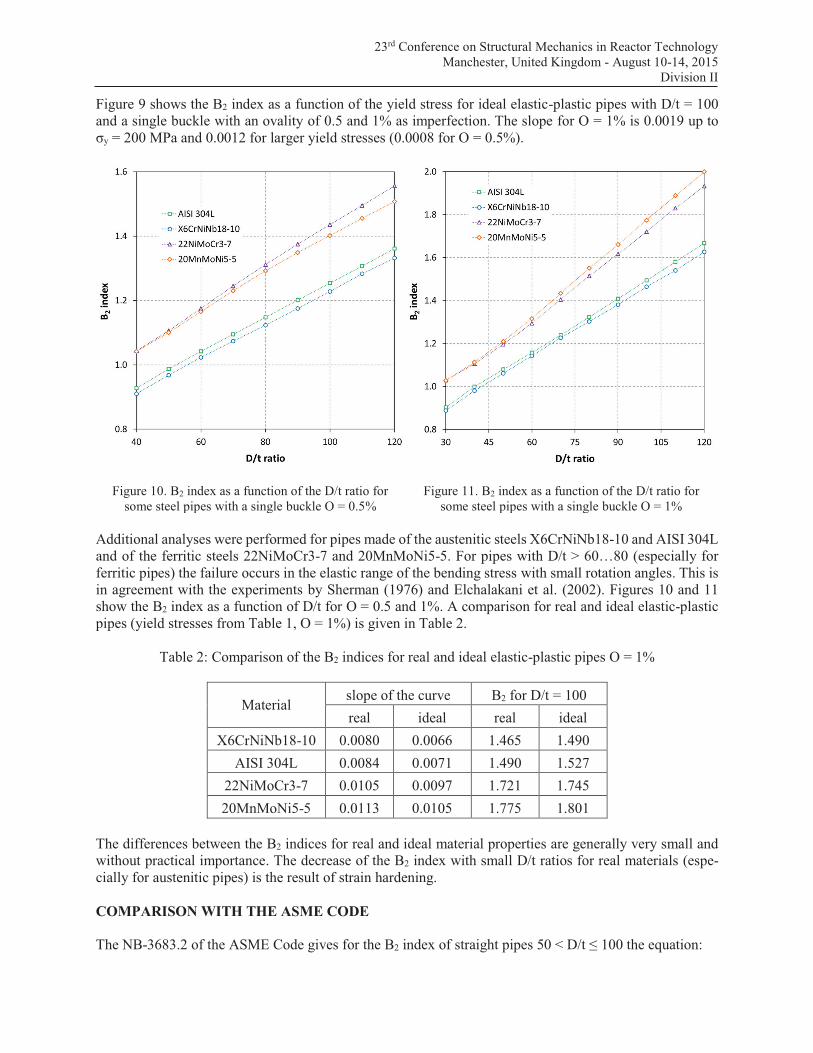
Figure 9 shows the B2 index as a function of the yield stress for ideal elastic-plastic pipes with D/t = 100 and a single buckle with an ovality of 0.5 and 1% as imperfection. The slope for O = 1% is 0.0019 up to σy = 200 MPa and 0.0012 for larger yield stresses (0.0008 for O = 0.5%).
Figure 10. B2 index as a function of the D/t ratio for some steel pipes with a single buckle O = 0.5%
Figure 11. B2 index as a function of the D/t ratio for some steel pipes with a single buckle O = 1%
Additional analyses were performed for pipes made of the austenitic steels X6CrNiNb18-10 and AISI 304L and of the ferritic steels 22NiMoCr3-7 and 20MnMoNi5-5. For pipes with D/t > 60…80 (especially for ferritic pipes) the failure occurs in the elastic range of the bending stress with small rotation angles. This is in agreement with the experiments by Sherman (1976) and Elchalakani et al. (2002). Figures 10 and 11 show the B2 index as a function of D/t for O = 0.5 and 1%. A comparison for real and ideal elastic-plastic pipes (yield stresses from Table 1, O = 1%) is given in Table 2.
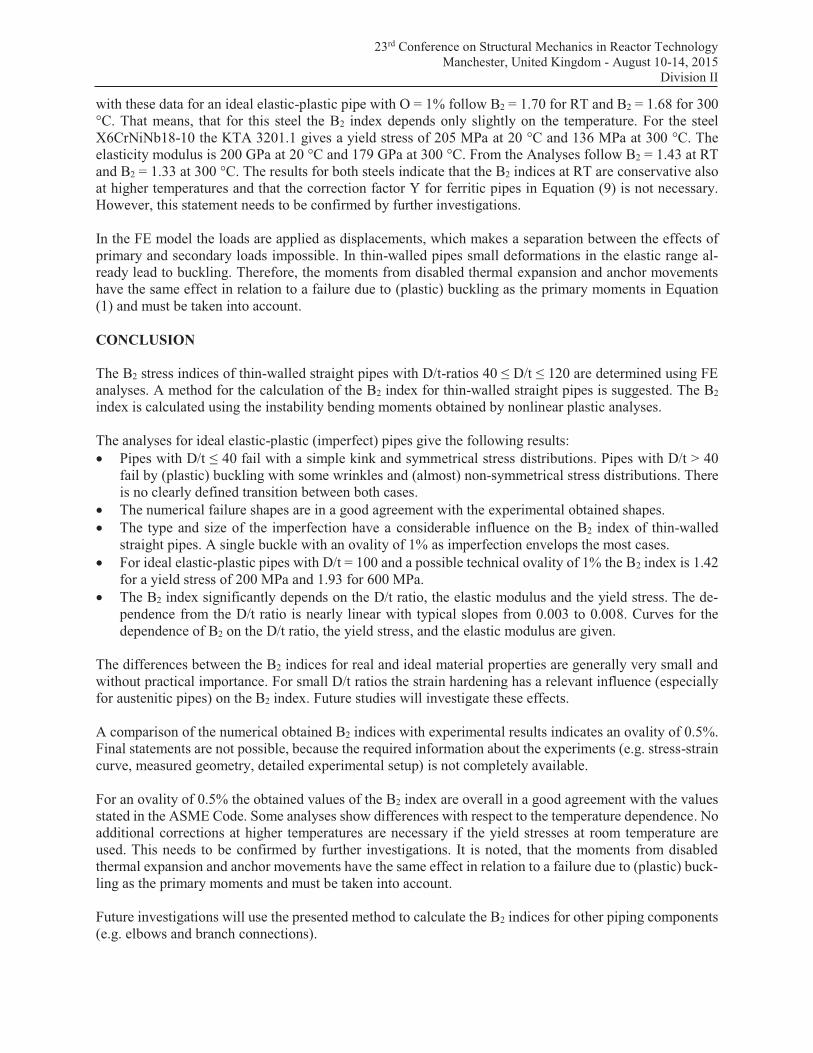
Table 2: Comparison of the B2 indices for real and ideal elastic-plastic pipes O = 1%
Material slope of the curve B2 for D/t = 100
real ideal real ideal
X6CrNiNb18-10 0.0080 0.0066 1.465 1.490
AISI 304L 0.0084 0.0071 1.490 1.527
22NiMoCr3-7 0.0105 0.0097 1.721 1.745
20MnMoNi5-5 0.0113 0.0105 1.775 1.801 The differences between the B2 indices for real and ideal material properties are generally very small and without practical importance. The decrease of the B2 index with small D/t ratios for real materials (espe-cially for austenitic pipes) is the result of strain hardening. COMPARISON WITH THE ASME CODE
The NB-3683.2 of the ASME Code gives for the B2 index of straight pipes 50 < D/t ≤ 100 the equation:

23rd Conference on Structural Mechanics in Reactor Technology
Manchester, United Kingdom - August 10-14, 2015 Division II
where X=1.3-0.006·D⁄t (9)
for ferritic materials and for other materials. (T - design temperature in °C)
This equation is based on the investigations in the General Electric Report (1978). Figure 12 shows the corresponding experimental data (Mmax - maximum moment) for ferritic pipes from Rodabaugh and Moore (1978). The yield stresses are between 336 and 586 MPa. It is noted, that in respect to the obtained depend-ence of B2 from the yield stress the linear fitting over such a wide range of yield stresses is not well-founded.
Figure 12. Experimental data for Mmax / Mpl as a function
of the D/t ratio from Rodabaugh and Moore (1978) Figure 13. MIL / Mpl as a function of the D/t ratio for an
ideal elastic-plastic pipe with σy = 500 MPa The linear fit of the data in the range 39 ≤ D/t ≤ 114.6 in Figure 12 gives:
(10) This slope is in a good agreement with the slopes from -0.0036 to -0.0049 for the curves 40 ≤ D/t ≤ 120 in Figure 13 for a yield stress of 500 MPa. According to Equation (9) B2 is 1.43 for D/t = 100 at room tem-perature. From Figure 13 follows a B2 index of 1.49 for O = 0.5% and 1.80 for O = 1%. These values indicate an ovality of 0.5%. On the other hand Equations (9) and (10) are based on a fit of a wide range of yield stresses and (unknown) different technical imperfections. From this point of view exact statements are not possible. It is noted, that Equation (9) is only based on experiments for ferritic pipes and therefore the results cannot be simply transferred to austenitic pipes. The calculations for the austenitic pipes give B2 = 1.25 for O = 0.5% and B2 = 1.49 for O = 1%. The ASME Code states B2 = 1.43. The yield strength and the elasticity modulus and hence the B2 index depend on the temperature. The Ger-man KTA 3201.1 specifies for the steel 20MnMoNi5-5 a yield stress of 430 MPa at room temperature (RT) and 371 MPa at 300 °C. The elasticity modulus is 211 GPa at RT and 192 GPa at 300 °C. From the Analyses
23rd Conference on Structural Mechanics in Reactor Technology
Manchester, United Kingdom - August 10-14, 2015 Division II
with these data for an ideal elastic-plastic pipe with O = 1% follow B2 = 1.70 for RT and B2 = 1.68 for 300 °C. That means, that for this steel the B2 index depends only slightly on the temperature. For the steel X6CrNiNb18-10 the KTA 3201.1 gives a yield stress of 205 MPa at 20 °C and 136 MPa at 300 °C. The elasticity modulus is 200 GPa at 20 °C and 179 GPa at 300 °C. From the Analyses follow B2 = 1.43 at RT and B2 = 1.33 at 300 °C. The results for both steels indicate that the B2 indices at RT are conservative also at higher temperatures and that the correction factor Y for ferritic pipes in Equation (9) is not necessary. However, this statement needs to be confirmed by further investigations. In the FE model the loads are applied as displacements, which makes a separation between the effects of primary and secondary loads impossible. In thin-walled pipes small deformations in the elastic range al-ready lead to buckling. Therefore, the moments from disabled thermal expansion and anchor movements have the same effect in relation to a failure due to (plastic) buckling as the primary moments in Equation (1) and must be taken into account. CONCLUSION
The B2 stress indices of thin-walled straight pipes with D/t-ratios 40 ≤ D/t ≤ 120 are determined using FE analyses. A method for the calculation of the B2 index for thin-walled straight pipes is suggested. The B2 index is calculated using the instability bending moments obtained by nonlinear plastic analyses. The analyses for ideal elastic-plastic (imperfect) pipes give the following results: · Pipes with D/t ≤ 40 fail with a simple kink and symmetrical stress distributions. Pipes with D/t > 40
fail by (plastic) buckling with some wrinkles and (almost) non-symmetrical stress distributions. There is no clearly defined transition between both cases.
· The numerical failure shapes are in a good agreement with the experimental obtained shapes. · The type and size of the imperfection have a considerable influence on the B2 index of thin-walled
straight pipes. A single buckle with an ovality of 1% as imperfection envelops the most cases. · For ideal elastic-plastic pipes with D/t = 100 and a possible technical ovality of 1% the B2 index is 1.42
for a yield stress of 200 MPa and 1.93 for 600 MPa. · The B2 index significantly depends on the D/t ratio, the elastic modulus and the yield stress. The de-
pendence from the D/t ratio is nearly linear with typical slopes from 0.003 to 0.008. Curves for the dependence of B2 on the D/t ratio, the yield stress, and the elastic modulus are given.
The differences between the B2 indices for real and ideal material properties are generally very small and without practical importance. For small D/t ratios the strain hardening has a relevant influence (especially for austenitic pipes) on the B2 index. Future studies will investigate these effects. A comparison of the numerical obtained B2 indices with experimental results indicates an ovality of 0.5%. Final statements are not possible, because the required information about the experiments (e.g. stress-strain curve, measured geometry, detailed experimental setup) is not completely available. For an ovality of 0.5% the obtained values of the B2 index are overall in a good agreement with the values stated in the ASME Code. Some analyses show differences with respect to the temperature dependence. No additional corrections at higher temperatures are necessary if the yield stresses at room temperature are used. This needs to be confirmed by further investigations. It is noted, that the moments from disabled thermal expansion and anchor movements have the same effect in relation to a failure due to (plastic) buck-ling as the primary moments and must be taken into account. Future investigations will use the presented method to calculate the B2 indices for other piping components (e.g. elbows and branch connections).
23rd Conference on Structural Mechanics in Reactor Technology
Manchester, United Kingdom - August 10-14, 2015 Division II
REFERENCES
Abaqus (Version 6.13). Dassault Systèmes Simulia Corp., Providence, RI, USA. ASME Boiler and Pressure Vessel Code (2013). Section III, Division 1. The American Society of Mechan-
ical Engineers. ASTM A 530 / A530 M (2012). “Standard Specification for General Requirements for Specialized Carbon
and Alloy Steel Pipe” Bernauer, G., Brocks, W., Mühlich, U., Steglich, D. and Werwer, M. (1999). “Hinweise zur Anwendung
des GURSON-TVERGAARD-NEEDLEMAN-Modells,“ GKSS/WMG/99/10, Geesthacht. Elchalakani, M., Zhao, X. L. and Grzebieta, R. (2002). “Bending tests to determine slenderness limits for
cold-formed circular hollow sections,” Journal of Constructional Steel Research, 58, pp. 1407-1430. General Electric Report (1978). “Functional capability criteria for essential Mark II piping,” NEDO-21985. KTA 3201.1 (1998-06). “Components of the Reactor Coolant Pressure Boundary of Light Water Reactors;
Part 1: Materials and Product Forms”. Nuclear Safety Standards Commission (KTA), Germany. KTA 3201.2 (2013-11). “Components of the Reactor Coolant Pressure Boundary of Light Water Reactors;
Part 2: Design and Analysis”. Nuclear Safety Standards Commission (KTA), Germany. KTA 3211.2 (2013-11). “Pressure and Activity Retaining Components of Systems Out-side the Primary
Circuit; Part 2: Design and Analysis”. Nuclear Safety Standards Commission (KTA), Germany. Kyriakides, S. and Corona, E. (2007). Mechanics of Offshore Pipelines. Volume I - Buckling and Collapse,
1st Edition, Elsevier, UK. Matzen, V. C. and Tan, Y. (2000). “The History of the B2 Stress Index and a New Margin-Consistent
Procedure for Its Calculation,” 2000 ASME Pressure Vessels and Piping Conference, Seattle, Wash-ington, PVP-Vol. 399, pp. 251-258.
Mutz, A. (2011). “Structural Assessment of Piping Components and Systems in Energy Conversion Facil-ities Considering the Real Material Characteristic,” Dissertation on the Materials Testing Institute, Uni-
versity of Stuttgart. RCC-M (2012). “Design and Conception Rules for Mechanical Components of PWR Nuclear Islands.”
AFCEN, France. Reicherter, B. (2011). “Determination of material behaviour in the low cycle fatigue regime for improved
lifetime assessment,” Dissertation on the Materials Testing Institute, University of Stuttgart. Rodabaugh, E. C. in: Rao, K. R. (2002). Companion guide to the ASME Boiler and Pressure Vessel Code;
criteria and commentary on select aspects of the ASME Boiler & Pressure Vessel and Piping Codes, ASME Press, New York.
Sherman, D. R. (1976). “Tests of circular steel tubes in bending,” Journal of the Structural Division
(ASCE), 102(11), pp. 2181-2195. Timoshenko, S. P. and Gere, J. M. (2013). Theory of Elastic Stability, 2th ed., Dover Publications. Wilkins, J. K. (2002). “Experimental and Analytical Investigation into the Non-Linear Behavior of 2” and
4”, 90°, Large Radius, Schedule 10, Stainless Steel Elbows Under Monotonic, Cyclic and Rate Depend-
ent Loading,” Master Thesis, North Carolina State University. Yu, L., Tan, Y. and Matzen, V. C. (1999). “B2 Stress Indices for Elbows and Straight Pipes Using Finite
Element Analysis,” 15th International Conference on Structural Mechanics in Reactor Technology
(SMiRT-15), Seoul, Korea, IV, pp. 41-48.