“determinants of the efficiency of public spending …§ão de crianças matriculadas em creches...
TRANSCRIPT

“Determinants of the efficiency of Public Spending on Health in Brazilian States”
SANTIAGO
January 26th, 2012

Introduction
Motivation
Literature Review
Methodology
Results
Concluding Remarks
2
Efficiency of Public Spending on Health

Introduction Background:
• The 1998 Constitution established a new political formulation of the health services in the country.
The new system was grounded on three principles: Universality, Integrality and Equity.
• In addition to the those principles, others were created to organize the process. Decentralization
stands out among them.
• In 1990, Law 8.080 linked the decentralization to municipalization.
• In 2000, the Constitutional Amendment Number 29 established how much each Federative
Unit had to invest. The Federal Government is the main financial agent of the public health
network.
• The Amendment was regulated by a Complementary Law in January 2012. The Law states
what can be considered expenses on the health area and what cannot. However, it does not
bring any novelty concerning Deadlines or Sanctions.
3
Efficiency of Public Spending on Health

4
Efficiency of Public Spending on Health
Region
2000 2008 2000 2008 2000 2008 2000 2008
TOTAL 2,89 3,6 1,73 1,61 0,54 0,92 0,62 1,07
Northern Region 4,62 4,92 2,49 1,61 1,59 2,21 0,54 1,11
Northeastern Region 4,65 5,36 3,12 2,29 0,86 1,54 0,68 1,52
Southeastern Region 2,28 2,69 1,17 0,89 0,43 0,75 0,67 1,05
Southern Region 2,29 2,66 1,35 1,15 0,37 0,54 0,57 0,97
Central Region 2,16 2,6 1,25 0,88 0,54 1,04 0,37 0,68
Source: Ministry of Health
1. All expenditures shown were made on public health services and actions.
Table 1: expenditures on public health services and actions in proportion to the total
expenditures/GDP % by Region (in 2000 and 2008)
Total Expenditure
Proportion/GDP
Federal Expenditure
Proportion/GDP
State Expenditure
Proportion/GDP
Municipal Expenditure
Proportion/GDP
Background:
Introduction

Introduction
Public Spending on Health and Intergovernmental Transfers
The Unified Health System (SUS): The Brazilian public healthcare framework
The Constitution and the provision of public healthcare services: States and
Municipalities´ role
The minimum level of spending of each government level: The Constitutional
rule
Transferring resources from central to local governments – The National
Health Fund
5
Efficiency of Public Spending on Health

Introduction
Motivation
Literature Review
Methodology
Results
Concluding Remarks
6
Efficiency of Public Spending on Health
Motivation
Transfers Scheme – How is it related to efficiency?
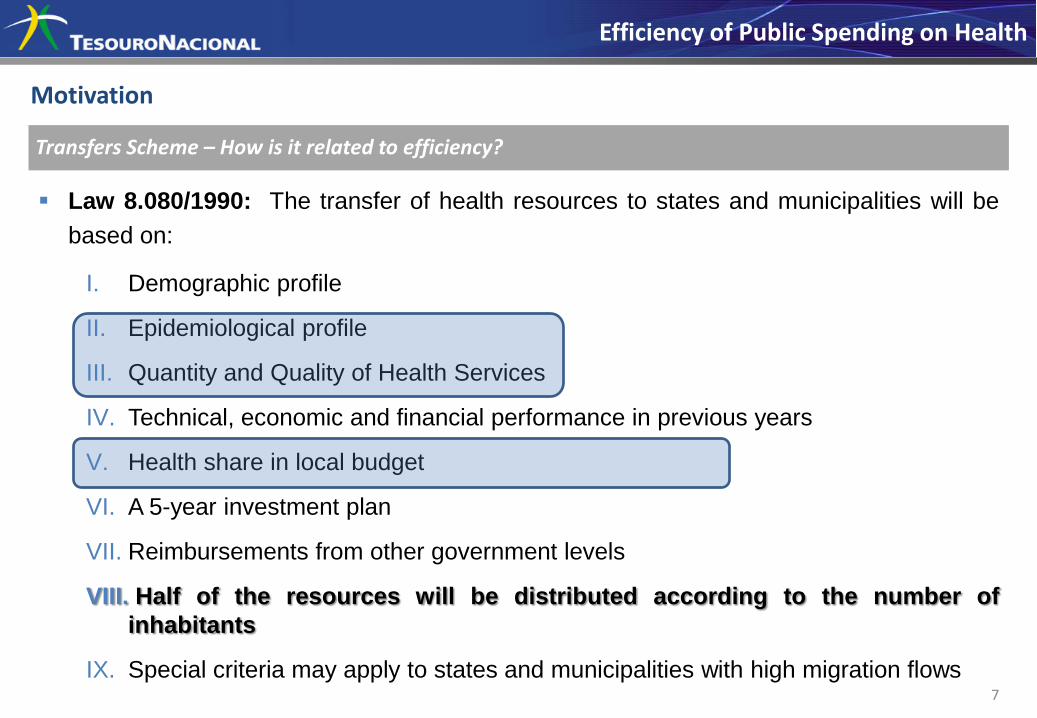
Law 8.080/1990: The transfer of health resources to states and municipalities will be
based on:
I. Demographic profile
II. Epidemiological profile
III. Quantity and Quality of Health Services
IV. Technical, economic and financial performance in previous years
V. Health share in local budget
VI. A 5-year investment plan
VII. Reimbursements from other government levels
VIII. Half of the resources will be distributed according to the number of
inhabitants
IX. Special criteria may apply to states and municipalities with high migration flows 7
Efficiency of Public Spending on Health

Motivation
Public Spending on Health and Intergovernmental Transfers
Based on the criteria listed in the referred law, this paper examines if - and how - the
technical criteria set out in the act 35 of Law 8.080/1990 for the distribution of
resources related to the efficient management of health services in the Federal States.
Therefore, we use a measure of efficiency based on Stochastic Frontier where the
input is public spending on health, whereas health care products are
consultations, hospitalizations, tests and number of beds in the Unified Health
System (SUS) for the period 2000 to 2008.
8
Efficiency of Public Spending on Health

Introduction
Motivation
Literature Review
Methodology
Results
Concluding Remarks
9
Efficiency of Public Spending on Health

Literature Review
Efficiency Measures: The input/output definitions problem
10
Efficiency of Public Spending on Health
Artigo Insumos Produtos Marinho, 2003 Total de Leitos
Total de Hospitais Credenciados
Total da Capacidade Ambulatorial Instalada
Valor médio da Internação
Valor médio dos procedimentos ambulatoriais
Total de Internações em hospitais credenciados
Total de procedimentos ambulatoriais
Faria et al., 2008 Gastos com saúde e saneamento
Gastos com educação
Taxa de alfabetização
Esgotamento Sanitário
Inverso da taxa de mortalidade por causas hídricas
Proporção de crianças matriculadas em creches ou educação infantil
Indicador de Provimento Social
Ferreira et al., 2003 Total das despesas em saúde
Proporção da produção ambulatorial de prestadores
estaduais e federais no total da produção ambulatorial.
Proxy da complexidade do sistema de saúde
Total da produção ambulatorial em atenção básica
Total da produção ambulatorial em média e alta complexidades
Cesconetto et al., 2008 Número de Médicos
Equipe auxiliar de enfermagem
Número de altas geradas para pacientes do SUS
Lins et al., 2007 Número de Funcionários não médicos
Número de médicos
Receita média mensal proveniente do SUS
Número total de Docentes
Número de docentes com doutorado
Índice de Alta complexidade
Relação Internações / Leitos
Relação Cirurgia / Salas
Relação Consultas ambultaroriais / Salas
Número de alunos de medicina (graduação)
Número de residentes médicos
Número de mestrandos e doutorandos
Número de programas de pós-graduação/medicina
Gonçalves et al., 2007 Taxa de mortalidade
Tempo médio de permanência no hospital
Percentuais de internação relativos a neoplasias, doenças infecciosas e parasitárias
(DIP) e doenças do aparelho circulatório.
Valor médio pago pela Autorização de Internação Hospitalar (AIH médio).

Introduction
Motivation
Literature Review
Methodology
Results
Concluding Remarks
11
Efficiency of Public Spending on Health
Methodology
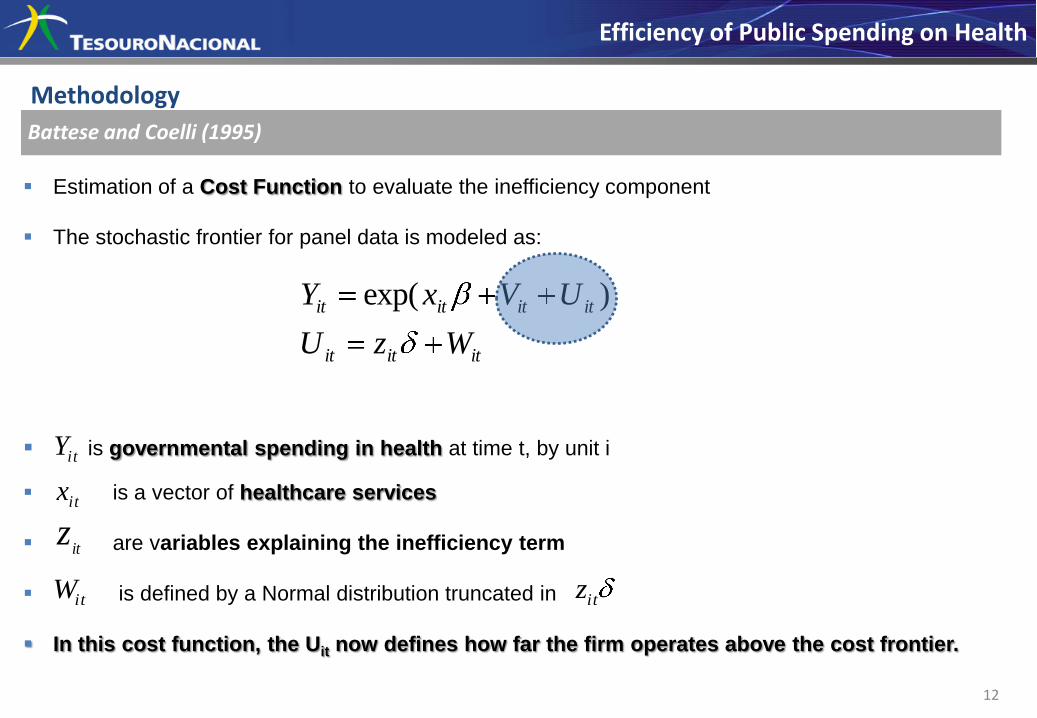
Battese and Coelli (1995)
Estimation of a Cost Function to evaluate the inefficiency component
The stochastic frontier for panel data is modeled as:
is governmental spending in health at time t, by unit i
is a vector of healthcare services
are variables explaining the inefficiency term
is defined by a Normal distribution truncated in
In this cost function, the Uit now defines how far the firm operates above the cost frontier.
12
Efficiency of Public Spending on Health
ititit
itititit
WzU
UVxY )exp(
itY
itx
itz
itW itz

Methodology
Data
»Annual data for 27 states from 2000 to 2008:
»Population
»Urbarnization level
»Elderly population
»Life expectancy at birth
»Illiterate population
»Water supply
»Sewage system
»Garbage collection
»GDP per capita
»Low income population
»AIDS contamination rate
»Dengue fever contamination rate
»Tegumentary Leishmanie contamination
rate
»Hansen s desease contamination rate
»Tuberculosis
13
Efficiency of Public Spending on Health

Methodology
The High Correlation problem
»Methodology based on Principal Components to avoid high correlation between series:
14
Efficiency of Public Spending on Health
Group Variables
PC_Sanitation Water supply, Sewage system, Garbage collection.
PC_Demography Population, Elderly population, Life expectancy at birth.
PC_income GDP per capita, (-)Low income population, (-) Illiterate
population, Urbanization level.
PC_ Epidemic AIDS, Dengue fever, Tegumentary Leishmanie, Hansen s
desease and Tuberculosis contamination rates.

Methodology
The High Correlation problem
Table 3: Correlation structure between groups:
15
Efficiency of Public Spending on Health
Sanitation Demography Income Epidemic
Sanitation 1.000 0.608 0.811 0.728
Demography 0.608 1.000 0.508 0.532
Income 0.811 0.508 1.000 0.503
Epidemic 0.728 0.532 0.503 1.000

Introduction
Motivation
Literature Review
Methodology
Results
Concluding Remarks
16
Efficiency of Public Spending on Health

Results
Table 4: Stochastic Frontier
17
Efficiency of Public Spending on Health
Coefficient Std Deviation P-value
Intercept -6.690 *** 0.770 0.000
Consultation 0.446 *** 0.074 0.000
Beds -0.083 . 0.049 0.086
Pathological examinations 0.286 *** 0.062 0.000
Imaging examinations 0.175 *** 0.050 0.000
Hospitalizations -0.203 * 0.091 0.026
“.” represents significance in 10%; “*” represents significance in 5%; “**” represents significance in 1%;
“***” represents significance in 0.1%.

Results
Table 4: Z-Variables
18
Efficiency of Public Spending on Health
Coefficient Std Deviation P-value
Intercept -1.243 ** 0.417 0.003
PC_Sanitation -0.159 ** 0.056 0.004
PC_Demography -0.927 *** 0.217 0.000
PC_Income 0.309 *** 0.070 0.000
PC_Epidemics[1] -0.142 *** 0.042 0.001
PC_Epidemics[2] -0.123 * 0.049 0.011
Trend 0.062 ** 0.023 0.007
sigmaSq 0.058 *** 0.016 0.000
gamma 0.762 *** 0.082 0.000
Log Likelihood 120.928
Observations 243
Cross Section Units 27
Time Units 9
Average Efficiency 0.893

19
Efficiency of Public Spending on Health
•Concerning Table 4 first part, the signs of the coefficients of the stochastic frontier
are as expected, with the exception of the negative estimate of the number of
hospitalizations and beds variables. It s possible that scale effects are causing noise in
estimating, that is, states that operate in large scale also have more hospital beds. So,
that can interfere in the results. That result is counterintuitive and will be looked into
afterwards.
•Concerning Table 4 second part - the estimated coefficients in the inefficiency
model are of particular interest to this study:
Concerning sanitation, the negative coefficient indicates that an improvement in
the variables related to sanitation such as water supply, sewers and garbage
collection are associated with a decrease in the lack of efficiency in the public
health service.
Results
20
Efficiency of Public Spending on Health
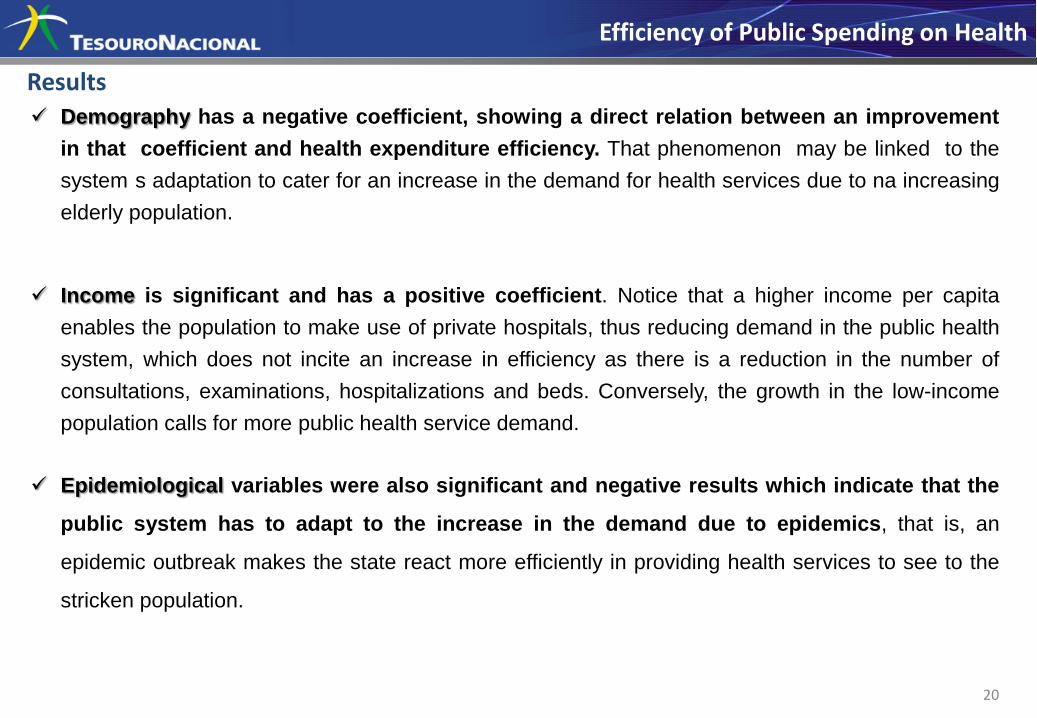
Demography has a negative coefficient, showing a direct relation between an improvement
in that coefficient and health expenditure efficiency. That phenomenon may be linked to the
system s adaptation to cater for an increase in the demand for health services due to na increasing
elderly population.
Income is significant and has a positive coefficient. Notice that a higher income per capita
enables the population to make use of private hospitals, thus reducing demand in the public health
system, which does not incite an increase in efficiency as there is a reduction in the number of
consultations, examinations, hospitalizations and beds. Conversely, the growth in the low-income
population calls for more public health service demand.
Epidemiological variables were also significant and negative results which indicate that the
public system has to adapt to the increase in the demand due to epidemics, that is, an
epidemic outbreak makes the state react more efficiently in providing health services to see to the
stricken population.
Results

Introduction
Motivation
Literature Review
Methodology
Results
Concluding Remarks
21
Efficiency of Public Spending on Health

Concluding Remarks
Public Policies Implications
•Concerning the estimated elasticities, the results show that the increase in the number of
consultations and clinical examinations leads to an augmentation in health expenditure. Furthermore,
we can see that the increase in the health service efficiency is associated with sanitation,
demographic characteristics of the population, level of income and epidemics.
•According to the criteria stablished by Law number 8.080 of 1990 act 35, the increase in the
health service demand makes the state react more efficiently in relation to those target
populations.
•However, the state s reaction does not necessarily entail providing high standards of public
health service. There is the need for research to investigate this topic carefully, using different
methodological approaches.
22
Efficiency of Public Spending on Health

23
Contact: __________________________________________ JANETE DUARTE Fiscal-Economic Research [email protected]
Tel.: +55 (61) 3412-2203
Thank You!
Efficiency of Public Spending on Health