determinants of self-perceived health in iranian children
TRANSCRIPT

Int J Pediatr, Vol.5, N.5, Serial No.41, May 2017 4951
Original Article (Pages: 4951-4964)
http:// ijp.mums.ac.ir
Determinants of Self-Perceived Health in Iranian Children and
Adolescents: the CASPIAN IV Study
, Mohammad Esmaeil 3, Gelayol Ardalan2Moloud Payab ,1, Ramin Heshmat1Hoda Zahedi
, 8bani, *Mostafa Qor7, Ali Asghar Ahmadishokouh6, Hamid Asayesh5, Gita Shafiee4Motlagh19Roya Kelishadi*
1Chronic Diseases Research Center, Endocrinology and Metabolism Population Sciences Institute, Tehran University of
Medical Sciences, Tehran, Iran. 2Obesity and Eating Habits Research Center, Endocrinology and Metabolism Molecular-
Cellular Sciences Institute, Tehran University of Medical Sciences, Tehran, Iran. 3Department of School Health, Bureau of
Population, Family and School Health, Ministry of Health and Medical Education, Tehran, Iran. 4Department of Pediatrics,
Ahvaz Jundishapur University of Medical Sciences, Ahvaz, Iran. 5Endocrinology and Metabolism Research Center,
Endocrinology and Metabolism Clinical Sciences Institute, Tehran University of Medical Sciences, Tehran, Iran. 6Department of Medical Emergencies, Qom University of Medical Sciences, Qom, Iran. 7Department of Applied Linguistics,
Tarbiat Modares University, Tehran, Iran. 8Non-Communicable Diseases Research Center, Alborz University of Medical
Sciences, Karaj, Iran AND Obesity and Eating Habits Research Center, Endocrinology and Metabolism Molecular-Cellular
Sciences Institute, Tehran University of Medical Sciences, Tehran, Iran. 9Department of Pediatrics, Child Growth and
Development Research Center, Research Institute for Primordial Prevention of Non-communicable Disease, Isfahan
University of Medical Sciences, Isfahan, Iran.
Abstract
Background: Health status is an individual’s relative level of wellness and illness. Self-Perceived
Health (SPH) is a single item considered as a health indicator for national and international survey.
The aim of this study was to evaluate the SPH measure and its determinants in a National sample of
Iranian children and adolescents.
Materials and Methods: This National study was performed as the fourth National survey of a
school-based surveillance program entitled the Childhood and Adolescence Surveillance and
Prevention of Adult Non-communicable Disease (CASPIAN-IV) study. 14,880 students aged 6-18
years old selected from 30 provinces of Iran by a multistage Cluster and stratified sampling method.
Two sets of valid and reliable questionnaires were completed for students and their parents.
Results : Overall 13,846 participated in the present study with 90.6 % participation. In this study, 80.5
% of boys and 79.4% of girls reported good SPH (95% confidence interval (CI), 79.3-81.6 versus
78.1-80.6, respectively). According to the living area, 79.5% from urban and 81.1% from rural area
declared good SPH (95% CI, 78.6-80.5 versus 79.2-82.8, respectively). In the multivariate model, the
subjects who had healthy weight compared with excess weight had significantly higher SPH (OR:
1.36; 95% CI, 1.17-1.59). Also, the subjects with high Socio-economic status (SES) had higher odds
of SPH (odds ratio [OR], 1.23; 95% CI, 1.06-1.41).
Conclusion: Our results showed that SPH can be influenced by both demographic and life style
related characteristics among study population. This association was stronger for SPH and academic
success, talking with both parents and having normal body image respectively.
Key Words: Adolescents, Children, Iran, Self-Perceived Health, Wellness.
*Please cite this article as: Zahedi H, Heshmat R, Payab M, Ardalan G, Motlagh ME, Shafiee G, et al.
Determinants of Self-Perceived Health in Iranian Children and Adolescents: the CASPIAN IV Study. Int J
Pediatr 2017; 5(5): 4951-64. DOI: 10.22038/ijp.2017.22735.1904
*Corresponding Author:
Mostafa Qorbani, Non-Communicable Diseases Research Center, Alborz University of Medical Sciences, Karaj,
Iran. AND Roya Kelishadi, Department of Pediatrics, Faculty of Medicine, Isfahan University of Medical
Sciences, Isfahan, Iran.
Email: [email protected] AND [email protected]
Received date: Feb.15, 2017; Accepted date: Mar.22, 2017

Determinants of Self-Perceived Health
Int J Pediatr, Vol.5, N.5, Serial No.41, May. 2017 4952
1- INTRODUCTION
Health status is an individual’s relative
level of wellness and illness often assesses
in the population studies. Self-Perceived
Health (SPH), also called Self-reported
health, Self-assessed health or rated health,
is a single item considered as a health
indicator for national and international
survey (1). It is a potentially useful
measure to assess the perception of one’s
overall health status known as a reliable,
valid and robust measure (2). By using this
summary scale, individuals can rate their
health perception ranging from "very
good" to "very bad"(3). Although, most
widely studies on the use of SPH and its
determining factors have been conducted
on the adults, it has a great potential to
attract more research attention as a valid
and reliable measure among adolescents. It
has shown that SPH is more associated
with multidimensional factors including
personal, environmental, psychological,
socio-behavioral and lifestyle factors in
adolescents while in adults, it may reflect
the acute and chronic status (4-6).
The increasing studies regarding the use of
this common measure among adolescents
has shown that the prevalence of poor SPH
is high in this age group due to low
morbidity rates (7). These evidences
suggest that SPH deserves a special
research attention especially among
children and adolescents as an easily
assessed, reliable and valid health
indicator. Furthermore, according to our
knowledge, few evidences exist on the
SPH and its determining factors among
children and adolescents. In addition, the
formation of health status perception
occurred during adolescence (3), and it
may predict the rate of morbidity and
mortality in the future (8, 9). Considering
the importance of SPH, the aim of this
study was to evaluate the SPH measure
and its determining factors in a National
sample of Iranian children and
adolescents.
2- MATERIALS AND METHODS
2-1. Study design and population
This National study was performed as
the fourth National survey of a
school-based surveillance program entitled
the Childhood and Adolescence
Surveillance and Prevention of Adult Non-
communicable Disease (CASPIAN-IV)
study in 2011-2012. The methodology of
this survey has been described by details
previously (10) and, here, the methods of
the present paper will be described.
2-2. Sampling Methods
This study was conducted among 13,486
students aged 6-18 (12.47± 3.36) years old
and included 6,640 girls. The study
population selected from 30 provinces of
Iran (48 clusters of 10 students in each
province) from urban and rural area in
three levels of elementary, intermediate
and high school students by a multistage
cluster and stratified sampling method.
Stratification was conducted according to
school grade and residential area (urban
and rural) proportional to size and with
equal sex ratio.
2-3. Measuring tools: validity and
reliability
The World Health Organization Global
School-based Health Survey questionnaire
in Persian (10), consisted of two sets of
valid and reliable questionnaires, were
completed for students and their parents.
The students’ one included life
satisfaction, current and passive smoking,
body image, Body Mass Index (BMI),
physical activity and so on. SPH and its
determinants were assessed by questions
shown in Table.1. In order to calculate the
BMI, weight and height of the students
were measured by school health
professionals with an accuracy of 0.1 kg

Zahedi et al.
Int J Pediatr, Vol.5, N.5, Serial No.41, May 2017 4953
and 0.1 cm respectively. World Health
Organization (WHO) standards were used
to define the categorization of BMI:
Underweight (< 5th percentile), healthy
weight (5th- 85th percentile), overweight
(85th- 95th percentile) or obese (> 95th
percentile) (11).
In addition, the questionnaire of the
parents was comprised of concern such as
family history, place of living, family size
and birth order. All of the questions were
asked by trained personnel in a suitable
location and atmosphere at schools. Also,
this procedure was conducted and
controlled by a skilled team.
2.5-Ethical consideration
This study was approved by ethical
committee of Tehran and Isfahan
university of Medical Sciences. All of the
subjects received an explanation of the
study and signed the informed consent.
There were no obligation for participation
in this study and all of the subjects were
volunteers (ID number: 188092).
2-6. Inclusion and exclusion criteria
All students aged 6-18 years old with
Iranian nationality (having Iranian identity
card) were eligible to include in this study.
Having a chronic disease, history of
chronic medication consumption and
obtaining from a special diet were
considered as exclusion criteria. In
addition, participants with full missing
data were excluded.
2-7. Statistical analysis
The statistical analysis was performed
using STATA package (state statistical
software: Release 12, STATA Corporation
2011, College Station, TX, USA). The
quantitative variables were presented as
mean and standard deviation (SD) and the
qualitative variables as number and
percentage. The analysis of categorical
data was done using the Chi-square test. A
multivariate logistic regression was used to
assess the most determinants of SPH. P <
0.05 was considered as statistically
significant.
Table-1: Questions used to screen SPH and its determinants according to Global School-based
Student Health Survey questionnaires(11)
Response Variables
Excellent (considered as good)
Good (considered as good)
Moderate (considered as poor)
Bad (considered as poor)
SPH
What do you think about the overall status of your
health?
0-1 times
2-4 times
5-7 times
Breakfast, lunch and dinner frequency
How often do you eat breakfast in a week?
How often do you eat lunch in a week?
How often do you eat dinner in a week?
Seldom
Weekly
Daily
Fresh fruits (fruits and juices), vegetables, milk and fast
food?
How often do you consume fresh fruits?
How often do you consume vegetables?
How often do you consume milk?
How often do you consume fast food?
0-1 days (considered as mild)
2-4 days (considered as moderate)
5-7 days (considered as high)
Physical activity
How many days in the last week, have you had a 30
minutes
Physical activity?
≤ 2 hours
>2 hours
Watching Television and uses the computer
How much time do you spend watching television in

Determinants of Self-Perceived Health
Int J Pediatr, Vol.5, N.5, Serial No.41, May. 2017 4954
your free times (every day and weekend)?
How much time do you spend on a computer in your
free times (every day and weekend)?
Very thin (considered as thin)
Slightly thin (considered as thin)
Normal size (considered as normal)
Slightly obese (considered as overweight)
Obese (considered as overweight)
Body image
How do you think about your size?
More than once per day (considered as daily)
Once per day (considered as daily)
At least once per week (considered as nondaily)
Only once per week (considered as nondaily)
Less than once per week (considered as nondaily)
Never (considered as nondaily)
Tooth brushing Frequency
How often do you brush your teeth?
Yes
No
Depression
During the past 12 months, did you ever feel sad or
hopeless?
Yes
No
Anxiety
During the past 6 month, how often did you experience
Anxiety, so that you could not perform your daily
activities?
Yes
No
Passive smoking
Have you ever used any tobacco products?
Yes
No
Current smoking
Are you currently using any tobacco products?
3- RESULTS
Overall 13,846 out of 14,880 students
(90.6%) participated in the present study.
The subjects of this study consisted of
13,846 students (49.2% girls) selected
from urban (75.6%), and rural (24.4%)
areas. The mean age of the participants
was 12.47±3.36 years without significant
differences between boys (12.36±3.40)
and girls (12.58±3.32).
The association of demographic
characteristics with SPH according to level
of education is presented in Table.2
(please see the end of paper). There was a
significant association between the
demographic characteristics and good SPH
(P< 0.05) except for gender, living area
and spent time with friends in total
population.
As presented, 80.5 % of boys and 79.4%
of girls reported good SPH (95% CI, 79.3-
81.6 versus 78.1-80.6, respectively).
According to the living area, 79.5% from
urban and 81.1% from rural area declared
good SPH (95% CI, 78.6-80.5 versus 79.2-
82.8, respectively). Table.3 (please see the
end of paper) shows the association of life
style related characteristics with SPH
according to the level of education. As the
table shows, there is significant association
between all of the life style related
characteristics and good SPH (P< 0.05).
There were significant association between
good SPH and daily consumption of
breakfast, lunch and dinner (P<0.001).
The association between life style and
demographic characteristics with good
SPH (odds ratio [OR] and 95% confidence
interval [CI]) in a multivariate logistic
regression analysis is shown in Table.4
(please see the end of paper).
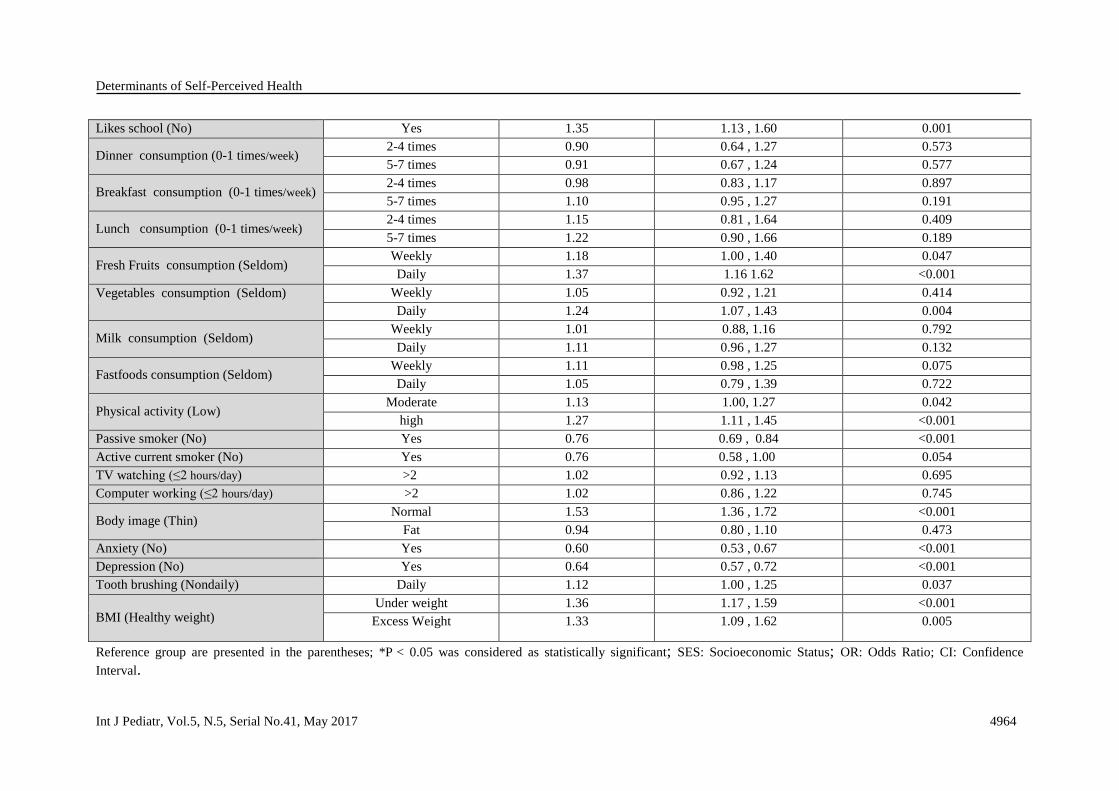
In the multivariate model, the subjects who
had healthy weight compared with excess
weight had significantly higher SPH (OR:
1.36; 95% CI, 1.17-1.59). Also, the
subjects with high SES had higher odds of
SPH (OR, 1.23; 95% CI, 1.06-1.41), that
means those with higher socio-economic

Zahedi et al.
Int J Pediatr, Vol.5, N.5, Serial No.41, May 2017 4955
status had significantly higher SPH.
Among the life style related
characteristics, academic success (OR,
2.02; 95% CI, 1.82- 2.24), talking with
both parents (OR, 1.42; 1.21-1.67) and
having normal body image (OR, 1.53;
95% CI, 1.36-1.72) exhibited the strongest
association respectively, so that students
with academic success, ability to talking
with their parents easily and having
favorable body image had better SPH.
4- DISCUSSION
We aimed to identify the determinants
of SPH among Iranian children and
adolescents. We found in the present study
that self-rated health can be influenced by
both demographic and life style related
characteristics among study population.
This association is stronger for SPH and
academic success, talking with both
parents and having normal body image
respectively. SPH can be recognized as a
predictor of morbidity and mortality (12,
13). Our results are in line with the
previous studies in which demographic
characteristics are associated with SPH (6,
14). In this study, boys (80.0%) are more
likely to report having good SPH than girls
(79.4%). Similar to the findings of the
present study, gender differences in SPH
were also observed in previous studies
(15-17). SES is an important predictor of
SPH. The results of this study revealed
that subjects who have had a good SES,
were reported to have 23% higher score of
SPH than those who had poor SES. In
another study, 78% of adolescents with
good SES were reported to have
good/excellent SPH, compared to those
with poor SPH (17). Other studies have
also concluded that SPH is strongly
associated with SES (6). Among
demographics characteristics, the
academic success variable has the greatest
influence on SPH, that is, subjects who
reported success were more likely to report
good SPH (OR:2.02, 95%CI: 1.82-2.24).
In this study, living with parent and having
dialogue with them were strongly
associated with good SPH. Finding of
studies among Pakistani and Brazilian
adolescents have shown that strong family
support reduces the risk of poor SPH.
Thus, Family support is important for
physical and mental health throughout
adolescence (6, 18). The results of this
study showed that subjects who consumed
more meals during the week (5-7 times per
week), were found to enjoy better SPH
than those who had consumed 0-1 times.
Therefore, missing a meal was
significantly suggestive of poor SPH. In
addition, the consumption of fruits and
vegetables during the day (every day) was
associated with good SPH. Subjects with
the level of fruit intake (OR: 1.37; 95% CI,
1.16-1.62), and vegetables intake (OR:
1.24; 95% CI, 1.07-1.43) had significantly
higher odds ratio of reporting good SPH.
Other studies have also shown that lack of
fruit consumption during the week was
related to poor SPH (19).
Physical activity is a very important factor
influencing SPH among children and
adolescents. Physical activity is positively
associated with SPH (7, 19-21). Our study
showed that students with higher and
moderate physical activity were 1.27 and
1.34 times more in good SPH, respectively
than those with mild physical activity.
Also, among subjects, those who watched
television and worked with computer less
than two hours during the day, were found
to be in better SPH than those who spend
more time there (≥ 2h). On the same basis,
other studies have confirmed an
association of physical inactivity in
adolescents with lower levels of SPH (22).
Elinder et al., have shown that >4h of
physical activity per week was an
important factor in improving SPH (23).
More interestingly, some studies have
indicated that the effect of physical
activity on SPH can even be observed at
lower levels of physical activity and

Determinants of Self-Perceived Health
Int J Pediatr, Vol.5, N.5, Serial No.41, May. 2017 4956
increases with activity intensity (24).
Those who spent more time watching TV
are more likely to report poor SPH (19).
Our findings also support the significant
association between body image and
SPH.In their study, Sharma et al., observed
no significant association for perceived
body weight and SPH, and showed that
being overweight or underweight are not
considered as risk factors of poor SPH
(19). However, other studies supported our
finding and have shown that perceived
weight status has an influence on SPH (25,
26). Among subjects who enjoyed an
appropriate level of BMI, the levels of
SPH was higher than those who were
underweight and overweight. Students
with healthy BMI were 1.36 times more in
good SPH than those underweight.
Meireles et al., achieved similar results as
of ours. As well, according to other
studies, a higher BMI influences the SPH
(27). Our results support previous finding
confirming that depression and anxiety
have a strong influence on SPH.
Depression and anxiety have been proved
to be an important risk factor against good
SPH among children and adolescents (OR:
0.64; 95% CI: 0.57-0.72 and OR: 0.60;
95% CI: 0.53-0.67) (15, 28).
4-1. Limitation and Strengths
There were some strengths and limitations
which should be considered. One of the
main strengths of the present study is that
most studies have focused on elderly or
adults, but this study is the first study
conducted on children and adolescents
with a large National sample size. The
cross sectional design of the present study
seems to be the main limitation of this
study; therefore follow up surveys are
need.
5- CONCLUSION
In conclusion, our study provides some
evidence regarding the determinants of
self-perceived health in children and
adolescents. Being male, SES, smoking,
family support, academic success,
consumption of fruits and vegetables,
physical activity, body image, and BMI
significantly influenced SPH.
Interventions that focus on providing fruits
and vegetables, increasing physical
activity, and strengthening family support
may contribute to improve SPH among in
children and adolescents. The risk factors
examined in this study were found to not
only have an impact on SPH throughout
adolescence, but also were shown to have
long-term implications for health in
adulthood. An understanding of these
factors can not only remove the
individuals concerns but also may provide
the health care system with the insight to
deal with the consequences.
6- CONFLICT OF INTEREST
The authors declared no conflict of
interest.
7- ACKNOWLEDGMENT
The authors would like to thank all
students participated in this survey and
their parents, the school staffs, data
collectors, executive team, research
scientists and all relevant administrators.
8- REFERENCES
1. Boardman JD. Self-rated health among
U.S. adolescents. J Adolesc Health.
2006;38(4):401-8.
2. Idler EL, Benyamini Y. Self-rated health
and mortality: a review of twenty-seven
community studies. J Health Soc Behav
1997;38(1):21-37.
3. Meireles AL, Xavier CC, de Souza
Andrade AC, Proietti FA, Caiaffa WT. Self-
Rated Health among Urban Adolescents: The
Roles of Age, Gender, and Their Associated
Factors. PLoS One 2015;10(7):e0132254.
4. Vingilis E, Wade TJ, Adlaf E. What factors
predict student self-rated physical health? J
Adolesc 1998;21(1):83-97.

Zahedi et al.
Int J Pediatr, Vol.5, N.5, Serial No.41, May 2017 4957
5. Page RM, Suwanteerangkul J. Self-rated
health, psychosocial functioning, and health-
related behavior among Thai adolescents.
Pediatr Int 2009;51(1):120-5.
6. Meireles AL, Xavier CC, Proietti FA,
Caiaffa WT. Influence of individual and socio-
environmental factors on self-rated health in
adolescents. Rev Bras Epidemiol
2015;18(3):538-51.
7. Breidablik HJ, Meland E, Lydersen S. Self-
rated health in adolescence: a multifactorial
composite. Scand J Public Health
2008;36(1):12-20.
8. Idler EL, Russell LB, Davis D. Survival,
functional limitations, and self-rated health in
the NHANES I Epidemiologic Follow-up
Study, 1992. First National Health and
Nutrition Examination Survey. Am J
Epidemiol 2000;152(9):874-83.
9. Benyamini Y. Why does self-rated health
predict mortality? An update on current
knowledge and a research agenda for
psychologists. Psychol Health
2011;26(11):1407-13.
10. Kelishadi R, Ardalan G, Qorbani M, Ataie-
Jafari A, Bahreynian M, Taslimi M, et al.
Methodology and Early Findings of the Fourth
Survey of Childhood and Adolescence
Surveillance and Prevention of Adult Non-
Communicable Disease in Iran: The
CASPIAN-IV Study. International journal of
preventive medicine 2013;4(12):1451-60.
11. Centers for Disease Control and Prevention
(CDC); 2009. [Last accessed on 2013 Aug 21].
Global School-based Student Health Survey.
Available at: http://www.cdc.gov/GSHS.
12. Abdulrahim S, El Asmar K. Is self-rated
health a valid measure to use in social
inequities and health research? Evidence from
the PAPFAM women's data in six Arab
countries. Int J Equity Health 2012;11:53.
13. Manor O, Matthews S, Power C. Self-rated
health and limiting longstanding illness: inter-
relationships with morbidity in early
adulthood. International Journal of
Epidemiology 2001;30(3):600-7.
14. Heard HE, Gorman BK, Kapinus CA.
Family structure and self-rated health in
adolescence and young adulthood. Population
Research and Policy Review 2008;27(6):773-
97.
15. Erginoz E, Alikasifoglu M, Ercan O, Uysal
O, Ercan G, Albayrak Kaymak D, et al.
Perceived health status in a Turkish adolescent
sample: risk and protective factors. Eur J
Pediatr 2004;163(8):485-94.
16. Jerden L, Burell G, Stenlund H, Weinehall
L, Bergstrom E. Gender differences and
predictors of self-rated health development
among Swedish adolescents. J Adolesc Health
2011;48(2):143-50.
17. Tremblay S, Dahinten S, Kohen D. Factors
related to adolescents' self-perceived health.
Health Rep. 2003;14 (Suppl):7-16.
18. Afridi AA, Motwani K, Khawaja S, Khoja
AA, Fatmi Z, Azam I, et al. Self-perceived
health among school going adolescents in
Pakistan: influence of individual, parental and
life style factors? Glob J Health Sci.
2013;5(4):71-8.
19. Sharma B, Nam EW, Kim D, Yoon YM,
Kim Y, Kim HY. Role of gender, family,
lifestyle and psychological factors in self-rated
health among urban adolescents in Peru: a
school-based cross-sectional survey. BMJ
Open 2016;6(2):e010149.
20. Piko BF. Self-perceived health among
adolescents: the role of gender and
psychosocial factors. Eur J Pediatr
2007;166(7):701-8.
21. Vingilis ER, Wade TJ, Seeley JS.
Predictors of adolescent self-rated health.
Analysis of the National Population Health
Survey. Can J Public Health 2002;93(3):193-7.
22. Aarnio M, Winter T, Kujala U, Kaprio J.
Associations of health related behaviour,
social relationships, and health status with
persistent physical activity and inactivity: a
study of Finnish adolescent twins. Br J Sports
Med 2002;36(5):360-4.
23. Elinder LS, Sundblom E, Rosendahl KI.
Low physical activity is a predictor of thinness
and low self-rated health: gender differences
in a Swedish cohort. J Adolesc Health
2011;48(5):481-6.
24. Dyremyhr AE, Diaz E, Meland E. How
adolescent subjective health and satisfaction

Determinants of Self-Perceived Health
Int J Pediatr, Vol.5, N.5, Serial No.41, May. 2017 4958
with weight and body shape are related to
participation in sports. J Environ Public Health
2014;2014:851932.
25. Herman KM, Hopman WM, Rosenberg
MW. Self-rated health and life satisfaction
among Canadian adults: associations of
perceived weight status versus BMI. Qual Life
Res 2013;22(10):2693-705.
26. Meland E, Haugland S, Breidablik HJ.
Body image and perceived health in
adolescence. Health Educ Res 2007;22(3):342-
50.
27. Meireles AL, Xavier CC, Proietti FA,
Caiaffa WT. Influence of individual and socio-
environmental factors on self-rated health in
adolescents. Revista Brasileira de
Epidemiologia 2015;18(3):538-51.
28. PIKÓ B, BARABÁS K, BODA K.
Frequency of common psychosomatic
symptoms and its influence on self-perceived
health in a Hungarian student population. The
European Journal of Public Health
1997;7(3):243-7.

Zahedi et al.
Int J Pediatr, Vol.5, N.5, Serial No.41, May 2017 4959
Table-2: Association of demographic characteristics with good self-perceived health according to level of education: the CASPIAN IV study
Total High school Middle school Elementary school
Category
Variables -P
*value 95% CI Percent
P- *value
95% CI Percent -P
*value 95% CI Percent
-P*value
95% CI Percent
0.19 79.3,81.6 80.5
0.16 74.6,79.0 76.9
0.37 73.4,78.7 76.2
0.44 83.1,86.1 84.7 Male
Gender 78.1,80.6 79.4 72.5,76.8 74.7 71.9,77.0 74.5 83.8,87.0 85.5 Female
0.15 78.6,80.5 79.5
0.31 74.4,77.6 76.0
0.23 73.9,77.9 76.0
0.22 83.2, 85.9 84.6 Urban
Living area 79.2,82.8 81.1 68.9,77.9 73.6 69.0,77.2 73.3 84.0,87.9 86.1 Rural
0.001 80.5,82.7 81.6
0.001 76.3,80.8 78.6
0.28 73.7,78.4 76.1
0.27 84.2,86.8 85.5 ≤ 4
Family size 77.1,79.4 78.3 71.9,75.9 74.0 72.0,76.8 74.5 82.8,86.0 84.5 > 4
0.001
71.7,83.7 78.3
0.01
59.2,81.5 71.7
0.61
57.6,86.1 74.4
0.05
74.9,90.8 84.5 None of
them
Living with
parents 69.2,76.5 73.0 61.2,74.1 68.0 65.1,78.2 72.1 72.8,84.3 79.2
One of
them
79.4,81.2 80.3 74.8,78.0 76.4 73.5,77.3 75.5 84.2,86.4 85.3 Both of
them
0.02
79.6,81.9 80.7
0.52
73.2,78.1 75.7
0.53
74.1,79.0 76.6
0.39
83.7,86.4 85.2 First
Birth order
79.2,81.9 80.6 74.7,80.2 77.5 71.4,77.0 74.3 84.1,87.6 86.0 Second
76.5,80.5 78.6 71.4,78.9 75.3 70.0,78.4 74.4 80.3,85.8 83.3 Third
76.1,79.9 78.1 71.3,77.5 74.5 70.5,78.3 74.6 81.7,87.4 84.8 Forth or
more
0.001 70.5,74.6 72.6
0.001 76.0,79.5 77.8
<0.001 75.3,79.1 77.2
0.15 84.1,86.4 85.3 Yes
Talk with their
mothers facing
problems 80.4,82.1 81.3 65.8,72.4 69.2 60.4,68.5 64.6 80.1,86.0 83.2 No
0.001
83.2,85.2 84.2
0.001
79.9,84.0 82.0
0.001
77.3,81.9 79.7
0.001
85.6,88.2 86.9 Yes Talk with their
fathers facing
problems 74.6,76.9 75.8 69.8,73.7 71.8 69.7,74.3 72.0 80.5,83.9 82.3
No
0.001 75.7,78.8 77.3
0.001 66.4,72.3 69.4
0.001 66.7,73.5 70.2
0.13 83.1,86.8 85.1 Weak SES
78.5,81.1 79.8 72.9,78.2 75.6 73.3,78.8 76.2 82.3,85.7 84.1 Moderate

Determinants of Self-Perceived Health
Int J Pediatr, Vol.5, N.5, Serial No.41, May 2017 4960
* P < 0.05 was considered as statistically significant; SES: Socioeconomic Status; CI: Confidence Interval.
81.8,84.4 83.1 78.5,83.3 81.0 77.4,82.5 80.1 84.7,88.3 86.6 Good
0.001
80.8,82.6 81.7
0.001
76.1,79.4 77.8
0.001
75.3,79.3 77.4
0.001
85.0,87.3 86.2 Yes Feel accepted by
peers 69.7,73.5 71.7 64.5,71.3 68.0 63.8,
71.4 67.7 75.2,80.8 78.1 No
0.001 84.2,85.9 85.1
0.001 79.5,83.1 81.4
0.001 79.7,83.5 81.7
0.001 87.2,89.2 88.2 Yes Academic success
by teacher 66.8,69.9 68.4 66.0,70.8 68.5 60.9,66.8 63.9 70.0,75.4 72.8 No
0.001 80.0,81.7 80.8
0.001 75.3,78.5 76.9
0.001 74.3,78.2 76.3
0.001 84.3,86.5 85.4 Yes
Likes school 65.4,71.1 68.3 63.9,72.2 68.2 58.7,69.4 64.2 68.0,79.1 73.9 No
0.80
78.4,80.9 79.6
0.43
72.5,77.1 74.9
0.96
72.8,77.9 75.4
0.88
83.5,86.9 85.3 0 days Days spent time
with friends 78.9,81.3 80.2 74.5,78.9 76.8 72.4,77.4 75.0 83.3,86.5 85.0 1-3 days
77.7,81.6 79.7 70.9,78.5 74.9 70.8,79.3 75.3 81.9,86.9 84.6 >3 days
0.001
77.2,79.7 78.5
0.009
71.0,75.8 73.5
0.25
71.5,76.8 74.2
0.17
82.5,85.8 84.2 ≤ 2 friends
Number of close
friends 79.9,81.9
80.9 75.4,79.2 77.3 73.7,78.2 76.1 84.2,86.9 85.6 >3 friends

Zahedi et al.
Int J Pediatr, Vol.5, N.5, Serial No.41, May 2017 4961
Table- 3: Association of life style variables with good self-perceived health according to the level of education: the CASPIAN IV study
Total High school Middle school Elementary school Category
Life style
P value* 95% CI Percent P value* 95% CI Percent P value* 95% CI Percent P value* 95% CI Percent
<0.001
71.5,75.2 73.4
<0.001
76.3,80.0 70.2
<0.001
63.9,71.2 67.7
<0.001
78.2,83.9 81.2 0-1 times Breakfast
frequency
in week
74.5,78.8 76.7 70.5,77.6 74.2 67.5,76.8 72.4 78.5,84.7 81.8 2-4 times
81.4,83.3 82.4 67.1,73.0 78.2 76.4,80.5 78.5 85.1,87.4 86.3 5-7 times
<0.001
62.6,73.2 68.2
<0.001
53.1,72.3 63.2
0.02
57.7,74.0 66.3
0.002
66.1,84.1 76.2 0-1 times Lunch
frequency
in week
70.6,76.8 73.8 64.0,75.3 69.9 66.8,77.0 72.2 74.0,84.2 79.6 2-4 times
79.8,81.6 80.7 75.1,78.3 76.7 74.1,78.0 76.1 84.3,86.5 85.5 5-7 times
<0.001
69.0,77.8 73.6
0.01
66.7,79.5 73.6
0.12
59.3,76.7 68.6
0.04
70.0,85.7 78.9 0-1 times Dinner
frequency
in week
71.4,76.9 74.2 65.7,74.6 70.3 67.4,77.4 72.7 76.8,85.6 81.6 2-4 times
79.7,81.5 80.6 74.9,78.3 76.6 73.9,77.8 75.9 84.2,86.4 85.3 5-7 times
<0.001
68.9,74.1 71.6
<0.001
60.4,69.3 65
<0.001
60.4,70.9 65.8
0.002
76.8,83.6 80.4 Seldom Consume
fresh
fruits
(fruits and
juices)
76.7,79.5 78.2 69.4,74.7 72.1 69.7,75.7 72.8 83.3,86.6 85 Weekly
81.6,83.6 82.6 78.2,81.8 80.1 76.6,81.0 78.9 84.7,87.4 86.1 Daily
<0.001
73.8,77.6 75.8
<0.001
68.4,75.5 72.1
<0.001
64.1,72.1 68.2
<0.001
80.0,85.0 82.6 Seldom Consume
vegetables 77.7,80.1 78.9 72.0,76.4 74.2 71.4,76.4 73.9 82.6,85.6 84.2 Weekly
82.0,84.3 83.2 77.3,81.8 79.6 77.6,82.3 80 85.7,88.9 87.4 Daily
<0.001
71.1,74.7 73
0.001
69.8,74.9 72.4
<0.001
66.2,73.2 69.8
<0.001
74.8,81.5 78.3 Seldom Consume
milk 77.8,80.5 79.2 73.8,78.8 76.4 71.6,77.2 74.5 82.3,86.0 84.2 Weekly
82.4,84.6 83.5 76.4,81.6 79.1 76.6,81.5 79.2 85.2,87.9 86.6 Daily

Determinants of Self-Perceived Health
Int J Pediatr, Vol.5, N.5, Serial No.41, May 2017 4962
0.04
79.3,81.2 80.3
0.38
74.0,77.6 75.9
0.05
72.3,76.6 74.5
0.08
84.4,86.7 85.6 Seldom
Consume
Fast foods 77.9,80.9 79.5 73.7,78.8 76.3 75.0,81.1 78.2 80.7,85.2 83.1 Weekly
70.6,79.5 75.3 63.9,78.0 71.5 59.7,78.2 69.7 78.3,91.0 85.8 Daily
<0.001
74.5,77.3 75.9
<0.001
70.2,74.8 72.5
0.001
68.7,74.8 71.8
0.001
80.2,84.3 82.3 Low
Physical
activity
79.3,81.8 80.6 74.9,79.5 77.3 72.5,78.0 75.4 83.5,86.8 85.2 Moderate
82.4,85.1 83.8 77.7,83.4 80.7 76.4,81.9 79.3 85.3,88.7 87.1 High
<0.001 80.1,82.3 81.2
0.51 73.9,78.5 76.3
0.74 73.0,78.1 75.6
0.06 84.5,87.2 85.9 ≤ 2 Watches
Television
(hours/day) 77.6,79.8 78.7 73.6,77.2 75.4 72.9,77.3 75.1 82.5,85.6 84.1 >2
0.03 79.2,81.0 80.1
0.94 73.9,77.3 75.7
0.48 73.0,76.9 75
0.12 84.0,86.3 85.2 ≤ 2 Uses the
computer
(hours/day) 75.0,79.7 77.4 72.1,79.2 75.8 71.9,80.9 76.7 76.7,85.9 81.7 >2
<0.001 59.3,69.6 64.6
<0.001 57.2,69.4 63.5
0.007 46.7,71.9 60
0.18 61.7,88.0 77.5 Yes Current
smoking 79.5,81.2 80.3 75.1,78.2 76.7 73.6,77.3 75.5 84.0,86.2 85.1 No
<0.001 74.6,77.1 75.8
<0.001 70.5,75.0 72.8
<0.001 68.0,73.4 70.8
<0.001 79.1,82.6 80.9 Yes Passive
smoking 82.2,84.2 83.2 76.8,80.7 78.8 76.5,80.8 78.7 86.9,89.3 88.2 No
<0.001
75.1,78.0 76.6
<0.001
64.6,70.6 67.7
<0.001
66.3,73.0 69.8
<0.001
81.4,84.7 83.1 Thin
Body image 83.7,85.7 84.7 80.6,84.3 82.5 79.6,83.7 81.7 86.6,89.3 88 Normal
72.1,75.8 74 68.2,74.5 71.4 65.4,72.5 69.1 78.2,83.8 81.2 Overweight
<0.001 80.6,82.6 81.6
0.01 75.1,78.7 77
<0.001 75.2,79.4 77.3
<0.001 85.9,88.3 87.2 Daily Tooth
brushing
Frequency 75.1,77.9 76.5 70.3,75.8 73.1 68.0,73.7 71 79.1,82.9 81.1 Non daily

Zahedi et al.
Int J Pediatr, Vol.5, N.5, Serial No.41, May 2017 4963
<0.001
72.8,77.2 75.1
0.002
63.1,72.6 68.1
0.01
66.5,75.3 71.1
0.001
77.1,83.0 80.2 Underweight
Body mass
index 80.2,82.2 81.2 74.8,78.4 76.7 74.8,79.0 77 85.0,87.5 86.3 Healthy
77.1,80.4 78.8 72.9,79.1 76.1 69.5,76.2 73 82.1,86.7 84.6 Excess wight
<0.001 65.9,69.5 67.7
<0.001 63.7,69.2 66.5
<0.001 60.0,67.2 63.7
<0.001 70.2,76.7 73.6 Yes
Depression 82.2,84.0 83.1 78.3,81.7 80.1 76.7,80.6 78.7 85.7,87.8 86.8 No
<0.001
66.6,69.9 68.3
<0.001
64.5,69.7 67.1
<0.001
63.3,69.9 66.7
<0.001
68.7,74.7 71.8 Yes
Anxiety 83.0,84.7 83.8 79.1,82.5 80.9 76.9, 80.9 79 86.3,88.5 87.4 No
*P < 0.05 was considered as statistically significant
Table- 4: Association of life style and demographic characteristics with good self-perceived health in multivariate logistic regression analysis: the
CASPIAN IV study
Characteristics Category OR 95% CI *value-P
Level of education (Elementary school) Middle school 0.74 0.65 , 0.84 <0.001
High school 0.92 0.80, 1.06 0.289
Family size (≤4) >4 0.89 0.79 , 1.00 0.054
Living with Parents (None of them) One of them 0.58 0.33 , 1.03 0.065
Both of them 0.81 0.50 , 1.30 0.390
Birth order (First)
Second 1.06 0.93 , 1.20 0.347
Third 1.00 0.84 , 1.17 0.999
Fourth or more 1.22 1.04 , 1.43 0.012
SES (Weak) Moderate 1.08 0.95 , 1.23 0.194
Good 1.23 1.06 , 1.41 0.004
Talk with parents (None of them) One of them 1.17 1.00 , 1.36 0.042
Both of them 1.42 1.21 , 1.67 <0.001
Feel accepted by peers (No) Yes 1.30 1.15 , 1.47 <0.001
Academic success (No) Yes 2.02 1.82 , 2.24 <0.001
Determinants of Self-Perceived Health
Int J Pediatr, Vol.5, N.5, Serial No.41, May 2017 4964
Reference group are presented in the parentheses; *P < 0.05 was considered as statistically significant; SES: Socioeconomic Status; OR: Odds Ratio; CI: Confidence
Interval.
Likes school (No) Yes 1.35 1.13 , 1.60 0.001
Dinner consumption (0-1 times/week) 2-4 times 0.90 0.64 , 1.27 0.573
5-7 times 0.91 0.67 , 1.24 0.577
Breakfast consumption (0-1 times/week) 2-4 times 0.98 0.83 , 1.17 0.897
5-7 times 1.10 0.95 , 1.27 0.191
Lunch consumption (0-1 times/week) 2-4 times 1.15 0.81 , 1.64 0.409
5-7 times 1.22 0.90 , 1.66 0.189
Fresh Fruits consumption (Seldom) Weekly 1.18 1.00 , 1.40 0.047
Daily 1.37 1.16 1.62 <0.001
Vegetables consumption (Seldom)
Weekly 1.05 0.92 , 1.21 0.414
Daily 1.24 1.07 , 1.43 0.004
Milk consumption (Seldom) Weekly 1.01 0.88, 1.16 0.792
Daily 1.11 0.96 , 1.27 0.132
Fastfoods consumption (Seldom) Weekly 1.11 0.98 , 1.25 0.075
Daily 1.05 0.79 , 1.39 0.722
Physical activity (Low) Moderate 1.13 1.00, 1.27 0.042
high 1.27 1.11 , 1.45 <0.001
Passive smoker (No) Yes 0.76 0.69 , 0.84 <0.001
Active current smoker (No) Yes 0.76 0.58 , 1.00 0.054
TV watching (≤2 hours/day) >2 1.02 0.92 , 1.13 0.695
Computer working (≤2 hours/day) >2 1.02 0.86 , 1.22 0.745
Body image (Thin) Normal 1.53 1.36 , 1.72 <0.001
Fat 0.94 0.80 , 1.10 0.473
Anxiety (No) Yes 0.60 0.53 , 0.67 <0.001
Depression (No) Yes 0.64 0.57 , 0.72 <0.001
Tooth brushing (Nondaily) Daily 1.12 1.00 , 1.25 0.037
BMI (Healthy weight) Under weight 1.36 1.17 , 1.59 <0.001
Excess Weight 1.33 1.09 , 1.62 0.005