determinants of market participation …ageconsearch.umn.edu/bitstream/243452/2/geoffrey sigei...
TRANSCRIPT

DETERMINANTS OF MARKET PARTICIPATION AMONG SMALL-SCALE
PINEAPPLE FARMERS IN KERICHO COUNTY, KENYA
GEOFFREY KIPROTICH SIGEI
A Thesis Submitted to Graduate School in Partial Fulfillment for the Requirement for
the Master of Science Degree in Agricultural and Applied Economics of Egerton
University
EGERTON UNIVERSITY
MAY, 2014

ii
DECLARATION AND APPROVAL
DECLARATION
I declare that this thesis is wholly my original work and to the best of my knowledge
has not been presented for the award of any degree in this or any other university.
Signature: ...................................... Date …………………………………
Geoffrey Kiprotich Sigei
KM17/3128/11
APPROVAL
This thesis has been submitted to graduate school for examination under our approval
as university supervisors.
Signature: ...................................... Date …………………………………
Dr. Hillary Bett, (PhD)
Department of Agricultural Economics and Agribusiness Management,
Egerton University, Njoro (Kenya)
Signature: ...................................... Date…………………………………
Dr. Lawrence Kibet, (PhD)
Department of Economics,
Egerton University, Njoro (Kenya)

iii
COPYRIGHT
©2013
Geoffrey Sigei
All rights reserved
No part or whole of this thesis may be reproduced, stored in a retrieval system or
transmitted in any form or means such as electronic, mechanical or photocopying without the
prior written permission of the author or Egerton University on her behalf.

iv
DEDICATION
To my loving mother, Mary Ketutury, brothers and sisters, Benard, Jeremia, Rose,
Gladys and Beatrice, who have always, give me moral support to study.

v
ACKNOWLEDGEMENT
I wish to acknowledge the entire staff of the Department of Agricultural Economics
and Business Management, Egerton University under the leadership of Dr. B.K. Mutai for
their sincere and honest support since I enrolled for my studies. Special thanks also go to the
department for the additional research funds.
I am grateful to my supervisors: Dr. Hillary Bett and Dr. Lawrence Kibet for their
unreserved advice, guidance, and constructive criticism during my entire study and research
period. Without their encouragement, insight and professional expertise, the completion of
this work would not have been achieved.
I would like to extend my sincere gratitude to CMAAE program for the research
grants and opportunity to undergo specialized and rigorous training in University of Pretoria
South Africa. Special thanks go to my enumerators who assisted me during data collection
and smallholder farmers in the surveyed district who volunteered information making it
possible to achieve this research. I am also indebted to my classmates, who provided
invaluable advice and encouragement.
Above all honours and thanks go to Almighty God for his mercy, care, strength and
guidance during the entire period of study.

vi
ABSTRACT
Marketing agricultural produce is important amongst smallholder farmers because
they derive benefits such as income and rural employment. In developing countries like
Kenya, most smallholder farmers are characterized by poor market participation because they
lack market information on pineapple marketing. In Bureti district; pineapples have been
perceived to have high market value, resulting in trade-offs with staple food. Despite
pineapples market value, its market participation has not been fully studied and quantified
results in poor prices among small-scale farmers. The objectives of the study were: to
describe farmers‟ socio-economic, institutional and market characteristics of pineapple
marketing in Bureti district; to determine the factors influencing market participation and its
extent, and; to determine the factors influencing the choice of pineapple marketing outlet in
Bureti district. The study was conducted in five locations (Kapkisiara, Kisiara, Tulwet,
Getarwet and Tebesonik). Multistage sampling procedure was employed to contact 150
respondents. Semi-structured questionnaires were used to collect data from small-scale
pineapple farmers through face to face interview. The data was analyzed using the descriptive
statistics, Heckman two-stage selection model and Multinomial Logit model. SPSS and
STATA computer programs were used to process the data. The results showed that age,
gender, education level and pineapple yields significantly influenced the decision to
participate in pineapple marketing. Gender, price information, group marketing, marketing
experience, vehicle ownership and marketing under contract significantly influenced the
extent of market participation. Further, Gender, group marketing, pineapple yield, price
information, marketing under contract and vehicle ownership significantly influenced the
choice of pineapple marketing outlets. The study recommends that, for holistic market
participation among pineapple farmers, proper marketing infrastructure like pineapple hub
must be put in place. The government and other policy makers should increase the marketing
information and ability of pineapple farmers through avenues like mass media, extension
service, and other means of capacity building.

vii
TABLE OF CONTENT
DECLARATION AND APPROVAL ..................................................................................... ii
COPYRIGHT ......................................................................................................................... iii
DEDICATION......................................................................................................................... iv
ACKNOWLEDGEMENT ....................................................................................................... v
ABSTRACT ............................................................................................................................. vi
LIST OF TABLES .................................................................................................................. ix
LIST OF FIGURES ................................................................................................................. x
LIST OF ACRONYMS AND ABBREVIATIONS .............................................................. xi
CHAPTER ONE: INTRODUCTION .................................................................................... 1
1.1 Background information .................................................................................................. 1
1.2 Statement of problem ....................................................................................................... 3
1.3 Objectives ......................................................................................................................... 3
1.3.1 General objective ....................................................................................................... 3
1.3.2 Specific objectives ..................................................................................................... 3
1.4 Research questions ........................................................................................................... 4
1.5 Justification ...................................................................................................................... 4
1.6 Scope and limitation of the study ..................................................................................... 5
1.7 Definitions of terms .......................................................................................................... 5
CHAPTER TWO: LITERATURE REVIEW ....................................................................... 6
2.1 Introduction ...................................................................................................................... 6
2.2 Importance of farmer participation in markets ................................................................. 6
2.3 Factors influencing market participation.......................................................................... 7
2.4 Factors influencing the choice of marketing outlets ........................................................ 8
2.5 Strategies for improving market participation among small-holder farmers ................... 9
2.6 Econometric approaches to modelling market participation .......................................... 10
2.7 Theoretical framework ................................................................................................... 12
2.7.1 Utility maximization theory ..................................................................................... 12
2.7.2 Random utility theory .............................................................................................. 14
2.8 Conceptual framework ................................................................................................... 15

viii
CHAPTER THREE: METHODOLOGY ........................................................................... 17
3.1 Introduction .................................................................................................................... 17
3.2 The study area ................................................................................................................ 17
3.3 Sampling procedure........................................................................................................ 19
3.4 Data collection method................................................................................................... 19
3.5 Data analysis .................................................................................................................. 20
3.5.1 Descriptive analysis ................................................................................................. 20
3.5.2 Econometric analysis ............................................................................................... 20
CHAPTER FOUR: RESULTS AND DISCUSSION .......................................................... 26
4.1 Introduction .................................................................................................................... 26
4.2 Descriptive results .......................................................................................................... 26
4.2.1 Socio-economic characteristic in relation to market participation .......................... 26
4.2.2 Institutional characteristics in relation to market participation ............................... 31
4.2.3 Market characteristics in relation to market participation ....................................... 32
4.2.4 Characteristics in relation to choice of marketing outlets ....................................... 33
4.3 Econometric results. ....................................................................................................... 37
4.3.1 Factors influencing market participation and extent of participation ...................... 37
4.3.2 Factors affecting the choice of pineapple marketing outlets. .................................. 41
CHAPTER FIVE: CONCLUSION AND RECOMMENDATION ................................... 44
5.1 Introduction .................................................................................................................... 44
5.2 Conclusion ...................................................................................................................... 44
5.3 Recommendations .......................................................................................................... 46
5.4. Further research ............................................................................................................. 47
REFERENCES ....................................................................................................................... 48
APPENDICES ........................................................................................................................ 59

ix
LIST OF TABLES
Table 1: Pineapple production in Bureti district ........................................................................ 2
Table 2: Variables in Heckman Two Stage model .................................................................. 23
Table 3: Variable used in the Multinomial Logit..................................................................... 25
Table 4: Age, household size and pineapple yield characteristics of the household heads ..... 26
Table 5: t-test for equality of means for age, household size and pineapple yield .................. 27
Table 6: Gender of the household heads .................................................................................. 28
Table 7: Occupation status of the household heads ................................................................. 28
Table 8: Educational status of the household heads ................................................................ 29
Table 9: Vehicle ownership status of the household heads ..................................................... 30
Table 10: Income status of the household heads ..................................................................... 30
Table 11: Institutional characteristics in relation to market participation ............................... 31
Table 12: Marketing characteristics in relation to market participation .................................. 33
Table 13: Categorical marketing characteristics in relation to marketing outlets ................... 34
Table 14: The Heckman two-step selection equation result .................................................... 38
Table 15: The Heckman two-step outcome equation results ................................................... 39
Table 16: Marginal effect from Multinomial Logit on the choice of marketing outlets.......... 42

x
LIST OF FIGURES
Figure 1: Diagrammatic representation of the conceptual framework. ................................... 16
Figure 2: Map of Bureti district in Kericho County showing the study area. .......................... 18
Figure 3: The percentage of the road infrastructure used in pineapple marketing. ................. 32
Figure 4: The percentage of the price information among the market participants ................. 33
Figure 5: Distribution of Gender in relation to relation to marketing outlets .......................... 35
Figure 6: Means age distribution on marketing outlets ........................................................... 36
Figure 7: Education level distribution in relation to marketing outlets ................................... 36

xi
LIST OF ACRONYMS AND ABBREVIATIONS
CBS Central Bureau of Statistics
FAO
Freq
Food and Agriculture Organisation
Frequency
GDP Gross Domestic Product
GoK Government of Kenya
HCDA
ILRI
Horticulture Crop Development Authority
International Livestock Research Institute
IMR
Kgs
Inverse Mills Ratio
Kilograms
Kshs Kenya shillings
Kms Kilometres
MoA
MNL
Ministry of Agriculture
Multinomial Logit model
OLS Ordinary Least Square
SPSS
SSA
Statistical Package for Social Science
Sub-Saharan Africa

1
CHAPTER ONE
INTRODUCTION
1.1 Background information
Agriculture is the most important sector in the economy of Kenya. It represents 24%
of the Country‟s GDP, 65% of the Country‟s export and 18% of the total formal employment
(GoK, 2007). It is for this reason that the Kenyan government has identified agriculture as
one of the key sectors that is expected to provide the growth necessary for the achievement of
the Kenya Vision 2030.
Agriculture sector in Kenya is characterized by the existence of both large scale and
smallholder farmers. There are currently more than 5 million smallholder farmers who
account for about 75% of the total agricultural production in the country (GoK, 2007).
Smallholder agricultural production is largely characterized by growing of staple food like
maize and beans, which are primarily targeted for own consumption with little marketable
surplus. In Kenya, land holdings have become smaller due to population pressure, hence
farmers have transformed from staple crop production to highly market-oriented crops. This
agricultural transformation has been a vital development tool for achieving the Millennium
Development Goal that calls for reducing of the share of people suffering from extreme
poverty and hunger by 50% (Cervantes-Godoy and Dewbre, 2010).
Horticultural crops are gaining popularity among smallholders‟ farmers in Kenya.
Pineapples are among such horticultural crops adopted and several farmers are practicing
crop trade-off. Anderson (2003) argued that horticultural crops have high market value and
yields more and regularly and hence suit the needs of smallholder farmers who face resource
constraint and have no marketable surplus. Horticulture is an important source of income for
the smallholders, which accounts for over 70% of their total production (McCulloch and Ota,
2002). According to Minot and Ngigi (2003), horticultural crop like pineapple was perceived
to have higher returns than most of the cash crop like tea and is suitable for production on the
currently declining farm sizes in varying agro-ecological zones.
Kenya is among the world‟s leading producer of pineapples. According to FAO
(2012), Kenya was ranked 15th
in the world with the total production of 371,310 metric
tonnes. Del Monte‟s large-scale farm in Thika contributes a significant amount of pineapple
in Kenya, also small-scale growers are increasing their production for the local market. In
Bureti district, pineapples are produced by small-scale farmers for both home consumption
and commercial purpose. In 2010, pineapple farmers in the region produced 56,000 tonnes of

2
the crop, earning them more than US$7.2 million with the bulk of the crop sold locally
(MoA, 2011). Table 1 shows pineapple production in Bureti district.
Table 1: Pineapple production in Bureti district
Division Location Area under pineapple
plantation (Hectares)
Farm families with
pineapple
Roret Kapkisiara 651 1984
Kisiara 558 1770
Tulwet 465 1030
Getarwet 177 120
Kabartegan 7 31
Chemosot 2 6
Cheborgei Tebesonik 21 92
Cheborgei 4 38
Kipbugat 3 26
Cheboin 2 17
Total 1890 5014
Source: MoA (2012)
Markets act as a pivotal point in the agricultural transformation process. Recognition
of the potential of markets to unlock economic growth and agricultural development gave rise
to market-led rural development paradigm during the 1980s (Readon and Timmer, 2007). In
Sub-Saharan African countries like Kenya, the government previously used to play a role in
assisting farmers with marketing of agricultural produce. However, the problem of poor
market participation, which manifests as little marketable surplus has been previously seen as
largely caused by poor pricing policies, this led to market and price liberalization in the
1980s. In the 1980s and 1990s, there were major reforms in these countries on market
liberalization in an effort to create open market-led exchange, aimed at boosting economic
growth (Dorward et al., 2005).
Major reforms like improving market infrastructure by providing more and better
markets and making it easier for farmers to access them is deemed necessary for increasing
the level of commercialization, especially in the developing countries (Shilpi and Umali-
Deininger, 2008). The majority of the smallholders‟ farmers are located in remote areas with
poor transport and poor market infrastructures, contributing to the high transaction costs

3
faced. Transaction costs have been secluded to be the key reasons for smallholder farmers‟
failure to participate in the markets (Makhura et al., 2001). These transaction costs include
costs of searching for a trading partners, of bargaining, monitoring, enforcement and
eventually, transferring the product to its destination (Delgado, 1999).The study has
investigated the determinants of pineapples‟ market participation, linked to transaction costs,
which were used as critical measures in determining why some farmers opted not to
participate in markets, while others opted to participate as a seller. The findings have aided in
identification and generation of appropriate intervention measures that have enabled the rural
population to benefit from pineapple markets.
1.2 Statement of problem
The majority of small-scale farmers in Kenya have ventured into horticultural crops
due to the high market value associated with the crops (Anderson, 2003). In Bureti district,
horticultural crop (pineapple) is largely grown by small-scale farmers. Despite high pineapple
market value, the farmers in the study area are faced with the marketing problem evidenced
by low farm-gate prices. These poor prices among small-scale pineapple farmers have led to
low household income. This study, therefore, filled that knowledge gap by clarifying
underpinning drivers of market participation among small-scale pineapple farmers in Bureti
district.
1.3 Objectives
1.3.1 General objective
The general objective of this study was to provide an insight on determinants of
market participation among the small-scale pineapple farmers in Bureti district, Kenya.
1.3.2 Specific objectives
1. To describe farmers‟ socio-economic, institutional and market characteristics of
pineapple marketing in Bureti district.
2. To determine the factors influencing participation and extent of participation in
marketing of pineapple in Bureti district.
3. To determine the factors influencing the choice of pineapple marketing outlet in
Bureti district.

4
1.4 Research questions
1. What are the farmers‟ socio-economic, institutional and market characteristics of
pineapple marketing in Bureti district?
2. What are the factors influencing participation and extent of participation in marketing
of pineapple in Bureti district?
3. What are the factors influencing the choice of pineapple marketing outlet in Bureti
district?
1.5 Justification
Barret (2009) reported that the smallholder farmers who have engaged in subsistence
and semi-subsistence agriculture have a lower marketable surplus (low return) causing them
to be in a low equilibrium poverty trap. A leap that smallholder farmers need to make to
reduce poverty and hunger is to transform from the low marketability semi-subsistence
farming to high level market-oriented farming. Ngqangweni (2000) argued that marketing
agricultural produce is important amongst smallholder‟s farmers because human derive
benefits such as income and rural employment through it. Markets have been recognized for
their potential to unlock economic growth and development. According to Barret (2008),
market access has been identified as one of the critical factors influencing the performance of
smallholders‟ agriculture in developing countries, and in particular, least developed countries.
Enhancing returns from agricultural production through improved access to market can
therefore be a vital element of poverty alleviation strategies and livelihood improvement. It
has been argued that market-oriented production can achieve the welfare gain through
specialization and comparative advantage, economies of scale and regular interaction and
exchange of ideas. Unfortunately, most small-scale farmers who need this kind of welfare
boast have been constrained by several factors in their quest to participate in the market for
their goods and services. Most pineapple farmers in Bureti district are small-scale this has
resulted from land fragmentation due to population pressure. Altshul et al. (1998) stated that
analyzing factors influencing market participation plays a critical role in meeting the overall
goals for food security, poverty alleviation, and sustainable agriculture, particularly among
smallholder farmers in developing countries. This study, therefore, offered a better insight to
enrich the stock of knowledge limited in literatures regarding small-scale farmer‟s
participation in pineapples marketing and can also serve as an input for policy makers and
researchers who wish to work in this area.

5
1.6 Scope and limitation of the study
The study was confined to Bureti district in Kericho County, focusing only on small-
scale pineapple farmers. Information on socio-economic, institutional and marketing factors
was collected by using a structured questionnaire. Due to lack of farm records among
farmers, this study mainly relied on the farmer‟s memory in the collection of the data
1.7 Definitions of terms
Market participation - refers to any market related activity which promotes the sale of
produce (Key et al., 2000).
Socioeconomic factors- factors that influence both the social and economic wellbeing of an
individual.
Institutional factors– are formal and informal rules that govern transaction activities
between individual or among groups of people.
Market factors–any external factors that affect the demand for or the price of a good or
service.
Transaction cost–are observable and non-observable cost associated with enforcing and
transferring property rights from one person to another (Eggertson, 1990).
Smallholder farmers – are pineapple farmers who are characterized by landholding less than
five acres.
Horticulture – is the science or art of growing vegetables, flowers, and fruits. In this case
pineapple farming is an example of horticultural production.

6
CHAPTER TWO
LITERATURE REVIEW
2.1 Introduction
This chapter reviews the literature in an effort to explore the determinants of market
participation among small scale pineapple farmers. In general, the small scale pineapple
farmers experience poor prices in the study area resulting into low household income. This
chapter therefore presents a literature review on the importance of farmers‟ participation in
the market, factors influencing market participation and choice of marketing outlets,
strategies for improving market participation and econometric approach in modelling market
participation.
2.2 Importance of farmer participation in markets
Market participation by farmer plays a crucial role in that human derives benefit such
as income and rural employment in the farming (Ngqangweni, 2000). The rural employment
derives from market participation includes sorting, grading, transportation among other
activities. Market participation has motivated the farmers to move from subsistence farming
to commercial farming (Makhura, 2001). Commercial farming increases farm‟s output, hence
enabling the farmer to earn more income. Horticulture is an important source of income for
the most smallholder farmers in Kenya. According to Minot and Ngigi (2003) they described
horticulture to be of higher returns than most of the cash crops and are suitable for production
on the current declining farm sizes.
Jari (2009) noted that farmer‟s market participation is very vital for sustaining
economic growth, food security and poverty alleviation. Market participation has led to the
rural road development, rural electrification, industrialization in the rural among others
related-development activities. Most farmers who participated in the market tend to be food
secure because the income they derives from the sale of their output has enabled them to
purchase the staple food.
Economic liberalization has given opportunities for smallholder farmers to diversify
their products and take their surplus to nearby markets (Asfaw et al., 2010). Removing trade
barriers and discouraging local monopoly has helped smallholder farmers to choose their
markets for both inputs and harvested products (Shiferaw and Teklewold, 2007). In summary,
marketing plays a crucial role in meeting the overall goal of food security, poverty alleviation
and sustainable agriculture, especially among smallholder farmers in developing countries
(Lyster, 1990 as cited in Jari, 2009).

7
2.3 Factors influencing market participation
Market participation of smallholder farmers is affected by numerous factors,
including socioeconomic factors, institutional factors, market factors and external factors
such as political stability of the nation, natural disaster and calamities. These factors could
have negative and positive effects, which could either improve or cause a decline in the
welfare of the actors. Social-economic factors include: age, gender, education, experience,
household size and land size.
Age of the household head may have a negative or positive impact on market
participation. The positive impact resulting from the fact that older farmers may take their
decision more easily than the young farmers, because the older people might have
accumulated capital or a long term relationship with their clients or might have preferential
access to credit due to their age, availability of land, or family size (Sall et al., 2000;
Adegbola and Gardebroek, 2007). The age impact negatively in that young people might
have a longer planning horizon and might be willing to take risks (Zegeye et al., 2001). The
older households tend to have more dependants causing more consumption, hence lowering
marketable surplus (Ehui et al., 2009).
The gender of the head of the household has a significant impact in the market
participation decision. Male headed household are expected to have a positive impact on
market participation because they are of resource endowed than their counterpart female.
Jagwe et al. (2010) found that, female headed households are more negatively affected by the
transaction costs of searching for buyers, contracting and enforcing a sale transaction as
opposed to the male headed households. Likewise, female headed household is more likely to
be resource constrained hence affecting production of marketable surplus (Guiterrez, 2003).
Education has a positive effect on market participation because it enhances the skill
and ability to utilize better on market information, which may in turn reduces marketing costs
and make it more profitable to participate in the market. The household size explains the
family labor supply for production and household consumption levels (Alene et al., 2008).
Positive sign insinuates that a larger household provides cheaper labor and produce more
output in absolute terms such that the proportion sold remains higher than the proportion
consumed. A negative sign on the other hand means that a larger household is likely to
consume more output, leaving smaller and decreasing proportion for sale. Key et al. (2000)
postulated that land holding is directly linked to the ability to produce a marketable surplus.
This can be explained by the fact that a farmer produces more output when the land is larger
than when it is small.

8
Institutional factors like membership in the group, extension service, and
infrastructure have an influence on market participation. Poor infrastructure has a negative
effect on market participation because the majority of smallholder farmers in developing
countries is located in remote areas with poor infrastructure and often fail to participate in the
market due to the high transaction cost involved (Goetz, 1992; Makhura et al., 2001; Key et
al., 2002). Membership to the group has both positive and negative impact on market
participants. It positively impacts on market participation because it increases household‟s
access to information vital to production and marketing decisions (Olwande and Mathenge,
2012). On the other hand, it can negatively impact market participation in case disagreement
emerges among group members, distorting marketing decision. Extension service is expected
to impact positively on market participation because it is through extension services that
farmers are able to acquire better skill and knowledge on marketing.
Physical resource endowments like ownership of transport and communication
equipments have an impact on market participants. Ownership of communication equipments
such as mobiles, radios and televisions have a positive impact on the market participation by
facilitating marketing information to the farmers. Ownership of transport equipment such as
bicycles, motorcycles and truck have a positive impact on market participation by reducing
the cost of transporting output from the farm to the market (Key et al., 2000).
Market factors have been found to positively and negatively influence market
participation. Jari (2009) stated that availability of market information boosts confidence of
household who are willing to participate in the market. Poor access to market information
result in information-related problem, namely moral hazard and adverse selection which in
turn increase transaction costs and hence discourages participation in the market by some
farmers (Fatchamp and Hill, 2005; Shiferaw et al., 2009). Distance from the farm to point of
sale, and market information were found in a couple of studies to be a major constraint to
intensity of market participation (Goetz, 1992; Montshwe, 2006; Bahta and Bauer, 2007;
Omiti et al., 2009). Price factor positively influences market participation. Alene et al. (2008)
argue that output price is an incentive for sellers to supply more in the market.
2.4 Factors influencing the choice of marketing outlets
Choice for the marketing outlet is the farmers‟ decision on where to or not to sell their
farm produces. The choice of market outlet is determined by the price the farmers receive
from the sale of producers. The farmer is likely to choose the one which gives higher
benefits. In addition, the investigation of determinants of market outlet for mango producers

9
in Costa Rica (Zuniga-Aria and Ruben, 2007), showed four major factors in their analytical
framework. The first factor was related to the farm household (including farmer‟s experience,
an outlet which is profitable. Attitude toward risk positively and negatively influences the
choice attitude toward risk); the second factor dealt with production system (farm size and
production scale); the third determinant was price attributes; and the last was market context
(having or not a written contract, geographical location and distance to urban market).
Farmer‟s experience, especially for marketing has influenced the farmer to choose the
market of marketing outlet. Those who are risk taker are willing to transport their farm
produces to distant places while risk averse, always resort to sell at farm-gate. Montshwe
(2006) stated that the farm gate sale tends to reduce farmers‟ revenue since the prices are
relatively low. Farm size is a proxy to production scale. When the land size is large the
production scale is also large and vice versa. Large production scale positively influences the
farmer to sell their produce at market place mainly because of economies of scale which
lower transaction cost.
Price attitude has an influence on the choice of marketing outlet. A higher price
provides an incentive to the selling point. When the farm-gate or the market place price is
higher, the farmers tend to sell at that point. Contract arrangement has an influence on the
choice of marketing outlet. Contract arrangement guarantees the farmers a ready market. The
farmers tend to choose the outlets that have a ready market either farm gate or market place.
In most cases, the farmer chooses farm gate because it incurs no transaction cost. Distance to
market place negatively influences the choice of marketing outlet. In an early study on
infrastructure and market access in Madagascar, Minot (1999) showed that the choice of
marketing outlet among trader is negatively related to the distance to the market site.
Therefore, farmers tend to sell their outputs at farm gate because there is no transaction cost
to be incurred.
2.5 Strategies for improving market participation among small-holder farmers
Market participation should be enhanced to increase the marketable surplus. Barret
(2008), argued that technology affects market participation directly. A household‟s
production technology choice affects its market participation choice by affecting its
productivity. Wilson et al. (1995) suggested that due to lack of storage facilities, most
smallholder producers are keen to sell produce almost immediately after harvest in order to
ease congestion, leading them to sell their produce at lower prices.

10
Market infrastructure such as sheds and stalls in the spot market is crucial in
maintaining freshness of agricultural producers (Wilson et al., 1995). Also, improved market
access result in the production of marketable surplus and hence gain in income from
agriculture and higher revenues, saving and hence investment in productivity enhancing
technologies. According to Matungul et al. (2002), investment in public goods such as
telecommunication, a road, an efficient legal system, and farmer support service (extension,
marketing information, and research) would raise farm and non-farm income by reducing
transaction costs.
Contract system is another strategy to enhance market participation. Contract farming
provides the basis for sharing values, risks and decision-making power between farmers and
processors in a way that is mutually beneficial (Eaton and Shepherd, 2001). Across many
developing counties, contract farming has been found to play an important role in the
commercialization of smallholder agriculture through the provision of an assured market,
high prices, critical inputs and knowledge of new agricultural technologies for farmers as a
driver of a rural development strategy (Elupe and Nalukenge, 2007). As cited by Kherallah
and Kirsten (2001), collective action is also an important strategy in agricultural marketing
because it contributes towards reduced transaction costs and it strengthens the farmers‟
bargaining and lobbying power.
2.6 Econometric approaches to modelling market participation
Heckman two-stage models, Double-hurdle model, and Tobit model have been used
to examine crop market participation (Komarek, 2010). Tobit model is a statistical model
proposed by James Tobin (1958) to describe the relationship between non-negative
dependent variable and independent variable. Hobbs (1997) and Holloway et al. (2004) used
Tobit model to model farmers‟ market participation behavior. The Tobit (Tobin, 1958)
modelling approach presumes that the participation and sales volume decisions are made
simultaneously and hence factors that affect the participation decision and the sales volume
decision are the same. Hence, this model is prone with the limitation that it assumes that the
same set of parameter and variables determine both the probability of market participation
and the level of transaction. Tobit model also assumes that zero values traded are because of
rational choice, although it may be a prohibitive entry barrier that is limiting market entry
(Komarek, 2010). Tobit model is „limited‟ in the sense that we observe it only if it is above or
below some cut off level hence it underestimates the intercept and overestimate the slope.
Tobit seems also to conceal some information on that, it tends to combine both the direct and

11
partial effects of the explanatory variables on the dependent variables (Makhura, 2001).This
study will not adopt this model because recent empirical studies have shown the inadequacy
of the Tobit model in cross-sectional, stressing the relevance of alternative approaches.
A two-step model relaxes the Tobit model assumption by allowing different
mechanisms to determine the discrete probability of participation and level of participation.
These models allow for separation between the initial decision to participate and the extent of
participation. These studies have used either the sample selection model of Heckman (1979)
or the two hurdle models (Omiti, et al., 2009). A most commonly used two-tier model is the
double-hurdle of Craig (1971). In this model, an input market decision is a two-step decision
process. This is based on the assumption that household makes two separate decisions; one
involves the decision to participate in the market or not and secondly the extent of
participation. The model estimation involves a Probit regression to identify factors affecting
the decision to participate in marketing using all sample populations in the first stage, and a
truncated regression model on the participating households to analyze the extent of
participation, in the second stage. According to Burke (2009), the double hurdle model is
useful because it allows a subset of the data to pile-up at some value without causing a bias in
estimating the determinants of the continuous dependent variable in the second stage, hence
you can obtain all the data in the remaining sample for the participants. Thus, in double
models, there are no restrictions regarding the elements of explanatory variable in each
decision stage. This model is not appropriate in this study because of sample selection
problems, and more precisely in the case of incidental truncation, some part of the dependent
variable is not observed because of the outcome of another variable.
Heckman two-stage model was developed by Heckman (1979) and has been used
extensively to correct for biases arising from sample selection. The Heckman procedure
provides consistent and asymptotically efficient estimates for all the parameters (Heckman,
1979; Maddala, 1983; Amemiya, 1985). This model assumes that the missing value of
dependent variable implies that the dependent variable is unobserved (not selected).
Heckman‟s model first uses a Probit regression with all variable data to estimate the
probability of market participation. Then the inverse Mills ratio, computed from the Probit
regression, is used with other explanatory variables to help explain variances to the
continuous, non-zero dependent. To cater for the problem of selectivity bias and to relax the
assumptions in the Tobit model, the study will therefore utilize a Heckman two-step
procedure.

12
To analyze the choice of pineapple market outlets, the multinomial Logit model is
suitable. Multinomial logistic regression is useful in analyzing data where the researcher is
interested in finding the likelihood of a certain event occurring. In other words, using data
from relevant independent variables, multinomial logistic regression is used to predict the
probability (p) of occurrence, not necessarily getting a numerical value for a dependent
variable (Gujarati, 1992). Dougherty (1992) explained that the procedure for formulating a
multinomial logistic regression is the same as for a binary logistic regression. Whereas in
binary logistic regression, the dependent variable has two categories, in multinomial logistic
regression, it has more than two categories. Thus, multinomial logistic regression is an
extension of binary logistic regression. OLS cannot be used because it violates the fact that
the probability has to lie between 0 and 1, if there are no restriction on the values of the
independent variables hence the multinomial logistic regression guarantees that probabilities
estimated from the Logit model will always lie within the logical bounds of 0 and 1 (Gujarati,
1992). The multinomial Logit model is therefore used to model choices in this study because
it relies on the assumption of independent of irrelevant alternative (IIA) which is not always
desirable. Thus assumption state that the odds of preferring one class over another do not
depend on the presence or absence of other “irrelevant” alternatives. It also assumes that data
are case specific that is each independent variable has as a single value for each case. The
advantage of the Multinomial Logit model is that it permits the analysis of decisions across
more than two categories, allowing the determination of choice probabilities for different
categories (Woodridge, 2002). On the contrary, the binary Logit models are limited to the
maximum of two choice categories (Maddala, 1983).
2.7 Theoretical framework
This study was built on two utility theories: utility of random utility and utility maximization
theory.
2.7.1 Utility maximization theory
The decision to participate in the pineapple market or not was a binary choice. This
was because of the dichotomous nature of the dependent variables, that was, to participate or
not to participate in pineapple market. The decision on whether or not to participate was
considered under the general framework of utility or profit maximization (Norris and Batie,
1987; Pryanishnikov and Katarina, 2003). Within this framework, economic agents were
small-scale pineapple farmers whose participation decisions were measured by perceived

13
utility or net benefit from any option. Although utility was not directly observed, the actions
of economic agents were observed through the choices they made. Suppose that and
represent a household‟s utility for two choices, which are, correspondingly, denoted by
and . The linear random utility model could then be specified as in equation 1
( ) ( ) (1)
Where and are perceived utilities of pineapple market participation and non-
pineapple market participation choices j and k, respectively, the vector of explanatory
variables that influence the perceived desirability of each choice, and utility shifters,
and and are error terms assumed to be independently and identically distributed (iid)
(Greene, 2000). In the case of pineapple market participation, if a household decides to use
option j, it follows that the perceived utility or benefit from option j is greater than the utility
from other options (say k) depicted as in equation 2;
( ) ( ) (2)
The probability that a household will choose to participate, i.e., choose method j
instead of k could then be defined as:
P (Y = 1|X) = P ( )
P (
P (
P ( (3)
Where P is a probability function and are as defined above,
A random disturbance term,
a vector of unknown parameters that can be interpreted as a net influence of
the vector of independent variables influencing participation, and cumulative
distribution function of evaluated at The exact distribution of F depends on the
distribution of the random disturbance term, . Depending on the assumed distribution that
the random disturbance term follows, several qualitative choice models can be estimated

14
(Greene, 2000). Any household decision concerning alternatives is underpinned by this
theoretical framework, the realization of which can be implemented by a critically thought
out conceptual framework.
2.7.2 Random utility theory
Every farmer is a rational decision maker maximizing utility relative to his choices. It
is assumed that given farmer i in making a decision considering exclusive alternatives that
constituted the choice set Ii of pineapple marketing outlet, the choice set may differ according
to the decision maker. The farmer i assigns each alternative j in his choice set of perceived
utility i
jU and selects the marketing outlet that maximizes his utility. The utility assigned to
each choice alternative depends on a number of measurable attributes of the alternative itself
and the farmer who is the decision maker.
i
j
ii
j XUU (4)
In equation 4, iU is the perceived utility and i
jX is a vector of attributes relative to
alternative j and to decision maker i, utility is not known with certainty and it must be
represented in general by a random variable. The probability that the farmer will select
alternative j conditional of his choice set Ii will be given by;
)()/( i
k
i
j
iii UUPIjP , jk ,iIk (5)
The perceived utility i
jU can be expressed as the sum of two terms: a systematic
utility and a random residual. Systematic utility i
jV represents mean of all farmers having the
same choice context as decision maker i. i
j captures the combined effects of the various
factors that introduce uncertainty in choice modelling, it is expressed as,
i
j
i
j
i
j VU iIj (6)
With )( i
j
i
j UEV , then i
j
i
j V)V(E , 0)Vvar( i
j and 0)( i
jE , ij2i
j )Uvar( and this
yields,
)(Pr)/( i
j
i
k
i
k
i
j
iii VVobIjP jk iIk (7)
WhereiP is the choice probability. Equation 7 gives the probability of farmers selecting
alternative j and it suggests that the choice of a given alternative depends on the systematic

15
utilities of all competing alternatives and on the law of the joint probability of random
residualsj . A farmer is likely to choose the option that gives a higher utility among the
alternatives.
2.8 Conceptual framework
The conceptual framework in Figure 1 illustrates the interrelationships in the study,
the key variables involved and how they are interrelated. Socioeconomic characteristics are
the background factors like (age, education level, gender, household income, occupation,
household income, and vehicle ownership), institutional factors like (group marketing, access
to extension service, contract marketing, and road infrastructure) and market factors like
(prices of output, price information, marketing experience, and distance to the market) had an
influence on market participation. The participation leads to the extent of participation and
choice of marketing outlets. The extent of participation (amount of pineapples sales) in turn
increased the household income.

16
Direction of influence
Figure 1: Diagrammatic representation of the conceptual framework.
Source: own conceptualization
Institutional factor
Access to extension
service, contract
marketing, group
marketing, road
infrastructure
Socio-economic factors
Age, Education level,
Gender, Household
income, Occupation,
household income,
vehicle ownership
Market factors
Distance to market,
Price of outputs,
Price information,
marketing
experience
Market participation
Extent of participation
Increased household income
Choice of
marketing outlets

17
CHAPTER THREE
METHODOLOGY
3.1 Introduction
This chapter gives an account of the study area where the research was conducted. It
also explains the sampling procedure and determines the sample size of the target population.
The section on data collection method explains the tools that were used for collecting data.
The analytical framework outlines the descriptive statistics and econometric models, giving
the reasons why models were chosen.
3.2 The study area
Bureti district is one of the districts in Kericho County. The district is located in 0.50S
and 35.250
E. Its borders Kericho district to the North, Konoin district to the East, Sotik to the
South and Nyamira to the South West. The district occupies a total area of 955 km2.
Administratively, the district has three divisions: Roret; Cheborge, and Buret, which are
further, divided into Locations and Sub-Locations. The district headquarters is in Litein town.
Bureti district borders. Economic activities in Bureti district include tea growing and
processing; dairy farming; commercial businesses. Other agricultural products include
pineapple, maize, beans, potatoes, vegetables, coffee, and tea. The change in altitude factors
causes the temperature to vary from 20-28ºC. The mean annual rainfall varies from 1400mm
to 1800mm.The district has a population of 316,882 people (GoK, 2010). The study area is
shown in Figure 2.

18
Figure 2: Map of Bureti district in Kericho County showing the study area.
Source: ILRI (2008)
KABARTEGAN
CHEMOSOT
TEBESONIK
KIBUGAT
CHEPLANGET
KAPKATET
CHEBORGEI LITEIN
KISIARA TULWET
TECHOGET
NGESUMIN CHEMOIBEN
CHEBOIN
KAPSOGUT
CHEBWAGAN
Ü
BURETI DISTRICT
0 1 2 3 4 0.5 Kilometres
Legend
Townships
Roads Divisions
KENYA

19
3.3 Sampling procedure
The target population of the study was the small-scale pineapple farmers in Bureti
district. Multi-stage sampling procedure was used in the selection of representative sample.
The first step involved purposive selection of Roret and Cheborgei divisions among the three
divisions in Bureti district. Roret and Cheborgei division were selected mainly because they
were the main pineapple growing divisions in Bureti district. Secondly, five locations
(Kapkisiara, Kisiara, Tulwet, Getarwet, and Tebesonik) were selected purposively because
the large number of small scale pineapple farmers in Bureti district. Finally, 30 farmers in
each location were selected randomly using simple random sampling to give a total sample of
150 farmers who were ultimately interviewed. The required sample size was determined by
Cochran‟s proportionate to size sampling methodology (Mugenda and Mugenda, 2003).
2
2
e
qpZn (8)
Where; n = Sample size; Z= confidence level (α = 0.05); p = proportion of the population
containing the major interest, q = 1-p and e = allowable error. Hence, Z = 1.96;
p = 0.11 = )316882
35098( , q = 0.89 and e = 0.05. This resulted in a sample population of 150
respondents. 4.15005.0
89.011.096.12
2
(9)
3.4 Data collection method
Before the data was collected, the questionnaire was pre-tested on selected farmers to
evaluate the appropriateness of the design, clarity, and relevance of the questions. The
appropriate modification was made on the pre-tested questionnaire in order capture the
relevant information related to the study objectives. Five enumerators were recruited and
trained on the content of the questionnaire and interviewing process. Primary data were
collected through the administration of semi-structured questionnaire by a team of five
trained enumerators to 150 small-scale pineapple farmers.

20
3.5 Data analysis
Data from the field was edited, coded, and cleaned to ensure consistency, uniformity,
and accuracy. Data was entered into computer software for analysis. Both SPSS and STATA
computer programs were used to process the data. Two types of analysis, namely: descriptive
and econometric were used for analyzing the collected data.
3.5.1 Descriptive analysis
In order to achieve objective one, descriptive statistics such as means, minimum and
maximum values, frequencies, percentages and standard deviations were used to describe and
examine farmers‟ socio-economic, institutional and market characteristics of pineapple
marketing in Bureti district.
3.5.2 Econometric analysis
Objective two and three were analyzed using Heckman two-stage model and
Multinomial Logit model, respectively.
3.5.2.1 Heckman two-stage model
To determine the factors influencing participation and extent of participation in
pineapple marketing, the Heckman two-stage selection model was used. The decision to
either participates in the market or not and level of participation was dependent variables and
was estimated independently. Heckman two-step procedure was identified as an appropriate
model for such independent estimation. Heckman two-step model involved estimation of two
equations: First, is whether a household participated in the pineapple market or not, and the
second is the extent of market participation (proportion of pineapple sales). The proportion of
pineapple sales were conditional on the decision to participate in the market. Heckman
procedure is a relatively simple procedure for correcting sample selection bias with the
popular usage of (Hoffman and Kassouf, 2005).
The model consisted of two steps; firstly, selection equation was estimated using a
probit model and secondly, an outcome equation was estimated using OLS regression. A
Probit model predicts the probability of whether an individual household participated in the
pineapple market or not as shown.
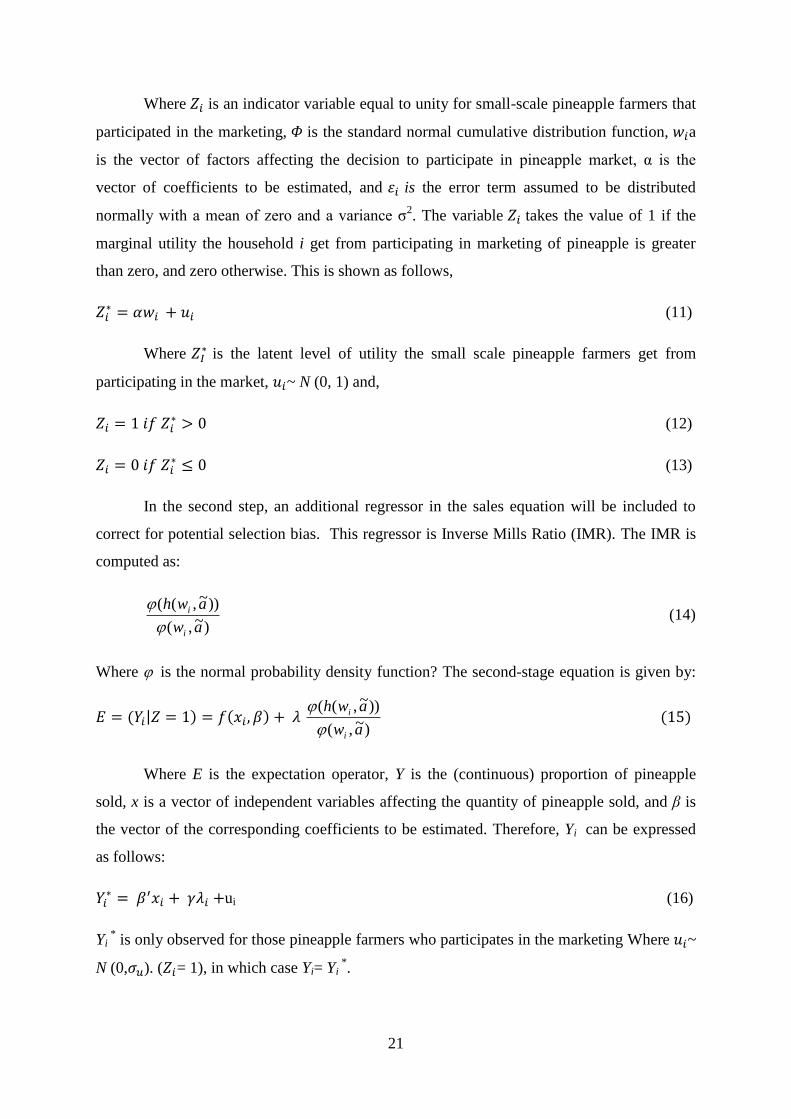
( ) ( ( )) (10)
21
Where is an indicator variable equal to unity for small-scale pineapple farmers that
participated in the marketing, is the standard normal cumulative distribution function, a
is the vector of factors affecting the decision to participate in pineapple market, α is the
vector of coefficients to be estimated, and is the error term assumed to be distributed
normally with a mean of zero and a variance σ2. The variable takes the value of 1 if the
marginal utility the household i get from participating in marketing of pineapple is greater
than zero, and zero otherwise. This is shown as follows,
(11)
Where is the latent level of utility the small scale pineapple farmers get from
participating in the market, ~ N (0, 1) and,
(12)
(13)
In the second step, an additional regressor in the sales equation will be included to
correct for potential selection bias. This regressor is Inverse Mills Ratio (IMR). The IMR is
computed as:
)~,(
))~,((
aw
awh
i
i
(14)
Where is the normal probability density function? The second-stage equation is given by:
| )~,(
))~,((
aw
awh
i
i
Where E is the expectation operator, Y is the (continuous) proportion of pineapple
sold, x is a vector of independent variables affecting the quantity of pineapple sold, and β is
the vector of the corresponding coefficients to be estimated. Therefore, Yi can be expressed
as follows:
ui (16)
Yi * is only observed for those pineapple farmers who participates in the marketing Where ~
N (0, ). ( = 1), in which case Yi= Yi *.

22
The model can thus be estimated as follows; in the first step of deciding whether to
participate in pineapple marketing or not. This can be specified as:
= +……. + e
Where participation is denoted by 1 and non- participation is denoted by 0, β0 is a constant,
β1…..n are parameters to be estimated are vector of explanatory variables.
The Second step which involves a decision on the extent of pineapple marketing is
estimated by use of an OLS as follows;
Y = +…. + e (17)
Where Y denotes the proportion of pineapple sales, β0 is a constant, β1…..n are parameters to
be estimated are vector of explanatory variables.
Model specification
Heckman two-step procedure
Heckman (1979) proposed a two-step procedure which only involves the estimation
of a standard probit and a linear regression model. The two equations for the two steps are
specified as follows: The variables to be used in Heckman two stages are shown in Table 2.
Step 1. (Selection equation)
(0,1) = β0+β1X1+β2X2+ …………. +βnXn+ ε
(0,1)=β0+ β1age+ β2gend+ β3Educ+ β4Hsize+ β5Occup+β6HsInc+β7VehOwn+
β8PinOutcm+εi (18)
Step 2. (Outcome equation) =β0+β1X1 +β2X2+………..+βnXn+ ε
Proportion of pineapple sales ( ) = β0+ β1age+ β2gend+ β3Educ+ β4Hsize+
β5Occup+β6HsInc+β7VehOwn+ β8Distmkt+ β9Pric+ β10PineOutcm+ β11MktGrp+ β12Contr+
β13Pricinfr+ β14MktExpr +β15IMR + εi (19)

23
Table 2: Variables in Heckman Two Stage model
Variable
code
Variable Measurement of the variables Expected
sign
Dependent
variable
TypHsld Type of household (market
participant/non-market
participant)
Dummy ( 1= market participant, 0 =
Non-Market participant)
ExtParti Extent of participation Proportion of pineapple sale
Independent
variables
Age Age in years In years (continuous)
Gnd Gender Dummy (1 =Male, 0= Female)
Educ Education (1 = No education, 2 = Primary, 3 =
Secondary, 4 = Tertiary )
Hsize Household size Size of the household (continuous) +
Occup Occupation (1 = Farmer, 2 = Businessman, 3=
employed)
HsInc Household Income In shilling (Continuous) +
VehOwn Vehicle ownership Dummy (1 = yes, 0 = No)
Distmkt Distance to the market In Kms (continuous)
PineOutcm Pineapple outcome In kilograms(continuous) +
PricInfr Price information Dummy(1 = Yes, 0 = No)
Price Price of output In shilling (continuous) +
Contr Contract Arrangement Dummy( 1= present, 0 = Absent)
MktGrp Marketing in groups Dummy (1= yes, 0 = No)
MktExpr Marketing experience In years (Continuos)
24
3.5.2.1 Multinomial Logit model
To determine the factors influencing the choice of pineapple marketing outlet in
Bureti district, the multinomial Logit model was used. The choice of a given marketing
outlet is discrete because it is chosen among other alternative outlet. Let Pij represent the
probability of choice of any given market outlet by pineapple farmers, then equation
representing this will be,
eXXP kkij ...110 (20)
Where i takes values (1, 2, 3), each representing the choice of marketing outlet (farm gate =1,
local market =2, urban market =3). X1 are factors affecting choice of a market outlet, β are
parameters to be estimated and e is randomized error. With j alternative choices, the
probability of choosing outlet j is given by,
obPr
j
k z
z
i
k
j
e
ejY
0
)( (21)
Where Zj is a choice and Zk is alternative choice that could be chosen (Greene, 2000). The
model estimates are used to determine the probability of choice of a market outlet given j
factors that affect the choice Xi. With a number of alternative choices log odds ratio is
computed as,
ikk
ij
ijeXXX
p
p ....)ln( 2211
*
(22)
Pij and Pik are probabilities that a farmer will choose a given outlet and alternative outlet
respectively. )P
Pln(
ik
ijis a natural log of probability of choice j relative to probability choice k,
α is a constant, is a matrix of parameters that reflect the impact of changes in X on
probability of choosing a given outlet, e is the error term that is independent and normally
distributed with a mean zero. The parameter estimates of the Multinomial Logit model
provide only the direction of the effect of the independent variable on the dependent
(response) variable but do not represent either the actual magnitude of change nor
probabilities. The marginal effects or marginal probabilities are functions of the probability
itself and measure the expected change in the probability of a particular choice being made
with respect to a unit change in an independent variable from the mean (Green, 2000).

25
Marginal effects of the attributes on choice are determined by getting the differential of
probability of a choice and it is given by,
)()()(0
ji
j
k kkj
i
i PPpiX
P (23)
The multinomial Logit model is given below;
=β0+β1X1 +β2X2+………+βnXn+ εi
Choice of market outlet = β0+ β1age+ β2gnd+ β3Educ+ β4PineOutcm+
β5VehOwn+β6MktGrp+β7PricInfr+ β8Contr+ β9MktExpr+εi (24)
Table 3: Variable used in the Multinomial Logit
Variable
code
Variable Measurement of the variables Expected
sign
Dependent
variable
MktOutlets Household choice of
pineapple marketing outlets
(Farm gate =1, Local market =2,
Urban market=3,)
+
Independent
variables
Age Age in years In years (continuous) +
Gnd Gender Dummy (1 =Male, 0= Female)
Educ Education (1 = No education, 2 = Primary, 3
= Secondary, 4= Tertiary)
+
PineOutcm Pineapple outcome In kilograms (continuous) +
VehOwn Vehicle ownership Dummy ( 1 = Yes, 0 = No)
MktGrp Marketing in groups Dummy (1= yes, 0 = No)
MktExpr Marketing experience In years (continuous) +
PrInfr Price information Dummy (1= Yes, 0 = No)
Contr Contract Arrangement Dummy (1= Yes, 0 = No)

26
CHAPTER FOUR
RESULTS AND DISCUSSION
4.1 Introduction
This chapter presents descriptive results of socio-economic, institutional and market
characteristics in relation to market participation and choice of marketing outlets. It also
presents empirical results of the Heckman two-stage model and multinomial Logit model,
providing an in-depth explanation of significant variables.
4.2 Descriptive results
4.2.1 Socio-economic characteristic in relation to market participation
The results in Table 4 show that the youngest market participant was 24 years old
while the oldest was 70 years old. On the other hand, the youngest non-market participant
was 30 years old while the oldest was 72 years old. In terms of household size, the smallest
household size among market participants was found to be 2 members while the highest was
found to be 10 members. Among non-market participants, the smallest household size was
found to be 3 members while the highest was found to be 10 members. In terms of pineapple
yield, the smallest amount produces by market participant on a weekly basis was found to be
100 kilograms while the highest amount was found to be 360 kilograms. Among non-market
participants the smallest amount produces on a weekly basis was found to be 40 kilograms
and the highest amount was found to be 180 kilograms.
Table 4: Age, household size and pineapple yield characteristics of the household heads
Type of the farmer Characteristics N Min Max Mean Std
Market participants Age 100 24 70 46.93 1.332
Household size
Pineapple yield
100
100
2
100
10
360
5.75
201.60
0.165
5.325
Non- market participants Age 50 30 72 51.02 1.297
Household size 50 3 10 5.76 0.218
Pineapple yield 50 40 180 107.80 3.324
Source: Survey data (2013)

27
Table 5 indicates that the mean age of market participants was about 45 years while
that for non-market participants was about 51 years. The overall mean age of the pineapple
farmers was found to be 46.93 years old. The result of the two tailed tests showed that the age
was statistically significant at 1%, signifying that the mean age of market participants was
less than that of non-market participants. The result is consistent with argument by Arega et
al. (2007) who stated that market participation declines with age because the older people are
perceived to be risk averse and reluctant to adopt technology. Barret et al. (2007) also
concluded that young people participated more in the market because they are more receptive
to new ideas and are less risk averse than the older people.
In terms of household size, the results indicate that the mean of the household size for
the market participants was found to be 5.75 members, while that for non-market participants
was found to be 5.76 members. The overall household size mean was found to be 5.75
members which are nearly the same as that of Kenya‟s national mean of 5 members per
household (CBS, 2005). The two tailed test results showed that household size was
statistically insignificant meaning the household size between the market participants and
non-market participants were almost equal.
In terms of pineapple yield, the means of pineapple yields for market participants per
week was found to be 201.60 kilograms while that for non-market participant was found to be
107.80 kilograms. The mean of overall pineapple yield was found to be 170.33 kilograms.
The result of the two tailed tests showed that the pineapple yield was statistically significant
at 1% indicating that the market participants had more pineapple yields than non-market
participants. The result is consistent with the findings of Omiti et al. (2009) and Astewel
(2010) who confirmed that increasing the volume of production increase market participation.
Table 5: t-test for equality of means for age, household size and pineapple yield
Characteristics Mean Overall t-ratio Sig
Market
participant
Non-market
participant
Age 44.890 51.020 46.93 -21.153*** 0.000
Household size
Pineapple yield
5.750
201.600
5.760
107.800
5.75
170.33
-1.256
235.282***
0.106
0.000
***: significant at 1% level.
Source: Survey data (2013)

28
The results in Table 6 show that 69% of market participants were male, while 31%
were female. On the other hand, 18% of non-market participants were male, while 82% were
female. The chi-square result showed that gender was statistically significant at 1% indicating
that the male households who participate in the pineapple market were more than those who
did not participate. The explanation for this is that women in SSA are disadvantaged in
marketing because of unequal distribution of resources as well as cultural barriers (Chikuvire
et al, 2006).
Table 6: Gender of the household heads
Gender Market
participants
Non-market
participants
Overall 2 Sig
Freq % Freq % Freq
Male 69 69 9 18 78 34.735*** 0.000
Female 31 31 41 82 72
Total 100 100 50 100 150
***: significant at 1% level.
Source: Survey data (2013)
The results in Table 7 show that among market participants, 74% were farming only,
11% were farming with business and 15% were farming with employment. Among non-
market participants, 76% were farming only, 14% were farming with business and 10% were
farming with employment. The result of chi-square shows that occupational status of
household head was statistically insignificant indicating that market participants and non-
market participants were almost equally distributed in terms of occupation. This implies that
the occupation status of the household heads has no influences on market participation.
Table 7: Occupation status of the household heads
Occupation status Market
participants
Non-market
participants
Overall 2 Sig
Freq % Freq % Freq
Farming only 74 74 38 76 112 0.893 0.640
Farming with the business 11 11 7 14 18
Farming with employment 15 15 5 10 20
Total 100 100 50 100 150
Source: Survey data, (2013)

29
Table 8 shows the educational status of the household heads. The results indicate that
14% of market participants had no formal education, 47% attained primary level, 26%
attained secondary level and 13% attained tertiary level. On the other hand, 50% of non-
market participants had no formal education, 42% attained primary level, 8% attained
secondary level and none attained tertiary level. The result of the chi-square shows that
education level was statistically significant at 1% indicating that the educational level of
market participants were higher than those of non-market participants. Formal education has
been found to enhance managerial competence and successful implementation of improved
production, processing and marketing practices (Marenya and Barret, 2006). The finding is
consistent with the argument of Makhura et al. (2001) who stated that human capital
represented by the household head‟s formal education is posited to increase a household
understanding of market dynamics and therefore improve decision about the amount of
output sold, inter alia.
Table 8: Educational status of the household heads
Education
level
Market
participants
Non-market
participants
Overall 2 Sig
Freq % Freq % Freq
No education 14 14 25 50 69 28.699*** 0.000
Primary 47 47 21 42 68
Secondary 26 26 4 8 30
Tertiary 13 13 0 0 13
Total 100 100 50 100 150
***: significant at 1% level.
Source: Survey data (2013)
The results in Table 9 show that 47% of market participants own vehicles while 53%
did not own. On the other hand, 22% of non-market participants own vehicles while 78% did
not own. The chi-square result shows that the vehicle ownership was statistically significant
at 1% indicating that more of market participants owned vehicles than non-market
participants. The vehicle ownership greatly boosts the morale of the farmer to participate in
the market because it convenient the farmers on the place of marketing and the time. A study
on market access by Key et al. (2000) shows that ownership of some mean of transport such
as ox-cart and van is positively related to market participation.

30
Table 9: Vehicle ownership status of the household heads
Vehicle
ownership
Market
participants
Non-market
participants
Overall 2 Sig
Freq % Freq % Freq
Yes 47 47 11 22 58 8.784*** 0.000
No 53 53 39 78 92
Total 100 100 50 100 150
***: significant at 1% level.
Source: survey data (2013)
The results in Table 10 shows that among the market participants 59% had an income
of 1,000 - 10,000 per month, 26% had 10,000 - 20,000, 8% had 20,000 - 30,000 and 7% had
30,000 - 40,000. Among non-market participants, 64% had an income of 1,000 to 10,000 per
month, 22% had 10,000 - 20,000, 10% had 20,000 - 30,000 and 4% had 30,000 - 40,000. The
result of the chi-square shows that the household income was statistically insignificant
indicating that the income distribution between market participants and non-market
participants were almost similar.
Table 10: Income status of the household heads
Household
income
Market
participants
Non-market
participants
Overall 2 Sig
Freq % Freq % Freq
1,000 - 10,000 59 59 32 64 91 5.67 0.339
10,000 - 20,000 26 26 11 22 37
20,000 - 30,000 8 8 5 10 13
30,000 - 40,000 7 7 2 4 9
Total 100 100 50 100 150
Source: Survey data (2013)

31
4.2.2 Institutional characteristics in relation to market participation
The results in Table 11 indicate that 32% of the market participants were in group
marketing while 68% were not in the group. This implies that group marketing in the study
area is still low. Marketing in a group is essential because it facilitates information exchange
among the members which reduces the transaction cost and hence increases the extent of the
market participation. Poulton et al. (2006) argued that belonging to a group, empower
farmers to bargain and negotiate for better trading terms. In terms of contract marketing, the
results show that 53% of the market participants were under market contract while 47% were
not under contract. Marketing under contract have been perceived to increase market
participation because the farmers are assured of the ready market for their produce. In terms
of access to extension services, the result shows that 5% of market participants had an access
to extend service while 95% did not access. This implies that the majority of the market
participants did not have an access to extend the service. An access of extension service
through extension officers plays an imperative role of empowering the farmers with
marketing information and ability.
Table 11: Institutional characteristics in relation to market participation
Variable Frequent Percentage
Group marketing Yes 32 32
No 68 68
Total 100 100
Contract marketing Yes 53 53
No 47 47
Total 100 100
Access to extension service Yes 5 5
No 95 95
Total 100 100
Source: Survey data (2013)
Figure 3 shows the types of the road infrastructure used in pineapple marketing. The
results indicate that 64% of road infrastructure used by market participants was made of
earth surface, 34% of road infrastructure were a combination of tarmac and earth's surface,
and 2% were of the pure tarmac road. This implies that the road infrastructure in the study

32
area still poor. Poor roads are perceived to increase the transport cost which discourages
farmers from participating in the pineapple market.
Figure 3: The percentage of the road infrastructure used in pineapple marketing.
Source: Survey data (2013).
4.2.3 Market characteristics in relation to market participation
Table 12 presents the results of continuous marketing variables. In terms of marketing
experience, the result shows that the least experienced market participant had 3 years while
the most experienced had 13 years. The marketing experience mean was found to be 7.19
years. In essence, marketing experience captures the aspects relating to social networks and
linking with marketing players, which accrue over time. The existence of such links reduces
transaction cost in searching for the trading partners, contracting, negotiating and enforcing
contracts which in turn increases market participation.
In terms of distance to the market, results reveal that the shortest distance to the
market place was 0 kilometers while the furthest distance was 50 kilometers. The 0
kilometers means the farmer‟s market place was at the farm. The average mean of the
distance to the market place was found to be 6.45 kilometers. The distance to the market has
been found to have a negative impact on market participation. Ogunleye and Oladeji (2007)
found that a greater distance to the market increases transportation costs and marketing costs
and this hampers the extent of market participation.
In terms of pineapple price, the results reveal that the lowest price per pineapple piece
was found to be 10 shillings while the highest was found to be 40 shillings. The average
mean of pineapple price was found to be 23.55 shillings. Price variable plays a fundamental
role in pineapple marketing because it determines the amount of income to be earned from
2%
64%
34%
Tarmac
Earth
Both

33
pineapple sales. Better output price is the key incentive for the sellers to supply more to the
market. Therefore, higher price is perceived to increase the extent of market participation.
Table 12: Market characteristics in relation to market participation
Variable N Min Max Mean Std
Marketing experience (yrs) 100 3 13 7.19 0.258
Distance to market (Kms) 100 0 50 6.45 0.784
Pineapple price (Kshs) 100 10 40 23.55 0.560
Source: Survey data (2013)
The results in the Figure 4 indicate that 55% of market participants had price
information while 45% did not have. Price information plays the crucial role of informing the
farmers on pricing condition. Therefore, the farmers with price information have more
propensity of participating in the pineapple market than those without.
Figure 4: The percentage of the price information among the market participants
Source: survey data (2013)
4.2.4 Characteristics in relation to choice of marketing outlets
The results in Table 13 on vehicle ownership indicate that 21%, 44% and 96% of
market participants used farm gate, local market and urban market, respectively as the choice
of marketing outlets. This means that the majority of those who sold at urban market owned
vehicles. In essence, vehicle ownership plays a fundamental role of providing the market
45
55
0
10
20
30
40
50
60
Yes No
Per
cen
tage
Response

34
participants with the variety option of marketing outlets, whereas those who do not own are
constrained to market their produce at the farm gate or compelled to hire a vehicle. In terms
of price information, the results reveal that 36%, 65% and 75% of the market participants
who sold at the farm gate, local market and urban market, respectively had an access to price
information. This implies that the majority of market participants who sold at urban market
had an access to price information. Price information aids in acquainting the market
participants with the pricing conditions. In terms of group marketing, the results reveal that
7%, 35% and 71% of the market participants who belong to marketing groups sold their
produce at the farm gate, local market and urban market, respectively. This implied that the
majority of pineapple farmers who marketed their produce at urban market belonged to the
group marketing. Marketing in a group enables the farmers to pull their resource together and
take advantage of economies of scales in marketing. In terms of contract marketing, the
results indicate that 64%, 53% and 17% of the market participants who were under contract
marketing sold their produce at the farm gate, local market and urban market, respectively.
This implied that the majority of those who sold at farm gate were under contract marketing.
Marketing under contract guarantees the farmers with the ready market, hence; the farmers
prefer it to minimize the cost of transportation and that of searching the buyers.
Table 13: Categorical marketing characteristics in relation to marketing outlets
Variable Percentages
Farm-gate Local market Urban market
Vehicle ownership Yes 21 44 96
No 79 56 4
Total 100 100 100
Price information Yes 36 65 75
No 64 35 25
Total 100 100 100
Group marketing Yes 7 35 71
No 93 65 29
Total 100 100 100
Contract marketing Yes 64 53 17
No 36 47 83
Total 100 100 100
Source: Survey data (2013)
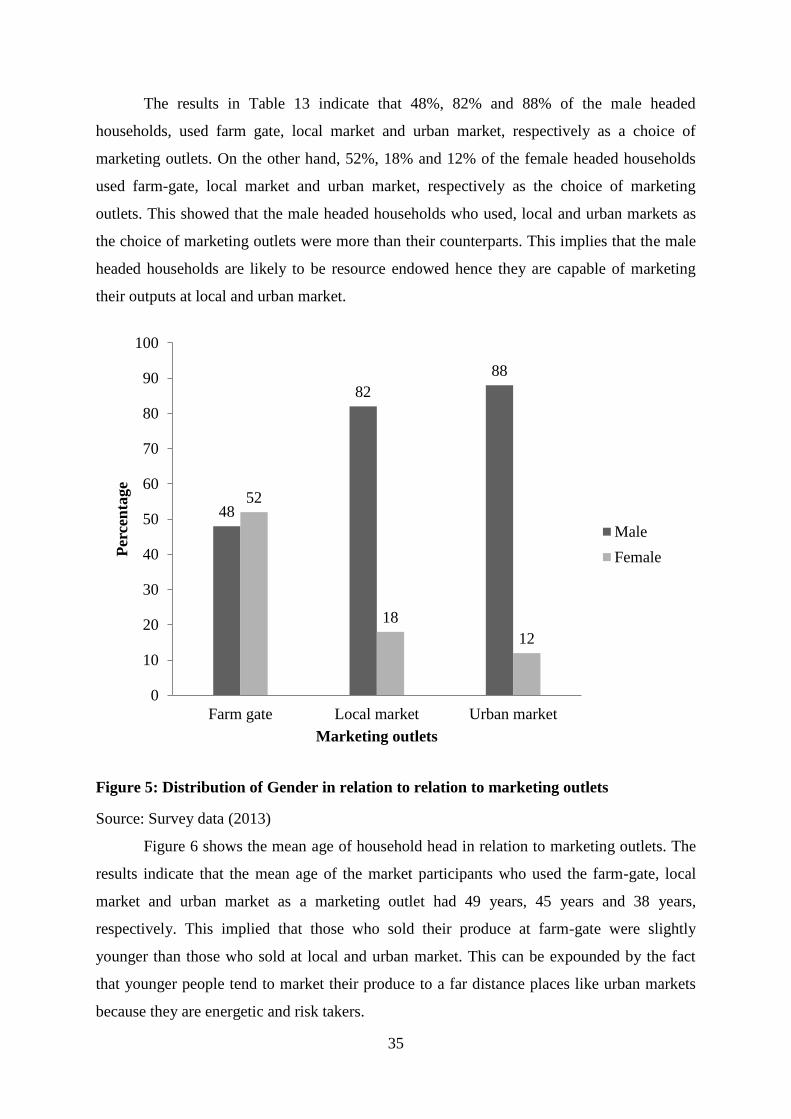
35
The results in Table 13 indicate that 48%, 82% and 88% of the male headed
households, used farm gate, local market and urban market, respectively as a choice of
marketing outlets. On the other hand, 52%, 18% and 12% of the female headed households
used farm-gate, local market and urban market, respectively as the choice of marketing
outlets. This showed that the male headed households who used, local and urban markets as
the choice of marketing outlets were more than their counterparts. This implies that the male
headed households are likely to be resource endowed hence they are capable of marketing
their outputs at local and urban market.
Figure 5: Distribution of Gender in relation to relation to marketing outlets
Source: Survey data (2013)
Figure 6 shows the mean age of household head in relation to marketing outlets. The
results indicate that the mean age of the market participants who used the farm-gate, local
market and urban market as a marketing outlet had 49 years, 45 years and 38 years,
respectively. This implied that those who sold their produce at farm-gate were slightly
younger than those who sold at local and urban market. This can be expounded by the fact
that younger people tend to market their produce to a far distance places like urban markets
because they are energetic and risk takers.
48
82
88
52
18
12
0
10
20
30
40
50
60
70
80
90
100
Farm gate Local market Urban market
Per
cen
tage
Marketing outlets
Male
Female

36
Figure 6: Means age distribution of marketing outlets
Source: Survey data (2013)
The result in Figure 7 shows the level of education of market participants in relation to
marketing outlets. It is evident that the market participants who sold at urban market had
higher levels of education than those who sold at farm-gate and local market. With enhanced
education, market participant has the ability to perceive, interpret and assimilate marketing
information that can lead to informed choice of markets with high level of returns like urban
market.
Figure 7: Education level distribution in relation to marketing outlets
Source: Survey data (2013)
Farmgate, 49
Local market,
45
Urban
market, 38
26
50
22
2
9
55
24
12
0
29
38
33
0
10
20
30
40
50
60
No education Primary level Secondary level Tertiary level
Per
cen
tage
Education level
Farm gate
Local market
Urban market
37
4.3 Econometric results.
4.3.1 Factors influencing market participation and extent of participation
Heckman two-step procedure was used to determine the factors influencing
participation and extent of participation in pineapple marketing. The variables included in the
model were age, gender, household income, education, occupation, household size, pineapple
price, contract, price information, vehicle ownership, marketing experience, group marketing,
pineapple yield, and distance to market. The data were analyzed and post estimation of the
selection equation results was done to obtain the marginal effects. The marginal effects were
used for interpretation, since the coefficients of selection equation have no direct
interpretation. The reason is that they are just values that maximize the likelihood function.
Marginal effects have a direct interpretation (Heckman, 1979).
4.3.1.1 Factors influencing market participation.
To determine the factors influencing market participation of pineapple in Bureti
district, a Probit model was estimated in the first step of the Heckman selection equation. The
results presented in Table 14. Four variables (age, gender, education, and pineapple yield)
were significantly found to influence the farmers‟ decision to participate in the pineapple
market. The Inverse Mills Ratio (IML/Lambda) term was significant and positive at (0.003),
which suggest that the error term in the selection and primary equation is positively
correlated. This implies that unobserved factors that make participation in pineapple
marketing are more likely to be associated with higher scores on the dependent variable. The
marginal effects were used to interpret the results.
Age of the household head significantly and negatively influences market
participation. An increase in the age of household head by one year decreases the probability
of participating in the pineapple market by 0.02%, all other factors held constant. This
implies that the younger people are more enthusiastic to participate in the pineapple market
than the older people are. Barret et al. (2007) stated that younger people participated more in
the market because they are more receptive to new ideas and are less risk averse than the
older people. The finding concurs with that of Chalwe (2011), who found younger people to
participate more than older people in marketing of beans in Zambia.

38
Table 14: The Heckman two-step selection equation result
Variable δy/δx Coef. Std. Err P>|z|
Age -0.0002** -0.0498 0.0241 0.040
Gender 0.0388** 1.1690 0.5550 0.035
Household size -0.0044 0.2781 0.1838 0.130
Education in years 0.0002*** 0.1613 0.0528 0.005
Pineapple yield in Kgs 0.0002*** 0.0528 0.0100 0.000
Vehicle ownership 0.0459 0.1610 0.6412 0.802
Occupation 0.0002 0.0494 0.3997 0.902
Household income -0.0140 0.0823 0.2882 0.775
Mills lambda -0.0690*** -0.0690 -0.0690 0.003
Rho -1.0000
Sigma 0.0690
***: significant at 1% level; **: significant at 5% level; *: significant at 10% level.
Source: Survey data (2013)
Gender of the household head significantly and positively influences market
participation. Being male-headed household increases the probability of participating in the
pineapple market by 3.88%, all other factors held constant. This suggests that the male-
headed households are more market oriented than female, hence they participate more in the
market for cash crops like pineapple. This finding is in line with the argument by Doss (2001)
who argued that men are responsible for providing cash income to the household and to
accomplish this they grow cash and export crop.
The education level of the household head significantly and positively influences
market participation. One year increases in household head‟s education, increase the
probability of participating in the pineapple market by 0.02%, all other factors held constant.
This can be explained by the fact that as an individual access more education he/she is
empowered with the marketing skill and knowledge that will spur individual to participate in
the market. This is in line with Astewel, (2010) who illustrate that if paddy producer gets
educated, the amount of paddy supplied to the market increases, this suggests that higher
level of education provides a greater opportunity for the farmers to participate in the
pineapple market.

39
Pineapple yield significantly and positively influences market participation. An
increase in weight of pineapple yield by one kilogram increases the probability of
participating in the pineapple market by 0.02%, all other factors held constant. This implies
that as the pineapple yield increases, market participation also increases. This is in line with
the findings of Abay (2007) and Adugna (2009) who found that an increase amount of tomato
and papaya yield augment the market supply of these commodities significantly. Tadesse
(2011) also found that avocado and mango quantities had a significant and positive effect on
marketable supply in Gomma Woreda, Ethiopia.
4.3.1.2 Factors influencing the extent of market participation
To determine the factors influencing the extent of market participation in pineapple
marketing, OLS regression was estimated in the second step of the Heckman outcome
equation. The results are presented in Table 15. Six variables (gender, marketing in group,
price information, marketing experience, vehicle ownership and contract) were significantly
found to influence the extent of market participation.
Table 15: The Heckman two-step outcome equation results
Variable Coef. Std. Err. P>|z|
Household income -0.0140 0.0089 0.116
Age in years -0.0000 0.0007 0.980
Gender 0.0387** 0.0177 0.029
Price information 0.0488*** 0.0175 0.005
Contract marketing 0.0464** 0.0197 0.019
Group marketing 0.0385* 0.0201 0.055
Distance to market in Kms -0.0000 0.0015 0.980
Marketing experience 0.0098** 0.0041 0.018
Pineapple yield in Kgs 0.0002 0.0002 0.271
Vehicle ownership 0.0459** 0.0226 0.042
Education in years -0.0002 0.0022 0.916
Occupation -0.0001 0.0120 0.993
Price in Kshs 0.0006 0.0018 0.742
Household size -0.0044 -0.0064 0.499
*: significant at 10% level; **: significant at 5% level; ***: significant at 1% level.
Source: Survey data (2013).

40
Gender of the household head significantly and positively influences the extent of
market participation. Being a male headed household increased the proportion of pineapple
sales by 0.0387. The male-headed households are believed to have strong bargaining power
which in turn increases the proportion of pineapple sales. The result is consistent with that of
Cunningham et al. (2008) who argued that men are likely to sell more due to their acumen in
bargaining, negotiating and enforcing contracts. This argument was advanced by Dorward et
al. (2004) who concluded that the discriminatory tendencies against women tend to weaken
their negotiation prowess and therefore making them less influential in agro-commodity
trade.
Price information significantly and positively influences the extent of market
participation. The result shows that an increase in the price information by one unit increases
the proportion of pineapple sales by 0.0488. Price information is vital instrument during
marketing because it informs the farmers about marketing conditions. Farmers who have
price information prior to marketing tend to sell more of their produce than those without.
The finding is consistent with economic theory by Key et al. (2000) and Alene et al. (2008)
who found the existence of a positive relationship between the price and the proportion of
sales and confirm price to be an incentive to sell.
The coefficient of contract marketing was found to be positive and significant. Being
in contract marketing increases the proportion of pineapple sale by 0.0464. This denotes that
the farmers who were marketing under contract sold more of pineapple produce due to
availability of ready market. The finding is in line with that of Jari and Fraser (2009) who
found an increase in formal market participation with the availability of contractual
agreement amongst smallholder and emerging farmers in the Kat river valley, South Africa.
Group marketing positively and significantly influences the extent of market
participation. The result shows that an increase in group marketing by one person increases
the proportion of pineapple sale by 0.0385. Marketing in the group has enabled the farmers to
pull their resources together and take advantage of economies of scale. Kirsten and Vink
(2005) argued that belonging to a group empowers farmers to bargain and negotiate for better
trading terms. This enhanced trading term increases the extent of market participation among
the pineapple farmers.
Marketing experience positively and significantly influences the extent of market
participation. An increase in a farmer‟s marketing experience by one year increase the
proportion of pineapple sale by 0.0098. The marketing experience has direct relationship with
the farmer‟s level in bargaining prowess and marketing network. This means that the farmers

41
with more years in marketing have higher ability to sell more pineapple produce in the
market. The finding concurs with that of Abay (2007) who found an increase in farmer‟s
experience resulted in the increases of tomato being supplied to the market in Fogere, South
Gonder.
Vehicle ownership positively and significantly influences the extent of market
participation. The result shows that an increase in vehicle ownership by one vehicle increases
the proportion of pineapple sale by 0.0459.Vehicle ownership plays crucial role in lowering
the transport cost as well as boosting the volume of transport and this increases the proportion
of pineapple sales to the market. The finding concurs with the study by Jagwe (2011) on the
impact of transaction cost on the participation of smallholder farmers and intermediaries in
the banana market of Burundi, Rwanda and Democratic Republic of Congo who found the
ownership of bicycle to increase the banana sales.
4.3.2 Factors affecting the choice of pineapple marketing outlets.
The multinomial Logit model was used to determine the factors influencing the choice
of pineapple marketing outlets in Bureti district. The variables included in the estimation
were: age, gender, education, vehicle ownership, pineapple yields, marketing group,
marketing experience, price information, and contract marketing. Table 16 presents the
results of the Multinomial Logit model. The Chi-square value of -63.657 showed that
likelihood ratio statistics are highly significant (P < 0.000) suggesting that the model had
strong explanatory power. The pseudo-R square was 0.4071 indicating the explanatory
variable explained about 40.71% of the variable in the choice of market outlets. Before the
marginal effects were run, the coefficient estimates were run and presented in appendix 1 to
provide only the direction of the effect of the independent variable on the dependent variables
but not the actual magnitude of the change of probabilities. Thus, the marginal effects from
the MNL model, which measure the expected change in the probability of a particular choice
being made with respect to a unit change in an independent variable, are reported and
discussed. The significant value (also known as p-values) show whether a change in the
independent variable significantly influences the Logit at a given level (Gujarati, 2007).

42
Table 16: Marginal effect from Multinomial Logit on the choice of marketing outlets
Farm-gate Local market Urban market
Explanatory variable δy/δx P-value δy/δx P-value δy/δx P-value
Age -0.0654 0.116 -0.1656 0.184 -0.0823 0.178
Gender -0.2649* 0.089 0.2781* 0.062 -0.0133 0.886
Education -0.0088 0.679 -0.0146 0.514 0.0234 0.163
Group marketing -0.3873*** 0.002 0.1752 0.280 0.2121* 0.088
Market experience -0.0719 0.124 0.0510 0.198 0.0144 0.354
Pineapple yield -0.2973*** 0.008 0.3551*** 0.002 0.0578 0.290
Price information -0.1851 0.243 0.2973 ** 0.045 0.1122 0.245
Contract marketing 0.3154* 0.087 -0.2872 0.108 -0.0282 0.725
Vehicle ownership 0.0001 0.990 0.3517** 0.042 0.3616** 0.021
Number of observations = 100 Wald chi2
(18): 87.42
Prob > Chi2 = 0.000 Pseudo R
2 = 0.4071
Log likelihood = -63.657324
***: significant at 1% level; **: significant at 5% level; *: significant at 10% level.
Source: Survey data (2013)
Gender of the household head had a significant influence on the choice of farm-gate
and local market. Male-headed household had a higher probability of selling at local markets
by 27.81%; however, they had a lower probability of selling at farm-gate by 26.49%. A
plausible explanation for this is that male-headed households tend to risk takers thus they are
capable of searching markets in the distance and competitive places like local market.
Conversely, female household's head tends to be confined at home by household chores
hence hindering them from attending the market places. The finding concurs with that of
Morrison et al. (2007), who found that female farmers are faced with gender specific
constraints like a time burden that limit them from accessing the best market for their output.
Group marketing had a significant influence on the choice of farm-gate and urban
market. The farmer who belongs to group marketing had a lower chance of selling at farm
gate by 38.73 %; but also had a higher chance of selling at urban market by 21.21%. The
justification behind this is that the farmers who collectively market their yields to the distant
places like urban markets tend to incur a lower transaction cost. Njuki et al. (2009) stated that
besides reducing transaction costs, collective marketing empowers farmers to negotiate for
better trade terms and prices. This finding is in line with the argument of Jari and Fraser

43
(2009), who stated that the farmers who participate in groups have the ability to reach a
distant market because they are able to share information and broaden social capital within
the groups.
Pineapple yield had a significant influence on the choice of farm-gate and local
market. An increase in the weight of pineapple yields by one kilogram increases the
probability of selling at local markets by 35.51%, while a decrease in one kilogram weight of
pineapple yields increases the probability of selling pineapple at farm-gate by 29.73%. This
means that the farmers who have more yields have more opportunities of selling their
produce at the market places than those with the little produce. The finding is in line with that
of Chalwe (2011), who found more of the beans produced are sold to the private traders in the
market places than to other households at the farm gate.
Price information had a positive influence on the choice of the local market. An
increase in price information by one unit increases the probability of selling the pineapple
yield in the local market by 29.73%. Price information informs the farmer on prevailing
pricing condition. This shows that the farmers who market their produce at local market incur
neither higher transaction cost like urban marketer nor poor prices like farm-gate marketers.
Contract marketing had a positive significant influence on the choice of farm-gate.
The farmers who were under contract in marketing had a higher probability of selling at
farm-gate by 31.54%. Contract marketing guarantees the farmers with a ready market. In
essence, a ready market reduces the farmers‟ costs that are associated with searching the
potential buyers and transport. For this reason, the farmers opt to sell at farm-gate in order to
incur zero transaction cost. The finding is consistent with that of Escobal and Cavero (2007),
who found that marketing of potato at the farm-gate in Peru involves no tax obligation (taxes
are not levied) or trade commitments, since the farm is an open market and there is no
restriction or barrier.
Vehicle ownership had a significant influence on the choice of the local market and
urban market. An increase in the vehicle ownership by one vehicle increases the probability
of selling at local markets and urban markets by 35.17% and 36.16%, respectively. Vehicle
ownership helps in reducing the long distance constraints and aids in offering the greater
depth in marketing choices. The result concurs with argument of Chalwe (2011) who stated
that the availability of on-farm transport increases the probability of transporting goods to
private traders in the market.

44
CHAPTER FIVE
CONCLUSION AND RECOMMENDATION
5.1 Introduction
This chapter summarizes the discussion of results of farmers‟ socio-economic,
institutional and market characteristics of pineapple marketing in Bureti district. It also
summarizes the empirical results of the Heckman two-stage model and multinomial model.
With regards to marketing challenges revealed by the empirical results, policy
recommendations are posited to help in enhancing market participation as well as choice of
marketing outlets among small scale pineapple farmers.
5.2 Conclusion
Socio-economic characteristics like age, gender, education level, vehicle ownership
and pineapple yield were found to have significant influence on pineapple market
participation. Institutional characteristics like road infrastructure, access to extension service,
group marketing and contract marketing were described. The results show that 95% of market
participants did not access extension service to marketing; the reason is because of lack of
market extension officers. Road infrastructure used by pineapple farmers were found to be in
poor conditions, 64% were made of earth's surface. Market characteristics like marketing
experience, price information, distance to market, and pineapple price were also described.
The results revealed that pineapple price were offered at throw away price as low as 10
shillings. Distance to the market was found to have the shortest distance of 0 kilometers and
the furthest distance of 50 kilometers. The 0 kilometers means the farmer‟s market place was
at the farm gate.
Four factors were found to be significant in influencing the pineapple market
participation. Age, gender, education level and pineapple yield positively influences the
decision to participate in pineapple market. Age was negatively significant meaning that
more of younger people participated in pineapple marketing. The rationale behind this is that
younger people tend to be energetic and risk takers. Gender of household head was positive
and significant. Male-headed households tend to be more of a market oriented than female
household heads mainly because men are perceived to be more resource endowed than
women. Education level was positive and significant. This can be explained by the fact that
as an individual gets more educated, marketing abilities and information also increases.
Pineapple yield was also positive and significant, implying that more yield leads to
marketable surplus spurring the individuals to participate in the market.
45
Six factors were found to be significant in influencing the extent of market
participation. Gender, group marketing, price information, marketing experience, vehicle
ownership and contract marketing had a positive influence on the proportion of pineapple
sales. Male-headed household was found to increase the proportion of pineapple sales due to
their acumen in bargaining, negotiating and enforcing contracts. Marketing in groups was
found to positively influence the proportion of pineapple sales because they enable farmers to
pull their resources together and take advantage of economies of scale. Price information
positively influences the proportion of pineapple sales because it informs the farmers about
pricing conditions. For that reason, the farmers will be motivated to sell more of their
produces when they found the prices to be higher. Marketing experience positively influences
the proportion of pineapple sales because it has a direct relationship with the farmer‟s level in
bargaining power and marketing network. This means that the farmers with higher marketing
experiences have higher capacity to sell more of their pineapple produce. Vehicle ownership
positively influences the proportion of pineapple sales because it enhances the volume of
produce to be transported as well as lowering the transport cost. Contract marketing
positively influences the proportion of pineapple sales since it guarantees the pineapple
farmers with the ready market.
Six factors were found to be significant in determining factors influencing the choice
of pineapple marketing outlet. Gender, group marketing, price information, pineapple yield,
contract marketing and vehicle ownership significantly influence the choice of pineapple
marketing outlet. Gender had a significant influence on the choice of marketing outlets.
Male-headed household positively influences the local market as a choice of marketing
outlets and negatively influences the farm gate as a choice of marketing outlet. Male-headed
households tend to risk takers; hence, they are adept at searching market in the competitive
place like local market. Conversely, female-headed households tend to be confined at home
by household chores hence hindering them from attending the market places. Group
marketing positively influences the urban market as a choice of marketing outlet and
negatively influences the farm gate as a choice of marketing outlet. The reason behind this is
that farmers' marketing in a group tends to prefer urban market because of economies of scale
which lower their transaction costs. Price information positively influences the local market
as the choice of marketing outlet. Price information informs the farmer on prevailing pricing
condition. This shows that the farmers who market their produce at local market incur neither
higher transaction cost like urban marketer nor poor prices like farm-gate marketers.

46
Pineapple yield positively influences the local market as a choice of marketing outlet and
negatively influences the farm gate as a choice of marketing outlet. The farmers who had
little produces prefer farm-gate than local market to minimize higher transaction costs.
Contract marketing positively influences the farm-gate as the choice of marketing outlet.
Contract marketing guarantees the farmers with a ready market, hence the farmer opt to sell
at farm-gate in order to incur zero transaction cost. Vehicle ownership positively influences
the local and urban market as a choice of marketing outlets because vehicle ownership helps
in reducing the long distance constraints and aids in offering the greater depth in marketing
choices.
5.3 Recommendations
Based on the results of the study, education level, gender, vehicle ownership, price
information, group marketing and market contracting were significantly found to influence
the pineapple market. The study recommends that for holistic market participation among
pineapple farmers, proper marketing infrastructure like pineapple hub must be put in place.
The government and other policy makers should also increase the marketing information and
abilities of pineapple farmers through avenues like mass media, extension service and other
means of capacity building.
Affirmative action should also be considered for gender awareness; this is done by
empowering more women to engage in pineapple marketing. Group marketing should also be
put as priority in marketing to improve the bargaining position of the pineapple farmers as
well as a means of lowering transaction costs. Government should also invest in rural
infrastructure, especially on the road network to ease conveyance of the pineapple produce
from the area of production to marketing point. Marketing extension services should also be
strengthened to enable the farmers to make good marketing decisions by enabling the farmers
to produce in accordance to marketing requirement, especially on varieties; by training the
farmers in harvesting and post-harvest handling and also by conducting market related
information for the farmers on price trends, future demands and change in consumer
preferences.
Price factors also play a vital role in market participation as well as the choice of
marketing outlet. This implies that farmers with price information are more likely to
participate in pineapple marketing and in the right position to make prudent decisions on an
appropriate market outlet. Therefore, the farmer should be made to access price information
at all time. Dissemination of price information can be done through mass media, government

47
administration, and extension officer among others avenues. Contract marketing should also
be extended to farmers who market their produce at local and urban market. The price of
pineapple at farm-gate was found to be inadequate because the farmers are forced to be price
takers which result in lower prices. Therefore, the pineapple farmers are encouraged to take
their pineapple produce to competitive places like local or urban markets where the prices are
higher.
5.4. Further research
The main intention of the study was to determine the factors influencing market
participation and extent of market participation among the pineapple farmers. It also
determined the factors that influence the choice of marketing outlets. However, the study
proposes further research on:
1. Impact assessment of transaction cost of market participation among pineapple
farmers in Bureti district. There is need to determine the constraints and barriers that
affect the pineapple farmers as they are reflected in transaction cost.
2. The factors that influence the choice of marketing channel among the pineapple
farmers. This study merely studied on the choice of marketing outlets, but not on
marketing channels (the path that the farmers use from production to consumption
point).

48
REFERENCES
Abay, A. (2007). Vegetable Market Chain Analysis: The Case of FogeraWoreda in ANRS of
Ethiopia. An Msc.Thesis Presented to the School of Graduate Studies of Haramaya
University.
Abonesh, T. (2005). Imperfect Competition in Agricultural Markets: Evidence from Ethiopia.
Journal of Development, 76(2): 405-425.
Adegbola, P. and Gardebroek, C. (2007). The Effect of Information Sources on Technology
Adoption and Modification Decisions. Journal of Agricultural Economics, 37 (1): 55-
65.
Adugna, G. (2009). Analysis of Fruit and Vegetable Market Chains in Alamata, Southern
zone of Tigray: The Case of Onion, Tomata and Papaya. An Msc. Thesis Presented to
the School of Graduate Studies of Alemaya University.
Alene, A.D.,Manyong,V.M.,Omanya, G.,Mignouma, H.D., Bokanga, M. and Odhiambo, G.
(2008). Smallholder Market Participation under Transactions Costs: Maize Supply
and Fertilizer Demand in Kenya. Journal of Food Policy, 33:318–28.
Altshul, H. (1998). Output to Purpose Review of DFID‟s Crop Post-harvest Programme,
Value Addition to Agricultural Products. Natural Resources International
Symposium, pp. 53-61.
Amemiya, T. (1985). Advanced Econometrics. Oxford: Basil Blackwell.
Anderson, J. R. (2003). Risk in Rural Development, Challenges for Managers and Policy
Makers. Agricultural Systems, 75: 161-197.
Arega, D.A., Manyong, V.M., Omanya, G., Mignouna, H.D., Bokanga, M. and Odhiambo, G.
(2007). „Smallholder Market Participation under Transactions Cost: Maize Supply
and Fertilizer Demand in Kenya‟. Journal on Food Policy, 33(2008): 318-328.
Asfaw, S.,Shiferaw, B., Simtowe, F., Muricho, G., Abate, T. and Ferede, S. (2010). Socio-
economic Assessment of Legume Production, Farmer Technology Choice, Market
Linkages, Institutions and Poverty in Rural Ethiopia. Nairobi: ICRISAT

49
Astewel, T. (2010). Analysis of Rice Profitability and Market chain: The Case of Fogera
Woreda, South Gondar Zone, Amhara National Regional State, Ethiopia. An Msc.
Thesis Presented to School of Graduate Studies of Haramaya University.
Bahta, S.T. and Bauer, S. (2007). Analysis of the Determinant of Market Participation within
the South Africa Small-Scale Livestock Stock. Utilization of Diversity in Land Use
Systems. Sustainable and Organic Approaches to Meet Human Needs Tropentag
Paper. Tropentag, October 9-11, 2007, WitzenHausen.
Bachmann, J. and Earles, R. (2000). Postharvest Handling of Fruits and Vegetables, ATTRA.
Publication, pp. 116.
Barrett, C.B., Marenya, P.P., Mc Peak, J.G., Minten, B.,Murithi., F.M. and Wangila, J.
(2006). Welfare Dynamics in Rural Kenya and Madagascar. Journal of Development
Studies, 42:248-277.
Barret, C.B. (2009). Smallholder Market Participation: Concepts and Evidence from Eastern
and Southern Africa. Journal of Food Policy, 33: 299-317.
Barrett, B.C. (2007). “Smallholder Market Participation: Concepts and Evidence from
Eastern and Southern Africa.” Prepared for FAO Workshop on Staple Food Trade
and Market Policy Options for Promoting Development in Eastern and Southern
Africa, Rome, March 1-2, 2007. Journal of Food Policy, 33: 299-317.
Belleremare, M.F. and Barrett, C.B. (2006). “An Order Tobit Model of Market Participation:
Evidence from Kenya and Ethiopia.” American Journal of Agricultural Economics,
88:324-337.
Boughton, D., Mather, D., Barret, C. B., Benfica, R., Abdula, D., Tschirley, D. and
Cunguara, B. (2007). “Market Participation by Rural Households in a Low-Income
Country: An Asset- Based Approach Applied to Mozambique”. Journal on Faith and
Economics, 50: 64 – 101.
Branson, E.R. and Norvell, G. D. (1983). Introduction to Agricultural Marketing. U.S.A,
McGraw-Hill, Inc.
Burke, W. (2009). Fitting and Interpreting Cragg‟s Tobit Alternative using Stata. The STATA
Journal, 9: 584-592.
50
CBS (Central Bureau of Statistics). (2005). Geographic Dimensions of Well-Being in Kenya.
Who and Where are the Poor; A Constituency Level Profile Volume II. Central
Bureau of Statistics. The Regal Press Kenya Limited, Nairobi, Kenya.
Cervantes-Godoy, D. and Dewbre, J. (2010). “Economic Importance of Agriculture for
Poverty Reduction”, OECD Food, Agriculture and Fisheries working papers, No. 23.
Chalwe, S. (2011). Factors Influencing Bean Producers‟ Choice of Marketing Channels in
Zambia. An Msc. Thesis Presented to the School of Graduate Studies of Zambia
University.
Chikuvire, T.J., Moyo. M., Murewa, M., Mutenje.M.J.andNkyakudya, I.W. (2006). Hidden
Overburden of Female Headed Households in Guar Bean Production: Zimbabwean
Experience. Journal of International Women’s Studies, 8:1.
Cragg, J. (1971). “Some Statistical Models for Limited Dependent Variables with
Application to the Demand for Durable Goods”. Econometrica, 39 (5): 829-844.
Cunningham, L.T., Brown, B.W., Anderson, K.B and Tostao, E. (2008). Gender Differences
in Marketing Styles. Journal of Agricultural Economics, 38 (1): 1-7.
Delgado, C. (1995). Africa‟s Changing Agricultural Development Strategies: Past and
Present Paradigms as a Guide to the Future, IFPRI.
Delgado, C. (1999). Sources of Growth in Smallholder Agriculture in Sub-Saharan Africa:
The Role of Vertical Integration of Smallholders with Processors and Marketers of
High-Value Items. Journal of Agricultural Economics, 38, 165-189
Dorward, A., Farrington, J. and Deshingkar, P. (2004). Making Agricultural Market Work for
the Poor. Working Paper, Renewable Natural Resources and Agriculture Team, DFID
Policy Division, London.
Dorward, A., Kydd, J., Morrison, J. and Poulton, C. (2005). Institutions, Markets and
Economic Development: Linking Development Policy to Theory and Praxis. Journal
on Development and Change, 36 (1): 1-25.
Doss, C. (2001). Designing Agricultural Technology for African Women Farmers: Lessons
from 25 Years of Experience. World Development, 29: 2075-2092.

51
Dougherty, C. (1992). Introduction to Econometrics. Oxford University Press, New York.
Eaton, C. and Shepherd, A.W. (2001). Contract Farming: Partnerships for Growth. FAO,
Agricultural Services Bulletin 145, Rome.
Eggertson, T. (1990). Economic Behavior and Institutions: Cambridge Survey of Economic
Literature. Cambridge University Press, Cambridge.
Ehui, S., Benin, S. and Paulos, Z. (2009). Policy Options for Improving Market Participation
and Sales of Smallholder Livestock Producers: A Case Study of Ethiopia. Draft
Prepared for Presentation at the 27th Conference of the International Association of
Agricultural Economists (IAAE), 16-22 August 2009, Beijing, China.
Elupe, G. and Nalukenge, I. (2007). Contract Farming, Smallholders and the
Commercialization of Agriculture in Uganda: The Case of Sorghum, Sunflower, Rice
and Poultry Contract Schemes, Uganda Programme for Trade Opportunities and
Policy (UPTOP).
Escobal, J and Cavero, D. (2007). Transaction Cost and Institutional Arrangements in Potato
Marketing by Small Producers in Rural Peru. Paper Prepared for the DFID-Funded
Research Program, Institutions and Pro-Poor Growth (IPPG), June 2007, Peru.
Fafchamp, M. and Hills, R.V. (2005). Selling at Farm-gate or Travelling to Market. American
Journal of Agricultural Economics, 87:717-734.
FAO (Food and Agricultural Organization), (2012). Statistical Database.www.faostat.fao.org.
Goetz, S. (1992). “A selectivity Model of Household Food Marketing Behavior in Sub-
Saharan Africa.” American Journal of Agricultural Economics, 74:444-452.
Cragg, J. (1971). Some Statistical Models for Limited Dependent Variables with Application
to the Demand for Durable Goods. Econometrica, 39 (5): 829-844
Greene, W.H. (2002). LIMDEP Version 8.0 Econometric Modeling Guide, Vol.2.
Econometric Software, Inc., New York.
Greene, W.H. (2000). Econometric Analysis (4th edition). Prentice Hall, New Jersey.
Government of Kenya. (2007). Vision 2030.Government Printers. Nairobi, Kenya.

52
Government of Kenya, (2010). Kenya Population and Housing Census. Government Printers.
Nairobi, Kenya.
Government of Kenya. (2011). District Farm Management Guidelines-2011 from Ministry of
Agriculture: Bureti District.
Guiterrez, M. (2003). Macro Economics: Making Gender Matter Concepts, Policies and
Institutional Change in Developing Countries. Zed Book, June.
Gujarati, D. (1992). Essentials of Econometrics. McGraw–Hill, New York.
Gujarati, D.N. (2003). Basics Econometrics (4th
edition). McGraw-Hill, New York. pp. 563-
636.
Gujarati, D.N., Sangeetha, N. (2007). Basics Econometrics (4th
edition). Tata Mac Graw-Hill
publishing company limited, New Delhi
Heckman, J. (1979). Sample Selection Bias as a Specification Error. Econometrica, 47:153–
161.
Hobbs, J.E. (1997). “Measuring the Importance of Transaction Costs in Cattle Marketing.”
American journal of Agricultural Economics, 79(4): 1089-1095.
Hoffman, R. and Kassouf, A.L. (2005). Deriving Conditional and Unconditional Marginal
Effects in Log Earning Equations Estimated by Heckman‟s Procedure. Applied
Economics, Londres, 37:829-844.
Holloway, G, Nicholson, C., Delgado, C., Staal, S. and Ehui, S. (2004). A Revised Tobit
Procedure for Mitigating Bias in the Presence of Non-zero Censoring with an
Application to Milk Market Participation in the Ethiopian Highlands. Journal of
Agricultural Economics, 31:97-106.
Holloway, G. and Ehui, S. (2002). Expanding Market Participation among Smallholder
Livestock: A Collection of Studies Employing Gibbs Sampling and Data from the
Ethiopia Highlands. Socio-Economic and Policy Research Working Paper 48. ILRI,
Nairobi, Kenya.

53
Jagwe, J., Machethe, C. and Ouma, E. (2010). Impact of Transaction Cost on the
Participation of Smallholder Farmers and Intermediaries in the Banana Market in
Burundi, Democratic Republic of Congo and Rwanda. African Journal on
Agricultural and Resource Economics, 6:1.
Jari, B. (2009). “Institutional and Technical Factors Influencing Agricultural Marketing
Channel Choices amongst Smallholder and Emerging Farmers in the Kat River
Valley” Master of Science in Agriculture (Agricultural Economics) Faculty of
Science and Agriculture University of Fort Hare.
Jari, B and Fraser, C.G, (2009). An Analysis of Institutional and Technical Factors
Influencing Agricultural Marketing amongst Smallholder Farmers in the Kat River
Valley, Eastern Cape, South Africa. African Journal of Agricultural Research, 4 (11):
1129-1137.
Key, N., Sadoulet, E. and DeJanvry, A. (2000). Transactions Costs and Agricultural
Household Supply Response. American Journal of Agricultural Economics, 88 (2):
245-259.
Kherallah, M. and Kirsten, J. (2001). The New Institutional Economics: Application for
Agricultural Policy Research in Developing Countries. Markets and Structural Studies
Division, Discussion Paper No. 41, International Food Policy Research Institute,
Washington DC.
Kirsten, J and Vink, N. (2005). The Economics of Institutions: Theory and Applications to
Africa Agriculture. Course Study Material, Department of Agricultural Economics,
Extension and Rural Development, University of Pretoria.
Komarek, A. (2010). The Determinants of Banana Market Commercialization in Western
Uganda. African Journal of Agricultural Research, 5 (9): 775-784.
Maddala, G.S. (1983). Limited-Dependent and Quantitative Variable in Econometric.
(1st edition). Cambridge University Press, Cambridge.
Makhura, M.T. (2001). „Overcoming Transaction Costs Barriers to Market Participation of
Smallholder Farmers in the Northern Province of South Africa‟, PhD Thesis,
University of Pretoria, South Africa.

54
Makhura, M., Kirsten, J. and Delgado, C. (2001). Transaction Costs and Smallholder
Participation in the Maize Market in the Northern Province of South Africa. Seventh
Eastern and Southern Africa Regional Maize Conference, 11-15 February, Pretoria,
South Africa.
Mangisoni, J. (2006). Markets, Institutions and Agricultural Performance in Africa. ATPS
Special Paper Series No. 27. The African Technology Policy Studies Network,
Nairobi.Online:http://www.atpsnet.org/content/files/documents/Special%20Paper%20
Series%2027. Accessed: 20-05-07.
Matthew, N.L. and Toddy, M.S (2009). “Choosing the Right Marketing Channels for Small-
scale Vegetable Producers” Department of applied Economics and Management,
Cornell University.
Matungul, P. M., Ortmann, G. F. and Lyne, M. C. (2002). Marketing Methods and Income
Generation amongst Small-Scale Farmers in Two Communal Areas of Kwa Zulu-
Natal, South Africa. Paper Presented at the 13th International Farm Management
Congress, Wageningen, Netherlands.
Mbene, D.F. (2005). “Investigation of Key Aspects for the Successful Marketing of Cowpeas
in Senegal” PhD Dissertation, Department of Agricultural Economics, Free State
University, South Africa.
Ministry of Agriculture. (2011). District Farm Management Guidelines-2011: Bureti District.
Minot, N. (1999). Effect of Transaction Cost on Supply Response and Market Surplus:
Simulation using Non-Separable Household Models. MSSD Discussion Paper No. 36.
Washington, DC: International food Policy Research Institute.
Minot, N. (2007). Are Poors, Remote Areas Left Behind in Agricultural Development: The
Case of Tanzania. Journal African Economics, Vol. 17.
Minot, N. and Ngigi, M. (2003). Are Horticultural Exports a Replicable Success Story?
Successes in African Agriculture: Building for the Future, IFPRI Paper 7,
International Food Policy Research Institute, Washington DC.

55
Montshwe, B. D. (2006). Factors Affecting Participation in Mainstream Cattle Markets by
Small-Scale Cattle Farmers in South Africa. MSc. Thesis, University of Free State,
Bloemfontein.
Morrrison, A., Raju, D and Sinha, N. (2007).Gender Equality, Poverty and Economic
Growth. The World Bank, Policy Research. Working Paper 4349.
Moti, J. (2007). Econometric Analysis of Horticultural Production and Marketing in Central
and Eastern Ethiopia. PhD Disssertaion. Wageningen University. The Netherlands.
Mugenda, O.M. and Mugenda, A.G. (2003). Research Methods: Quantitative and Qualitative
Approaches, Acts Press, Nairobi, Kenya.
Ngqangweni, S. (2000). Promoting Income and Employment Growth in the Rural Economy
of the Eastern Cape through Smallholder Agriculture. Unpublished PhD Thesis,
University of Pretoria, Pretoria.
Njuki, J., Kaaria, S, Sanginga, P, Kaganzi, E. and Magombo, T, (2009). Community Agro
Enterprise Development, Experiences from Uganda and Malawi, in Scoones and
Thompson.
Norris, E. and Batie, S. (1987). Virginia Farmers‟ Soil Conservation Decisions: An
Application of Tobit Analysis. Southern Journal of Agricultural Economics, 19 (1):
89-97.
Nyoro, J.K., Kirimi, L. and Jayne, T.S. (2004). Competitiveness of the Kenyan and Ugandan
Maize Production: Challenges for Future. Tegemeo Institute Working Paper No. 10.
Obi, A., Pote, P. and Chianu, J. (2011). Market Access: Components, Interactions, and
Implications in Smallholder Agriculture in the Former Homeland Area of South
Africa. Innovations as Key to the Green Revolution in Africa, pp. 1161-1167.
Ogunlege, K.Y. and Oladeji, J.O. (2007).„Choice of Cocoa Market Channels among Cocoa
Farmers in ILA Local Government Area of Osun State, Nigeria‟ Middle-East. Journal
of Scientific Research, 2:14-20.

56
Olwande, J. and Mathenge, M. (2012). Market Participation among the Poor Rural household
in Kenya. Tegemeo Institute, Egerton University, Kenya. Selected Paper Prepared for
Presentation at the International Association of Agricultural Economists (IAAE)
Triennial Conference, Foz do Iguaçu, Brazil, 18-24 August.
Omamo, S.W. (1998). Transportation Cost and Smallholder Cropping Choices: An
Application to Siaya District, Kenya. American Journal of Agricultural Economics,
80:116-123.
Omiti, J.M., Otieno, D.J., Nyanamba, T.O. and McCullough, E. (2009). Factors Influencing
the Intensity of Market Participation by Smallholder Farmers; A Case Study of Rural
and Peri-Urban Areas of Kenya, African Journal of Agricultural and Resource
Economics, 3:71.
Poulton, C., Kydd, J and Dorward, A (2006). Overcoming Market Constraints on Pro-Poor
Agricultural Growth in Sub-Saharan Africa. Journal on Development Policy Review,
24:243-247.
Pryanishnikov, I. and Katarina, Z. (2003). Multinomial Logit Model for Australian Labor
Market. Australian Journal of Statistics, 4:267-282.
Puhani, P.A. (2000). “The Heckman Correction for Sample Selection and its Critique.”
Journal of Economic Survey, 14(1): 53-68.
Pundo, M.O. and Fraser, G.C. (2006). Multinomial Logit Analysis of Household Cooking
Fuel Choice in Rural Kenya: The Case of Kisuma district. Agrekon, 45 (1): 24-37.
Reardon, T. and Timmer, C.P. (2007). “Transformation of Markets for Agricultural Output in
Developing Countries since 1950: How has Thinking Changed?” (2808 – 2855), R.E.
Evenson, and P. Pingali (Eds.). Handbook of Agricultural Economics, 3: Agricultural
Development: Farmers, Farm Production and Farm Markets. Amsterdam: Elsevier
Press.
Renkow, M., Hallstrom, D.G., Karanja, D.D. (2004). Rural Infrastructure, Transactions Costs
and Market Participation in Kenya. Journal of Development Economics, 73 (3): 349-
367.

57
Sall, S., Norman, D. and Featherstone, A.M. (2000). Quantitative Assessment of Improved
Rice Variety Adoption: The Farmer‟s Perspective. Agricultural Systems, 66(2): 129-
144.
Sampson, J.A. (1986). Tropical Fruits (2nd edition). Longman Scientific and Technical
Publisher, pp. 190-215.
Shepherd, A. (1997). Market Information Services: Theory and Practice. FAO (Food,
Agriculture Organization), Rome.
Shiferaw, B.A.,Kebede, T.A. and You, L. (2008). Technology Adoption under Seed Access
Constraints and the Economic Impacts of Improved Pigeon Pea Varieties in Tanzania.
Journal of Agricultural Economics, 39: 309-323.
Shiferaw, B. And Teklewold, H. (2007). Structure and Functioning of Chickpea Markets in
Ethiopia: Evidence Bases on Analyses of Value Chains Linking Smallholders and
markets. Improving Productivity and Market Success (IPMS) of Ethiopian Farmers
Project Working 6. ILRI (International Livestock Research Institute), Nairobi, Kenya.
pp. 63.
Shiferew, B.A., Obare. G., Muricho, G., Silim. S. (2009). Leveraging Institutions for
Collective Action to Improve Market for Smallholder Producers in Less-Favored
Areas. African Journal of Agricultural and Resource Economics, 3:1-18.
Shilpi, F. and Umali-Deininger, D, 2008. Market Facilities and Agricultural Marketing:
Evidence from Tamil Nadu, India. Journal of Agricultural Economics, 39: 281-294.
Simmons, P. (2003). Overview of Smallholder Contract Farming in Developing Countries.
University of New England, Australia.
Tadesse, A. (2011). “Market Chain Analysis of Fruit for Gomma Woreda, Jimma Zone,
Oromia National, Regional State.” An Msc. Thesis Presented to School of Graduate
Studies of Haramaya University.
Thakur, D.S., Harbans, D.R., Sharma, K.D. and Saini, A.S. (1997). Market Supply Response
and Marketing Problems of Farmers in the Hills. Indian Journal of Agricultural
Economics, 52 (1): 139-150.

58
Timmer, P. (1988). “The Agricultural Transformation.” Handbook of Development
Economics, Vol 1, Elsievier Science Publisher B.V.
Tobin, J. (1958). Estimation of Relationships for Limited Dependent Variable. Econometrica,
46:24-36.
Ubi, W., Omaliko, C. P. E., Ubi, M. W. andIbor, O. (2006).The Effect of Nitrogen Fertilizer
Application on the Fibre and Purity of Two Pineapple Cultivars (Ananas comosus).
Global Journal of Agricultural Sciences, 5: 57-59.
Ubi, W., Ubi, M. W. and Osedeke, V. E. (2008). Effect of Nitrogen Fertilizer Rates on Dry
Matter Yield and Quality of Pineapple propagates (Ananas comosus). In Acid Sands
of Cross River State, Nigeria. Global Journal of Pure and Applied Sciences, 14: 1-4.
Wilson, L. G., Boyette, M. D. and Estes, E. A. (1995). Postharvest Handling and Cooling of
Fresh Fruits, Vegetables and Flowers for Small Farms. North Carolina Cooperative
Extension Service, Raleigh, pp. 800-804.
Wooldridge, J.M. (2002). Econometric Analysis of Cross Section and Panel Data.
Cambridge: MIT Press.
World Bank, (2008). World Development Report: Agriculture for Development. World Bank,
Washington, D.C.
Ying, S. and F. K. Warren. “Multinomial Logit Models.” Chapter Presented at SUGI 20 by
Ying. pp. 665-680
Zegeye, T., Tadesse, B., Tesfaye, S., Nigussie, M., Tanner, D. and Twumasi. A. S. (2001).
Determinants of Adoption of Improved Maize Technologies in Major Growing
Region of Ethiopia. Second National Maize Workshop of Ethiopia, 12-16 November,
2001.
Zuniga-Arias, G. and Ruben, R. (2007). Determinants of Market Outlet Choice for Mango
Producers in Costa Rica. In: R, M. Van Boekel, A. Van Tilburg and J. Trienekens
(Eds.), Tropical Food Chains; Governance Regimes for Quality Management.
Wageningen Academic Publishers, pp. 49-67.

59
APPENDICES
Appendix 1: Coefficient Results of Multinomial Logit Regression
Marketing outlet Coef Std. Err Z P >|z|
Farm gate (Base outcome)
Local market
Marketing experience 0.2673 0.1837 1.45 0.146
Group marketing 1.6620 0.8827 1.88 0.060
Price information 1.0957 0.7109 1.54 0.123
Age -0.9609 0.5525 -1.74 0.083
Pineapple produces 1.4517 0.4964 2.94 0.003
Gender 1.2344 0.6936 1.78 0.075
Vehicle ownership -0.7827 0.8831 -0.89 0.375
Contract marketing -1.4263 0.9178 -1.55 0.120
Education -0.0051 0.0919 -0.06 0.956
Urban market
Marketing experience 0.3251 0.2152 1.51 0.131
Group marketing 2.9880 1.0012 2.98 0.003
Price information 0.6509 1.0961 -0.59 0.553
Age -1.5313 0.6900 -2.22 0.026
Pineapple produces 0.1486 0.7223 0.21 0.837
Gender 0.4789 1.1345 0.42 0.673
Vehicle ownership 2.9046 1.5159 1.92 0.053
Contract marketing 1.1792 1.1791 -1.00 0.317
Education 0.2746 0.1940 1.42 0.157
Number of observations = 100 Wald chi2
(18): 87.42
Prob > Chi2 = 0.000 Pseudo R
2 = 0.4071
Log likelihood = -63.657324

60
Appendix 2: Questionnaire
This study is conducted to find out the factors that determine market participation
among small-scale pineapple farmers in Bureti district, Kenya. The information provided will
assist in the formulation of policies and programs that will improve pineapple marketing in
the district. The information will be treated with strict confidentiality.
Questionnaire Identification
Questionnaire number………………………………….
Division ……………………………………………….
Location……………………………………………….
Name of enumerator…………………………………..
Name of farmer……………………………………….
DEMOGRAPHIC DETAILS
A.1. Gender/sex: Male Female (Tick where appropriate)
A.2. Relation to head (Tick where appropriate)
Head Wife Sibling Others ( specify)
A.3. Occupation of the head (Tick where appropriate)
Farmer Businessman Employed Others ( specify)
A.4. Age of the householdhead ……………………………. years
A.5. Marital status of the head
Single Married Widowed Divorced

61
A.6. Household size (number of people living and eating together)………………….
A.7 (a). What is the highest educational level the head of household has completed?
No formal education Primary level Secondary level Tertiary level Others ( specify)
(b). how many years of schooling……………………………….. (Years)
A.8. Indicate the number of employees who assist with farm work
Type of employee Full-time employees Part-time
employees
Family member TOTAL
Number
A.9. What is your employment status and under which income class do you fall in
Employment status Income class(Ksh)
Tick <
1000
1000-
10,000
10,000-
20,000
20,000-
30,000
40,0000-
50,000
>50,000
Full-time
worker
Part-time
worker
Formally
employed
Pensioner
Other
(specify)

62
PHYSICAL CAPITAL/ASSETS
Number How much did it
cost
Current value Source of
investment
House(specify)
Car/motor cycle/bicycle
Overall farm size(in
acres)
Livestock
Farm machinery
Tv
Mobile phone
Electricity
Others (Specify)
PINEAPPLE MARKETING
C. 1. How much pineapples are produced in the farm every day in …….. kgs
C.2. Which markets do you usually use for selling pineapple produced?
Market Reason
Formal market
Informal market
I don‟t sell ( household consumption)
C.3. How many pineapples do you sell every day in ………… kgs
C.4. where do you sell most you pineapples produced
Place Tick where appropriate Reason
Farm gate
local market
Urban market
Other countries ( export)

63
C.5. How many have you been pineapple market ............. yrs
C.7 Do you always find the market for pineapple produced Yes { } or No { }
C.7. If no what happen to unsold pineapple produced(tick where appropriate)
lost to spoilage Eat ( family & friend Sell at low price Store and sold later Process it
C.8. How difficult is it to find the buyer (tick where appropriate)
Easy Fair Difficult
C.9. Is pineapple graded before marketing? Yes { } or No { }.
C.10. Do your perceived grade corresponds with the one that is being used (Explain)
…………………………………………………………………………………………………
………………………………………………………………………………………………..
C.11. Do you have problems meeting the grades? Yes { } or No { }
C.12. What happens with a poor grades pineapple?
…………………………………………………………………………………………………
…………………………………………………………………………………………………..
C.13. In terms of the market outlet you use regularly, what are the main benefits
Receive high price Understand contract Provided input Nearer Others ( specify)

64
C.14. Do you have contractual agreements or a guaranteed/ ready market ( formal or
informal) with any agribusiness outlet e.g. schools, supermarkets e.t.c? Yes { } or No { }
C.15. Do you have regular customer, who always buy from you? Yes { } or No { }
C.16. If yes, how long have you been trading with these customers? .............................
C.17. How well do you know you customer?..............................................
C.18. How is your produce moved to the marketing point ( tick appropriate)
Type of transport
Bike Motorbike Truck Nissan Other (specify)
Own transport
Hired vehicle ( individual)
Hired vehicle ( group)
Public transport
Buyer transport
Move by donkey cart
C.19. How far is marketing point ..................... Km
C.20. How much do you pay for single trip to the market? Ksh …………..
C.21. What general problem do you experience in moving your produce?
Lack of transport Small size of transport High transport cost Others ( specify)
C.22. Complete the below for payments and how long it take to receive the payments
List the marketing outlet How are you paid Time taken for payment
cash Cheque Other (specify)

65
C.23.When selling do you combine, with other farmers?
Yes Reason No You don‟t sell at the same time
It is lower cost You don‟t sell at same market
Increase bargaining power You conflict
Share market knowledge They will degrade you produce
Specify (others) Specify ( others)
C.24. Before selling your produce what value adding activities do you performs? (Tick)
Activity Tick Importance
Washing
Packaging
Cutting
Processing
Specify ( others)
INFRASTRUCTURE
D.1. What type of road do you use to the market
Tarmac Rough Both
D.2. In your own opinion, how do you rate your road?
Fine Good Bad
D3. Are you satisfied with the number of road that links you to the market? Yes { } or No { }
D.4. Does market stalk exist in your area Yes { } or No { }
D.5. If it exist, what is the condition of marketing stalks you have access to?

66
Unavailable Bad Good Fine
D.6. In your own opinion do you think marketing stalk are important? Explain
…………………………………………………………………………………………………
…………………………………………………………………………………………....
MARKETING INFORMATION
E.1. Do you have access to market information? Yes { } or No { }.
E.2. Do you receive market information prior to sale Yes { } or No { }
E.3. What are your sources of information
Sources Type of information ( provided)
Rank Prices Date
for sale
Buyer Market
demand
Market
opportunies
Others
( specify)
Public administration
Buyer
Extension officers
Friends
Co- farmers
Media
Others ( specify)
E.4. How often do you receive the information?
Daily Weekly Monthly Annually Others ( specify)
E.5. How do you want information to be delivered
Through media Through cellphone Through
extension officer
Through
farmers group
Specify (others)

67
E.6. Which language is use to deliver information?...........................................
E.7. Do you consult other farmer, before making decision Yes { } or No { }
E.8. What do you normally consult others farmers about?
…………………………………………………………………………………………………
……………………………………………………………………………………………
EXTENSION SERVICE
F.1 Do you have contact with extension officers during marketing period? Yes { } or No {}.
F.2. what service are provided by extension officers
Advice on marketing Advice on processing Specify ( other)
F.3. Are the extension officers are always available when you need help?
Never available Sometime available Always available
F.4. List the problem you encounter when you contracting extension officers
…………………………………………………………………………………………………
…………………………………………………………………………………………………
…………………………………………………………………………………………………
PRICING
G.1. At what price do you sell per pineapple in Ksh ……………..
G.2. Do you perform price surveys, before selling Yes { } or No { }

68
G.3. How is price set during sales?
I set the price We negotiate It is market driven It is dictated by the buyer Specify
(others)
G.4. How do you decide the sale price of your produce? Tick where appropriate
Very
important
Important Not
important
a) It depends on the price of other local farmers
b) It depends on the price of international farmers
c) It depends on the market we sell to
d) It depends on the production costs
e) It depends on the concentration of the market
f) It depends on the transaction costs
G.5. How do the price that the buyer is willing to pay differ from your expectation
Lower than expected Equal Higher than expected
G.7. When selling who negotiate on your behalf?
…………………………………………………………………………………………………
……………………………………………………………………………………………
G.8. When negotiating, which language is used?
Own language ( Name it) English Kiswahili

69
G.9. If not own language, are you able to negotiate as well as you would do if you were to
use you own language………………………………………………………………………….
G.10. List what you consider to be the major problems you face in marketing your goods
…………………………………………………………………………………………………
…………………………………………………………………………………………………
…………………………………………………………………………………………………
…………………………………………………………………………………………………
……………………………………………………………………………………......................
......................................................................................................................................................
.................................................................................................................................................
G.11. Suggest ways in which such problems can be addressed
…………………………………………………………………………………………………
…………………………………………………………………………………………………
…………………………………………………………………………………………………
…………………………………………………………………………………………………
…………………………………………………………………………………………………