determinants of investment in muslim developing countries ... · int. journal of economics and...
TRANSCRIPT

Int. Journal of Economics and Management 3(1): 100 – 129 (2009) ISSN 1823 - 836X
Determinants of Investment in Muslim Developing Countries: An Empirical
Investigation
MOHAMMAD SALAHUDDINa*, MD. RABIUL ISLAMb AND SYED ABDULLAH SALIMc
a Southeast University, Bangladesh b Monash University, Australia
c Darul Ihsan University, Bangladesh
ABSTRACTInvestment has widely been regarded as one of the main driving forces of economic growth. Despite enormous growth potentials and resources, the overall investment rates of most of the Muslim developing countries are relatively lower than those of non-Muslim developing countries. Therefore, this paper attempts to investigate the gross investment behavior in a panel of 21 Muslim developing countries over the period of 1970 to 2002. Fixed Effects estimator is used to capture unobserved country specific effects. 2-Step 1st Difference Generalized Method of Moments (GMM) dynamic panel estimator is employed to offset endogeneity of the regressors. Granger causality test is performed to see whether reverse causality exists. Robustness of estimated results using WDI (2004) data is checked by re-estimating the models using PWT (6.2) data. Results suggest that the lagged investment, growth rate of per capita real GDP, domestic savings, trade openness and institutional development have positive significant effect on investment. In addition, foreign aid and private sector credit are found to have significant positive impact on investment but not robust. Foreign debt servicing has consistent negative effect on investment. Other variables such as, inflation rate, lending rate, human capital and population growth have been found to have no significant effect on investment. Finally the study recommends that these countries should pursue policies that encourage more domestic resource mobilization reducing dependence on foreign debt and increase per capita real GDP growth, trade openness, domestic savings and institutional development in order to boost gross investment.
Keywords: Investment, Panel Data, Muslim and Developing
* Corresponding author: E-mail: [email protected] saAny remaining errors or omissions rest solely with the author (s) of this paper.

101
Determinants of Investment in Muslim Developing Countries: An Empirical Investigation
INTRODUCTIONOver the years, investment has been a very powerful variable in macroeconomic development in developing countries. It has been an issue of grave concern and enormous interest to policy makers. The notion that raising the investment rate is key to long run growth has been at the heart of growth thinking since the times of David Ricardo. The strong association between investment and long term growth performance is a well-established empirical fact(see for e.g. Kuznets, 1973). Indeed, most country experiences of sustained growth tend to stress the link between capital accumulation and GDP growth. The case of East Asia, the most successful regional experience in terms of rapid and sustained growth of the last three decades is a good example in this regard.
High savings and investment rates are important in view of their strong and positive association with the GDP growth rate as suggested by endogenous growth theory (Romer, 1986; Lucas, 1988). The empirical evidence (see for example Levine and Renelt) also indicates that there exists a robust positive correlation between the investment rates and GDP growth. Many studies have identified investment as the most significant transmission mechanism via which other variables affect growth (see revised version of Gomanee et al., 2002). Many empirical studies (Hernandez-Cata, 2000; Ndikumara, 2000; Ben-David, 1998; Chari, Kehoe and Mc Grattan, 1997; Barro and Lee, 1994; Collier and Gunning, 1999; Barro, 1995; Ghura and Hadjimichael, 1996; Khan and Reinhart, 1990; Kormendi and Meguire, 1985) conducted in Africa, Asia and Latin America established the critical linkage between the rate of investment and growth.
Despite enormous growth potentials and resources the overall growth and investment rates of most of the Muslim developing countries are on an average lower than those of non-Muslim developing countries. Economic growth and development are uneven in these countries. While some countries are oil exporters with high growth potentials, others are agricultural poor countries. Higher consumption pattern and narrow manufacturing sector are common phenomena in these countries. Those Muslim countries which are endowed with oil are expanding their service sectors, while non-oil countries mostly depend on their agricultural sector. The levels of savings and investment in most of the Muslim developing countries are not satisfactory (OIC Outlook, 2008). Low level of technological development, poor industrialization with high production costs, less trade and financial openness, lower savings, political instability, lack of infrastructure, poor institutions, high foreign debt etc. are among potential challenges the Muslim countries face to achieve their investment and growth targets (Raimi & Mobolaji, 2008).
Therefore, the objective of this study is to examine the potential factors that determine investment behavior in 21 Muslim developing countries over the period of 1970 to 2002. The rest of the paper is organized as follows: Section II deals with the theories of investment while section III reviews relevant empirical literature
102
International Journal of Economics and Management
available on the topic. Section IV illustrates methodology, data analysis, and limitations of the study. Section V discusses empirical findings. Finally, section VI concludes with major policy implications.
THEORIES OF INVESTMENTKeynes (1936) first called attention to the existence of an independent investment function in the economy where he insisted that there is no reason for ex-ante savings to be equal to even though they are identical ex-post. The next development in investment theory is accelerator theory which suggests that investment is a linear proportion of changes in output. In accelerator models (Chenery 1952 and Koyck 1954) investment is independent from the price of capital. Jorgenson(1971) and others accommodated this missing element in the neoclassical model of investment. Both the accelerator and the neoclassical models of investment behavior are output-based models. In sharp contrast to these models, Tobin’s Q theory of investment attempts to explain investment behavior in terms of portfolio balance (Tobin, 1969).
Another approach dubbed “neoliberal” proposed by McKinnon (1973) and Shaw(1973) emphasizes the importance of financial deepening and high interest rates in stimulating growth. According to this view, investment is positively related to the real rate of interest in contrast with the neoclassical theory. The reason for this is that a rise in interest rates increases the value of financial savings through financial intermediaries and thereby raises investible funds, a phenomenon McKinnon calls “conduit effect”.
Recent investment literature has introduced an element of uncertainty into investment theory. It has paid considerable attention to the relationship between uncertainty and investment. The theoretical predictions are ambiguous. Depending on their underlying assumptions, most of the approaches predict a negative relationship while a few others predict a positive one. Different forms of uncertainty are considered in investment literature. For example, uncertainty arising from investment irreversibility ,see Pindyck 1991, Dixit 1992, Goldberg 1993 etc., uncertainty related to economic instability, see Rodrik 1991 and more recently Beaudry et. al. 2001 and Serven 2003, and finally uncertainty emanating from sociopolitical instability (see Alesina and Perotti 1996; and Campos and Nugent 2003).
EMPIRICAL LITERATURESince the 1980’s, a number of studies successfully demonstrated the importance of financial variables to explain investment behavior. The hierarchy of finance models suggest that investment expenditure is affected by the availability of internally generated funds ( Fazzari et al. (1998)), Hoshi et al. (1995), and Bond

103
Determinants of Investment in Muslim Developing Countries: An Empirical Investigation
and Meghir(1994) regarding the role of financial variables under asymmetric information assumption.
Stiglitz and Weiss (1981) and Greenwald et al. (1984) recommend the view that it is the availability of capital rather than its cost that significantly influence investment. McKinnon (1973) and Shaw(1973) in financial repression hypothesis focus on ‘complimentarity’ between money and capital in developing countries. Recent empirics on finance-growth nexus tried to illuminate path through which financial variables influence growth via its effect on total factor productivity growth and investment- (King and Levine (1993a,b)), Benhabib and Spiegel (2000), and Beck et al. (2001).
Many studies report that the regression coefficient of saving and investment is small in developing countries. The ground-breaking work of Feldstein and Horioka (1980) reveals that the cross-section saving –investment correlation is high in the OECD (Organization of Economic Cooperation for Development) countries implying low capital mobility-this is popularly known as Feldstein-Horioka (F-H) puzzle Since then, many authors find supportive evidence for F-H puzzle while many others do not. Authors such as Dooley et al. (1987), Wong (1990), Vamvakidis, and Wacziarg (1998) use data on developing countries and find that the estimated coefficient between saving and investment is very low or close to zero indicating the presence of high capital mobility among developing countries. This draws keen attention of researchers in the field. However, Dooley et al. (1987); and Isaksson (2001) attribute this finding to foreign aid while Wong (1990) explains it with saving-investment correlation to non-traded sector. Although the idea of capital mobility stemming from saving-investment correlation cannot be ruled out completely, researchers unanimously recognize the relation between the two and its consequent influence on economic growth.
From the vast existing literature on saving-investment relationship, it is evident that domestic savings positively influence investment. Salahuddin and Islam(2008) also corroborate this relationship. Since saving is very low in developing countries because of low income, it is suggested that (Were, 2001) savings should be supplemented by foreign resources. Foreign resources can positively contribute to investment due to conditionalities attached to them.
Trade openness also affects investment. The world’s two fastest growing economies, China and India have been greatly benefited from undertaking and implementing a number of openness measures. Positive effects of trade liberalization on reducing financial constraints have been found in studies by Harris, Schiantarelli and Siregar (1994) for Indinesia, Guncavdi, Blenney and Mckay (1998) for Turkey and Gellos and Werner (2002) for Mexico. Bekaert, Hurvey, and Lundblad (2005) use cross country panel data and find that liberalization of stock market enhances economic growth and investment. Demir (2005) shows that due to increased risk after liberalization, firms prefer to invest in financial sector.

104
International Journal of Economics and Management
Foreign debt is usually high in developing countries. Acosta and Loza (2005) warn that over-indebtedness contributes to the vulnerability of macroeconomic policies something which is likely to discourage investment. Dependency ratio which is relatively higher in developing countries is likely to affect investment and economic sustainability negatively due to low participation of work-age population in economic activities. Another variable- foreign aid may have positive role to influence investment if properly utilized (Salahuddin & Islam, 2008).
Education attainment is a key determinant of human capital which is an important driver of labor productivity. A higher initial stock of human capital indicates a higher ratio of human to physical capital which tends to generate higher growth rate through absorption of superior technology (Barro, 2001).The level of human capital not only enhances the ability of a country to develop its own technological innovation, but also increases its ability to adopt the already existing knowledge (Nelson & Phelps, 1966).
Social scientists from time to time have pondered over the problem of population growth, and rendered their individual opinions on it. Thomas Malthus, an English economist, gained fame by bringing the problem of population growth to the forefront in 1798. His central argument was that population grows at a geometric rate while food output grows at an arithmetic rate, and that makes food scarcity inevitable. His theory was later dismissed for promoting pessimism on the ground that it failed to consider technological advances in agriculture and food production.
One important factor that plays a key role in population growth is the level of education. The higher the level of education of people is, the less they tend to grow. The major reason is that an educated person is apt to delay marriage or having a child until a steady income has been secured. The education levels in the affluent societies being high, their growth rates have fallen. As both parents are often busy with their careers, they have little time or interest in nurturing too many kids. In this regard, education of girls is especially important, argues economist Jeffrey Sachs in his book - Common Wealth: Economics for a Crowded planet, 2008. Increased education of women leads to a sharp fall in fertility, and hence in population growth in developing countries. The neoclassical Solow growth model, augmented Solow model and endogenous growth models all predict a negative relation of high population growth rate to lower per capita output in the long run and vice versa (McMahon,1999).
High inflation rates may have adverse impact on investment by increasing risk associated with long term projects. Inflation could lower the productivity growth by about the same amount, as well as lowering output growth by decreasing real investment (Fischer, 1993). Another variable financial development may reduce financing constraints and thus accelerate growth by increasing investments. Financial system could encourage investment and growth through mobilizing

105
Determinants of Investment in Muslim Developing Countries: An Empirical Investigation
savings, allocating capital funds, monitoring the use of funds, managing risk and encourage innovation (King & Levine, 1993).
Institutional factors, such as Political and social factors are considered to have significant effect on investment. In a study on 32 countries, Ozler and Rodrik (1992) show that political rights are conducive to better investment atmosphere. Le (2004) finds a significant effect of political stability on investment. Stasavage (2002) argues that a shift from authoritarian rule to multi-party system influences investment positively.
Empirical studies on uncertainty and investment are relatively limited. Most of them are confined to a few single-country studies focusing on the U.S. and the U.K., in addition to a handful of cross-country papers(see for example, Federar 1993, Driver and Moreton(1991) and Price (1995, 1996) for single-country studies and Hasman and Gavin (1995), Bleany (1996) for developing countries.
Thus a number of explanatory variables are considered to determine investment behavior in countries selected for our study. Not all the variables discussed above are included in our model as data on some variables either do not exist or are not adequate.
METHODOLOGY, DATA ANALYSIS AND LIMITATIONSMethodologyPanel data analysis allows us to exploit both the time-series variation and cross-sectional heterogeneity of the respective variables used in our econometric estimation. Therefore, our study uses unbalanced panel data on investment and potential determinants of investment for selected 21 Muslim developing countries over the period of 1970 to 2002.1 All the Muslim countries included in this study fall under the category of developing countries according to the World Bank classification in 2006 .2 Most of these countries gained independence during mid-60s and early 70s and thus we start our data series from 1970. The necessary data are compiled from the World Development Indicator (WDI) CD-ROM 2004 where the ending year is 2002. For robustness check, the ratio of gross investment to GDP in PPP is extracted from the 6.2 version of the Penn World Tables database (PWT 6.2-Heston, Summers and Aten, 2006). The Muslim countries are selected based on data availability for the required variables. The nature of our panel is
1 21 developing countries are : Albania, Algeria, Bangladesh, Chad, Egypt, Ethiopia, Indonesia, Iran, Jordan, Malaysia, Mali, Mauritania, Morocco, Niger, Oman, Pakistan, Saudi Arabia, Senegal, Syria, Tunisia and Turkey2 According to the ‘World Bank Classification’ based on 2006 GNI per capita, the range of the GNI per capita in developing countries is US$ 11,115 to less.

106
International Journal of Economics and Management
unbalanced because data are not available for all the sample countries for all the specified time periods.
Although 5-year average filtering is commonly used in macroeconomic panel data analysis to capture long run relationship by avoiding business cycle fluctuations, such artificial averaging may lose significant annual information and may not be effective to eliminate business cycle fluctuations. Averaging may also discard possible cross sectional heterogeneity in the parameters and measure an overall effect over a given time window (Attanasio et al, 2000).Therefore, we estimate our panel regression using yearly time series and exploring the possible heterogeneity across sample countries.3 The primary interest of this paper is to investigate important factors which affect gross investment in these selected Muslim countries. The estimating model takes the following form:
INV INV X,it i i t it it1a b f= + + +- l (1)
where, INV is the ratio of gross domestic investment to GDP (INVW indicates investment data from WDI 2004, whereas INVP specifies investment data from PWT 6.2), ‘a’ is the constant term, ‘X’ is the vector of potential variables affecting gross investment, and ‘e’ is independent and identically distributed random error term with zero mean and constant variance. The subscript ‘i’ denotes a particular country and ‘t’ indicates a particular time period. In our baseline specification, we include one period lagged investment, growth rate of per capita real GDP (GR), trade openness measured by the sum of exports and imports over GDP (TR), and the ratio of gross domestic savings to GDP (DS) as explanatory variables. In extended model, we incorporate two important policy variables, such as the ratio of foreign aid to GNI (AID) and the ratio of total debt service to GNI (DB). Later we include other potential determinants of investment one by one into our baseline specification to examine their relevant effect on investment. The additional explanatory variables comprise the inflation rate (INF), the lending interest rate (LR), financial development measured by the ratio of private sector credit to GDP (PC) , human capital proxied by secondary school enrollment ratio (SEC), population growth rate (POP) and institutional development measured by the institutional index based on ICRG Composite Risk Rating (0=highest risk, 100=lowest risk) (ICRG).
Equation (1) shows pooled ordinary least squares (OLS) relationship between the gross investment (INV) and its potential determinants and thus we can argue that there could be unobserved country specific characteristics, such as, investment climate, policy changes etc. which might affect the gross investment and are not
3 We also conduct 5 year averages estimation and our results are not significantly different from yearly panel estimation. Considering yearly data, we can use different estimators for robustness check without losing significant degrees of freedom, which may not be possible in 5-year average in the case for our small sample. The 5-year average results will be provided on request.

107
Determinants of Investment in Muslim Developing Countries: An Empirical Investigation
captured by our pooled OLS model. These unobserved country specific effects may be correlated with the regressors and thus we need to control those unobserved time invariant country specific effects by allowing the error term ( itf ) to include a country-specific fixed effects ( ii ). Again by allowing the error term ( itf ) to include time dummies ( tt ), we can easily capture common macroeconomic shocks that might have significant impact on gross investment in our sample. Therefore, by incorporating both the fixed effect and time dummies into equation (1), we can now construct our empirical panel model in the following form:
INV INV X e,it i i t it i t it1a b i t= + + + + +- l (2)
where, eit i t itf i t= + + and eit is serially uncorrelated error. Incorporating such fixed effects (as in equation 2) within the regression model, this panel study removes potential heteroscedasticity problems resulting from possible differences across countries (Greene, 2003). Besides we use robust standard error to reduce heteroscedasticity and autocorrelation problem in our estimation.
Equation (2) shows fixed effects estimation by capturing time invariant country specific effects. Such fixed effects model may suffer from biases due to possible endogeneity of the regressors while lagged independent variable is included as an explanatory variable (Nickell, 1981).The lagged dependent variable may be correlated with the error term and thus endogeneity problem may occur. The potential factors affecting gross investment may be endogenous. Since causality may run in both directions, these explanatory variables may be correlated with the error term. Again time invariant fixed effects may be correlated with the error term and thus possible endogeneity could produce biased results. In order to reduce such endogeneity problem, instrumental variable method such as generalized method of moments (GMM) is widely used, where the possible endogenous explanatory variables are instrumentalized with their suitable lags so that the instruments are not correlated to the error term. Anderson and Hsiao (1982) suggested a first difference transformation of equation (2) to get rid of fixed effects as well as constant. However, a correlation still remains between the lagged dependent variable and the differenced error term. Therefore, one can use second and subsequent lags of dependent variable as instruments for the lagged differenced dependent variable.
Arellano and Bond (1991) however, argue that the Anderson-Hsiao estimator fails to take all orthogonality conditions and thus it is not an efficient estimator. Therefore, they propose 2-Step 1st difference GMM estimator as a system of equations allowing lagged values of the endogenous regressors as instruments. Arellano and Bover (1995) and Blundell and Bond (1998) argue that the lagged level of the endogenous variables may be poor instruments for the first differenced variables and thus they suggest lagged differences as instruments which is popularly known as system GMM. In order to obtain consistent results in system GMM, the number of cross section units should be higher than the number of instruments

108
International Journal of Economics and Management
(Alvarez & Arellano, 2003). Since we have only 21 cross section units and 32 year time period, the number of instrument will be greater than 21 in system GMM and thus our results may not be representative. Therefore, in order to obtain reliable results in our small sample estimation, we use Arellano and Bond (1991) 2-Step 1st difference GMM estimator.
Arellano and Bond (1991) prescribe several specification tests that are needed to satisfy while using 2-Step 1st difference GMM estimators. Therefore, the validity of the instruments used can be tested by reporting both a Sargan test of the over-identifying restrictions, and direct tests of serial correlation in the residuals or error terms. The key identifying assumption in Sargan test is that the instruments used in the model are not correlated with the residuals. The AR(1) test checks the first order serial correlation between error and level equation. The AR(2) test examines the second order serial correlation between error and first differenced equation. The null hypotheses in serial correlation tests are that the level regression shows no first order serial correlation as well as the first differenced regression exhibit no second order serial correlation. Lastly, the F-test demonstrates joint significance of the estimated coefficients.
Data AnalysisTable 1 summarizes descriptive statistics for the respected variables used in our empirical study for selected 21 Muslim developing countries. There is a wide variation of the mean value of the potential determinants of gross investment across our sample. By examining mean, maximum, minimum and standard deviation (Std. Dev.) of each of the variables for the entire sample observation (Obs.), it is quite clear that the dataset does not have any such outlier which is likely to have significant influence over the estimated results.
Table 1 Descriptive statistics for 21 muslim developing countries (1970 – 2002)
INVW GR TR DS DB AID INF LR PC SEC POP ICRG
Minimum 2.73 -27.90 8.87 -20.50 0.00 -0.48 -13.10 4.82 1.92 1.12 -2.76 25.50
Maximum 58.90 23.60 229 80.50 21.10 59.30 226.00 32.20 159.00 86.90 11.18 81.80
Mean 21.98 1.60 61.46 16.58 5.11 6.75 11.11 12.64 29.37 38.80 2.63 58.93
Std. Dev. 8.01 5.98 33.19 14.81 4.05 8.10 17.52 4.47 23.56 24.14 1.01 11.52
Obs. 657 659 661 657 617 654 570 308 627 304 693 354
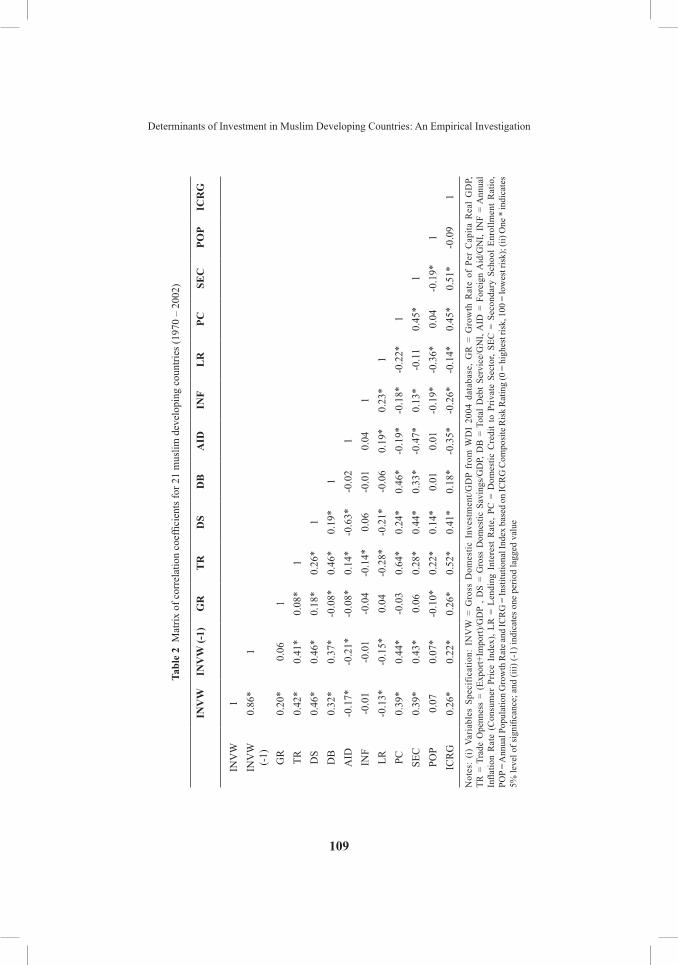
Table 2 presents correlation matrix for our concerned variables and demonstrates that there is no evidence of too high correlations (0.80 or more) between the variables which may result multicollinearity problem in the estimation and thus produce instability in the parameter estimates. This can be evident from the following Variance Inflation Factor (VIF) analysis.
109
Determinants of Investment in Muslim Developing Countries: An Empirical Investigation
Tabl
e 2
Mat
rix o
f cor
rela
tion
coef
ficie
nts f
or 2
1 m
uslim
dev
elop
ing
coun
tries
(197
0 –
2002
)
INV
WIN
VW
(-1)
GR
TR
DS
DB
AID
INF
LR
PCSE
CPO
PIC
RG
INV
W1
INV
W
(-1)
0.86
*1
GR
0.20
*0.
061
TR0.
42*
0.41
*0.
08*
1D
S0.
46*
0.46
*0.
18*
0.26
*1
DB
0.32
*0.
37*
-0.0
8*0.
46*
0.19
*1
AID
-0.1
7*-0
.21*
-0.0
8*0.
14*
-0.6
3*-0
.02
1IN
F-0
.01
-0.0
1-0
.04
-0.1
4*0.
06-0
.01
0.04
1LR
-0.1
3*-0
.15*
0.04
-0.2
8*-0
.21*
-0.0
60.
19*
0.23
*1
PC0.
39*
0.44
*-0
.03
0.64
*0.
24*
0.46
*-0
.19*
-0.1
8*-0
.22*
1SE
C0.
39*
0.43
*0.
060.
28*
0.44
*0.
33*
-0.4
7*0.
13*
-0.1
10.
45*
1PO
P0.
070.
07*
-0.1
0*0.
22*
0.14
*0.
010.
01-0
.19*
-0.3
6*0.
04-0
.19*
1IC
RG
0.26
*0.
22*
0.26
*0.
52*
0.41
*0.
18*
-0.3
5*-0
.26*
-0.1
4*0.
45*
0.51
*-0
.09
1
Not
es:
(i)
Vari
able
s Sp
ecif
icat
ion:
IN
VW
= G
ross
Dom
estic
Inv
estm
ent/G
DP
from
WD
I 20
04 d
atab
ase,
GR
= G
row
th R
ate
of P
er C
apita
Rea
l G
DP,
TR
= T
rade
Ope
nnes
s =
(Exp
ort+
Impo
rt)/G
DP
, DS
= G
ross
Dom
estic
Sav
ings
/GD
P, D
B =
Tot
al D
ebt S
ervi
ce/G
NI,
AID
= F
orei
gn A
id/G
NI,
INF
= A
nnua
l In
flatio
n R
ate
(Con
sum
er P
rice
Inde
x), L
R =
Len
ding
Int
eres
t R
ate,
PC
= D
omes
tic C
redi
t to
Priv
ate
Sect
or, S
EC =
Sec
onda
ry S
choo
l En
rollm
ent
Rat
io,
POP
= A
nnua
l Pop
ulat
ion
Gro
wth
Rat
e and
ICR
G =
Inst
itutio
nal I
ndex
bas
ed o
n IC
RG
Com
posi
te R
isk
Rat
ing
(0 =
hig
hest
risk
, 100
= lo
wes
t ris
k); (
ii) O
ne *
indi
cate
s 5%
leve
l of s
igni
fican
ce; a
nd (i
ii) (-
1) in
dica
tes o
ne p
erio
d la
gged
val
ue

110
International Journal of Economics and Management
As a common rule of thumb, if the VIF of a variable exceeds 10, which will happen if R-squared exceeds 0.90, the variable is said to be highly collinear, in other word the existence of severe multicollinearity (Gujarati, 2003). VIF of the explanatory variables reported in the Table 3 are far lower (less than 3.0) than the threshold level and thus there is less likely to have multicollinearity problem in our estimation.
Table 3 Variance Inflation Factor (VIF) for multicollinearity test
Independent Variables:
Dependent Variable: Gross Domestic Investment / GDP (INVW) from WDI 2004
Dependent Variable: Investment / GDP in PPP (INVP) from Penn World Table
(PWT 6.2)
Baseline Extended Baseline with PC
Baseline with ICRG
Baseline Extended Baseline with PC
Baseline with ICRG
INV(-1) 1.45 1.60 1.55 1.51 1.08 1.16 1.18 1.09GR 1.03 1.03 1.04 1.09 1.03 1.05 1.05 1.10TR 1.23 1.30 1.34 1.60 1.11 1.66 1.75 1.51DS 1.31 2.48 1.30 1.57 1.14 2.27 1.14 1.29DB 1.36 1.13AID 2.10 2.17PC 1.83 1.88ICRG 1.67 1.68
Limitations of the StudyThe major limitation of this study is that to obtain gross investment, we lumped private investment and public investment together although they presumably are determined by different sets of factors having different roles in the growth process.
In spite of the fact that, theoretical models developed by economics literature make no distinction between the private and public components of investment, there is an emerging appreciation that private investment in general is more efficient than public investment and hence they should be treated differently. However, we had no other choice as the separate data on private and public investment were not available for most of the selected countries in this study.
EMPIRICAL RESULTSPotential Determinants of Gross InvestmentIn order to investigate the potential determinants of gross investment in selected 21 Muslim developing countries for the period of 1970 to 2002, this study uses

111
Determinants of Investment in Muslim Developing Countries: An Empirical Investigation
two different estimators-fixed effects to capture country specific time invariant unobserved fixed effects and 2-Step 1st Difference GMM to control endogeneity in the regressors. In our baseline model, we examine the effects of one period lagged investment, per capita real GDP growth rate, trade openness and gross domestic savings on gross investment. In addition, we also include two important policy variables –foreign debt servicing and foreign aid in our extended model. Finally, we include other potential determinants of gross investment one by one into our baseline model to examine their effects on investment and the robustness of our baseline variables.
Table 4 reports the fixed effects estimated results for our baseline model, extended model and baseline models in which the variables inflation rate , lending interest rate, financial development proxied by private sector credit, human capital proxied by secondary school enrollment ratio, population growth and the institutional variable index, ICRG are included one by one. The one period lagged investment shows consistent positive and significant effects on current investment at 1% level with a value of coefficient ranging from 0.58 to 0.78 in all of the specifications. Specifically, a 1% increase in the last year’s investment on an average increases current investment by 0.58% to 0.78%. Per capita real GDP growth rate is found to have significant positive impact on investment in each specification at 1% level, with a value ranging from 0.15 to 0.29. In particular, a 1% increase in the per capita real GDP growth on an average increases investment by 0.15% to 0.29%. Trade openness shows significant positive effect on investment in baseline as well as extended model at 5% level, but not robust while including lending rate, human capital and institutions in the baseline model. Gross domestic savings produces strong significant positive effect on investment in both the models at 1% level but not robust in the presence of lending rate and human capital in the baseline model. The coefficient of foreign debt servicing is found negative and significant at 10% level, whereas foreign aid realizes positive and significant effects on investment at 5% level. No other potential determinants are found to have any significant impact on investment.
Though econometric results obtained from the fixed effects estimator in Table 4 clearly help us to identify potential variables that have significant effect on gross investment for our selected Muslim countries, our findings may be biased if the regressors are not exogenous. Since we have lagged dependent variable in our empirical model and it has strong significant effect on investment, it may be correlated with the error term and therefore, it may produce endogeneity problem in our estimation. In order to account this endogeneity issue, we apply 2-Step 1st Difference GMM proposed by Arellano and Bond (1991) that estimates the first differences series by instrumentalizing them with their appropriate lagged levels and thus it can produce consistent estimation in the presence of endeogeneity among regressors and country specific fixed effects.

112
International Journal of Economics and ManagementTa
ble
4 Fa
ctor
s affe
ctin
g in
vest
men
t in
21 m
uslim
dev
elop
ing
coun
tries
(pan
el d
ata
anal
ysis
): fix
ed e
ffect
est
imat
es
Dep
. Var
iabl
eG
ross
Dom
estic
Inve
stm
ent /
GD
P (I
NV
W)
from
WD
I 200
4
Sam
ple/
Peri
od21
Mus
lim D
evel
opin
g C
ount
ries
/ 19
70-2
002
Est
imat
orFi
xed
Eff
ects
Exp
lana
tory
Va
riab
les
Bas
elin
e M
odel
Ext
ende
d M
odel
Bas
elin
e M
odel
w
ith IN
FB
asel
ine
Mod
el
with
LR
Bas
elin
e M
odel
w
ith P
CB
asel
ine
Mod
el
with
SE
CB
asel
ine
Mod
el
with
PO
PB
asel
ine
Mod
el
with
ICR
G
INV
W(-
1)0.
71**
* (1
2.74
)0.
67**
* (1
1.04
)0.
72**
* (1
1.34
)0.
78**
* (8
.15)
0.72
***
(12.
91)
0.58
***
(9.8
9)0.
70**
* (1
2.81
)0.
62**
* (1
3.67
)G
R0.
18**
* (4
.52)
0.19
***
(4.2
5)0.
18**
* (4
.14)
0.23
***
(3.8
5)0.
15**
* (3
.93)
0.26
***
(4.2
7)0.
18**
* (4
.53)
0.29
***
(6.5
7)TR
0.03
**
(2.5
4)0.
03**
(2
.18)
0.03
* (1
.77)
0.02
(1
.15)
0.04
***
(2.8
3)0.
02
(1.1
0)0.
03**
(2
.49)
0.02
(1
.25)
DS
0.09
***
(2.9
6)0.
16**
* (4
.19)
0.07
* (1
.66)
0.08
(1
.25)
0.05
* (1
.67)
0.08
(1
.22)
0.08
***
(2.7
9)0.
15**
* (4
.40)
DB
-0.1
1*
(-1.
65)
AID
0.12
**
(2.0
4)IN
F-0
.01
(-0.
60)
LR0.
09
(0.6
6)PC
-0.0
14
(-0.
92)
SEC
-0.0
1 (-
0.59
)

113
Determinants of Investment in Muslim Developing Countries: An Empirical Investigation
Tabl
e 4
(Con
tinue
d)
POP
0.22
(0
.89)
ICR
G0.
03
(1.0
0)C
onst
ant
2.84
**
(2.4
9)2.
22*
(1.8
6)3.
41**
(2
.48)
0.69
(0
.26)
3.02
***
(2.7
0)6.
62**
* (2
.92)
2.37
* (1
.81)
2.01
(1
.14)
Adj
uste
d R2
0.79
0.81
0.78
0.78
0.78
0.78
0.79
0.82
F-St
at. (
p-va
lue)
0.00
0.00
0.00
0.00
0.00
0.00
0.00
00.
000
Cou
ntry
Dum
my
Yes
Yes
Yes
Yes
Yes
Yes
Yes
Yes
Tim
e D
umm
yYe
sYe
sYe
sYe
sYe
sYe
sYe
sYe
sO
bser
vatio
ns63
058
553
130
159
527
863
035
1
Not
es: (
i) Va
riabl
es S
peci
ficat
ion:
IN
VW
= G
ross
Dom
estic
Inv
estm
ent/G
DP
from
WD
I 20
04 d
atab
ase,
GR
= G
row
th R
ate
of P
er C
apita
Rea
l GD
P, T
R =
Tra
de O
penn
ess
= (E
xpor
t+Im
port)
/GD
P , D
S =
Gro
ss D
omes
tic S
avin
gs/G
DP,
DB
= T
otal
Deb
t Se
rvic
e/G
NI,
AID
= F
orei
gn A
id/G
NI,
INF
= A
nnua
l In
flatio
n R
ate
(Con
sum
er P
rice
Inde
x),
LR =
Len
ding
Inte
rest
Rat
e, ,P
C =
Dom
estic
Cre
dit t
o Pr
ivat
e Se
ctor
, SEC
= S
econ
dary
Sch
ool E
nrol
lmen
t Rat
io, P
OP
= A
nnua
l Pop
ulat
ion
Gro
wth
Rat
e an
d IC
RG
= In
stitu
tiona
l In
dex
base
d on
ICR
G C
ompo
site
Ris
k R
atin
g (0
= h
ighe
st ri
sk, 1
00 =
low
est r
isk)
; (ii
) Fig
ures
in p
aren
thes
es (
) are
t-va
lues
, sig
nific
ant a
t 1%
Lev
el (*
**) o
r, 5%
Lev
el (*
*) o
r, 10
%
Leve
l (*)
; (ii
i) F-
test
is fo
r joi
nt si
gnifi
canc
e te
st o
f the
est
imat
ed c
oeffi
cien
ts ;
(iv) (
-1) i
ndic
ates
one
per
iod
lagg
ed v
alue
; (v)
Cou
ntry
dum
mie
s and
tim
e du
mm
ies a
re n
ot re
porte
d;
and
(vi)
Rob
ust s
tand
ard
erro
rs a
re u
sed.

114
International Journal of Economics and Management
Table 5 summarizes estimated results obtained from 2-Step 1st Difference GMM, where it satisfies all the standard tests such as, F-test for joint significance, Sargan test for instrument validity, and AR(1) and AR(2) test for 1st order and 2nd order serial correlation test respectively. Although the estimated results are very similar to the fixed effects models (Table 4), there exist two important exceptions. Firstly the baseline models are robust while including other potential determinants of investment and secondly, financial development measured by private sector credit and institutional development proxied by ICRG index show significant positive effect on investment at least at 5% level keeping the baseline model robust, while foreign aid exhibits positive impact on investment relatively at a higher level (around 25%). In summary, putting together our findings from fixed effects and 2-Step 1st Difference GMM, we can argue that our baseline model is robust meaning that the one period lagged investment, per capita real GDP growth rate, trade openness and domestic savings exert positive significant effect on gross investment in our sample Muslim countries. Debt servicing has robust significant negative impact on investment. Foreign aid shows significant positive effect on investment but not robust in GMM, while private sector credit and ICRG index demonstrate significant positive effect on investment but not robust in fixed effects. Since 2-Step 1st Difference GMM can control endogeneity of the regressors, we should emphasize on GMM findings though some of them produce different results in fixed effects.
Robustness CheckIn order to test the robustness of our estimated results obtained from WDI-2004 data, we re-estimate our empirical models for Penn World Table (PWT 6.2) 2006 data using both fixed effects and 2-Step 1st Difference GMM estimators. The Penn World Table (PWT) provides purchasing power parity (PPP) and national income accounts converted to international prices. The PWT data adjust the US dollar based measures on income per capita to allow for the different purchasing power of a US dollar in different countries, which is commonly known as ‘international prices’. Using investment share of GDP (I/Y) from PWT data has become popular in recent empirical studies (Mankiw et al., 1992 ; Barro and Lee, 1994 ; Barro and Sala-i-Martin, 1995; Temple, 1998 ; and Knowles et al., 2001 etc.). Therefore, a common question may arise is that how sensitive the data whether investment share of GDP (I/Y) is measured in international (PWT data) or local (WDI data) prices. Findings from Barro and Lee (1994) show comparison between these two, where the WDI (World Bank) measure for investment share of GDP exceeds the PWT measure by 5% point or more in developing countries. Therefore, based on WDI 2004 investment data, our findings may overestimate the effects of potential factors affecting gross investment in selected Muslim countries and thus we re-estimate our models using PWT 6.2 data to check robustness of our empirical results.

115
Determinants of Investment in Muslim Developing Countries: An Empirical InvestigationTa
ble
5 Fa
ctor
s affe
ctin
g in
vest
men
t in
21 m
uslim
dev
elop
ing
coun
tries
(pan
el d
ata
anal
ysis
): 2-
step
1st d
iffer
ence
GM
M e
stim
ates
Dep
. Var
iabl
eG
ross
Dom
estic
Inve
stm
ent /
GD
P (I
NV
W)
from
WD
I 200
4
Sam
ple/
Peri
od21
Mus
lim D
evel
opin
g C
ount
ries
/ 19
70-2
002
Est
imat
or2-
Step
1st
Diff
eren
ce G
MM
Exp
lana
tory
Va
riab
les
Bas
elin
e M
odel
Ext
ende
d M
odel
Bas
elin
e M
odel
w
ith IN
FB
asel
ine
Mod
el
with
LR
Bas
elin
e M
odel
w
ith P
CB
asel
ine
Mod
el
with
SE
CB
asel
ine
Mod
el
with
PO
PB
asel
ine
Mod
el
with
ICR
G
INV
W(-
1)0
.75*
**
(8.4
6)0.
63**
* (8
.05)
0.72
***
(8.2
8)0.
89**
* (7
.64)
0.75
***
(8.5
9)0.
57**
* (3
.57)
0.76
***
(8.4
5)0.
78**
* (8
.99)
GR
0.13
***
(3.9
5)0.
11**
* (3
.66)
0.13
***
(3.7
7)0.
16**
* (3
.07)
0.13
***
(3.7
8)0.
21**
* (3
.61)
0.12
***
(3.8
0)0.
24**
* (5
.31)
TR0.
11**
* (3
.64)
0.12
***
(4.2
2)0.
09**
* (3
.00)
0.08
* (1
.94)
0.09
***
(3.1
3)0.
13**
* (2
.76)
0.10
***
(3.6
0)0.
07**
(2
.13)
DS
0.18
***
(4.0
1)0.
21**
* (4
.56)
0.15
***
(2.6
6)0.
08
(0.0
1)0.
15**
* (2
.98)
0.26
***
(3.8
9)0.
18**
* (4
.08)
0.06
(1
.50)
DB
-0.1
5*
(-1.
67)
AID
0.08
(1
.40)
INF
-0.0
32
(-1.
21)
LR-0
.26
(-1.
37)
PC0.
08**
(2
.00)
SEC
0.07
(0
.74)

116
International Journal of Economics and Management
Tabl
e 5
(Con
tinue
d)
POP
-0.3
3 (-
0.93
)IC
RG
0.18
***
(3.0
9)F-
Test
[p-v
alue
]0.
000
0.00
00.
000
0.00
00.
000
0.00
00.
000
0.00
0Sa
rgan
Tes
t[p-
valu
e]0.
563
0.11
50.
386
0.72
80.
614
0.82
90.
566
0.44
7
AR
(1) T
est
[p-v
alue
]0.
000
0.00
00.
000
0.00
00.
000
0.00
00.
000
0.00
0
AR
(2) T
est
[p-v
alue
]0.
403
0.18
50.
541
0.61
40.
542
0.11
20.
406
0.76
9
Tim
e D
umm
ies
Yes
Yes
Yes
Yes
Yes
Yes
Yes
Yes
Obs
erva
tions
604
559
509
278
566
184
604
330
Not
es: (
i) F-
test
is th
e jo
int S
igni
fican
ce te
sts o
f the
est
imat
ed c
oeffi
cien
ts; (
ii) S
arga
n te
st m
easu
res t
he v
alid
ity o
f the
inst
rum
ents
whe
re th
e nu
ll hy
poth
esis
is th
at th
e in
stru
men
ts
are
not c
orre
late
d w
ith th
e re
sidu
als ;
(iii)
The
nul
l hyp
othe
ses i
n A
R(1
) and
AR
(2) t
ests
are
that
the
erro
r ter
ms
in th
e fir
st d
iffer
ence
regr
essi
on e
xhib
it no
1st
ord
er a
nd 2
nd o
rder
se
rial c
orre
latio
ns re
spec
tivel
y; (
iv) 2
nd a
nd 3
rd l
ags
of th
e ex
plan
ator
y va
riabl
es a
re ta
ken
as in
stru
men
ts in
the
diffe
renc
e G
MM
; (v
) ) F
igur
es in
par
enth
eses
( ) a
re t-
valu
es,
sign
ifica
nt a
t 1%
Lev
el (*
**) o
r, 5%
Lev
el (*
*) o
r, 10
% L
evel
(*) ;
and
(vi)
(-1)
indi
cate
s one
per
iod
lagg
ed v
alue
; (v
ii) T
ime
dum
mie
s are
not
repo
rted
; and
(viii
) Rob
ust s
tand
ard
erro
rs a
re u
sed.

117
Determinants of Investment in Muslim Developing Countries: An Empirical Investigation
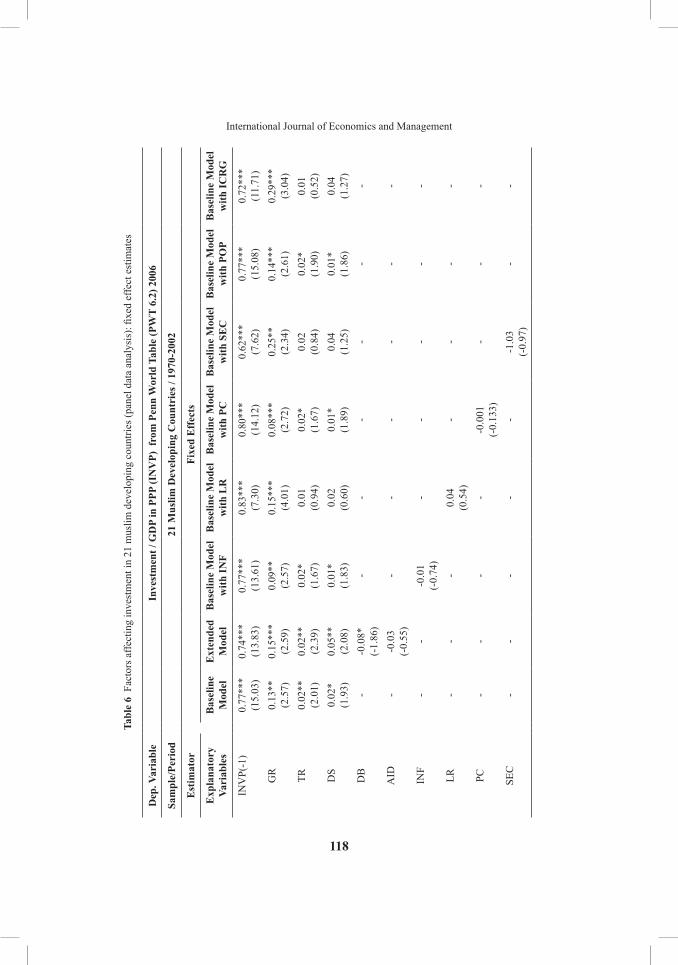
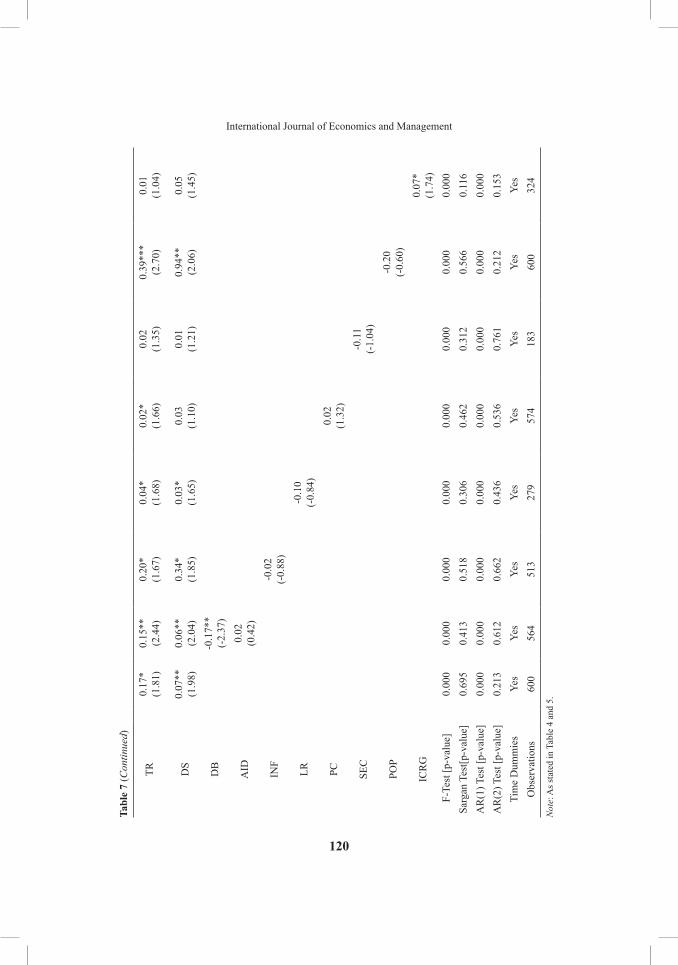
Table 6 and 7 report estimated results using PWT 6.2 data for investment share of GDP in international prices. Both fixed effects and 2-Step 1st Difference GMM estimators are applied. The results are very similar with our previous results (Table 5 and 6) based on WDI 2004 data for investment share of GDP in local prices. Although the results show that our models are robust to PWT data, there are some important exceptions. Firstly, the coefficients of trade openness and domestic savings are weakly significant (at 10% level) in most of the cases for PWT data, whereas they are strongly significant (at 1% level) in most of the specification in 2-Step 1st Difference GMM while using WDI investment data. Secondly, the coefficient for financial development proxied by private sector credit is found positive but insignificant for PWT data, while it is found significant at 5% level for WDI data in GMM. Therefore, the effects of trade openness, domestic savings and private sector credit on gross investment are likely to be overestimated in our estimation while using World Bank (WDI) data for investment share of GDP.
Reverse CausalityWhile examining the effect of potential determinates on investment, one important concern is the possibility of reverse causality, implying that high level of investment may induce higher level of those potential factors which affect investment significantly. Here we test directly for reverse causality by applying Granger-causality tests. The rationale behind the Granger-causality framework is that an event in the future cannot cause one in the past. For example, let us consider two time series, investment and growth. Growth is said to Granger-cause investment if, in a regression of investment on lagged investment and lagged growth, the coefficients of the lagged growth are jointly significantly different from zero. The length and frequency of the time lags are important critical issues that have to be addressed in conducting Granger causality tests. On their length, Granger warns that “using data measured over intervals much wider than actual causal lags can also destroy causal interpretation” (Granger, 1987). We use two-year period lag based on Akaike Information Criterion (AIC). Lagged dependent variable in panel regression might cause OLS estimation to be biased due to endogeneity and thus we employ Arellano and Bond (1991) 2-Step 1st difference GMM estimator to estimate panel Granger causality. The empirical results are presented in Table 8. The results confirm that there is no evidence of reverse causality in our estimated models.
118
International Journal of Economics and ManagementTa
ble
6 Fa
ctor
s affe
ctin
g in
vest
men
t in
21 m
uslim
dev
elop
ing
coun
tries
(pan
el d
ata
anal
ysis
): fix
ed e
ffect
est
imat
es
Dep
. Var
iabl
e In
vest
men
t / G
DP
in P
PP (I
NV
P) f
rom
Pen
n W
orld
Tab
le (P
WT
6.2)
200
6
Sam
ple/
Peri
od21
Mus
lim D
evel
opin
g C
ount
ries
/ 19
70-2
002
Est
imat
orFi
xed
Eff
ects
Exp
lana
tory
Va
riab
les
Bas
elin
e M
odel
Ext
ende
d M
odel
Bas
elin
e M
odel
w
ith IN
FB
asel
ine
Mod
el
with
LR
Bas
elin
e M
odel
w
ith P
CB
asel
ine
Mod
el
with
SE
CB
asel
ine
Mod
el
with
PO
PB
asel
ine
Mod
el
with
ICR
G
INV
P(-1
)0.
77**
* (1
5.03
)0.
74**
* (1
3.83
)0.
77**
* (1
3.61
)0.
83**
* (7
.30)
0.80
***
(14.
12)
0.62
***
(7.6
2)0.
77**
* (1
5.08
)0.
72**
* (1
1.71
)G
R0.
13**
(2
.57)
0.15
***
(2.5
9)0.
09**
(2
.57)
0.15
***
(4.0
1)0.
08**
* (2
.72)
0.25
**
(2.3
4)0.
14**
* (2
.61)
0.29
***
(3.0
4)TR
0.02
**
(2.0
1)0.
02**
(2
.39)
0.02
* (1
.67)
0.01
(0
.94)
0.02
* (1
.67)
0.02
(0
.84)
0.02
* (1
.90)
0.01
(0
.52)
DS
0.02
* (1
.93)
0.05
**
(2.0
8)0.
01*
(1.8
3)0.
02
(0.6
0)0.
01*
(1.8
9)0.
04
(1.2
5)0.
01*
(1.8
6)0.
04
(1.2
7)D
B-
-0.0
8*
(-1.
86)
--
--
--
AID
--0
.03
(-0.
55)
--
--
--
INF
--
-0.0
1 (-
0.74
)-
--
--
LR-
--
0.04
(0
.54)
--
--
PC-
--
--0
.001
(-
0.13
3)-
--
SEC
--
--
--1
.03
(-0.
97)
--

119
Determinants of Investment in Muslim Developing Countries: An Empirical InvestigationTa
ble
6 (C
ontin
ued)
POP
--
--
--
0.22
(1
.26)
-
ICR
G-
--
--
--
-0.0
1 (-
0.50
)C
onst
ant
1.31
(1
.57)
1.48
* (1
.70)
1.75
* (1
.87)
0.24
(0
.13)
1.33
(1
.57)
6.27
(1
.45)
0.83
(1
.26)
2.69
(1
.31)
Adj
uste
d R2
0.88
0.89
0.86
0.87
0.86
0.87
0.87
0.85
F-St
at. (
p-va
lue)
0.00
0.00
0.00
0.00
0.00
0.00
0.00
00.
000
Cou
ntry
Dum
my
Yes
Yes
Yes
Yes
Yes
Yes
Yes
Yes
Tim
e D
umm
yYe
sYe
sYe
sYe
sYe
sYe
sYe
sYe
sO
bser
vatio
ns62
458
953
430
260
127
662
434
5
Not
e: A
s sta
ted
in T
able
4.
Tabl
e 7
Fact
ors a
ffect
ing
inve
stm
ent i
n 21
mus
lim d
evel
opin
g co
untri
es (p
anel
dat
a an
alys
is):
2-st
ep 1
st d
iffer
ence
GM
M e
stim
ates
Dep
. Var
iabl
eIn
vest
men
t / G
DP
in P
PP (I
NV
P) f
rom
Pen
n W
orld
Tab
le (P
WT
6.2)
200
6
Sam
ple/
Peri
od21
Mus
lim D
evel
opin
g C
ount
ries
/ 19
70-2
002
Est
imat
or2-
Step
1st
Diff
eren
ce G
MM
Exp
lana
tory
Va
riab
les
Bas
elin
e M
odel
Ext
ende
d M
odel
Bas
elin
e M
odel
w
ith IN
FB
asel
ine
Mod
el
with
LR
Bas
elin
e M
odel
w
ith P
CB
asel
ine
Mod
el
with
SE
CB
asel
ine
Mod
el
with
PO
PB
asel
ine
Mod
el
with
ICR
G
INV
P(-1
)0.
63**
* (6
.95)
0.33
***
(3.8
2)0.
60**
* (5
.82)
0.57
***
(4.1
0)0.
40**
* (3
.97)
0.33
***
(4.6
6)0.
72**
* (6
.76)
0.70
***
(7.3
2)
GR
0.07
***
(3.2
0)0.
06**
(2
.58)
0.07
***
(3.2
0)0.
17**
* (4
.03)
0.06
***
(2.7
1)0.
17**
* (4
.71)
0.12
***
(3.0
3)0.
15**
* (4
.72)
120
International Journal of Economics and ManagementTa
ble
7 (C
ontin
ued)
TR0.
17*
(1.8
1)0.
15**
(2
.44)
0.20
* (1
.67)
0.04
* (1
.68)
0.02
* (1
.66)
0.02
(1
.35)
0.39
***
(2.7
0)0.
01
(1.0
4)
DS
0.07
**
(1.9
8)0.
06**
(2
.04)
0.34
* (1
.85)
0.03
* (1
.65)
0.03
(1
.10)
0.01
(1
.21)
0.94
**
(2.0
6)0.
05
(1.4
5)
DB
-0.1
7**
(-2.
37)
AID
0.02
(0
.42)
INF
-0.0
2 (-
0.88
)
LR-0
.10
(-0.
84)
PC0.
02
(1.3
2)
SEC
-0.1
1 (-
1.04
)
POP
-0.2
0 (-
0.60
)
ICR
G0.
07*
(1.7
4) F
-Tes
t [p-
valu
e]0.
000
0.00
00.
000
0.00
00.
000
0.00
00.
000
0.00
0Sa
rgan
Tes
t[p-v
alue
]0.
695
0.41
30.
518
0.30
60.
462
0.31
20.
566
0.11
6A
R(1
) Tes
t [p-
valu
e]0.
000
0.00
00.
000
0.00
00.
000
0.00
00.
000
0.00
0A
R(2
) Tes
t [p-
valu
e]0.
213
0.61
20.
662
0.43
60.
536
0.76
10.
212
0.15
3Ti
me
Dum
mie
sYe
sYe
sYe
sYe
sYe
sYe
sYe
sYe
sO
bser
vatio
ns60
056
451
327
957
418
360
032
4
Not
e: A
s sta
ted
in T
able
4 a
nd 5
.

121
Determinants of Investment in Muslim Developing Countries: An Empirical InvestigationTa
ble
8 G
rang
er re
vers
e ca
usal
ity e
vide
nce
betw
een
inve
stm
ent a
nd it
s det
erm
inan
ts fo
r mus
lim d
evel
opin
g co
untri
es,
1970
– 2
002
Inde
pend
ent
Vari
able
sD
epen
dent
Var
iabl
e
GR
GR
TR
TR
DS
DS
DB
DB
AID
AID
PCPC
ICR
GIC
RG
GR
(-1)
0.17
***
(3.1
8)0.
07
(1.2
4)G
R(-
2)0.
19
(0.3
8)-0
.14
(-0.
29)
TR(-
1)0.
81**
(2
.27)
0.46
* (1
.80)
TR(-
2)0.
11
(1.0
6)-0
.04
(-0.
65)
DS(
-1)
0.82
***
(10.
46)
0.77
***
(8.9
2)D
S(-2
)0.
04
(0.7
7)0.
01
(0.1
7)D
B (-
1)0.
65**
* (6
.94)
0.68
***
(7.9
7)D
B (-
2)0.
07
(1.1
8)0.
07
(1.1
1)A
ID(-
1)0.
43**
* (6
.92)
0.50
4***
(7
.41)
AID
(-2)
-0.1
9 (-
1.28
)-0
.17
(-1.
46)
PC(-
1)0.
98*
(1.7
5)1.
93*
(1.7
0)PC
(-2)
-0.1
5 (-
0.42
)-0
.48
(-1.
26)

122
International Journal of Economics and Management
Tabl
e 8
(Con
tinue
d)
ICR
G(-
1)1.
02**
* (9
.98)
1.12
***
(6.4
9)IC
RG
(-2)
-0.1
3 (-
1.62
)-0
.12
(-1.
30)
INV
W (-
1)0.
20
(1.3
6)-0
.12
(-1.
22)
0.05
(0
.69)
-0.0
3 (-
0.97
)0.
01
(0.0
7)-0
.73
(-0.
09)
-0.3
7 (-
0.69
)IN
VW
(-2)
-0.0
9 (-
1.21
)0.
05
(0.5
7)-0
.02
(-0.
35)
-0.0
3 (-
1.16
)0.
22
(1.5
1)0.
22
(0.3
1)0.
12
(0.2
9)Sa
rgan
Tes
t [p-
valu
e]0.
116
0.82
40.
137
0.14
20.
558
0.80
40.
142
0.15
90.
987
0.11
90.
906
0.72
20.
539
0.39
7A
R(2
) Tes
t [p-
valu
e]0.
122
0.46
10.
118
0.11
90.
992
0.93
301
.53
0.14
40.
732
0.37
90.
595
0.13
80.
900
0.69
7O
bser
vatio
ns59
658
559
558
458
858
255
153
758
556
855
253
529
729
7
Not
e: A
s sta
ted
in T
able
4 a
nd 5
.

123
Determinants of Investment in Muslim Developing Countries: An Empirical Investigation
CONCLUSIONS AND POLICY IMPLICATIONSInvestment has widely been regarded as one of the main drivers of economic growth. Despite enormous growth potentials and resources the overall investment rates of most of the Muslim developing countries are on an average lower than other non-Muslim developing countries (Raimi & Mobolaji, 2008). Therefore, this paper investigates the gross investment behavior in a panel of 21 Muslim developing countries for the period of 1970 to 2002. Fixed Effects estimator is employed to control time invariant unobserved country specific fixed effects. 2-Step 1st Difference Generalized Method of Moments (GMM) dynamic panel estimator is used to offset endogeneity of the regressors. Granger causality test is performed to see if reverse causality exists. Robustness of estimated results obtained from the WDI (2004) data is checked by re-estimating the models using PWT (6.2) data. The econometric analysis shows that the lagged investment, growth rate of per capita real GDP, domestic savings, trade openness and institutional development have positive significant effect on investment. In addition, foreign aid and private sector credit are found to have significant positive impact on investment but not robust. Debt servicing has consistent negative effect on investment. Other variables such as, inflation rate, lending rate, human capital and population growth have been found to have no significant effect on investment.
Almost all of our findings are supportive of both theoretical and empirical considerations. The positive relation between growth and investment is an empirically and theoretically although not unanimously valid (Zerfu, 2001; Ouattara, 2004; Valadkhani, 2004). An increase in output is an indicator of better performance of an economy which is likely to attract more investment. Trade openness has proved to be favorable for generating investment. Some recent studies showed that two fastest growing economies of the world, India and China and some other developing countries succeeded in enhancing investment by undertaking several trade openness measures. Although some recent studies (Dooley, Frankel & Mathieson, 1987) found weak correlation between domestic savings and investment, the positive relation between savings and investment is an undisputed fact. Our finding of positive saving- investment relation is supportive of the authors’ earlier study (Salahuddin & Islam, 2008). Since foreign debt is generally high in developing countries, over-indebtedness, may contribute to the vulnerability of macroeconomic policies which is likely to discourage investment (Acosta & Loza, 2005) and it is consistent with our findings of debt servicing effect on investment. Availability of domestic credit to private sector from the banking system may increase the investible funds in developing countries (Levine, 1997). The governments in these countries should launch banking reforms with special focus on generating more credit for the business community. Economic and political institutions are the most important factors in explaining differences in investment and growth across economies (Barro, 1997, which has been well documented in our estimated significant positive relation between institutions and investment.

124
International Journal of Economics and Management
Our empirical results have some important policy implications for Muslim developing countries. Firstly, the importance of real per capita GDP growth to accelerate investment has been well documented and thus more concern is needed to identify potential channels though which growth rate can be enhanced. Secondly, proper policy measures should be taken to increase domestic savings and to transmit those savings into investment properly. An inefficient transmission of savings into investment could lead to capital flight and discourage domestic savings. Thirdly, trade and financial openness should be encouraged to accelerate investment. Careless liberalization program may be vulnerable to crisis and thus proper tailor made reforms should be undertaken based on local experiences. Fourthly, institutional development such as, improvements in law and order, reduction of corruption, maintaining better property right, facilitating better environment for business and commerce etc. should be ensured so that investors are encouraged to invest more in anticipating smooth return of their investible funds. In aggregate, our findings suggest that policies that reduce foreign debt and increase real per capita GDP growth, trade openness, domestic savings and institutional development, would lead to higher gross investment in Muslim developing countries.
REFERENCESAbel, Andrew B. (1983) Optimal Investment under Uncertainty, American Economic
Review, 73, 228 – 233.Acosta, P. and Loza, A. (2005) Short and Long-Run Determinants of Private Investment
in Argentina, Journal of Applied Economics, VIII, 389 – 406.Aizenman Joshua and Nanci Marion (1996) Volatility and the Investment Response,
NBER Working Paper no. 5841.Alesina and Perotti (1994) The Political Economy of Growth: A Critical Survey of
Recent Literature, World Bank Economic Review, 8, 351 – 371.Alvarez, J. and Arellano, M. (2003) The Time Series and Cross-section Asymptotics of
Dynamic Panel Data Estimators, Econometrica, 71, 1121 – 1159Anderson, T. and Hsiao, C. (1982) Formulation and Estimation of Panel Data, Journal of
Econometrics, 18, 47 – 82.Arellano, M. and Bond, S.R. (1991) Some Tests for Specification in Panel Data: Monte
Caro Evidence and an Application to Employment Equations, Review of Economic Studies, 58, 277 – 297.
and Bover, O. (1995) Another Look at the Instrumental Variables Estimation or Error Components Models, Journal of Econometrics, 68(1), 29 – 52.
Asterio, D. and Price, S. (2005) Uncertainty, Investment and Growth: Evidence from a Dynamic Panel, Review of Development Economics, 9(2), 277 – 88.
Attanasio, O.P., Picci, L. and Scorcu, A.E. (2000) Savings, Growth, and Investment: A Macroeconomic Analysis Using a Panel of Countries, The Review of Economics and Statistics, 82(2), 182 – 211.

125
Determinants of Investment in Muslim Developing Countries: An Empirical Investigation
Bakaert, G., Harvey, C.R. and Lundblad C. (2005) Does Financial Liberalization Spur Growth? Journal of Financial Economics, 77(1), 3 – 55.
Barro, R.J. and Lee, J.-W. (1994) Sources of Economic Growth, Carnegie–Rochester Conference Series on Public Policy, 40, 1 – 46.
and Sala-i-Martin, X. (1995) Economic Growth, New York, McGraw-Hill. . (1991) Economic Growth in a Cross Section of Countries’, Quarterly Journal
of Economics, 106(2), 407 – 443. . (1997) Determinants of Economic Growth: A Cross Country Empirical Study.
MIT Press: Cambridge MA . (2001) Human Capital and Growth, American Economic Review, 91(2),
12 – 17.Beaudry, Paul, Mustafa Caglayan and Fabio Schiantarelli (2001) Monetary Instability, the
Predictability of Prices and the Allocation of Investment: An Empirical Investigation Using UK Panel Data, American Economic Review, 91, 648 – 662.
Beck, T., Demirguc-Kunt, A., Levine, R. (2001) The Financial Structure Database. In: Demirguc-Kunt, A., Levine, R.(Eds.), Financial Structure and Economic Growth, MIT Press, Cambridge, 81 – 140.
Benhabib , J and Spiegel M. (2000) The Role of Financial Development in Growth and Investment, Journal of Economic Growth, 5, 341 – 360.
Bernanke, B. (1983) Irreversibility, Uncertainty and Cyclical Investment, Quarterly Journal of Economics, 98, 85 – 106.
Bleany, M. (1996) Macroeconomic Stability, Investment and Growth in Developing Countries, Journal of Development Economics, 48, 461 – 477.
Blundell, R. and Bond S.R. (1998) Initial Conditions and Moments Restrictions in Dynamic Panel Data Models, Journal of Econometrics, 87, 115 – 143.
Bond, S. and Meghir, C. (1994) Dynamic Investment Models and the Firm’s Financial Policy, Review of Economic Studies, 61, 197 – 222.
Campos, N. and Nugent, J. (2003) Aggregate Investment and Political Instability: An Econometric Investigation, Economica, 70: 533 – 549.
Caselli, F., Esquivel, G. and Lefort, F. (1996) Reporting the Convergence Debate: A New Look at Cross Country Growth Empirics, Journal of Economic Growth, 1, 363 – 389.
Chari, V.V., Kehoe, P.J. and Mcgratten, E.R. (1997) The poverty of Nations: A Quantitative Investigation, Research Department Staff Report 204, Federal Reserve Bank of Minneapolis, Minneapolis.
Chirinko, R. and Schaller, H. (1995) Why Does Liquidity Matter in Investment Equations? Journal of Money, Credit and Banking, 27, 527 – 548.
Collier, P. and Gunning, J.W. (1999) Explaining African Economic Performance, Journal of Economic Literature, 37, 64 – 111.
Demir, F. (2005) Financial Liberalization, Private Investment and Low Growth Traps in Argentina, Mexico and Turkey: Limits of Growth without Investment, Notre Dame, IN: University of Notre Dame. Mimeo.
126
International Journal of Economics and Management
Dixit, A .and Pindyck, R. (1994) Investment under Uncertainty. Princeton University Press: Princeton NJ
Dooley, M., Frankel, J., Mathieson, D.J. (1987) International Capital Mobility: What Do Saving-Investment Correlations Tell Us? IMF Staff papers 34, 503 – 530.
Driver, C. and Moreton, D. (1991) The Influence of Uncertainty on UK Manufacturing Investment, Economic Journal, 101, 1452 – 1459.
Fazzari, S. and Athey, M. (1987) Asymmetric Information, Financing Constraints and Investment, Review of Economics and Statistics, 69, 481 – 487.
Feldstein, M. and Horioka, C. (1980) Domestic Saving and International Capital Flows, Economic Journal, 90, 314 – 329.
Fischer, S. (1993) The role of macroeconomic factors in economic growth, Journal of Monetary Economics, 32, 485 – 512.
Froot, Kenneth and Jeremy Stein (1991) Exchange Rate and Foreign Direct Investment: An imperfect capital market approach, Quarterly Journal of Economics, 106, 1197 – 217.
Gellos, R.G. and Werner, A.M. (2002) Financial Liberalization, Credit constraints and collateral: Investment in the Mexican Manufacturing Sector, Journal of Development Economics, 67, 1 – 27.
Ghura, D. and Hadjimichael, T. (1996) Growth in Sub-Saharan Africa, Staff Papers, International Monetary Fund, 43, September.
Gibson, H. and Tsakalotos, E. (1994) The Scope and Limits of Financial Liberalization in Developing Countries: A Critical Survey, Journal of Development Studies, 30(3), 578 – 628.
Goldberg, L. (1993) Exchange Rates and Investment in United States Industry, Review of Economics and Statistics, 75, 575 – 588.
Granger, C.W. (1987) Causal Inference, in The New Palgrave: Econometrics. NewYork, W.W. Norton.
Greene, W.H. (2003) Econometric Analysis, 5th Edition. Pearson Education, Inc.: Singapore
Greene, J. and Villanueva, D. (1991) Private Investment in Developing Countries: An Empirical Analysis, International Monetary Fund Staff Papers, 38, 33 – 58.
Greenwald, B., Stiglitz, J. and Weiss, A. (1984) International Imperfections in the Capital Market and Macroeconomic Fluctuations, American Economic Review, 74, 194 – 9.
Gujarati, D.N. (2003) Basic Econometrics, 4th Edition, McGraw Hill.Guncavdi, O., Bleany, M. and Mckay, A. (1998) Financial Liberalization and Private
Investment: Evidence from Turkey, Journal of Development Economics, 57(2), 443 – 455.
Haan, C.T. (2002) Statistical Methods in Hydrolog, second edition. Iowa State University Press: Ames, Iowa
Hausman and Jerry, A. (1978) Specification Tests in Econometrics, Econometrica, 46, 69 – 85.

127
Determinants of Investment in Muslim Developing Countries: An Empirical Investigation
Hausmann, Ricardo and Michael Gavin. (1995) Macroeconomic Volatility in Latin America: Causes, Consequences and Policies to Assure Stability, Inter-American Development Bank, mimeo.
Harris, J.R., Schiantarelli, F. and Siregar, M.G. (1994) The Effects of Financial Liberalization on the Capital Structure and Investment Decisions of Indonesian Manufacturing, World Bank Economic Review, 8(1): 17 – 47.
Herandez-Cata, E. (2000) Raising Growth and Investment in Sub-Saharan Africa: What Can be Done? Policy Discussion Paper: PDP/00/4, International Monetary Fund, Washington, D.C.
Hoshi, T.A. Kashiyap and Scharfstein, D. (1991) Corporate Structure, Liquidity and Investment: Evidence from Japanese Industrial Groups, Quarterly Journal of Economics, 106, 3 – 60.
Hsiao, Cheng (1986) Analysis of Panel Data, Econometric Society Monographs No 11. Cambridge University Press.
Isaksson, A. (2001) Financial Liberalization, Foreign Aid and Capital Mobility: Evidence from 90 Developing Countries, Journal of International Financial Markets, Institutions and Money, 11, 309 – 338.
Jorgenson, D. (1971) Econometric Studies of Investment Behavior: A Survey, Journal of Economic Literature, 91, 111 – 47.
Keynes, J.M. (1936) General Theory on Employment, Interest and Money. Macmillan : London
King, R.G. and Levine, R. (1993) Finance and Growth: Schumpeter Might Be Right, Quarterly Journal of Economics, 108(3), 717 – 738.
Kiviet, J. (1995) On Bias, Inconsistency, and Efficiency of Various Estimators in Dynamic Panel Data Models, Journal of Econometrics, 68, 53 – 78.
Knowles, S. and Owen, P.D. (1995) Health Capital and Cross-country Variation in Income Per Capita in the Mankiw–Romer–Weil Model, Economics Letters, 48, 99 – 106.
Kormendi, R.C. and Meguire (1985) Macroeconomic Determinants of Growth: Cross Country Evidence, Journal of Monetary Economics, 16, 141 – 163.
Le, Q.V. (2004) Political and Economic Determinants of Private Investment, Journal of International Development, 16, 589 – 604.
Levine, R and Renelt, D. (1992) A Sensitivity Analysis of Cross-Country Growth Regression, American Economic Review, 82, 942 – 963.
Levine, R. (1997) Financial Development and Economic Growth: Views and Agenda, Journal of Economic Literature, 35, 688 – 724.
Loungani Prakash and Mark Rush (1995) The Effect of Changes of Reserve Requirements on Investment and GNP, Journal of Money, Credit and Banking, 27, 511 – 26.
Mankiw, N.G., Romer, D. and Weil, D.N. (1992) A Contribution to the Empirics of Economic Growth, Quarterly Journal of Economics, 107, 407–437.
McCulloch, Ratchel (1989) Japanese Investment in the United States in The Internationalization of US Markets. New York University Press: New York

128
International Journal of Economics and Management
McKinnon, R.I. (1973) Money and Capital in Economic Development, Washington D.C. The Brookings Institute.
McMahon, W.W. (1999) Education and Development: Measuring the Social Benefits. Oxford University Press.
Nelson, R.R. and Phelps, E.S. (1966) Investment in Humans, Technological Diffusion and Economic Growth, The American Economic Review, 56(1/2), 69 – 75.
Nickell, S. (1981) Biases in Dynamic Models with Fixed Effects, Econometrica, 49, 1417 – 1426.
Ndikumana, L. (2000) Financial Determinants of Domestic Investment in Sub-Saharan Africa, World Development, 28(2), pp. 381 – 400.
Ouattara, B. (2004) Modeling the Long Run Determinants of Private Investment in Senegal, The School of Economics Discussion Paper Series 0413, School of Economics, The University of Manchester.
OIC (2008) Savings, Investment and Expenditure Trends in the OIC Member Countries, OIC Outlook, Ankara, Turkey.
Ozaler, S. and Rodrik, D. (1992) External Shocks, Politics and Private Investment: Some Theory and Empirical Evidence, Journal of Development Economics, 39, 141 – 62.
Pindyck, R. (1991) Irreversibility, Uncertainty and Investment, Journal of Economic Literature, 29(3), 1110 – 52.
Price, S. (1995) Aggregate Uncertainty, Capacity Utilization and Manufacturing Investment, Applied Economics, 27, 147 – 54.
Raimi, L. and Mobolaji, H.I. (2008) Imperative of economic integration among Muslim countries: Lessons from European globalization, Humanomics, 24(2), 130 – 144.
Rodrik, D. (1991) Policy, Uncertainty and Investment in Developing Countries, Journal of Development Economics, 36(2), 229 – 242.
Salahuddin, M. and Islam, R. (2008) Factors Affecting Investment in Developing Countries, The Journal of Developing Areas, 42(1), 21 – 37.
Stasavage, D. (2002) Private investment and political institutions, Economics and Politics, 14, 41 – 63.
Serven, L. (2003) Real Exchange Rate, Uncertainty and Private Investment in LDCs, Review of Economics and Statistics, 85(1), 212 – 18.
Shaw, E.S. (1973) Financial Deepening in Economic Development, Oxford University Press, New York.
Stiglitz, J.E. and Weiss, A. (1981) Credit Rationing in Markets with Imperfect Information, American Economic Review, 71(3), 393 – 410.
Temple, J. and Johnson, P.A. (1998) Social Capability and Economic Growth, Quarterly Journal of Economics, 113, 965–990
Tobin, J. (1969) A General Equilibrium Approach to Monetary Theory, Journal of Money, Credit and Banking, 1(1), 15 – 29.
Valadkhani, A. (2004) What Determines Private Investment in Iran? International Journal of Social Economics, 31, 457 – 68.

129
Determinants of Investment in Muslim Developing Countries: An Empirical Investigation
Vamvakidis, A. and Wacziarg, R. (1998) Developing Countries and The Feldstein-Horioka Puzzle, IMF, Washington, DC. IMF Working Paper.
Were, M. (2001) The impact of debt on economic growth and private investments in Kenya, an empirical assessment, paper presented at the Wider Development Conference on Debt Relief, 17 – 18 August, Helsinki.
Wong, D.Y. (1990) What do savings-investment relationships tell us about capital mobility? Journal of International Money and Finance, 9, 60 – 74.
World Bank (2004) World Development Indicators CD-ROM, World Bank: Washington DC
World Development Indicators database (2007) World Bank: Washington DC.Zerfu, Mr. D. (2001) Determinants of private investment in Ethiopia, downloadable: http://
www.csae.ox.ac.uk/conferences/2001-DpiA/pdfs/zefruabs.pdf.