determinants of industrial turbulence in … · focuses mainly on two types of factors influencing...
TRANSCRIPT

DETERMINANTS OF TURBULENCE IN ENTRY AND EXIT FOR HIGH-GROWTH AND DECLINING
INDUSTRIES
Rui Baptista IN+, Instituto Superior Técnico, Technical University of Lisbon and Max Planck
Institute for Research into Economic Systems, Jena
Murat Karaöz IN+, Instituto Superior Técnico, Technical University of Lisbon and Süleyman Demirel
University, Isparta
Paper Submitted for Presentation at the Workshop on Firm Exit and Serial Entrepreneurship – Max Planck Institute for Economics, 13-14 January 2006
Preliminary Draft
Abstract: This paper examines how industry turbulence in entry and exit varies across industries and why some industries experience higher levels of turbulence than others. The analysis is conducted using panel data at the six digit industry level, allowing for the identification of specific emerging and declining product markets within more widely defined industries. The paper looks at differences in turbulence patterns between high-growth and declining industries. While controlling for all the main determinants of turbulence, the analysis focuses mainly on two types of factors influencing turbulence: the ‘vacuum’ effect created by exit in the previous period, which is partitioned into ‘trial-and-error’ (exit by recent entrants) and ‘creative destruction’ (exit by older incumbents) processes; and the industry/market growth rate and its volatility. Estimation results reveal that volatility in growth rates produces positive effects on industry turbulence in high-growth industries but has no significant effect on turbulence in declining industries. It is also shown that trial-and-error processes are particularly significant in high growth industries, while creative destruction is more significant in declining industries.
Corresponding Address: Rui Baptista, IN+ Centre for Innovation, Technology and Policy Research, Instituto Superior Técnico, Av. Rovisco Pais, 1049-001 Lisbon, Portugal. Ph: +351.218.417.379. Fax: +351.218.496.156. E-mail: [email protected].

1. Introduction
The determinants of entry and exit of firms are at the center of the enduring process of market selection, as industries and products emerge, grow, mature and ultimately fade from the market in the course of the emergence of novel substitutes. Empirical literature has revealed that entry and exit rates are strongly correlated and differ significantly across industries and over time (Geroski, 1991, 1995). Conventional wisdom suggests that the direction of this relationship should be negative, since an attractive industry brings in more entrants and also deters more exits. However, a large body of empirical studies across industries and economies has pictured quite the opposite; in fact, entry and exit are found to be significantly positively correlated (Geroski, 1995).
Industries that are associated with high levels of entry and exit are deemed “turbulent” (Beesley and Hamilton, 1984). The theoretical and empirical literature addressing this issue is considerable and uses a variety of terms to refer to it, such as ‘mobility’, ‘turnover’, ‘turbulence’ (Acs and Audretsch, 1990; Caves, 1998) and market ‘selection intensity’ (Baldwin and Rafiquzzaman, 1996). Studies of entry, exit and industry turbulence have shown that the factors underlying these phenomena are very diverse, being related with industry-specific and firm-specific differences, as well as with changes in the macroeconomic and political environment. Turbulence is fed by a variety of events or factors occurring at the firm, market and macroeconomic levels, which can be either momentary or persistent over time; it restructures industries, relocates their boundaries and changes the foundations of competition. Factors such as supply and demand fluctuations, product life cycles, levels of competition and rivalry, technological innovations and regulatory changes, might generate higher levels of entry and exit, thereby shaping the structures of industries and economies (Gort and Klepper, 1982; Dunne et al., 1988; Jovanovic and MacDonald, 1994; Siegfried and Evans, 1994; Caves, 1998).
Industry characteristics such as number and size distribution of firms, market shares, process technologies and product variety and quality, evolve through trial-and-error and creative destruction processes through which the market selects successful firms (Jovanovic 1982; Geroski, 1991; Jovanovic and MacDonald, 1994; Klepper 1996; Caves, 1998; Baldwin, 1998). Higher levels of entry and exit rates tend to occur in emerging or growing industries, or in industries under rapid structural change. Large waves of new entrants – either bringing innovative and more competitive products to the markets or just trying out their luck – lead to large waves of exits, mainly of those competitors whose abilities are at the fringe.
The present paper is concerned with how industry turbulence in entry and exit (hereafter referred to as ‘turbulence’) varies across industries and why some industries experience higher levels of turbulence than others. This analysis presents the novelty of being conducted at highest possible level of “disaggregation” – the six-digit industry classification – using the SISED database, which covers all firms in the Portuguese industry. A longitudinal data set was built for the period 1986-1993. The six-digit level of analysis provides unprecedented detail, allowing for the identification of specific emerging and declining product markets within more widely defined industries. The paper focuses particularly on differences in turbulence patterns between high-growth and declining industries. The determinants of turbulence are examined through the use of panel data estimation methods in order to identify causality effects on turbulence.
1

It is important to note that the eight year time span between 1986 and 1993 covers four years of macroeconomic expansion followed by four years of recession/slow growth. Moreover, the analysis starts in 1986, a year when a major external/policy shock occurred affecting all sectors of the Portuguese industry: entry into the European Community brought about significant market de-regulation, as well as greater financing opportunities for new and existing businesses.
While controlling for an encompassing set of determinants of turbulence, the analysis focuses particularly on two types of factors influencing turbulence. The first type addresses the ‘vacuum effect’ – whereby incumbent exit at a certain moment in time creates room for new firm entry and growth in subsequent periods in the current – thus affecting the levels of turbulence. This effect is partitioned into two sub-determinants, in order to separate and identify the effects of two different types of exit – ‘trial-and-error’ (exit by recent entrants) and ‘creative destruction’ (exit by older incumbents). The second type concerns the effects on turbulence of the industry growth rate and its volatility.
The estimation results reveal that volatility in growth rates produces positive effects on industry turbulence in high-growth industries but has no significant effect on turbulence in declining industries. It is also shown that trial-and-error processes are particularly significant in high growth industries, while creative destruction is more significant in declining industries.
2. Turbulence in Entry and Exit: Assessing the Intensity of Market Selection in High-Growth and Declining Industries
While there is a significant positive correlation between entry and exit, various studies of the industry or product life cycle suggest that different phases of the cycle yield different regularities in entry and exit rates. A series of empirical studies (Gort and Klepper, 1982; Klepper and Graddy, 1990; Klepper and Miller, 1995; Agarwal and Gort, 1996, 2002; Agarwal, 1997; Klepper and Simons, 2000, 2005; Agarwal and Audretsch, 2001) has shown that entry rates are higher than exit rates in the earlier phases of industry life cycle. As industries age and set standards, or dominant designs for their products, the focus of innovative activity switches from product to process, opportunities for scale economies emerge and ‘shakeout’ begins. Exit rates overtake entry rates and turbulence levels decrease. A significant point thus emerges from these studies: levels of turbulence are higher in earlier stages of the industry/product life cycle. Beesley and Hamilton (1984) observe that emerging sectors – those that are not yet fully developed, or even recognized by the Standard Industrial Classification indexes – are the ones registering greater levels of turbulence. Klepper and Graddy (1990) report that the change in the mean number of firms goes from positive to negative as industries pass from early to late stages of their life cycles. The work by Agarwal and Gort (1996) on entry, exit and the evolution of markets also suggests that levels of turbulence (entry plus exit rates) are higher in earlier stages of the life cycle and decrease as industries mature.
As pointed out above, measures of market turbulence reflect the intensity of market selection through entry and exit of firms. Since the seminal work of Orr (1974) on the determinants of entry, a broad range of empirical studies has revealed that the selection process responds to incentives, barriers or structural characteristics such as profit rates,
2

industry growth rates, market risk, economies of scale, concentration, advertising intensity, research and development, and “room” for entry (Khemani and Shapiro, 1986; Shapiro and Khemani, 1987; Audretsch and Acs, 1990; Baldwin and Gorecki, 1991; Geroski and Schwalbach, 1991; Rosenbaum and Lamort, 1992; Baldwin, 1998; Fotopoulos and Spence, 1998; Lay, 2003).
The analysis conducted in the present paper aims to examine differences in the shape and significance of the effects of the determinants of market selection on turbulence levels for high-growth, declining and other industries. Hence, separate estimations are carried out for those three different groups of industries. While controlling for an encompassing set of determinants, the present study of turbulence focuses particularly on two kinds of factors:
i. first, the study aims to distinguish between the effects of trial-and-error and creative destruction processes associated with the ‘vacuum effect that is created by exit in the previous period.
ii. second, this study aims to shed light on the relationship between industry growth rates, and their volatility, and turbulence;
In both cases, the analysis conducted also aims to examine differences in the shape and significance of the effects of these determinants on turbulence levels for high-growth, declining and other industries. Hence, separate estimations are carried out for those three different groups of industries.
2.1 Replacement and Displacement Effects: Trial-And-Error and Creative Destruction Processes
Exit of incumbent firms creates room for new firms to enter the market and grow (vacuum effect). Various authors (see, for instance, Baldwin, 1998) have argued that the exit of recent entrants acts to “create room” and thus attract other, more competitive firms to enter; this has been dubbed a ‘replacement effect.’ Industries with high growth rates and high profit margins are expected to attract more of entrants who “try their luck” hence registering greater replacement effects. Industries with negative growth rates and low profit margins should encourage less trial-and error entrants. However, a different kind of market selection process occurs whereby aged incumbents locked into old technologies exit, creating room for new, innovative firms. This process can be seen as selection through creative destruction and may be dubbed a ‘displacement effect.’ It is expected that creative destruction processes of market selection will occur mostly in declining industries.
It is then possible to formulate the following hypothesis:
H1: Turbulence in high-growth industries results mostly from high levels of trial-and-error/replacement market selection processes, while turbulence in declining industries results mostly from creative destruction/displacement market selection processes.
2.2 The Effect on Turbulence of Volatility in Growth Rates
Studies of markets in a variety of disciplines, including industrial organization and organizational ecology, have shown that demand growth volatility is a significant
3

source of uncertainty and, therefore, of risk (see, for instance, Hannan and Freeman, 1989; Geroski, 1991). Mazzucato (2002) argues that unsystematic risk in an industry might be higher in early periods of growth since idiosyncratic factors affecting both supply and demand are stronger. Geroski (1991) suggests that market ‘turbulence’1 in the forms of price and output shocks, growth and technological change is expected to increase turnover (entry and exit). Sutton (1997) points out that fluctuations in industry demand create turbulence in entry and exit, and these fluctuations are of primary importance in determining market selection. However, such fluctuations may be difficult to measure or, at least, it may be troublesome or control for their influence empirically. In industries where the pace of technological, socioeconomic and regulatory changes is faster, leading to higher volatility in growth rates, it is expected that turbulence levels in entry and exit will be higher (Owen, 1971; Caves and Porter, 1977; Caves, 1998). It is therefore possible to formulate the following hypothesis:
H2: Industries experiencing greater volatility in growth rates will register higher levels of turbulence.
3. Data and Variables
For the present analysis a longitudinal data set on industry entry and exit was built from the from Portuguese SISED database. This is longitudinal database is the result of mandatory information submitted by all firms with at least one employee to the Portuguese Ministry of Employment and Social Security. This information, based on a sample covering virtually the whole universe of Portuguese firms (sole traders are excluded), enables the construction of industry-level variables at the six digit level of industry aggregation, which is the most detailed level of analysis possible, thus allowing for the recognition of turbulence patterns in markets for specific products within more widely defined industries. The panel covers a time span of eight years, from 1986-1993.
The study focuses on 320 six-digit sectors which covered about 95 % of the total industry population employment in 1993. In order to select high-growth and declining industries, these sectors are ranked in terms of average employment growth rates from 1986 to 1993. Following Birch (1987), industries that are ranked in the highest 10 percent have been defined as ‘high-growth’ industries, while the lowest 10 percent in terms of average growth have been classified as ‘declining’ industries. This kind of typology enables us to analyze different forces that could have similar or contrasting impact on turbulence, depending on the industry growth rate and life cycle. All the remaining industries form a control group, designated as ‘others.’ A comparative view of these groups is presented in Table 1.
1 The term “turbulence” used here by Geroski differs in meaning from the term used in this paper, referring primarily to volatility in costs, prices and demand, and not to market selection intensity or firm turnover, or mobility. As pointed out before, a diverse set of measures and concepts of turbulence and volatility have been developed by the economics, organizational ecology, finance, and marketing/strategic management literatures under the broad umbrella of “environmental turbulence,” In particular, the finance and marketing literatures have used the expression “market turbulence” to identify short term dynamics of stock market volatility and market demand fluctuations (see, for instance: Glazer and Weiss 1993; Frömmel and Menkhoff, 2003).
4
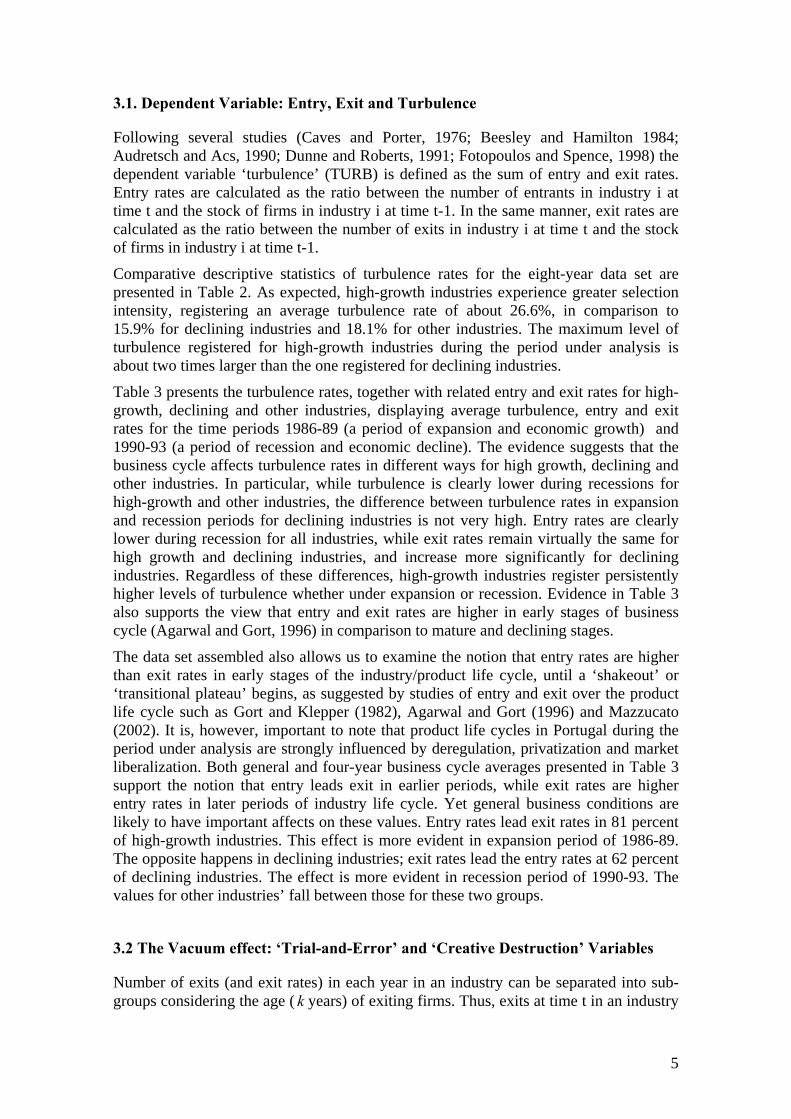
3.1. Dependent Variable: Entry, Exit and Turbulence
Following several studies (Caves and Porter, 1976; Beesley and Hamilton 1984; Audretsch and Acs, 1990; Dunne and Roberts, 1991; Fotopoulos and Spence, 1998) the dependent variable ‘turbulence’ (TURB) is defined as the sum of entry and exit rates. Entry rates are calculated as the ratio between the number of entrants in industry i at time t and the stock of firms in industry i at time t-1. In the same manner, exit rates are calculated as the ratio between the number of exits in industry i at time t and the stock of firms in industry i at time t-1.
Comparative descriptive statistics of turbulence rates for the eight-year data set are presented in Table 2. As expected, high-growth industries experience greater selection intensity, registering an average turbulence rate of about 26.6%, in comparison to 15.9% for declining industries and 18.1% for other industries. The maximum level of turbulence registered for high-growth industries during the period under analysis is about two times larger than the one registered for declining industries.
Table 3 presents the turbulence rates, together with related entry and exit rates for high-growth, declining and other industries, displaying average turbulence, entry and exit rates for the time periods 1986-89 (a period of expansion and economic growth) and 1990-93 (a period of recession and economic decline). The evidence suggests that the business cycle affects turbulence rates in different ways for high growth, declining and other industries. In particular, while turbulence is clearly lower during recessions for high-growth and other industries, the difference between turbulence rates in expansion and recession periods for declining industries is not very high. Entry rates are clearly lower during recession for all industries, while exit rates remain virtually the same for high growth and declining industries, and increase more significantly for declining industries. Regardless of these differences, high-growth industries register persistently higher levels of turbulence whether under expansion or recession. Evidence in Table 3 also supports the view that entry and exit rates are higher in early stages of business cycle (Agarwal and Gort, 1996) in comparison to mature and declining stages.
The data set assembled also allows us to examine the notion that entry rates are higher than exit rates in early stages of the industry/product life cycle, until a ‘shakeout’ or ‘transitional plateau’ begins, as suggested by studies of entry and exit over the product life cycle such as Gort and Klepper (1982), Agarwal and Gort (1996) and Mazzucato (2002). It is, however, important to note that product life cycles in Portugal during the period under analysis are strongly influenced by deregulation, privatization and market liberalization. Both general and four-year business cycle averages presented in Table 3 support the notion that entry leads exit in earlier periods, while exit rates are higher entry rates in later periods of industry life cycle. Yet general business conditions are likely to have important affects on these values. Entry rates lead exit rates in 81 percent of high-growth industries. This effect is more evident in expansion period of 1986-89. The opposite happens in declining industries; exit rates lead the entry rates at 62 percent of declining industries. The effect is more evident in recession period of 1990-93. The values for other industries’ fall between those for these two groups.
3.2 The Vacuum effect: ‘Trial-and-Error’ and ‘Creative Destruction’ Variables
Number of exits (and exit rates) in each year in an industry can be separated into sub-groups considering the age ( years) of exiting firms. Thus, exits at time t in an industry k
5

are divided into sub-groups including exiters that are one years of age or less, and other sub-group of exiters that are older than one year. The first sub-group of exiting firms can be seen as infant mortality in each sector. An infant mortality (exit) rate can therefore be calculated for the exits of firms that are one years of age or less. Similarly, exit rates can be calculated for various any other set, or sub-group, of exiting firms that are aged k, which includes the number of exits at time t that entered to the industry years before. In this case, omitting the industry and time indices, (total) exit rate at time t for industry i, XRT, is sum of industry sub-groups’ exit rates.
k
XRT= ∑(XRT)k (k=1, 2, …,N) (1)
The above infant mortality rate for exits of one years of age firms, (XRT)k=1, may be deemed to result from trial-and-error processes, thus representing the part of exit rate associated with the exit of firms that display less innovative capacities, entrepreneurial abilities or financial capabilities (see Baptista and Karaöz, 2005 for a review of the determinants of firm survival in the early years after start-up). In an analogous manner, a sub-groups of exiters associated with creative destruction processes can also be obtained. The present study assumes that industry exit rates of firms that are four or more years of age, ∑(XRT)k≥4, represents the part of the exit rate associated with older firms that are replaced by new, innovative firms.
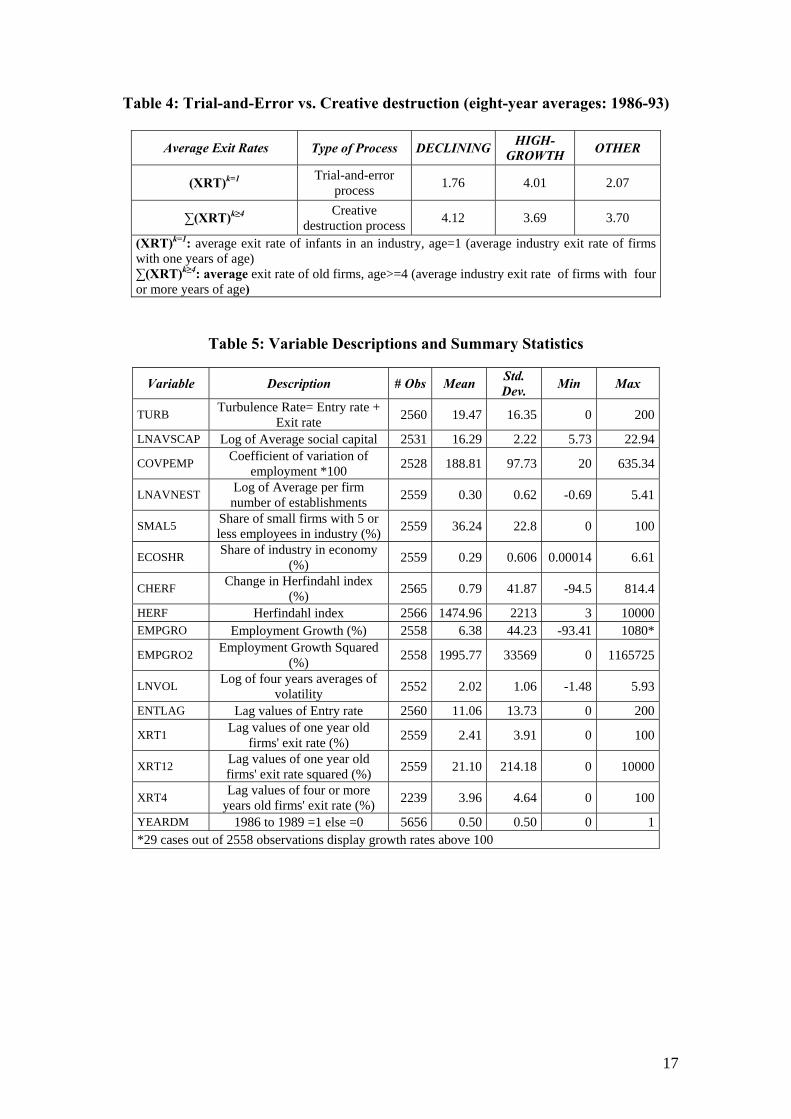
Table 4 presents eight-year averages of exit rates for one year old firms – (XRT)k=1 – and four and more years old firms – ∑(XRT)k≥4 – representing the trial-and-error and creative destruction processes for declining, high growth and other industries, respectively. The exit rate of infants suggests that trial-and-error process are considerably more important in high growth industries than in declining industries. This suggests that declining industries attract less newcomers that will ‘short-stay’ at the competitive fringe than growing industries. Creative destruction processes are relatively more common in declining industries compared to the high growth and other industries, although differences between groups are less considerable.
The trial-and-error (XRT1) and creative destruction (XRT4) variables (exit rates) are included in the analysis of turbulence determinants in order to capture their effects in generating turbulence in subsequent periods. It is expected, according to hypothesis H1, that XRT1 will have a more significant effect in generating turbulence in high-growth industries, while XRT4 should be more significant in generating turbulence in declining industries.
3.3 Volatility in Industry Growth Rates
Higher levels of growth rates are usually positively correlated with higher levels of volatility. Thus the question that arises from this relationship is: what are the individual effects of both differences in growth and in its volatility on industrial turbulence. In order to obtain reliable results, one needs to separate the magnitude and volatility of growth rates and mitigate the effects of linear correlation that could cause spurious results.
Volatility or fluctuations have been measured in a variety of ways (see Camerun et al. 1987 for a brief review). Orr (1974) used the standard deviation of industry profit rates while Khemani and Shapiro (1986) use the variance of the same variable to measure industry-specific risk. A more commonly used indicator seems to be the variance of growth rates across time. Yet Camerun et al. (1987) points out that variance has a major
6

drawback: it cannot separate the effect of volatility from magnitudes and fluctuation trends. For instance, the two progressions of ‘1 2 3 4 5’ and ‘4 3 1 5 2’ have the same variance of 2.5, yet the second progression shows significant fluctuations while the first one is a monotonic progression. Thus, magnitudes and fluctuations need to be separated. Camerun et al. (1987) proceeds by regressing the related data against time. Those authors utilize Pearson correlation coefficient values and create a “coefficient of alienation”, (1-r2), to measure the volatility through badness of fit. Yet this measure has also a drawback: it does not differentiate positive from negative trends. Schwartz and Altman (1973) provides an alternative by simply using the residuals of the same regression, instead of the correlation coefficients.
Using the industry growth rates (EMPGRO) for the 1986-93 period the present study generates two average volatility indexes for each four year period (1986-89 and 1990-93). In order to calculate each of the four-year average volatility indexes, we divided the sum of absolute values of residuals by the number of years (in the present case, four) in the regression. In order to mitigate the relatively high level of correlation between these two variables we use the natural logarithm of volatility (LNVOL) in the regression analysis. Calculating an eight-year averaged volatility index or two four-year period volatility indexes is essentially a matter of choice. For the present study, it was decided to use two separate indexes for two reasons. First, business cycles are major events that alter the trajectory of the economy, and thus are likely to affect the way volatility impacts on turbulence; second, having more than one value for volatility during the eight year span of the analysis enables the use of this variable in fixed-effect model estimation. Taking the natural logarithm of volatility substantially mitigated the problem of linear correlation that was present between growth and its volatility, so that it enabled us to use them together.
An important drawback of our growth and volatility measure is that we use employment data instead of sales, due to the unreliability of sales data in the SISED database. However, estimations with volatility indexes based on corrected sales data, which are not reported here, yielded similar results. The growth and volatility measures are included in the analysis of the determinants of turbulence. According to hypothesis H2, it is expected that higher volatility will have a positive impact on turbulence.
3.4 Other Variables
Variables related with barriers to entry and structural characteristics have been constructed with the purpose of controlling for other significant effects on turbulence across sectors. Variables include the share of micro-firms – with five or less employees in the sector (SMAL5); the Herfindahl concentration index (HERF), and the change in the Herfindahl index across time (CHERF); the share of employment in the sector in total employment in the economy (ECOSHR); the logarithm of the average number of establishments per firm (LNAVNEST) in the sector; the log of the average value of equity per firm (LNAVSCAP), the coefficient of variation in sector employment (COVPEMP); and the lagged entry rate (ENTLAG). Also, a period dummy (YEARDM) variable has been added to capture the effects of business cycles (expansion vs. recession) on turbulence levels. A detailed description of the variables is provided in Table 5.
Davies and Geroski (1997) examined the determinants of inter-industry differences in within industry variance of market shares for the five leading firms (a different measure
7

of turbulence than the one used in the present paper) in UK industries between the years of 1979 and 1986, finding that this particular measure of turbulence (arguably more a measure of intensity in competition and rivalry between large firms than of intensity in market selection) was positively affected by industry R&D efforts more innovative industries experienced more turbulence), while higher levels of advertising intensity among leading firms act like a barrier to mobility and suggested less turbulence. Both R&D and advertising are not used as explanatory variables in the present study, since it is suggested that such variables are more likely to influence variations in the relative positions of incumbents than market selection per se. Even tough it is recognized that both higher R&D efforts and advertising by incumbents do generate barriers to entry and exit, other measures of such barriers are already included in the study which are believed to provide an appropriate control for this particular determinant of turbulence.
The symmetry hypothesis postulates that barriers to entry (such as capital requirements) also deter firms from exit (Shapiro and Khemani 1987). Various measures are considered to account for these determinants. Following Yamawaki (1991); Mayer and Chappell (1992); and Baldwin (1998), the present study measures entry and exit barriers using the logarithm of average firm size (as measured by equity) (LNAVSCAP) and the logarithm of average number of establishments per firm (LGNEST) variables. Average employment per firm was also considered but not included in the model due to its high correlation with the average number of establishments (0.89).
Turbulence is expected to be negatively related with LGNEST and LVAVSCAP since, as the capital or scale requirements increase, both entry and exit are likely to be deterred. However, these variables are expected to be less significant in declining industries. Industries in which demand is declining are likely to register excess capacity leading to the exit of large firms (Ghemawat and Nalebuff, 1985), or to downsizing (Horowitz and Horowitz, 1965; Harrigan, 1980, 1982; Ghemawat and Nalebuff, 1990; Lieberman, 1990). Moreover, declining industries attract lower levels of entry due to low profit margins and growth. Entry barriers are also likely to be insignificant in high-growth industries which are at their early stages of development and in which the minimum efficient scale is not yet settled, and where a dominant design has not yet been generated. These sectors are likely to register abundant trial-and-error processes over time.
The Herfindahl index (HERF) and the change in Herfindahl index (CHERF) across time are used to measure the effect of market concentration on turbulence. As industries evolve toward later stages of their life cycle, an equilibrium level (Carree and Thurik, 2000) or steady state (Rosenbaum, 1993) industry concentration level is expected to emerge. Effects of industry concentration (HERF) on turbulence are expected to produce different results depending on the effects of growth rate, profit and mobility barriers on concentration. Small scale entry requires lower capital commitment (Mata, 1991) and also makes exit easier due to lower sunk costs. In contrast, large entry requires large capital commitment, deterring entry and exit and thus reducing turbulence (Beesley and Hamilton, 1984; Audretsch and Acs, 1990; Rosenbaum and Lamort, 1992; Fotopoulos and Spence, 1998). Industries with more small firms are expected to be more turbulent, so the share of micro-firms in the sector (SMAL5) should influence turbulence positively. However, in high growth markets sunk costs are not expected to be as important as in the rest of the industries, since it is expected that it would be easier for any firm to find a buyer to liquidate its assets in the short term.
8

The level of turbulence in relation to industry size is also investigated. Various studies of entry and exit suggest that larger industries are subject to more entry and exit activities (Orr, 1974; Khemani and Shapiro, 1986), hence the inclusion of the share of industry employment in total employment in the economy (ECOSHR). We expect larger industries to be more turbulent. It should also be pointed out that greater size heterogeneity within industries is expected to be linked with greater turbulence, although heterogeneity in sizes may imply specialization of large and small firms that coexist in the market with little turbulence (Baldwin, 1998). As in Lieberman (1990), the coefficient of variation in employment (COVPEMP) is used in order to capture the effects of heterogeneity in sizes of firms. Finally, the simultaneity hypothesis (Fotopoulos and Spence, 1998) postulates that, after new firms enter, competitive pressures lead to the exit of those incumbents at the fringe; this is the ‘displacement effect’. The lagged entry rates (ENTLAG) are expected to capture this effect.
4. Empirical Results and Conclusions
Random-effect, fixed-effect and first-difference robust estimation (Baltagi, 2005; Cameron and Trivedi, 2005) techniques were performed for declining, high-growth and other industries separately in order to identify differences in the patterns of the effects of the explanatory variables on turbulence across different stages of product life cycles. The estimation results are presented in Tables 7, 8 and 9. The results suggest that there are in fact different market selection processes determining turbulence in high-growth and declining industries.
Employment growth (EMPGRO) variable produced strong positive relationship in both high growth and other industries. Inclusion of the squared growth rate in the regression reveals that this relationship is mixed for declining industries, with an early negative downward movement. The volatility in growth rates (LNVOL) variable produced positive significant results in high-growth and other industries, except in the fixed-effect estimation. Results show that higher positive growth rates are associated with higher levels of growth rate volatility, and both factors contribute for increasing turbulence in entry and exit. Volatility in growth rates does not significantly influence turbulence in declining industries. It seems therefore that uncertainty and risk, in the form of volatility in growth rates, does not affect market selection in industries associated with (mostly) negative growth.
The lagged values of infant exit rates (exit rates of one year old firms – XRT1) produce the expected effects on turbulence, as defined in hypothesis H1. Trial-and-error processes of market selection have a significant effect on turbulence in high-growth and other industries, but not in declining industries. Trial-and-error processes occur mostly in those industries that display high positive levels of growth across the whole period under analysis – high growth industries display average yearly growth levels of over 18%. Declining industries (average yearly growth of -1.28%) register little trial-and-error activity.
The lagged values of the exit rate of firms that are four years of age or older has a significant and positive effect on turbulence levels in declining industries and also in other industries, but has no significant effect on turbulence in high-growth industries. This again confirms hypothesis H1, suggesting that creative destruction processes do not play a significant role in generating turbulence in high-growth markets. However,
9

creative destruction becomes significant in generating turbulence before industries reach decline in their life cycles, since the coefficient for variable XRT4 is significant and positive for both declining and other industries.
Regardless of the estimation method or industry group, the dummy variable representing the business cycle (YEARDM) always shows a significant positive effect on turbulence – i.e. turbulence is higher during expansion (and, in the present case, de-regulation) than during recession – although its significance is slightly lower for declining.
The lagged entry variable (ENTLAG) produces similar significant positive results in seven out of nine estimations. The variable became insignificant for declining and other industries in fixed-effect estimations only. These results suggest that displacement effects are a persistent source of turbulence in all industries.
The industry’s share in total employment in the economy (ECOSHR) has insignificant effects on turbulence in both high-growth and declining industries, while it positively affects turbulence in all other industries. A possible reason for these is that industries in the early stages of their life cycle will register high levels of turbulence even though their overall share of the economy might still be small, while declining industries register decreasing demand, profits and employment regardless of turbulence.
The share of micro-firms (SMAL5) has a positive significant effect on turbulence for all groups of industries, except in the fixed-effect estimations for high-growth and declining industries. The share of micro-firms in a sector seems therefore to play a particular important role in generating turbulence in industries that are register medium or low levels of growth, suggesting that the ability of micro-firms to co-exist with large firms after the early stages of the industry life cycle contributes for entry and exit rates to remain relatively high. Estimation results for the level of heterogeneity in industries, as measured by the coefficient of variation in employment (COVPEMP) confirm this suggestion, since heterogeneity has positive significant effects on turbulence for other industries, while remaining insignificant for both high-growth and declining industries.
The measures of scale economies – log of average social capital (LNAVSCAP) and log average number of establishments (LNAVNEST) – also display no significant effects on turbulence in high-growth and declining industries, while having both negative and significant effects on turbulence in other industries. It seems therefore that barriers to entry and exit only significantly preclude market selection in industries that are in medium/low growth and maturity stages of their life cycles. While it is no surprise that scale economies and barriers to entry play no significant role in reducing turbulence in high-growth markets and industries in the early stages of their life cycle, where dominant designs and minimum efficient scales have not yet been fully determines, the result is a bit more unexpected for declining industries.
There could be three possible, interrelated reasons why scale economies and barriers to entry are not significant for declining industries. The first reason could be that declining industries attract lower levels of entry due to lower profit margins, declining demand and negative growth; hence entry barriers would not create any more pressure to preclude entry anyway. A second reason is that declining demand creates excess capacity in firms, leading to more intense price competition and thus deterring new entry regardless of scale economies and the number of establishments in the market. The third reason is that in large industries incumbents may decide to reduce capacity by downsizing, instead of exiting (Horowitz and Horowitz, 1965; Harrigan, 1980, 1982;
10

Ghemawat and Nalebuff, 1985, 1990; Lieberman, 1990), so the number of establishments per firm and the levels of scale economies are reduced sharply.
This last phenomenon is visible in Table 1. Within the eight-year time span, the average number of establishments in declining industries is reduced from 2.75 to 1.76. Also, the average employment per firm in declining industries is reduced from 266.6 to 121.4. This corresponds to a reduction of about 55 % from initial levels in 1986, which is the highest change among three groups. Concurrently, high-growth industries have considerably lower numbers of employees per firm, and register no growth in this figure from 1986 (about 24.2) to 1993 (about 20). An important reason for this is that roughly 78% of high-growth industries are in the service sector, as opposed to 33% of declining industries and 54% of other industries. The services sector, particularly financial, insurance consultancy and real estate, experienced the highest levels of de-regulation and growth post 1986 in Portugal, which helps to explain these shares.
With the exception of declining industries, the change in the Herfindahl index (CHERF) variable has a negative effect on turbulence, i.e. reductions in concentration increase turbulence by reducing the entry barriers. The lack of significant effects of concentration changes on turbulence for declining industries suggests that reductions in the shares of the larger incumbents in a declining industry do not bring about greater opportunities for entry, possibly due to low profit expectations.
The absolute level of concentration (HERF) variable produces somewhat mixed effects on turbulence, with no discernible pattern. The lack of a stable pattern for the effects of concentration on turbulence may be explained the existence of interactions between concentration and factors such as industry growth, profit, cost structures and mobility barriers that affect the concentration in industries. Klepper (1996) argues that the stage of the product/industry life cycle plays an important role in determining both concentration and turbulence. Davis and Geroski (1997) found that more concentrated industries (as measured by the five-firm concentration ratio) exhibit more turbulence (in the case of their study, turbulence was measured by variance in market shares of the five largest firms in each industry), an effect for which there seemed to be no easy explanation. Sawyer (1971) suggests that higher levels of growth can bring about increases in concentration levels through the decline of small entrants and fast growth of large firms. The results on high-growth industries seem to support this view.
Some general, preliminary conclusions can be derived from this exploratory analysis of detailed, “disaggregated” industry/market level data. Long term positive industry growth rates generate higher levels of turbulence, but declining industries, where growth rates are negative or, at least, close to zero, display no significant correlation between growth and turbulence. Higher levels of volatility in growth are strongly correlated with higher levels of positive growth rates and both factors generate significant turbulence. Volatility in growth rates associated with declining industries does not cause turbulence.
Trial-and-error entrant activity is particularly associated with long term positive growth rates and contributes significantly to generate turbulence through market selection of infant industries. Declining industries do not experience significant levels of trial-and-error entry. Creative destruction processes are strongly associated with both declining and other (medium and low growth) industries. In these cases, displacement of relatively older firms by new, innovative firms seems to play a major role in generating turbulence.
11

The persistence of micro-firms in industries across all stages of the product/industry life cycle significantly contributes to turbulence in all industries. The ability of small firms to coexist with large firms in a market seems to be an important factor in creating turbulence for all industries. Reductions in concentration seem to contribute positively to turbulence, but the absolute level of concentration does not have a clear effect on turbulence, suggesting that interactions between this variable and other factors influencing turbulence should deserve be further explored.
12

REFERENCES Agarwal, R., 1997, Survival of firms over the product life cycle, Southern Economic Journal, 3, 571-584.
Agarwal, R., and D.B. Audretsch, 2001, Does entry size matter? The impact of life cycle and technology on firm survival, The Journal of Industrial Economics, 49, 21-43.
Agarwal, R., and M. Gort, 1996, The evolution of markets and entry, exit and survival of firms, The Review of Economics and Statistics, 78 (3), 489-498.
Agarwal, R., and M. Gort, 2002, Firm and product life cycles and firm survival, American Economic Review, Papers and Proceedings, 92, 184-190.
Audretsch, D.B. and Z.J. Acs, 1990, The entrepreneurial regime, learning, and industry turbulence, Small Business Economics, 2, 119-128.
Baldwin J.R., and P.K. Gorecki, 1991, Firm entry and exit in the Canadian manufacturing sector, Canadian Journal of Economics, 26 (2), 1970-1982.
Baldwin, J.R., and M. Rafiquzzaman, 1996, Selection and learning in the post-entry process, The Canadian Journal of Economics, 29 (2), S455-S457.
Baldwin, J.R., 1998, The dynamics of industrial competition: a North American perspective, Cambridge University Press.
Baltagi, B.H., 2005, Econometric analysis of panel data, 3rd Ed., John Wiley and Sons, New York.
Baptista, R., and M. Karaöz, 2005, Entrepreneurial human capital and the early survival chances of new businesses: the influence of opportunity-based entrepreneurship vs. necessity-based entrepreneurship. Mimeo: Center for Innovation, Technology and Policy Research, IN+, Lisbon.
Beesley M.E., and R.T. Hamilton, 1984, Small firms’ seedbed role and the concept of turbulence, Journal of Industrial Economics, 33 (2), 217-231.
Birch, D.L., 1987, Job generation in America, the Free Press, New York.
Cameron, A.C., and P.K. Trivedi, 2005, Microeconometrics: methods and applications, Cambridge University Press.
Cameron, K.S., M.U. Kim, D.A. Whetten, 1987, Organizational effects of decline and turbulence, Administrative Science Quarterly, 32 (2), 222-240.
Carree M.A, and A.R. Thurik, 2000, The life cycle of the U.S. tire industry, Southern Economic Journal, 67 (2), 254-278.
Caves, R.E., and M.E. Porter, 1977, from entry barriers to mobility barriers: conjectural decisions and contrived deterrence to new competition, Quarterly Journal of Economics, 91, 241-261.
Caves, R.E., 1998, Industrial organization and new findings on the turnover and mobility of firms, Journal of Economic Literature, 36, 1947-1982.
Davies, S.W., and P.A. Geroski, 1997, Changes in concentration, turbulence, and the dynamics of market shares, The Review of Economics and Statistics, 383-391.
Dunne, T., M.J. Roberts, 1991, Variation in producer turnover across U.S manufacturing industries in entry and market contestability, in. Entry and Market contestability, an international comparison, 187-203, Blackwell.
13
Dunne, T., M.J. Roberts, and L. Samuelson, 1988, Patterns of entry and exit in us manufacturing industries, Rand Journal of Economics, 19, 495-515.
Fotopoulos, G., and N. Spence, 1998, Entry and exit from manufacturing industries: symmetry, turbulence and simultaneity – some empirical evidence from Greek manufacturing industries, 1982-1988, Applied Economics, 30, 245-262.
Frömmel, M., and L. Menkhoff, 2003, Increasing exchange rate volatility during the recent float, Applied Financial Economics, 13, 857-863.
Geroski, P.A., 1991, Market Dynamics and Entry, Blackwell.
Geroski, P.A., 1995, What do we know about entry? International Journal of Industrial Organization, 13, 421- 440.
Geroski, P.A. and J. Schwalbach, (Ed.), 1991, Entry and market contestability, an international comparison, Blackwell.
Ghemawat, P., and B. Nalebuff, 1985, Exit, Rand Journal of Economics, 16 (2), 184-194.
Ghemawat, P., and B. Nalebuff, 1990, The devolution of declining industries. Quarterly Journal of Economics 105(1): 167-186.
Glazer, R., and A.M. Weiss, 1993, Marketing in turbulent environments: Decision processes and the time-sensitivity of information, Journal of Marketing Research, 30 (4), 509-521.
Gort, M. and S. Klepper, 1982, Time paths in the diffusion of product innovations, Economic Journal, 92, 630-653.
Hannan, J.T. and J. Freeman, 1989, Organizational ecology, Cambridge: Harvard University Press.
Harrigan, K.R., 1980, Strategy formulation in declining industries, The Academy of Management Review, 5 (4), 599-604.
Harrigan, K.R., 1982, Exit decisions in mature industries, The Academy of Management Journal, 25 (4), 707-732.
Horowitz I., and A.R. Horowitz, 1965, Firms in declining markets: the brewing case, The Journal of Industrial Economics, 13 (2), 129-153.
Jovanovic, B., 1982, Selection and the Evolution of Industry, Econometrica, 50, 649-670.
Jovanovic, B., and G.M. MacDonald, 1994, The Life-cycle of a Competitive Industry, Journal of Political Economy, 102, 322-347.
Khemani, R.S., and D.M. Shapiro, 1986, the determinants of new plant entry in Canada, Applied Economics, 18, 1243-1257.
Klepper, S., and E. Graddy, 1990, The evolution of the new industries and the determinants of market structure, The Rand Journal of Economics, 21 (1), 27-44.
Klepper, S., and J.H. Miller, 1995, Entry, exit and shakeouts in the United States in new manufacturing products, International Journal of Industrial Organization, 567-591.
Klepper, S., 1996, Entry, exit, growth and innovation over the product life-cycle, American Economic Review, 86, 562-583.
14

Klepper, S., and K.L. Simons, 2000, The making of an oligopoly: firm survival and technological change in the evolution of the U.S. tire industry, The Journal of Political Economy, 108 (4), 728-760.
Klepper, S., and K.L. Simons, 2005, Industry shakeouts and technological change, International Journal of Industrial Organization, 23, 23-43.
Lay, T.J., The determinants of and interaction between entry and exit in Taiwan’s Manufacturing, Small Business Economics, 20 (4), 319-334.
Lieberman, M.B., 1990, Exit from Declining Industries, “Shakeout” or “Stakeout”? Rand Journal of Economics, 21 (4), 538-553.
Mata, J., Sunk costs and entry by small and large plants, in: entry and market contestability, An international comparison, Ed. P.A. Geroski and J. Schwalbach, Blackwell, 49-62.
Mayer, W. J., and W.F. Chappell, 1992, Determinants of entry and exit: an application of the compounded bivariate Poisson distribution to U.S. industries: 1972-1977, Southern Economic Journal, 58 (3), 770-778.
Mazzucato, M., 2002, The PC industry: New economy or early life-cycle? Review of Economic Dynamics, 5, 318-345.
Orr, D., 1974, The determinants of entry: a study of the Canadian manufacturing industries, Review of Economics and Statistics, 56, 58-66.
Owen, N., 1971, Competition and structural change in unconcentrated industries, Journal of Industrial Economics, 19 (2), 133-147.
Rosenbaum, D., and F. Lamort, 1992, Entry, barriers, exit and sunk costs: an analysis, Applied Economics, 14, 297-304.
Rosenbaum, D.I., 1993, Profit entry and changes in concentration, International Journal of Industrial Organization, 11, 185-203.
Sawyer, M.C., 1971, Concentration in British manufacturing industry, Oxford Economic Papers, 23 (3), 352-383.
Schwartz, R.A., and E.I. Altman, 1973, Volatility behavior of industrial stock price indices, The Journal of Finance, 28 (4), 957-971.
Shapiro, D., and R.S. Khemani, 1987, The determinants of entry and exit reconsidered, International Journal of Industrial Organization, 5, 15-26.
Siegfried, J.J. and L.B. Evans, 1994, Empirical studies of entry and exit: a survey of the evidence, Review of Industrial Organization, 9, 121-155.
Sutton, J., Gibrat’s Legacy, 1997, Journal of Economic Literature, 35 (1), 40-59.
Yamawaki, H., 1991, the effects of business conditions, in Entry and Market contestability, an international comparison, Ed. P.A. Geroski and J. Schwalbach, Blackwell, 168-186.
15

Table 1: Comparative Summary of High-Growth, Declining and Other Industries
Variables Declining Industries
High-Growth
Industries
Other Industries
Total number of sectors in the sample 51 64 205Total Employment in 86 301274 124865 1330849Total Employment in 93 227906 229130 1657152Group Averages Calculated from Industry Values: Employment growth 86 -4.54 6.91 1.33Employment growth 93 -10.89 5.85 -1.10Average Employment 86 266.63 24.22 224.38Average Employment 93 121.37 20.00 165.19Herfindahl index 86 2875 1736 1256Herfindahl index 93 2824 1162 1078Average number of establishments 86 2.75 1.36 3.56Average number of establishments 93 1.76 1.28 3.49Share of number of firms with 5 or less employees 86 24.07 48.33 32.86Share of number of firms with 5 or less employees 93 29.61 50.11 36.84Average per firm industry wage (inflation adjusted) 86 29793 28889 29778Average per firm industry wage (inflation adjusted) 93 77209 78905 75953Average per firm share of employees with college degrees 86 3.61 6.28 3.38Average per firm share of employees with college degrees 93 5.89 9.19 5.56
Table 2: Descriptive Statistics of Turbulence Rates
Descriptive Statistics DECLINING HIGH-GROWTH OTHER Mean 15.93 26.59 18.12 Standard Deviation 7.93 12.20 8.01 Skewness 0.49 0.90 1.48 Range 33.14 67.43 60.76 Minimum 2.17 3.13 3.13 Maximum 35.30 70.55 63.89 Number of Industries in the sample 51 64 205
Table 3: Some Descriptive Statistics of Entry and Exit Rates
Descriptive Statistics DECLINING HIGH-GROWTH OTHER
AVERAGE TURBULENCE RATE (1986-93) 15.93 26.59 18.12 Average Turbulence rate (86-89) 16.87 31.97 21.45 Average Turbulence rate (90-93) 14.99 21.21 14.8 AVERAGE ENTRY RATE (1986-93) 7.19 16.10 9.99 Average entry rate (86-89) 9.30 21.25 13.29 Average entry rate (90-93) 5.08 10.95 6.70 AVERAGE EXIT RATE (1986-93) 8.74 10.49 8.13 Average exit rate (86-89) 7.57 10.72 8.16 Average exit rate (90-93) 9.91 10.26 8.10
16
17
Table 4: Trial-and-Error vs. Creative destruction (eight-year averages: 1986-93)
Average Exit Rates Type of Process DECLINING HIGH-GROWTH OTHER
(XRT)k=1 Trial-and-error process 1.76 4.01 2.07
∑(XRT)k≥4 Creative destruction process 4.12 3.69 3.70
(XRT)k=1: average exit rate of infants in an industry, age=1 (average industry exit rate of firms with one years of age)∑(XRT)k≥4: average exit rate of old firms, age>=4 (average industry exit rate of firms with four or more years of age)
Variable Description # Obs Mean Std. Dev. Min Max
TURB Turbulence Rate= Entry rate + Exit rate 2560 19.47 16.35 0 200
LNAVSCAP Log of Average social capital 2531 16.29 2.22 5.73 22.94
COVPEMP Coefficient of variation of employment *100 2528 188.81 97.73 20 635.34
LNAVNEST Log of Average per firm number of establishments 2559 0.30 0.62 -0.69 5.41
SMAL5 Share of small firms with 5 or less employees in industry (%) 2559 36.24 22.8 0 100
ECOSHR Share of industry in economy (%) 2559 0.29 0.606 0.00014 6.61
CHERF Change in Herfindahl index (%) 2565 0.79 41.87 -94.5 814.4
HERF Herfindahl index 2566 1474.96 2213 3 10000EMPGRO Employment Growth (%) 2558 6.38 44.23 -93.41 1080*
EMPGRO2 Employment Growth Squared (%) 2558 1995.77 33569 0 1165725
LNVOL Log of four years averages of volatility 2552 2.02 1.06 -1.48 5.93
ENTLAG Lag values of Entry rate 2560 11.06 13.73 0 200
XRT1 Lag values of one year old firms' exit rate (%) 2559 2.41 3.91 0 100
XRT12 Lag values of one year old firms' exit rate squared (%) 2559 21.10 214.18 0 10000
XRT4 Lag values of four or more years old firms' exit rate (%) 2239 3.96 4.64 0 100
YEARDM 1986 to 1989 =1 else =0 5656 0.50 0.50 0 1*29 cases out of 2558 observations display growth rates above 100
Table 5: Variable Descriptions and Summary Statistics

18
Table 6: Correlation Coefficients
TUR
B
LNA
VSC
AP
CO
VPE
MP
LNA
VN
EST
SMA
L5
EC
OSH
R
CH
ER
F
HE
RF
HE
RF
2
EM
PGR
O
EM
PGR
O2
LNV
OL
EN
TLA
G
XR
T1
XR
T12
XR
T4
TURB 1 LNAVSCAP -0.25 2 1 COVPEMP 0.032 0.128 1 LNAVNEST -0.137 0.372 0.081 1 SMAL5 0.336 -0.573 0.063 -0.255 1 ECOSHR 0.030 0.050 0.317 0.152 -0.045 1 CHERF -0.050 0.001 0.187 -0.002 0.031 -0.031 1 HERF -0.055 0.320 0.050 0.409 -0.238 -0.142 0.105 1 HERF2 -0.026 0.241 0.048 0.399 -0.149 -0.064 0.084 0.937 1 EMPGRO 0.201 -0.037 0.037 0.000 0.043 -0.029 0.363 0.095 0.076 1EMPGRO2 0.104 0.008 0.042 0.018 -0.007 -0.020 0.373 0.126 0.125 0.863 1LNVOL 0.208 -0.029 -0.162 -0.095 -0.045 -0.274 0.110 0.235 0.105 0.238 0.175 1 ENTLAG 0.398 -0.151 0.041 -0.065 0.251 0.037 -0.036 -0.019 -0.006 0.073 0.009 0.107 1XRT1 0.273 -0.159 -0.001 -0.108 0.216 0.009 -0.029 -0.034 -0.015 0.069 0.026 0.041 0.305 1XRT12 0.104 -0.051 -0.060 -0.013 0.025 -0.025 -0.028 0.070 0.056 0.067 0.017 0.066 0.198 0.741 1 XRT4 0.164 -0.140 0.009 -0.122 0.132 -0.003 0.025 -0.135 -0.122 -0.014 -0.020 0.033 0.018 0.006 -0.033 1YEARDM 0.240 -0.162 -0.022 -0.024 -0.039 -0.001 -0.052 0.037 0.031 0.065 0.019 0.337 0.099 -0.049 0.020 0.071

Table 7: Estimation Results – Declining Industries
Random-Effect Fixed-Effect First-Dif. Robust
Obs Groups
337 50
337 50
337 50
Wald Chi(2) 126.3 F 5.45 F 75.10 Prof>chi(2) 0.0 Prob>F 0.0 Prob>F 0.0
R2 overall 0.282 0.039 0.649
Hausman 182.69 Prof>chi(2) 0.0 Coef. z value p value Coef. t value p value Coef. t value p value
LNAVSCAP 0.3779 1.17 0.24 1.1792 1.42 0.16 0.1543 1.37 0.18COVPEMP 0.0030 0.42 0.68 -0.0022 -0.12 0.90 -0.0010 -0.13 0.89LNAVNEST 1.2904 0.96 0.34 -13.4102 -2.60 0.01 0.4615 0.32 0.75SMAL5 0.1635 3.58 0.00 0.0848 0.97 0.33 0.1447 2.58 0.01ECOSHR 0.6112 0.39 0.70 -6.6963 -0.78 0.43 1.2590 1.15 0.26CHERF 0.0086 0.57 0.57 0.0103 0.70 0.49 -0.0010 -0.12 0.91HERF -0.0020 -2.15 0.03 0.0024 1.90 0.06 -0.0001 -0.11 0.91HERF2 0.0000 2.05 0.04 EMPGRO -0.0650 -1.92 0.06 -0.1062 -2.91 0.00 EMPGRO2 0.0003 1.90 0.06 0.0004 2.53 0.01 0.0001 1.88 0.07LNVOL 0.7960 0.98 0.33 0.7494 0.57 0.57 0.7085 1.21 0.23ENTLAG 0.2925 4.65 0.00 0.0689 1.06 0.29 0.2805 4.00 0.00XRT1 0.2765 1.40 0.16 -0.3675 -1.76 0.08 0.2940 1.19 0.24XRT4 0.6314 5.24 0.00 0.6273 5.01 0.00 0.6436 3.10 0.00YEARDM 3.6790 2.38 0.02 3.9220 2.35 0.02 3.2579 2.25 0.03CONSTANT -3.9819 -0.66 0.51 -13.2671 -0.89 0.38
19

Table 8: Estimation Results – High-growth Industries
Random-Effect Fixed-Effect First-Dif. Robust
Obs 440 440 440
Groups 64 64 64
Wald Chi(2) 221.0 F 11.07 F 150.84
Prof>chi(2) 0.0 Prob>F 0.0 Prob>F 0.0 R2
overall 0.363 0.313 0.756
Hausman 397.71 Prob>chi(2) 0.0
Coef. z value p value Coef. t value p value Coef. t value p value
LNAVSCAP 0.1220 0.26 0.80 -1.6641 -1.59 0.11 0.0323 0.15 0.88COVPEMP 0.0174 1.50 0.13 0.0228 0.97 0.33 0.0145 1.31 0.19LNAVNEST -1.7722 -0.50 0.62 -0.5060 -0.07 0.94 -1.6231 -0.41 0.69SMAL5 0.1380 2.84 0.00 0.0858 0.76 0.45 0.1211 2.23 0.03ECOSHR -0.2834 -0.08 0.94 -5.2714 -0.30 0.76 -0.3345 -0.15 0.88CHERF -0.1006 -5.58 0.00 -0.0851 -4.35 0.00 -0.1053 -2.16 0.04HERF -0.0020 -2.55 0.01 HERF2 0.0000 -2.04 0.04 -0.0016 -1.19 0.24EMPGRO 0.0967 8.13 0.00 0.0920 7.38 0.00 0.0985 1.92 0.06LNVOL 2.4376 2.58 0.01 2.2540 1.34 0.18 2.0919 2.63 0.01ENTLAG 0.2916 5.75 0.00 0.1464 2.85 0.01 0.3237 5.09 0.00XRT1 0.2163 1.68 0.09 0.1248 0.91 0.36 0.8254 1.92 0.06XRT12 -0.0098 -2.28 0.03XRT4 0.1138 0.59 0.55 -0.0303 -0.15 0.88 0.1697 1.31 0.20YEARDM 7.9132 4.44 0.00 6.8677 2.78 0.01 8.4261 5.21 0.00CONSTANT -0.1391 -0.02 0.99 33.1627 1.86 0.06
20

Table 9: Estimation Results – Other Industries
Random-Effect Fixed-Effect First-Dif. Robust Obs 1421 1421 1421
Groups 205 205 205 Wald Chi(2) 794.86 F 27.85 F 395.01 Prof>chi(2) 0.0 Prob>F 0.0 Prob>F 0.0
R2 overall 0.361 0.206 0.787
Hausman 601.82 Prob>chi(2) 0.0
Coef. z value p value Coef. t value p
value Coef. t value p value
LNAVSCAP -0.4844 -2.28 0.02 -2.0913 -4.25 0.00 -0.0597 -0.75 0.45COVPEMP 0.0058 1.73 0.08 0.0188 2.28 0.02 0.0072 1.90 0.06LNAVNEST -1.5355 -2.66 0.01 -4.8057 -2.05 0.04 -1.2680 -1.63 0.10SMAL5 0.1244 6.78 0.00 0.2853 5.87 0.00 0.1465 4.91 0.00ECOSHR 1.6150 3.57 0.00 -2.6042 -0.56 0.57 ECOSHR2 0.2313 1.77 0.08CHERF -0.0281 -3.43 0.00 -0.0314 -3.61 0.00 -0.0333 -4.01 0.00HERF 0.0008 4.17 0.00 0.0023 3.17 0.00 0.0007 1.72 0.09EMPGRO 0.0258 2.39 0.02 0.0299 2.89 0.00 0.1094 3.11 0.00EMPGRO2 -0.0002 -2.84 0.01LNVOL 1.5222 4.42 0.00 0.5727 0.86 0.39 1.5289 2.83 0.01ENTLAG 0.2348 8.76 0.00 -0.0282 -1.01 0.31 0.2237 3.21 0.00XRT1 1.0861 9.13 0.00 0.1707 1.35 0.18 1.0977 3.30 0.00XRT4 0.3801 4.47 0.00 0.2662 3.04 0.00 0.4502 3.30 0.00YEARDM 5.2558 8.19 0.00 5.5855 7.17 0.00 5.4486 8.50 0.00CONSTANT 8.1446 2.09 0.04 33.9327 3.80 0.00
21