determinants of households’ space heating type and ... · multinomial logit model we examine the...
TRANSCRIPT
Int. J. Environ. Res., 6(4):1025-1038, Autumn 2012ISSN: 1735-6865
Received 10 May 2012; Revised 15 June 2012; Accepted 22 June 2012
*Corresponding author E-mail: [email protected]
1025
Determinants of Households’ Space Heating type and Expenditures in Italy
Laureti, T.* and Secondi, L.
1 University of Tuscia Viterbo, Italy
ABSTRACT: In Italy, several policy measures have been implemented in order to increase energy efficiencyand reduce carbon emissions especially concerning the household sector. However, in order to design andimplement these policy measures efficiently, it is necessary to get a better understanding of the factorsinfluencing household energy behavior. In this paper, by using disaggregated data from the 2009 ItalianHousehold Budget Survey, we firstly identify the factors which have a strong effect on the choice of a specificfuel by using a multinomial logit model taking into account the heterogeneity of households in the Italianregions. Secondly, we focus on the analysis of the determinants of space heating expenditure bearing in mindthe possible influence of the choice of fuel on energy consumption. Finally, by using the results of themultinomial logit model we examine the implications of a simulated scenario concerning tax incentives forenergy efficiency improvement. Many of the variables concerning the socio-economic characteristics ofhouseholds(i.e. family income and type of family) and the characteristics of the dwellings (i.e. year ofconstruction) prove to be important determinants of the choice of space heating technologies and of energyconsumption. Altogether, our results help to identify the determinants of household heating behaviour in Italy.Designing and developing target oriented policy measures focusing on specific determinants will help policymakers to achieve the main objectives of Italy’s energy policy which are to increase energy efficiency andlower energy consumption thus reducing carbon emissions.
Key words: Energy consumption, Environmental policies, Household budget data, Household energy behaviour
INTRODUCTIONOptimization of energy consumption and
consequent environmental concerns have been widelyconsidered recently (Quesada-Rubio et al., 2011;Zeinolabedin et al., 2011; Wang et al., 2011; Cui et al.,2011; Montero Lorenzo et al., 2011; Alipour et al., 2011;Chianese et al., 2012; Barrera et al., 2012) Over the lastten years the final consumption of energy byhouseholds in Italy has decreased slightly (Eurostat2010b). However households are responsible for asignificant share of the total consumption which reachedabout a quarter (23.7 %) of Italy’s final energyconsumption in 2009. The largest energy-using activityin households is space heating, which accounted foraround 70% of the total energy consumption ofhouseholds in 2008 (EEA, 2011) and produced 13.2 %of the total CO2 emissions in that year (Eurostat 2010a).Household energy conservation, which represents oneof the key aspects of sustainability issues, can beaddressed through a combination of national or localenvironmental policies and the citizens’ awareness andconsciousness of their important rolein reducing
energy consumption. In order to promote a moreefficient use of energy in the residential sector, localgovernmentscan adopt a range of policies andprograms, such as economic incentives (e.g. energy/carbon taxation, energy conservation grants, financialincentives to improve the energy efficiency of homesthrough insulation and to promote the installation ofmore efficient heating appliances).To support theprograms, local governments can also developtargeted information campaigns thus increasing thecitizens’ awareness of energy problems and theirknowledge about possibilities for reducing them.However, Italian households are a rather disparategroup with considerable variety in the type of spaceheating applied and its intensity of use across theItalian regions. Nevertheless, there are fewer studiesaimed at analysing the determinants of Italianhousehold energy consumption than in otherEuropean countries. To our best knowledge onlyCarraro et al. (2011) explored these aspects for Italy.
The aim of this paper is to provide policy makerswith detailed information concerning the factors
1026
Laureti, T. and Secondi, L.
influencing households’ fuel choice and consumptionin order to design and implement more effective energy-saving policies. By taking into account the various“contextual” factors which can affect the fuel choiceand its intensity of use, such as the geographic andclimatic conditions and the socio-economic context,the proposed micro-level analysis can improve theunderstanding of household energy behavior and ofthe impact on fuel choice of an energy efficiencypolicy.By using disaggregated household budget datafor the year 2009 collected by the Italian NationalStatistical Institute, we will analyse the Italianhouseholds’ behaviour towards energy consumptionfor space heating with a threefold perspective. Firstly,we will identify the factors which have the greatestimpact on the choice of a specific fuel by using amultinomial logit model which allows us to highlightwhether there are differences between householdschoosing most polluting fuels (such as coal and oil)and those choosing more eco-friendly space heatingsystems (such as solar panels and natural gas).Choosing gas instead of coal or oil, for instance, canbe a potential first step to lower CO2 emissions sincenatural gas has a lower emission factor than oil productsand it produces only 60% as much CO2 per unit ofenergy as coal (Mondéjar-Jiménez et al., 2010). Thenwe will investigatewhether there are geographicdifferences in the determinants of fuel choice.Secondly,we will focus on the analysis of the determinants ofenergy consumption for the chosen fuel after correctingfor the selection bias as the choice of space heatingfuel and its intensity of use may be related.In particular,a multinomial logit model is used to describe theselection process, which is modelled as having fivepossible outcomes, grouped according to the fuel use.The selection bias correction terms, obtained from themultinomial logit model, which captures the fact thatfuel choice is the first stage of energy consumption,are included in the energy consumption regressionmodels to correct for the correlation of errors betweenthe two decisions. Thirdly, we will use the results ofthe multinomial logit model to predict the implicationsof a simulated number of thermal retrofit investmentsthrough tax incentives. Since existing homes representthe greatest opportunity for efficiency improvements,our aim is to explore what role an increasedeffectiveness of tax support instrument could play inencouraging households to switch to an inherentlyless polluting fuel, such as natural gas, thus reducingCO2 emissions.
The remainder of the paper is organized as follows.Several sources were used with the aim of constructinga reliable data set in order to estimate the determinantsof fuel choice and fuel consumption in Italy. The
Household Budget Survey (HBS) carried out by theISTAT represents our primary source of data. The 2009survey,which considers a sample of 23,006 householdsrepresentative of all Italian households,was verysuitable for our study since it enabled us to obtaindetailed information regarding the socio-economiccharacteristics of the families and their dwellingstogether with their choice in terms of fuel used forheating purposes. We referred to additional sourcesof data in order to include variables related to the placeof residence (such as geographic location, heatingdegree days, the percentage of green spaces managedby public institutions) and information regarding thespecific type of heating fuel. In particular, the indicatorconcerning green spaces (in square meters) managedby public institutions at regional level per inhabitantfor the year 2009, the percentage of energyconsumption covered by renewable energy sources(year 2009) and the percentage of the residentpopulation living in municipalities supplied withmethane gas were obtained by ISTAT (ISTAT, 2012).Data on heating degree days (HDDs) which accountfor the differences in climate among the Italianregionswere taken from Eurostat. HDDs represents anindicator deriving from measurements of the outsideair temperatures which reflects the demand for energyneeded to heat a home or business in a specific region.Information concerning the prices of various fuels wasobtained from the Chambers of commerce of theregional capital in each region.As the units of variousfuels differ, the price of each type of fuel was convertedin a common unit considering a Tonnage of OilEquivalent (TOE) in order to make appropriatecomparisons.Data on the number of retrofits forimproving energy efficiency of existing buildings,relative to the populationliving in each region, wereobtained by the Italian National Agency for newtechnologies, Energy and sustainable economicdevelopment (ENEA, 2010).
In Italy over three quarters (76.8%) of thehouseholds use natural gas from municipal pipelinesas fuel for space heating, while 8.8% use LPG gascylinders or gas in external apparels. Only 5.5% of thetotal households use gas, oil or other liquid fuels whileabout 3% of the households use electricity or solarpanels.However it is worth noting that the choice offuels depends on the geographical position of thehouseholds and the availability of fuels. In fact, atregional level there is a completely different situationregarding the offer of natural gas with the lowest valuefor Sardinia where the construction of the pipelinenecessary for transporting the methane gas to thehouseholds is still underway,while the highest valueswere found for Lazio and Emilia Romagna in which the
Int. J. Environ. Res., 6(4):1025-1038, Autumn 2012
1027
whole regional population resides in municipalitiessupplied with methane gas.Therefore, the variable gasnetwork – which refers to the percentage of the residentpopulation in a region living in municipalities suppliedwith methane gas – was taken into account whenestimating the models, but it was not significant forexplaining the choice of household fuel and heatingexpenses. Concerning the use of the variousfuels,Lombardy and Tuscany showed the highestpercentages of natural gas with values equal to 92.1%and 89.3% respectively. The percentages concerningthe use of electricity for heating systems were higherin the hottest regions of Italy such as Sardinia (19.77%),Calabria (11.53%) and Sicily (9.26%) than the otherregions.A limitation of the HBS data used in ouranalysis is that the expenditures for various fuels arenot distinguished according to the final energy use. Inorder to account for the amount spent for space heatingpurposes we applied the breakdown of domestic fuelconsumption by major end-use(distinguished in spaceheating, water heating, cooking, electricity for lightingand appliances) in Italy provided by ENEA in 1999. Byusing the percentage of usage for space heating forthe various fuels (equal to 79.5% for natural gas, 91.7%for oil, 81.2% for Coal, 100% for wood, 23.3% for LPGand 2.2% for electricity) we can state that Italianhouseholds spent on average about 64 Euros fornatural gas which represented 2.7% of total householdexpenses in 2009. Compared to natural gas, householdsusing oil for space-heating purposes showed a highermonthly expenditurewhile lower level of expenses wereregistered for families using coal-wood, LPG gascylinders and electricity.However it is important to notethat there is a high heterogeneity in the amount spentfor heating purposes among the various regionswhichreflects the incidence on the expenses of variousfactors (geographical location,offer, climate conditionsand dwelling characteristics in terms of energy-efficiency). For example, Campania was the region withthe lowest amount of expenses for natural gas equal to40 Euros per month (and a weight on the total expensesequal to 2.1%) while Veneto in the North-Eastern partof Italy has the highest average expenses equal to 79Euros per month which represents 3% of total expenses.The HBS contains data on the characteristics of thedwellings, such as age, number of rooms, heatingsystem type, type of property(meaning both detachedand isolated)and ownership status.In our study thedwellings were divided into seven categories accordingto the year of construction (Year 1920 - Year2009) asit is expected that families living in old houses are morelikely to use oil or solid fuels such as coal for heatingpurposes, given that technologies relying on thesefuels were mostly applied in the past (Davis and Kilian,2008; Bernardini and Di Marzio, 2001). This is
particularly true in Italy where historical buildings,which represent a large part of our cultural heritage,may need specific technologies due to restrictedstorage space which may exclude the use of oil heatingor LPG gas cylinders and gas in external apparels. Asan example, only 2% of medieval buildings use oil andliquid fuels as heating technology against a percentageof the total sample equal to 8%. This is also the casefor those dwellings of historical importance which areobliged to respect landscape constraints. Since it isgenerally found that the energy efficiency of adetached house is much lower than that of a flat, adummy variable (Detached) was introduced to accountfor this aspect concerning about 30% of Italiandwellings. We also introduced a variable referring tothe number of rooms (Size) in order to take intoconsideration the size of the dwelling.
The choice of fuel and its intensity of use in Italycan be affected by the fact that more than 6% of thehouseholds live in isolated areas where natural gasfrom gas networks is difficult to find. Therefore weintroduced a dummy variable (Isolated) whichaccounts for the fact that families in these areas aremore prone to choose other types of fuel (Meier andRehdanz, 2010). Concerning the type of heating systemused, 77.7% of the Italian households rely onautonomous heating systems or on single applianceswhile 22.3% on central heating systems. On one hand,autonomous systems facilitate a careful considerationof heating needs and, therefore, encourage an energyefficient behavior of households. On the other hand,centralized systems, characterized by bettercombustion efficiency combined with the individualmetering of the heat used would be more efficient.Therefore this aspect was included in the analysis byintroducing a dummy variable (Central heating).Another important factor considered for explaining thechoice of fuel and the amount of energy consumptionis whether the households own the property or not(Owner). In Italy there is a high percentage of owner-occupied dwellings (75%) even if the effect ofownership on both the choice of fuel and heatingconsumption is very much debated (Baker et al., 1989;Vaage, 2000; Berkhout et al., 2004,Redhanz, 2007).Concerning the information provided by HBS onthesocio-economic and demographic characteristicsof the households, we selected the type of family (singleperson; couple without children; couple withchildren; other type of families), the level of educationand the age (34 year or less; 35-64; 65+) of the head ofthe family, the number of family members (Nc) and thetotal monthly expenditure. We introduced four differentlevels of education in our analyses (Degree, Diploma,Middle school and Primary school). Nesbakken (2001)

1028
found that the older the household head is, the higherthe level of energy consumption will be. This may bedue to the fact that the elderly spend more time at homethan the young and they often need higher indoortemperatures. We considered this aspect in ouranalyses since more than a third (33.6%) of thehousehold members interviewed for the ISTAT surveywere 65 years of age or older. Income also plays animportant role concerninghousehold behaviour ingeneral although its influence on environmental quality(Castellano et al., 2011), fuel choice andenergyconsumption is quite controversial (Vaage, 2000; Braun,2010). In order to examine this aspect for the Italianhouseholds more deeply we referred to the totalmonthly expenses as a proxy of the net income(Income). The total average household expense is about2,340 Euros per month with a large standard deviation(1606.16), as expected. Concerning the variable retrofitit is worth noting that the average value of 0.43% is theresult of heterogeneous values at regional level. In fact,the regional number of retrofits for improving energyefficiency of existing buildings in the year 2009 relativeto the population living in that region, varies from thelowest value of 0.09% recorded for Campania andCalabria to the highest value of 0.88% recorded forFriuli-Venezia Giulia.
MATERIALS & METHODSIn order to examine the determinants of the choice
of heating type by households we use a multinomiallogit model since it allows usto disentangle the influenceof the various factors on the probability of applyingone of the heating modes. Unordered choice modelscan be motivated by a random utility model (Greene,2000). For the householdi(i=1,…n)faced with J choices,the utility from choosing alternative j is:
(1)
If the household makes choice j then we assume that*iju is the maximum among the J utilities. Therefore,
the statistical model is driven by the probability thatchoice j is made, which
is ( )* * for all other ij ihP u u h j> ≠ .
Denoting iu the random variable which indicates thechoice made, so that takes on a value in , followingMcFadden (1973) we assume that the Jerror terms in[1], , are independent and identically distributed withWeibull distribution. This specification implies that theprobability of choosing fuelj takes the multinomial logitform given by:
* ' 1,..., , ..,ij ij iju j k Jε= + =γ z
where ijz is a 1 M× vectorwhich represents a set ofobservable exogenous factors related to the socio-demographic characteristics of the households, theattributes of the various choices and the socio-economic variables concerning the geographic areawhere the households live,while γ is the vector ofunknown coefficients. On the basis of expression [2],consistent maximum likelihood estimates of γ can beeasily obtained. However the estimates resulting froma multinomial model must be interpreted carefully. Sincethe multinomial model is non-linear in the parametersthe magnitude as well as the sign of a coefficient cannotbe interpreted directly as the effect produced by a
variable jz on the dependent variable. Dropping thesubscript and differentiating [2], marginal effects (ME)are given by:
where ( )jp z is the response probability in equation
[2] and mγ is the mth element of γ .
In order to obtain unbiased and consistentestimates of the factors influencing fuel consumptionfor home heating, we must bear in mind the possibleinfluence of the heating choice on energyconsumption. In fact the choice of space heatingequipment and its intensity of use may be relateddecisions made by the households. Observable andunobservable characteristics related to the householdmay influence both the choice of heating technologiesand the consumption of energy for home heatingpurposes. For example, households who prefer warmhomes may be prone to choose natural gas heatingsystems as well as being prone to consume more naturalgas. An environmentally concerned household maychoose the technology which is supposed to give thelowest CO2 emissions, and therefore the householdwill be also prone to low-energy consumption. The
( ) ( )( )
1
expP
exp
iji i J
ijj
u j
=
′= =
′∑
γ zz
γ z(2)
( ) ( ) ( )1 1, , 1,...,jj j m
jm
pp p j J m M
zγ
∂⎡ ⎤= − = =⎣ ⎦∂
zz z K
(3a)
( ) ( ) ( ) 1,...,jj h m
jm
pp p j h m M
zγ
∂=− ≠ =
∂z
z z
(3b)
Households’ Space Heating

1029
Int. J. Environ. Res., 6(4):1025-1038, Autumn 2012
consumption of fuel k, ky , is observed only if categoryj=k is observed, which occurs when a householdchooses fuel k. This happens when the utility fromfuel k is the highest of all the available fuels such that
( )* *maxik ijj ku u
≠> (4)
Therefore the model to be estimated is a systemcomposed of a demand equation and a selectionequation:
ik ik iky w′= +β x (5a)* ' 1,..., ,..,ij ij iju j k Jε= + =γ z
(5b)
where (5a) is the equation describing energyconsumption conditioned by the choice of fuel j while[5b] models the selection process with latent variable
*iju representing the indirect utility level of the ith
household associated with category j which determine
the choice of fuel.Assuming that the error terms ijε arei.i.d. according to a Weibull distribution, the probabilityfor household i for choosing fuel k takes themultinomial logit form [2]. The vector xin equation[5a]contains all determinants of fuel k consumptionfor space heating such as the socio-economiccharacteristics of the households and of the area inwhich the household lives while the disturbance term
ikw verifies ( ), 0ikE w =x z and ( ) 2,ikV w σ=x z .
The problem is to estimate the parameter vector βwhile taking into account that the disturbance term
ikw may not be independent of ijε . This wouldintroduce some correlation between the explanatoryvariables and the disturbance term in the energyconsumption equation [5a]. For this reason, leastsquares estimates of β would not be consistent.To overcome this problem we use the methodsuggested by Bourguignon et al. (2007) thus estimatingthe following model:
ik ik iky λ η′= + +β x (6)
where ikη is a residual that is mean-independent of the
regressors and λ represents the selection biascorrection term1 given by:
( ) ( ) ( )* *
1j
k k j jj k j
Pr m P r m P
Pλ σ
≠
⎡ ⎤⎢ ⎥= +
−⎢ ⎥⎣ ⎦∑ (7)
where kP represent the probability that any
alternative k is preferred, *jr is the correlation
between ijw and ( )( )* 1 1,...,ij ijG j Jε ε−= Φ = .
DISCUSION & RESULTSBy assuming that a household faces a set of
unordered alternatives, represented by the heatingfuels classified into five categories - oil, gas networks,LPG gas cylinders and gas in external appliances, coaland wood, electricity and solar panels - we estimated amultinomial logit model for Italian households as awhole, testing various specifications with different setsof variables.
Estimation results are reported in Table 1 wherethe explanatory variables are classified into threegroups: household socio-economic characteristics,dwelling characteristics and contextual variables.Referr ing to the householdsocio-economiccharacteristics, we found that income significantlyinfluences the choice of gas, coal and wood as heatingfuels. More specifically, households with higherincomes are more likely to choose gas (M.E. 0.0054)and less likely to choose wood or coal (M.E. -0.0042)as also obtained by Carraro et al (2011). We found thatcouples without children are more likely to choose gasthan single people (M.E. 0.0219). The results confirmthat education is a relevant socio-economic factor thatinfluences the choice of space heating. People with alower level of education than diploma are less likely tochoose gas for heating purposes (M.E. equal to -0.0664and -0.1015 for middle school and primary school,respectively) and are more likely to choose coal andelectricity (M.E. equal to 0.0035 and 0.0030 for middleand primary school, respectively). Braun (2011) inexplaining similar results for his study referred to thehousehold production theory in which the fairly highpropensity for gas among the well-educatedhouseholds is due to the relative ease for using thesetechnologies.
Modern lifestyles, fewer inspections and long-termcontracts with suppliers, which characterize thedistribution of gas from networks, make themanagement of this type of fuel less time-intensivethan other modes of residential space heating fuels.Moreover, a highly educated household head may havemore consideration for the environment and moreenvironmental awareness (Pirani and Secondi, 2011;Cordente-Rodríguez et al., 2010). A similar explanationof this evidence can be found in Carraro et al. (2011)who stated that highly educated household heads aremore likely to choose natural gas since it is cleaner

1030
Laureti, T. and Secondi, L.
than the other types of energy. Families in which thehousehold head has a low level of education (middleschool or primary school) are more prone to choosesolid fuels such as coal or wood as space heatingmodes which can be time consuming to manage. Inreference to dwelling attributes we agree with Carraroet al. (2011) since we found that families living in anisolated house are more likely to choose oil, coal-woodand gas cylinders (M.E. equal to 0.091, 0.2189 and0.1070 respectively) while their probability of choosinggas is 0.41 lower than people living in dwellings locatedin urban areas. This may be due to the difficulty oflinking up to the gas network and to the fact that theymay have more space available for external storage offuels. Home owners have a probability of 0.0318 higherof choosing natural gas than families living in renteddwellings while home owners were less prone tochoose gas cylinders (M.E. -0.0248) and electricity(M.E. -0.0063). As expected the year of constructionof the dwelling is one of the most important variablesdetermining the choice of fuel. The estimationsobtained confirm our assumptions. The more recentthe year of construction of the dwelling, the more likelythe probability of choosing natural gas as fuel (M.E.goes from 0.0234 for the dwellings built between 1920e 1945 to a value equal to 0.0845 for the dwellings builtin 2000 or later).
On the subject of the contextual variables, wefound that having more green areas in the regions inwhich families live increases the probability of usinggas as heating fuel in their dwellings rather than othertypes of fuels.The number of retrofits carried out for improving theenergy efficiency of existing buildings is found tosignificantly affect the probability for almost all fueltypes.
Specifically the greatest positive effect was foundfor natural gas (M.E. 0.0340) while the probability ofchoosing gas cylinders and coal-wood was lower.
In order to take into account the high level ofheterogeneity among the Italian regions concerningthe choice and consumption of fuels and thedifferences in climate, economic development and inenergy policies we divided Italy into the following fivemacro-regions:North East (which includes TrentinoAlto Adige, Veneto, Friuli Venezia Giulia and EmiliaRomagna), North West (Piedmont, Aosta Valley,Lombardy and Liguria), Central Regions (Tuscany,Umbria, Marche and Lazio), South (Abruzzo, Molise,Campania, Apulia, Basilicata, Calabria) and the Islands(Sicily and Sardinia). Localization variables wereintroduced to offer a clear picture of the choice of Italianhouseholds since families living in the Central,Southern and Insular regions are more likely to choose
solid fuels or electricity than households living in theNorthern part of Italy. Therefore firstly we includeddummy variables in the global models and secondlywe carried out separate analyses for each macro-area.
The heterogeneity among the regions concerningthe use of fuels is still present at macro-area level. Inthe Northern and Central regions of Italy over 80% ofItalian households choose natural gas as fuel forheating purposes with the highest percentagesregistered in the North-Western regions (88.09%) whilein the Southern and Insular regions these percentagesare equal to 65.01% and 38.75%, respectively. In thesetwo macro-areas many households use electricity (orsolar panels) for heating purposes (5.47% in theSouthern regions and 12.1% in the Islands). Therefore,in order to analyze in depth household behavior whenchoosing the type of fuel for heating purposes, weestimated separate multinomial logit models for eachmacro area (North East, North West, Centre, South andIslands) bearing in mind the differences in the energyand planning policies, in solar irradiation and thepossibility to latch on to the gas network.Due to limitedspace we report here only the results of the multinomiallogit model for Southern regions (Table 2) while theresults for the other areascan be obtained upon request.Concerning socio-economic characteristics, incomehas a more noticeable influence in the macro-areas thanin the model estimated considering the overall sample.In fact the effects that the variable has on each singlemacro-area are particularly interesting. With an increaseof a family’s income, the probability of choosing gasfor heating purposes increases significantly only inthe North East while the probability of choosing coalor wood decreases. With an increase of income inSouthern Italy the probability of using coal or wooddecreases (M.E. -0.0258).Households living in theseregions are also less prone to choose electricity andsolar panels when income increases. On the other hand,the Islands represent the macro-area in which anincrease in income has a positive effect on theprobability of choosing oil.
As for dwelling characteristics, ownership statusdid not seem to influence the choice of any specifictype of fuel in the Northern regions, while itsignificantly influences the choice in Central andSouthern Italy and above all in the Islands. Moreoverin the Centre as in the general model for Italy, theprobability of choosing gas increases while the use ofgas cylinders decreases. Home owners living in theSouthern part of Italy are less likely to chooseelectricity while they are more likely to choose gas andcoal-wood in the Islands (M.E. 0.1359 and 0.0267,respectively) and they are less prone to choose gascylinders and electricity. Finally, significant marginal

1031
Int. J. Environ. Res., 6(4):1025-1038, Autumn 2012Ta
ble 1
. Mar
gina
l Effe
cts o
n pr
obab
ility
of t
he ch
oice
of
heat
ing
fuel
O
IL
GA
S
LPG
GA
S C
YL
IND
ERS
CO
AL
- W
OO
D
EL
ECT
RIC
ITY
& S
OLA
R P
AN
ELS
M
.E.
St.e
rror
M.E
. St
.erro
r
M.E
. St
.err
or
M
.E.
St.e
rror
M
.E.
St.e
rror
H
ouse
hold
cha
ract
eris
tics
In
com
e -0
.000
4 0.
0011
0.00
54
0.00
22
**
0.00
01
0.00
14
-0
.004
2 0.
0011
**
* -0
.000
9 0.
0007
Sing
le p
erso
n re
f.
Co
uple
with
out c
hild
ren
-0.0
068
0.00
45
0.
0219
0.
0082
**
* -0
.010
4 0.
0049
**
0.
0005
0.
0039
-0.0
052
0.00
17
***
Coup
le w
ith c
hild
ren
-0.0
107
0.00
46
**
0.00
12
0.00
84
0.
0024
0.
0050
0.01
41
0.00
40
***
-0.0
070
0.00
19
***
Oth
er h
ouse
hold
s -0
.008
8 0.
0051
*
-0.0
049
0.00
99
0.
0072
0.
0061
0.00
82
0.00
49
* -0
.001
7 0.
0019
Deg
ree
0.00
42
0.00
63
0.
0159
0.
011
-0
.014
3 0.
0063
**
-0
.011
1 0.
0054
**
0.
0053
0.
0031
*
Dip
lom
a re
f.
M
iddl
e Sc
hool
0.
0010
0.
0043
-0.0
664
0.00
84
***
0.02
59
0.00
5 **
* 0.
036
0.00
48
***
0.00
35
0.00
19
* El
emen
tary
Sch
ool
0.00
49
0.00
49
-0
.101
5 0.
01
***
0.03
22
0.00
59
***
0.06
14
0.00
65
***
0.00
30
0.00
21
O
wne
r 0.
0019
0.
0040
0.03
18
0.00
73
***
-0.0
248
0.00
46
***
-0.0
027
0.00
33
-0
.006
3 0.
0019
**
* D
wel
ling
char
acte
risti
cs
Si
ze
0.00
50
0.00
11
***
-0.0
005
0.00
21
-0
.003
4 0.
0013
**
* 0.
0022
0.
0009
**
-0
.003
3 0.
0006
**
* Y
ear 1
920
ref.
Yea
r 194
5 -0
.020
1 0.
0070
**
* 0.
0234
0.
0137
*
0.00
60
0.00
91
-0
.015
0.
004
***
0.00
57
0.00
45
Y
ear 1
960
0.00
40
0.00
74
0.
0396
0.
0112
**
* -0
.017
1 0.
0064
**
* -0
.026
6 0.
0033
**
* 0.
0003
0.
0031
Yea
r 198
2 0.
0171
0.
0068
**
0.
0374
0.
011
***
-0.0
201
0.00
65
***
-0.0
331
0.00
39
***
-0.0
014
0.00
29
Y
ear 1
991
0.01
46
0.00
87
* 0.
0303
0.
0123
**
-0
.016
2 0.
0066
**
-0
.026
4 0.
0032
**
* -0
.002
3 0.
003
Y
ear 2
000
-0.0
055
0.00
73
0.
0414
0.
0121
**
* -0
.004
1 0.
0077
-0.0
289
0.00
31
***
-0.0
03
0.00
31
Y
ear 2
009
-0.0
343
0.00
55
***
0.08
45
0.01
13
***
-0.0
164
0.00
78
**
-0.0
301
0.00
33
***
-0.0
038
0.00
32
Is
olat
ed
0.09
06
0.01
08
***
-0.4
143
0.01
56
***
0.21
89
0.01
39
***
0.10
7 0.
0095
**
* -0
.002
1 0.
0031
Det
ache
d 0.
0100
0.
0039
**
-0
.089
4 0.
0071
**
* 0.
0348
0.
0043
**
* 0.
043
0.00
38
***
0.00
15
0.00
15
Co
ntex
tual
var
iabl
es
N
orth
-Wes
t re
f.
N
orth
-Eas
t 0.
0055
0.
0132
-0.2
934
0.03
14
***
0.11
79
0.02
52
***
0.14
77
0.02
67
***
0.02
23
0.01
31
* Ce
ntre
0.
0776
0.
1416
-0.8
759
0.02
82
***
-0.0
679
0.01
92
***
0.86
0.
1631
**
* 0.
0062
0.
0383
Sout
h 0.
0253
0.
0862
-0.8
885
0.04
28
***
-0.0
987
0.04
25
**
0.53
45
1.09
98
0.
4274
1.
1554
Isla
nds
0.00
68
0.10
11
-0
.890
6 0.
0148
**
* -0
.064
8 0.
0129
**
* 0.
5308
1.
2857
0.41
79
1.34
42
G
reen
spac
e -0
.040
8 0.
0087
**
* 0.
1065
0.
0151
**
* -0
.007
5 0.
0098
-0.0
416
0.00
72
***
-0.0
166
0.00
62
***
Rene
wab
le E
nerg
y
0.00
01
0.00
01
-0
.001
1 0.
0002
**
* 0.
0004
0.
0001
**
* 0.
0004
0.
0001
**
* 0.
0002
0.
0001
**
* H
DD
0.
0005
6 0.
0000
1 **
* -0
.000
2 0.
0000
2**
* 0.
0000
7 0.
0000
1 **
* 0.
0000
60.
0000
1 **
* -0
.000
09
0.00
001
Re
trofit
0.
0153
0.
0044
**
* 0.
034
0.00
74
***
-0.0
351
0.00
44
***
-0.0
137
0.00
33
***
-0.0
005
0.00
37
Pr
ice
of fu
els
G
as p
rice
(per
TO
E)
0.00
53
0.00
06
***
-0.0
124
0.00
1 **
* 0.
0007
0.
0005
0.00
53
0.00
04
***
0.00
11
0.00
03
***
Coal
-Woo
d pr
ice
(per
TO
E)
-0.0
070
0.00
27
**
0.01
77
0.00
49
***
-0.0
165
0.00
23
***
-0.0
046
0.00
22
**
0.01
03
0.00
35
***
Gas
cyl
inde
rs p
rice
(per
TO
E)0.
0006
0.
0001
**
* -0
.001
3 0.
0002
**
* 0.
0007
0.
0001
**
* -0
.000
1 0.
0001
0.00
013
0.00
004
O
il pr
ice
(per
TO
E)
0.00
04
0.00
83
0.
0084
0.
0012
**
* -0
.007
3 0.
0007
**
* -0
.001
0.
0006
*
-0.0
005
0.00
03
El
ectri
city
pric
e (p
er T
OE)
-0
.214
4 0.
0675
**
* 0.
425
0.11
19
***
0.13
15
0.07
03
* -0
.259
5 0.
052
***
-0.0
826
0.04
45
Nu
mbe
r of O
bser
vatio
n 20
492
NOTE
S: *
Sign
ifica
nt a
t th
e 10
% l
evel
. **
Sign
ifica
nt a
t th
e 5%
lev
el **
* Si
gnifi
cant
at
the
1% l
evel
1032
effects for Central regions reflect those displayed inthe overall model.
The size of the dwelling has a significant effect onthe choice of a specific fuel in all the macro-areas exceptfor the North-East. On the contrary to the global model,with an increase in the size of their property, familiesliving in the North East are less likely to choose naturalgas while families in the South are more prone tochoose oil and less likely to choose gas, electricityand solar panels. With an increase in the size of theproperty, families living in the Islands are more likelyto choose oil or coal and wood and less likely to choosegas cylinders and electricity.
Families living in isolated homes in Southern Italyand in the Islands are less likely to use electricity orsolar panels.
Concerning the age of the building, families livingin Southern Italy in recently built houses are less proneto use electricity and solar panels compared to theglobal model even if solar panels could produce profitsand benefits due to the larger amount of sunshinewhich is typical of these regions. It is important tonote that there may be a compensation effect due tothe fact that electricity is classified together with solarpanels in the HBS survey.
We estimated five energy consumption regressionmodels, testing various specifications with differentvariables,-regarding each type of fuel used byhouseholds according to the choice made - by usingweighted least squares to account for theheteroskedasticity present in the model due toselectivity1 (Bourguignon et al., 2007).
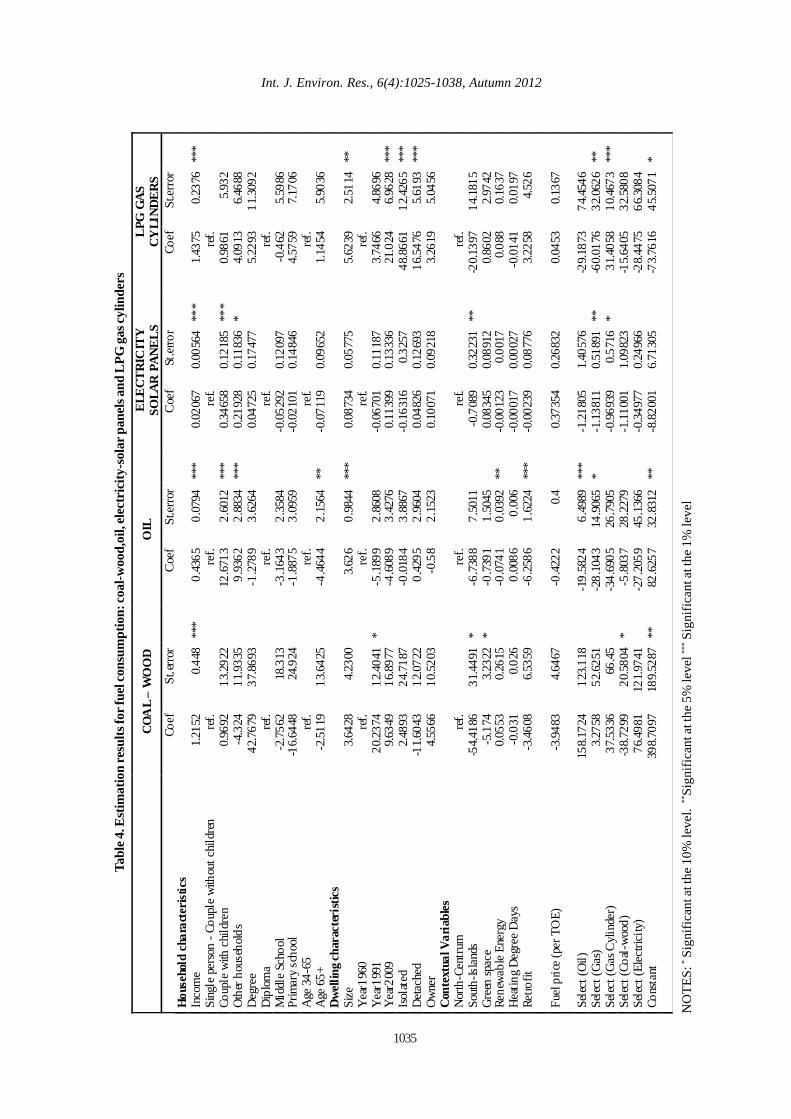
Table 3 summarizes the results of the modelestimated for describing the determinants of gasconsumption while the results for the remaining fourfuels2are shown in Table 4.
The results obtained overall support dwellingattributes as important determinants of energyexpenses. In particular, gas consumption for heatingpurposes is found to increase with the age of thehouse. Dwellings built before 1920 differ significantlycompared to more recent building. Families living indwellings built 10 years ago (or less) spent less for gasthan older houses (constructed before 1920). The ageof the house is also significant for LPG and gas cylinderexpenses and we found that recently built housesspend more. Other studies have found that energyconsumption for space heating increases with the ageof the house (Nesbakken, 2001; Carraro et al., 2011).This effect may be due to better thermal insulation innewly-built houses leading to lower levels of energyconsumption (Schuler et al., 2000).
Heating expenditures for gas, oil and gas cylindersincrease with the number of rooms (Size). Families livingin detached houses and those living in isolateddwellings spend more for gas and gas cylinderscompared to other types of dwellings.
In reference to the consumption of gas, familiesliving in dwellings with centralized heating systemsspend less than households with single heatingsystems. However it is important to note thathouseholds with centralized heating systems generallylive in apartment blocks and therefore they do notrequire as much energy for heating as households livingin detached houses (Nesbakken, 2001).
Concerning the socio-economic characteristics ofthe household we found that the age of thehouseholder has a significant impact on gas and oilconsumption for space heating. Our estimation resultsconfirm the hypothesis that elderly household headsspend more for gas consumption while they tend tospend less for oil. The lower the level of education ofthe household head, the more he/she spends on gas.The estimated coefficients for household income arepositive for all fuel types, i.e. the higher the householdincome, the more the household will spend for heating.This result agrees with the evidence shown thathouseholds with higher incomes use more energy (Mollet al., 2005; Vringer and Blok, 1995 Abrahamse andSteg, 2011). Although it has been found that higherincome consumers tend to be more environmentallyconscious, this concern for the environment may nottranslate into personal energy use consciousness(Heslop et al., 1981).
The type of family affects the consumption of gas,oil, electricity - solar panels since single householderare found to consume less energy than families whilecouples with children tend to spend more.It isinteresting to note that ownership status does notnecessarily have a significant effect on final energyconsumption for all types of fuel. In fact,being a homeowner or a renter is not a critical factor according toour results for all types of fuels considered in the study,but, as already mentioned, it is significant indetermining the choice of fuel for space heating. Theevidence on the role of tenure type on energy demandis ambiguous across countr ies andtechnologiesalthough Italy differs from other countriessince about three quarters of families live in their ownproperties.
Carraro et al. (2011), who only analysed gasconsumption in Italy treating the fuel expenditures asexpenditures for the purpose of space and waterheating, found a similar result. Rehdanz (2007) showedin his study for Germany that home owners have lowerheating expenditures. For the US, ownership is not a
Households’ Space Heating

1033
Int. J. Environ. Res., 6(4):1025-1038, Autumn 2012
Tabl
e 2 . M
argi
nal E
ffec
ts o
n pr
obab
ility
of t
he ch
oice
of
heat
ing
fuel
– S
outh
ern
Ital
y
ELE
CTR
ICIT
Y
O
IL
NAT
URA
L G
AS
GA
S C
YLIN
DE
R CO
AL-
WO
OD
A
ND
SO
LAR
PA
NEL
S
H
ouse
hold
cha
racte
ristic
s
Tota
l Exp
ense
s -0
.003
9 0.
0028
0.00
35
0.00
33
-0.0
001
0.00
15
-0.0
258
0.00
46**
* -0
.011
00.
0031
***
D
egre
e 0.
0028
0.
0151
0.01
85
0.01
78
-0.0
185
0.00
63**
* -0
.034
9 0.
0162
**
0.00
960.
0122
D
iplo
ma
ref.
Mid
dle
scho
ol
-0.0
159
0.01
03
-0
.010
4 0.
0132
0.
0061
0.00
6
0.03
38
0.01
28**
* 0.
0034
0.00
69
Elem
enta
ry sc
hool
-0
.000
9 0.
0115
-0.0
281
0.01
56*
-0.0
047
0.00
65
0.07
0.
0146
***
0.00
280.
007
Is
olat
ed
0.01
54
0.02
33
-0
.179
4 0.
0329
***
0.08
480.
0214
***
0.14
47
0.01
94**
* -0
.003
0.00
91
Size
(roo
ms)
0.00
66
0.00
31
**
-0.0
06
0.00
37*
-0.0
008
0.00
17
0.00
1 0.
003
-0
.008
20.
0022
***
Si
ngle
per
son
ref.
Coup
le w
ithou
t chi
ldre
n 0.
0024
0.
0113
0.00
62
0.01
34
-0.0
101
0.00
58*
0.02
16
0.01
35*
-0.0
145
0.00
56 *
**
Coup
le w
ith c
hild
ren
-0.0
186
0.01
14
* 0.
0239
0.
0136
* -0
.009
10.
0062
0.
0452
0.
0122
***
-0.0
046
0.00
66
Oth
er h
ouse
hold
s -0
.010
6 0.
0133
0.01
48
0.01
6
-0.0
039
0.00
73
0.01
04
0.01
52
-0.0
026
0.00
7
Char
acte
ristic
s of t
he d
welli
ng
Si
ze
0.00
66
0.00
31
**
-0.0
06
0.00
37*
-0.0
008
0.00
17
0.00
1 0.
003
-0
.008
20.
0022
***
Y
ear1
920
ref.
Yea
r194
5 -0
.019
7 0.
0196
0.02
89
0.02
22
-0.0
022
0.01
06
-0.0
124
0.01
66
0.00
330.
0119
Y
ear1
960
0.05
2 0.
0211
**
-0
.036
9 0.
0224
* -0
.002
0.00
89
-0.0
341
0.01
36**
* -0
.001
80.
0098
Y
ear1
982
0.07
1 0.
0188
**
* -0
.048
2 0.
0202
***
-0.0
032
0.00
81
-0.0
407
0.01
47**
* -0
.008
50.
0094
Y
ear1
991
0.06
41
0.02
78
**
-0.0
569
0.02
92**
0.
0061
0.01
18
-0.0
353
0.01
41**
* -0
.021
50.
0074
***
Y
ear2
000
-0.0
175
0.01
95
0.
0115
0.
0236
0.
0232
0.01
44*
-0.0
304
0.01
53**
-0
.015
70.
0085
*
Yea
r200
9 -0
.058
5 0.
0163
**
* 0.
0685
0.
0212
***
0.01
320.
014
-0
.034
5 0.
0173
**
-0.0
212
0.00
85 *
**
Own
er
-0.0
137
0.01
02
0.
0156
0.
0122
0.
0024
0.00
57
0.00
26
0.00
94
-0.0
212
0.00
63 *
**
Isol
ated
0.
0154
0.
0233
-0.1
794
0.03
29**
* 0.
0848
0.02
14**
* 0.
1447
0.
0194
***
-0.0
030
0.00
91
Deta
ched
-0
.005
7 0.
0100
-0.0
657
0.01
34**
* 0.
0318
0.00
74**
* 0.
0905
0.
0094
***
-0.0
069
0.00
48
Num
ber o
f Obs
erva
tions
57
85
NO
TES:
* Sig
nific
ant a
t the
10%
leve
l. **
Sign
ifica
nt at
the 5
% le
vel **
* Sig
nific
ant a
t the
1%
leve
l

1034
Laureti, T. and Secondi, L.
Table 3. Estimation results for gas consumption Coef. S t.error
Household characteristics Income 0.61 0.06 *** Single person re f. Couple without children 1.72 1.58 Couple with children 8.05 1.83 *** Other type of households 10.89 1.66 *** Degree -2.38 1.81 Diploma re f. Middle School 5.74 1.73 *** Elementary school 8.87 2.13 *** Owner -0.73 1.42 Age 34 year or less re f. Age 35-64 2.404 1.81 Age 65+ 4.66 2.12 ** Dwelling characteristics Size 7.07 0.49 *** Year1920 re f. Year1945 -7.98 2.77 *** Year1960 -11.58 2.75 *** Year1982 -8.89 2.66 *** Year1991 -8.56 2.75 *** Year2000 -8.77 3.16 *** Year2009 -17.68 3.14 *** Isolated 22.63 6.32 *** Detached 19.34 2.24 *** Central Heating -25.12 1.38 *** Contextual variab les Nor th West re f. Nor th East 6.83 -4.19 Centre -6.43 3.42 * South -20.14 7.05 *** Islands -17.79 7.41 ** Green space 0.01 0.66 Renewable Energy 0.14 0.04 *** HDD -0.0015 0.010 Retrofit -2.21 1.88 Gas price (per TOE) -0.01 0.46 Select (Oil) 39.16 20.93 * Select (Gas) 5.18 9.53 Select (Gas cylinder) 52.98 16.95 *** Select (Coal-wood) 71.16 22.46 *** Select (Elec triticy) -30.91 27.19 Constant 44.44 52.31 NOTES: * Significant at the 10% level. **Significant at the 5% level *** Significant at the 1% level
significant determinant in Liao and Chang (2002), butDavis and Kilian (2008) found that home owners usedmuch more gas than renters in a more recent study.Meier and Rehdanz (2010) found that UK home ownersreact differently to changes in income levels thanrenters.
Concerning the expenditure for natural gas, ourresults confirm the assumption that energyconsumption significantly changes according to the
geographical location of the house with lower expensesfound in Central, Southern Italy and the Islands.Among the contextual factors, the heating degree daysdirectly influence the energy consumption expensestoo. As discussed in Carraro et al. (2011) this evidencecan provide regional and local bodies with usefulinformation in order to identify households with highconsumption of gas which can be encouraged toemploy energy conservation measures or technologies.
1035
Int. J. Environ. Res., 6(4):1025-1038, Autumn 2012
Tabl
e 4. E
stim
atio
n re
sults
for f
uel c
onsu
mpt
ion:
coal
-woo
d,oi
l, el
ectr
icity
-sol
ar p
anel
s and
LPG
gas
cylin
ders
C
OA
L –
WO
OD
O
IL
ELE
CT
RIC
ITY
SO
LAR
PA
NE
LS
LPG
GA
S C
YLI
ND
ER
S
Coef
St
.err
or
C
oef
St.e
rror
Coe
f St
.erro
r
Coef
St.e
rror
Hou
seho
ld c
hara
cter
istic
s
In
com
e 1.
2152
0.
448
***
0.43
65
0.07
94
***
0.02
067
0.00
564
***
1.43
75
0.23
76
***
Sing
le p
erso
n - C
oupl
e w
ithou
t chi
ldre
n re
f.
ref.
ref.
re
f.
Co
uple
with
chi
ldre
n 0.
9692
13
.292
2
12.6
713
2.60
12
***
0.34
658
0.12
185
***
0.98
61
5.93
2
Oth
er h
ouse
hold
s -4
.324
11
.933
5
9.93
62
2.88
34
***
0.21
928
0.11
836
* 4.
0913
6.
4688
Deg
ree
42.7
679
37.8
693
-1
.278
9 3.
6264
0.04
725
0.17
477
5.
2293
11
.309
2
Dip
lom
a re
f.
ref.
ref.
re
f.
M
iddl
e Sc
hool
-2
.756
2 18
.313
-3.1
643
2.35
84
-0
.052
92
0.12
097
-0
.462
5.
5986
Prim
ary
scho
ol
-16.
6448
24
.924
-1.8
875
3.09
59
-0
.021
01
0.14
846
4.
5759
7.
1706
Age
34-
65
ref.
re
f.
re
f.
ref.
Age
65+
-2
.511
9 13
.642
5
-4.4
644
2.15
64
**
-0.0
7119
0.
0965
2
1.14
54
5.90
36
D
wel
ling
char
acte
rist
ics
Si
ze
3.64
28
4.23
00
3.
626
0.98
44
***
0.08
734
0.05
775
5.
6239
2.
5114
**
Y
ear1
960
ref.
re
f.
re
f.
ref.
Yea
r199
1 20
.237
4 12
.404
1 *
-5.1
899
2.86
08
-0
.067
01
0.11
187
3.
7466
4.
8696
Yea
r200
9 9.
6349
16
.897
7
-4.6
089
3.42
76
0.
1139
9 0.
1333
6
21.0
24
6.96
28
***
Isol
ated
2.
4893
24
.718
7
-0.0
184
3.88
67
-0
.163
16
0.32
57
48.8
661
12.4
265
***
Det
ache
d -1
1.60
43
12.0
722
0.
4295
2.
9604
0.04
826
0.12
693
16
.547
6 5.
6193
**
* O
wne
r 4.
5566
10
.520
3
-0.5
8 2.
1523
0.10
071
0.09
218
3.
2619
5.
0456
Con
text
ual V
aria
bles
Nor
th-C
entr
um
ref.
re
f.
re
f.
ref.
Sout
h-Is
land
s -5
4.41
86
31.4
491
* -6
.738
8 7.
5011
-0.7
089
0.32
231
**
-20.
1397
14
.181
5
Gre
en sp
ace
-5.1
74
3.23
22
* -0
.739
1 1.
5045
0.08
345
0.08
912
0.
8602
2.
9742
Rene
wab
le E
nerg
y
0.05
53
0.26
15
-0
.074
1 0.
0392
**
-0
.001
23
0.00
17
0.08
8 0.
1637
Hea
ting
Deg
ree
Day
s -0
.031
0.
026
0.
0086
0.
006
-0
.000
17
0.00
027
-0
.014
1 0.
0197
Retro
fit
-3.4
608
6.53
59
-6
.258
6 1.
6224
**
* -0
.002
39
0.08
776
3.
2258
4.
526
Fu
el p
rice
(per
TO
E)
-3.9
483
4.64
67
-0
.422
2 0.
4
0.37
354
0.26
832
0.
0453
0.
1367
Sele
ct (O
il)
158.
1724
12
3.11
8
-19.
5824
6.
4989
**
* -1
.218
05
1.40
576
-2
9.18
73
74.4
546
Se
lect
(Gas
) 3.
2758
52
.625
1
-28.
1043
14
.906
5 *
-1.1
3811
0.
5189
1**
-6
0.01
76
32.0
626
**
Sele
ct (G
as C
ylin
der)
37
.533
6 66
.45
-3
4.69
05
26.7
905
-0
.969
39
0.57
16*
31.4
058
10.4
673
***
Sele
ct (C
oal-
woo
d)
-38.
7299
20
.580
4 *
-5.8
037
28.2
279
-1
.110
01
1.09
823
-1
5.64
05
32.5
808
Se
lect
(Ele
ctric
ity)
76.4
981
121.
9741
-27.
2059
45
.136
6
-0.3
4977
0.
2496
6
-28.
4475
66
.308
4
Cons
tant
39
8.70
97
189.
5287
**
82
.625
7 32
.831
2 **
-8
.820
01
6.71
305
-7
3.76
16
45.5
071
*
NO
TES:
* Sig
nific
ant a
t the
10%
leve
l. **
Sign
ifica
nt at
the 5
% le
vel **
* Sig
nific
ant a
t the
1%
leve
l
1036
There are two measures for which the Italiangovernment has set targets: energy consumption andenergy efficiency. Improving energy efficiencycontributes to the ultimate goal of reducing energyconsumption1.Among the wide range of programmesaimed at influencing energy efficiency, tax incentivesfor energy efficiency improvements to existingbuildings have been established in Italy since 2007.The program provides tax credits to households andcompanies for single retrofit measures, such as thermalinsulation, installation of solar panels, and replacementof old heating and air-conditioning systems, or forcomprehensive retrofit work. The tax credit covers 55%of the energy-related cost, but cannot exceed amaximum value that depends on the type of measuretaken. Tax credits are reimbursed over 10 years, startingafter the completion of work.
The program proved to be an effective tool forimproving energy efficiency since it boosted a largenumber of retrofit investments in the residential sectorbetween 2007 and 2009 thus reducing energyconsumption and CO2 emissions. In particular, in 2007there were 106,000 interventions/operations with anestimate of primary energy savings of 880 GWh/y andCO2 emissions avoided by 193,000 t/y. The number ofinterventions more than doubled in 2008 (over 240,000interventions) leading to an estimated quantity of CO2emissions not emitted of about 418,000 t/y. In 2009 thenumber of interventions was confirmed at about237,000 with an estimated saving of about 320,000 t/yin terms of C02 emissions avoided (ENEA, 2010).However, it is worth noting that over 60% of theseinterventions of energy-efficiency requalification wereconcentrated in four regions (Lombardy, Piedmont,Veneto and Emilia-Romagna).
Considering the effectiveness of these measuresin reducing energy consumption, our aim in this studywas to examine if an increase in the share of energyefficiency improvements in existing homes may lead toswitching to less polluting fuels. Therefore, weconstructed a scenario characterized by an increasednumber of retrofits compared to the population in allItalian regions and characterized by a reduced
heterogeneity among the regions. In particular, weassumed the greatest increase in the share of energyefficiency improvements in Calabria, Sicily, Campaniaand Apulia (for these regions we doubled thepercentage of people who have taken advantage of taxincentives for thermal retrofits) which were the regionswith the lowest observed values in 2009 (Enea, 2010).For Molise, Abruzzo, Lazio, Basilicata and Sardinia weassumed a growth rate equal to 75%; for Liguria,Lombardy, Tuscany, Marche and Umbria we assumeda growth rate equal to 50%; for Friuli Venezia Giulia,Trentino Alto Adige, Piedmont-Aosta Valley, Venetoand Emilia Romagna we assumed a growth rate equalto 25%. In this way the average number of retrofitsbecame equal to 0.61 thus obtaining a coefficient ofvariation equal to 0.45.
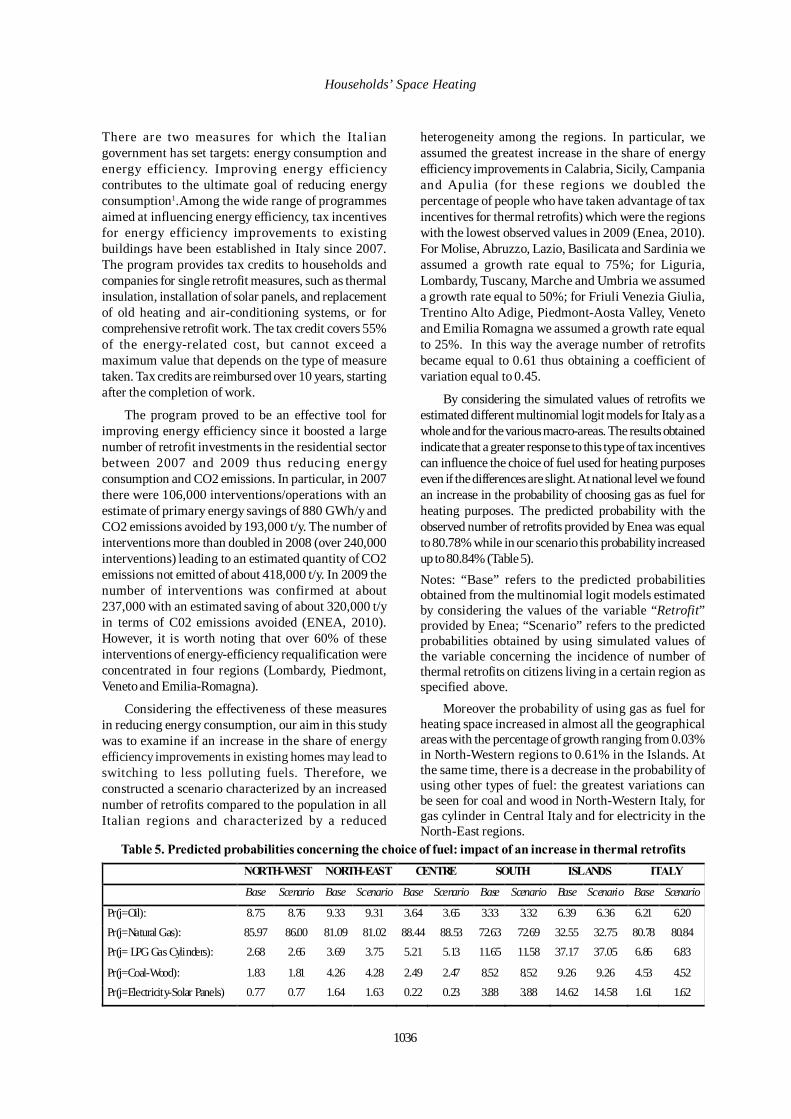
By considering the simulated values of retrofits weestimated different multinomial logit models for Italy as awhole and for the various macro-areas. The results obtainedindicate that a greater response to this type of tax incentivescan influence the choice of fuel used for heating purposeseven if the differences are slight. At national level we foundan increase in the probability of choosing gas as fuel forheating purposes. The predicted probability with theobserved number of retrofits provided by Enea was equalto 80.78% while in our scenario this probability increasedup to 80.84% (Table 5).
Table 5. Predicted probabilities concerning the choice of fuel: impact of an increase in thermal retrofits NORTH-WEST NORTH-EAST CENTRE SOUTH ISLANDS ITALY
Base Scenario Base Scenario Base Scenario Base Scenario Base Scenario Base Scenario
Pr(j=Oil): 8.75 8.76 9.33 9.31 3.64 3.65 3.33 3.32 6.39 6.36 6.21 6.20 Pr(j=Natural Gas): 85.97 86.00 81.09 81.02 88.44 88.53 72.63 72.69 32.55 32.75 80.78 80.84 Pr(j= LPG Gas Cylinders): 2.68 2.66 3.69 3.75 5.21 5.13 11.65 11.58 37.17 37.05 6.86 6.83
Pr(j=Coal-Wood): 1.83 1.81 4.26 4.28 2.49 2.47 8.52 8.52 9.26 9.26 4.53 4.52 Pr(j=Electricity-Solar Panels) 0.77 0.77 1.64 1.63 0.22 0.23 3.88 3.88 14.62 14.58 1.61 1.62
Notes: “Base” refers to the predicted probabilitiesobtained from the multinomial logit models estimatedby considering the values of the variable “Retrofit”provided by Enea; “Scenario” refers to the predictedprobabilities obtained by using simulated values ofthe variable concerning the incidence of number ofthermal retrofits on citizens living in a certain region asspecified above.
Moreover the probability of using gas as fuel forheating space increased in almost all the geographicalareas with the percentage of growth ranging from 0.03%in North-Western regions to 0.61% in the Islands. Atthe same time, there is a decrease in the probability ofusing other types of fuel: the greatest variations canbe seen for coal and wood in North-Western Italy, forgas cylinder in Central Italy and for electricity in theNorth-East regions.
Households’ Space Heating

CONCLUSIONThis study investigated the determinants of fuel
choice and fuel consumption in Italy by carrying outan analysis at household level taking into account thatthe behaviour of households concerning space heatingis not only influenced by the socio-economiccharacteristics of the families but also by externalfactors which are not controlled by the household anddepend on the national and local energy supply.
This paper fills an important research gap inanalysingwhether there are geographic differences inthe determinants of fuel choice bearing in mind theheterogeneity of households and behavioural aspectsamong the Italian regions.Many of the variablesconcerning the socio-economic characteristics ofhouseholds and the characteristics of the dwellingsproved to be important determinants of the choice ofspace heating technologies and of energyconsumption.Regarding the choice of a space heatingsystem, the level of income positively affects theprobability of choosing gas while it negatively affectsthe probability of choosing coal and wood. Concerningthe type of family living in a house, a single householderis less likely to use a gas-based heating system, whilehe/she is more likely to use LPG gas cylinders, oil,electricity and solar panels. Households living in newlybuilt homes are more likely to opt for gas whilehouseholds living in older buildings are more likely tochoose coal and wood.
Significant differences in the determinants of fuelchoice are found among the Italian regions thusproving the influence of the socio-economic context.By analyzing energy consumption, we found thatheating expenditures for gas and oil increase withhousehold size, age of householder and the number offamily members. Moreover, families living in isolatedareas and in detached homes have higher heatingexpenditures.
These results can help us to improve ourunderstanding of household energy behavior andcontribute to the careful design of policies aimed atcurbing residential energy consumption or loweringits carbon intensity by paying special attention to theheterogeneity of households at regional level. For thispurpose focusing on elderly people is in line withreducing overall heating expenses and supportingfamilies with children could be a means of improvingthe residential energy performance.
Moreover, our results also indicate that propertiesbuilt before 2009 are more expensive to heat than morerecently built homes. By increasing the energyefficiency of these properties, i.e. through taxincentives, would therefore also contribute to loweringcarbon emissions.The availability of data referringspecifically to energy used for heating purposes andespecially solar panels, or information on the
management of heating of private homes as well asinformation on thermal retrofits at household levelwould be required in order to carry out further researchwhich would enable us to study other important aspectsconcerning households’ behaviour towards energyconservation.
ACKNOWLEDGEMENTSWe would like to thank Luigi Biggeri, as well as
two anonymous referees, for usefulsuggestions on ourstudy. Comments on a previous version of thestudy,presented at the IV International Congress onTourism and Environment Cáceres, Spain 28th-30th
September 2011, were also helpful.
REFERENCESAbrahamse, W. and Steg, L. (2011). Factors Related toHousehold Energy Use and Intention to Reduce It: TheRole of Psychological and Socio-Demographic Variables,Human Ecology Review, 18 (1), 30-40.
Alipour, S., Karbassi, A. R., Abbaspour, M., Saffarzadeh,M., and Moharamnejad, N. (2011). Energy andEnvironmental Issues in Transport Sector. Int. J. Environ.Res., 5 (1), 213-224.
Baker, P., Blundell, R. and Micklewright, J. (1989).Modelling household energy expenditures using micro data,Economic Journal, 99, 720-738.
Barrera, V. A., Miranda, J., Espinosa, A. A., Meinguer, J.,Martínez, J. N., Cerón, E.,Morales, J. R., Miranda, P. A. andDias, J. F. (2012). Contribution of Soil, Sulfate, and BiomassBurning Sources to the Elemental Composition of PM10 fromMexico City. Int. J. Environ. Res., 6 (3), 597-612.
Berkhout, P. H. G., Ferrer-I-Carbonell, A. and Muskens, J.C. (2004). The ex post impact of an energy tax on householdenergy demand. Energy Economics, 26, 297–317.
Bernardini, O. and Di Marzio, T. (2001), La distribuzionedi gas a mezzo di reti urbane in Italia. Analisi del settore allavigilia della liberalizzazione, Autorità per l’Energia Elettricae il Gas.
Bourguignon, F., Fournier, M., and Gurgand, M. (2007).Selection bias corrections based on the multinomial logitmodel: Monte Carlo comparisons. Journal of EconomicSurveys, 21 (1), 174–205.
Braun, F. G. (2010), Determinants of households’ spaceheating type: A discrete choice analysis for Germanhouseholds. Energy Policy, 38, 5493–5503.
Castellano, R., Laureti, T. and Regoli, A. (2011). Estimatingthe effects of road transportation on environmental quality.Environmental Engineering and Management Journal, 9 (9),1151-1160.
Carraro, F. and Braun, F. (2011), Household energyconsumption in Europe:empirical results from German andItalian household data, paper presented at the 18th annualconference of the European Association of Environmentaland Resource Economists, 29th June – 2nd July 2011, Rome.
Int. J. Environ. Res., 6(4):1025-1038, Autumn 2012
1037

Chianese, E., Riccio, A., Duro, I., Trifuoggi, M., Iovino, P.,Capasso, S. and Barone, G. (2012). Measurements for indoorair quality assessment at the Capodimonte Museum inNaples (Italy). Int. J. Environ. Res., 6 (2), 509-518.
Cordente-Rodríguez, M., Mondéjar-J iménez, J . A.,Meseguer-Santamaría, M. L., Mondéjar-Jiménez, J. andVargas-Vargas, M. (2010). Environmental Behavior andSelective Waste Management in Spanish Housing,Environmental Engineering and Management Journal, 9 (9),1165-1171.
Couture, S., Garcia, S. and Reynaud, A. (2009), CoutureHousehold Energy Choices and Fuelwood Consumption:An Econometric Approach to the French Data, TouloseSchool of Economics, working paper series 09-044.
Cui, H . Z ., Sham, F. C., Lo, T. Y. and Lum, H. T. (2011).Appraisal of Alternative Building Materials for Reductionof CO2 Emissions by Case Modeling. Int. J. Environ. Res.,5 (1), 93-100.
Davis, L. W. and Kilian, L. (2008). The allocative cost ofprice ceilings in the U.S. residential market for natural gas.National Bureau of Economic Research, NBER WorkingPaper 14040.
ENEA, (2010). Le detrazioni fiscali del 55% per lariqualificazione energetica del patrimonio edilizio esistentenel 2009, Rapporto Enea anno 2009.
ENEA, (2011). Piano d’Azione Italiano per l’EfficienzaEnergetica.
EEA, (2011). European Environment Agency, Energyefficiency and energy consumption in the household sector,Assessment published.
Eurostat, (2010). Environmental statistics and accounts inEurope, Eurostat Statistical Book, Luxemburg.
Eurostat, (2010). Energy, transport and environmentindicators, Eurostat Pocketbook.
Greene, W. H. (2000). Econometric Analysis, EnglewoodCliffs: Prentice Hall 4th edition.
Heslop, L. A, Moran, L. and Cousineau, A. (1981).Consciousness’ in energy conservation behavior: anexploratory study. Journal of Consumer Research, 8 (3),299-305.
ISTAT, (2012). Banca Dati di Indicatori Territoriali per lePolitiche di Sviluppo (available at www.istat.it).
Leth-Petersen, S. and Togeby, M. (2001). Demand for spaceheating in apartment blocks. Measuring effects of policymeasures aiming at reducing energy consumption. EnergyEconomics, 23 (4), 387–403.
Liao, H.-C. and Chang, T. F. (2002). Space-heating and water-heating energy demands of the aged in the US. EnergyEconomics, 24 (3), 267–284.
McFadden, D. (1973). Conditional Logit Analysis ofQualitative Choice Behavior in P. Zarembka (ed.), Frontiersin Econometrics, New York: Academic Press.
Meier, H. and Rehdanz, K. (2010). Determinants ofresidential space heating expenditures in Great Britain.Energy Economics, 32(5), 949–959.
Metcalf, G. and Hassett K. A. (1999). Measuring the EnergySavings from Home Improvement Investments: Evidencefrom Monthly Billing Data, The Review ofEconomics andStatistics, 81 (3), 516-528.
Moll, H. C., Noorman, K. J., Kok, R., Engström, R., Throne-Holst, H. and Clark, C. (2005). Pursuing more sustainableconsumption by analyzing household metabolism inEuropean countries and cities. Journal of Industrial Ecology,9, 259-275.
Mondéjar-Jiménez, J., Vargas, M., Mondéjar Jiménez, J. A.(2010).Measuring Environmental Evolution Using SyntheticIndicators. Environmental Engineering and ManagementJournal, 9 (9), 1145-1149.
Montero Lorenzo, J. M. , Garcia-Centeno, M. C. andFernandez-Aviles, G. (2011). A Threshold AutoregressiveAsymmetric Stochastic Volatility Strategy to Alert ofViolations of the Air Quality Standards. Int. J. Environ.Res., 5 (1), 23-32.
Nesbakken, R. (2001). Energy Consumption for SpaceHeating: A Discrete-Continuous Approach. The ScandinavianJournal of Economics, 103 (1), 165-184.
Pirani, E. and Secondi, L. (2011). Eco-Friendly Attitudes:What European Citizens Say and What They Do, InternationalJournal of Environmental Research, 5 (1), 67-84.
Quesada-Rubio, J.M., Villar-Rubio, E., Mondéjar-Jiménez,J. and Molina-Moreno, V. (2011). Carbon Dioxide Emissionsvs. Allocation Rights: Spanish Case Analysis. Int. J. Environ.Res., 5 (2), 469-474.
Rehdanz, K. (2007). Determinants of residential spaceheating expenditures in Germany, Energy Economics, 29,167–182.
Sardianou, E. (2008). Estimating space heating determinants:an analysis of Greek households, Energy and Buildings, 40,1084-1093.
Schuler, A., Weber, C. and Fahl, U. (2000).Energyconsumption for space heating of West-German households:empirical evidence, scenario projections and policyimplications. Energy Policy, 28 (12), 877–894.
Vaage, K. (2000). Heating technology and energy use: adiscrete/continuous choice approach to Norwegian householdenergy demand. Energy Economics, 22, 649–666.
Vargas-Vargas, M., Mondéjar-Jiménez, J ., Montero-Lorenzo, J. M. and Fernández-Avilés, G. (2011). Per CapitaCO2 Emission Trends among European OECD countries,Environmental Engineering and Management Journal, 10(12), 1865-1871.
Vringer, K. and Blok, K. (1995). The direct and indirectenergy requirements of households in the Netherlands.Energy Policy, 23, 893-910.
Wang, P., Zhao, D., Wang, W., Mu, H., Cai, G. and Liao, C.(2011). Thermal Effect on Pollutant Dispersion in an UrbanStreet Canyon. Int. J. Environ. Res., 5 (3), 813-820.
Zeinolabedin, Y., Yahyapoor M. S. and Shirzad, Z . (2011).The Geopolitics of Energy in the Caspian Basin. Int. J.Environ. Res., 5 (2), 501-508.
Laureti, T. and Secondi, L.
1038