determinand of capital structure and influence on value of … · · 2017-05-10determinand of...
TRANSCRIPT

International Journal of Education and Research Vol. 4 No. 6 June 2016
123
Determinand of capital structure and influence on Value of the firm to the industry sector consumption goods
Wastam Wahyu Hidayat Student Program Doktor, Economic and Business, Pancasila University, Jakarta, Indonesia
Abstract
This study aims to determine the factors that influence the value of the firm. The research data is data panel that there were 26 cross section (category of consumption industry company) with the same time series / balanced (annually starting in 2009-2013) that is 5 periods (years). This study was measured by analysis method is regression of Fixed effect model and weighing cross section weight. The results of the research are ; (1) Determinants of capital structure which consists of : sales growth, profitability, liquidity, firm age, influence the value of the firm, measurable : assets structure, business risk and ability variable to time interest earned that does not influence the value of the firm, (2) Capital structure influence the value of the firm, (3) Determinants of capital structure that consists of: sales growth, asset structure, profitability, liquidity, business risk, time interest earned, firm age and its assets structure have influence the value of firm together. Keyword - Value of the firm, Determinants of capital structure, Capital structure. 1.Introduction An increasingly global business creates harsh intercompany competition. Companies are required to have a competitive advantage in technology, product results, competent human resources, networking, the capital adequacy, global market share and related to the currency exchange rate. Therefore, the company is trying to increase the value of the company by hoping to increase sustainability. Value of the firm can be increased, if the chief finance office is able to take decisions related to company’s operations, that is funding decision, where a good funding decision of a company can be seen from assets structure, that is finance decision in relation to debt composition, both short-term debt and long-term debt, preferred and common stock that will be used. Based on the philosophy of pecking order theory, sequence of funding which is recommended or desired by company, the first is retained earnings, the second is debt funding and the third is issuance of new equity (Darminto, Manurung, 2010). 2.Literature Review Capital Structure According to Manurung (2011), capital structure theory originated from research Donaldson (1952) which disseminates information corporate financing. The study does not convey the theory of capital structure of the company, but it has delivered a variety of information about the capital structure of companies such as determinants of optimal capital structure and capital structure. Miller and Modigliani (1958) put forward the theory that the company's capital structure has no influence on the value of the firm is often called irrelevant theory of capital structure. As a result, the discussion of financial theory based solely on the three issues are irrelevant theory proposed by Miller and Modligiani (1958); determinants of optimal capital structure and capital structure.

ISSN: 2411-5681 www.ijern.com
124
Sales Growth According to research Um (2001) in Murhadi (2011), stating that the company is growing under pressure to finance investment opportunities that exceed retained earnings are there, so appropriate "pecking order" so companies prefer to use debt rather than equity. Activa Structure The higher the activa structure, the higher the capital structure, means the greater the assets that can be used as collateral payable by the company. Conversely, the lower the asset structure of an enterprise, the lower the ability of the companies to be able to guarantee mortgage loans by the company. (Liwang, 2011). Profitability Profitability describes the higher profits, that means the lower external financing needs (debt), so the lower the capital structure, (Liwang 2011). According to Sinthayani (2015), the company would prefer internal financing than external funding when the company needs funds for investment purposes, the more profitable a company, the higher the company's ability to fund their investment needs from internal sources such as etained earnings. Liquidity According to Ilyas and Triyono (2009), stated, liquidity is the company's ability to pay obligations that must be met, obligations that must be met is short-term debt. Liquidity is the ratio between current asset to current liabilities of the company, the higher the liquidity of the company, the better the company's ability to fulfill its short term obligations, good liquidity ratio makes a guarantee for investors to invest in these companies thereby affecting the company's capital structure. Companies must optimize the use of liquid assets in the company by investing in profitable, so as to enhance shareholder value. Business Risk According to Gitman (2009) in Seftianne and Handayani (2011), business risk is the risk of the company when the company is not able to cover its operating costs and is influenced by the stability of income and expenses. Companies with high business risks tend to avoid using debt financing compared with companies with lower business risk. World of investment identifies business risks as part of the risk premium, which is defined as the uncertainty of the revenue stream due to the nature of the business itself such as product, customer and how to produce their products. Companies with highly fluctuating cash flow will be aware of the use of risky debt will be less profitable than equities, so companies are forced to use the equity to fulfill its financing in order to avoid financial distress, so that the business risk has an influence on the capital structure. Time Interest Earned Research Baral (2004), in Friska, (2011), time interest earned indicates the company's ability to pay interest on the loan to the creditor by using operating income. Ability is affecting the confidence of creditors against the company. According to Baral, (2004) in Friska (2011), stated, the higher the company's ability to pay interest on the loan, the higher the capacity of the company's debts. Firm age Research Bhaduri (2002) in Farah and Aditya, (2010), described age firm is one of the factors affecting capital structure, small companies which are relatively young age will use a smaller debt compared to equity as capital structure. According to Ramlall (2009) in Farah and Aditya, (2010), the company which is older age will use a smaller debt, because large companies are relatively old age can manage your cash flow better than younger companies.

International Journal of Education and Research Vol. 4 No. 6 June 2016
125
3. Methodology 3.1 Sample and data The population in this study is 26 companies of consumption goods industry sector listed in Indonesia Stock Exchange. samples are taken with random sampling method with the type of sampling Judgement. The data use are secondary data from the company’s annual financial statemen for 2009-2013. The independent variabel is sales growth (GRS), asset structure (SAK),profitability(PRO),liquidity(LIQ), business risk (RIB) time interest earned (TIE). firm age (AFI, Capital structure (SAK) whili the dependent variable Value of the firm (NIP). 3.2 Methode of Analysis This study was measured by analysis method is regression of Fixed effect model and weighing cross section weight.The best models obtained from Chow and Hausman test after an election models, are : Common effect, fixed effect and random effect are the Fixed Effects Modes, l thus Regression analysis is the Best Fixed effect model with cross section weighing weight. Model Regression. To determine the variables that significantly affect regional economic growth panel data regression analysis was used with functions that can be written as follows: LNNIPi.t = -1,6242 - 0,0036GRSi,t – 0,0082SAK i,t
*+ 0,0628PRO i,t – 0,0976LNLIQ i,t - 0,0005RIBi,t
*+ 0,00001TIE i,t *+ 0,9398LNAFI i,t + 0,0001STM i,t + ɛ i,t *Variable LIQ, AFI and NIP transformed into natural logarithm into LNLIQ, LNAFI and LNNIP, so that the range value is not much different from the value of the other variables and interpretation model into growth in units per cent. Explanation : constanta = ߙܫܮ ,௧= Value of the firm of the consumption goods i in year t ܩ ,௧= Growth of Sale or sales growth of the consumption goods i in year t ,௧= Asset structure in the consumption goods i in year tܭܣ ,௧=Profitability in the consumption goods i in year t ,௧= Liquidity growth in the consumption goods i in year tܫܮܮ ,௧= Business risks in the consumption i in year tܤܫ ,௧= Time Interest Earned of the consumption goods i in year tܧܫ ,௧=Age firm of consumption goods i in year tܫܨܣܮܯ ,௧= Capital Structure of firm i in year t 4.Findings and Discussion
Tabel.1 Regression Results Variable Coefficient Std.Error t-Statistik Prob.
C -1.624186 0.770359 -2.108350 0.0376 GRS? -0.003559 0.001467 -2.426206 0.0171 SAK? -0.008235 0.005809 -1.417589 0.1595 PRO? 0.062786 0.018787 3.342001 0.0012
LNLIQ? -0.097645 0.046846 -2.084399 0.0398 RIB? -0.000455 0.000294 -1.545287 0.1256 TIE? 8.55E-06 6.76E-06 1.264516 0.2091
STM? 9.88E-05 5.78E-05 1.707999 0.0909 LNAFI? 0.939799 0.242921 3.868737 0.0002

ISSN: 2411-5681 www.ijern.com
126
Tabel.2 Regression Results Weighted Statistics
R-squared 0.962561 Mean dependent var 1.091841 Adjusted R-squared 0.949691 S.D. dependent var 1.677971 S.E. of regression 0.431345 Sum squared resid 17.86163 F-statistic 74.79300 Durbin-Watson stat 2.040266 Prob(F-statistic) 0.000000
The result that presented regression in Tabel.1 and Tabel.2 4.1.The influence of sales growth to value of the firm. Based on table-1, we are able to know the probability is smaller than the value Alpa 10%, is 0.0171 so that Ho is refused and Ha is received, means sales growth partially influence (positive and significant) to value of the firm. 4.2.The influence of asset structure to value of the firm. Based on table-1, we are able to know the probability is greater than the value of Alpa 10%, which is 0.1595, so Ho is accepted and Ha is rejected, means the asset structure partially no influence on value of the firm. The results showed the high level of the value of the assets of the company will increase, due to the increase in assets occurred because the purchase will require no-small amount so that the company requires additional capital, the presence of these needs can be responded positively by investors and lenders to be able to provide the funds needed by the company if funds are optimized in its use will affect the company's value of the firm and vice versa. 4.3.The Influencce of profitability to value of the firm Based on table-1, it can be seen probability value smaller than the value Alpa 10%, which is 0.0012, so Ho is rejected and Ha is accepted, means profitability is partially positive and significant influence on value of the firm. 4.4.The Influence of liquidity to value of the firm Based on table-1, it can be seen probability value smaller than the value Alpa 10%, is 0.03398, so that Ho is refused and Ha is accepted, means profitability is partially positive and significant influence on value of the firm. 4.5.The Influence of business risk to value of the firm. Based on table-1, we are able to know the probability is greater than the value of Alpa 10%, which is 0.1256, so Ho is accepted and Ha is rejected, means the business risk (risk businees) partially no influence on value of the firm. 4.6.The influence of time interest earned to value of the firm Based on table-1, we are able to know the probability is greater than the value of Alpa 10%, which is 0.2091, so Ho is accepted and Ha is rejected, it means the ability to time interest earned partially no influence on value of the firm. 4.7.The influence of firm age to value of the firm Based on table-1, it can be seen probability value smaller than the value Alpa 10%, which is 0.0002, so Ho is rejected and Ha is accepted, meaning that the influence of firm age partially influence the value of the firm.

International Journal of Education and Research Vol. 4 No. 6 June 2016
127
4.8.The influence of capital structure to the Value of the firm Based on table-1, it can be seen probability value smaller than the value Alpa 10%, which is 0.0909, so Ho is rejected and Ha is accepted, means capital structure partially affects the value of the firm, This is because the use of optimizing the company's capital structure will affect the company's value of the firm and vice versa. 4.9.The influence of the determinants of capital structure, capital structure to the value of the firm. Based on table-2, the results of simultaneous test (Test-F) of 0.0000 is smaller than the probability Aplha 10%, so it statistically significantly affects the company's value (value of the firm). Fixed Effect model estimation results with Weight cross section shows that the coefficient of determination (R2) Adjusted R2 is very high at 0.949691. Determinants of capital structure consisting of: variable growth of sales, variable activa assets structure, profitability, liquidity), business risk, time interest earned, firm age) capital structure have a positive relationship together is 94.97%, of the firm. while the remaining is 5.03% explained by other variables outside the model or residual. 5. Conclusion After the study, the researchers can conclude the following: 5.1. Determinants of capital structure consisting of: variable sales growth,profitability, variable liquidity, age firm, influence the value of the firm, and : the variable of asset structure, business risk and a variable interest earned time had no influence on firm value of the firm. The high-level asset structure does not influence the value of the firm, when the use of funds is not optimal, due to the increase in assets occurred because the purchase will require no-small amount so that the company requires additional capital, the presence of these needs can be responded positively by investors and lenders to be able to provide the funds needed by the company if the funds are not optimized in its use, so that it will not influence the company's value of the firm and vice versa. Business risk does not influence the value of the firm, because the company's business risk is not one of financial factors to consider when going to invest in the stock exchange. The ability to time interest earned does not influence the value of the firm, the size of the company paying the interest of the loan does not change the value of the capital. If the company has been able to pay the interest obligations, then the organization will be trusted by the community and will enhance shareholder value of the firm and vice versa. 5.2. Determinants of capital structure consisting of: variable sales growth,profitability, variable liquidity, age firm, influence the value of the firm, and : the variable of asset structure, business risk and a variable interest earned time had no influence on firm value of the firm. The high-level asset structure does not influence the value of the firm, when the use of funds is not optimal, due to the increase in assets occurred because the purchase will require no-small amount so that the company requires additional capital, the presence of these needs can be responded positively by investors and lenders to be able to provide the funds needed by the company if the funds are not optimized in its use, so that it will not influence the company's value of the firm and vice versa. Business risk does not influence the value of the firm, because the company's business risk is not one of financial factors to consider when going to invest in the stock exchange. The ability to time interest earned does not influence the value of the firm, the size of the company paying the interest of the loan does not change the value of the capital. If the company has been able to pay the interest obligations, then the organization will be trusted by the community and will enhance shareholder value of the firm and vice versa. 5.3. Capital structure influence on value of the firm, because the high or low capital structure depends on confidence by investors and the public in terms of optimizing the use of debt to boost the stock price and value of the firm.

ISSN: 2411-5681 www.ijern.com
128
5.4. Determinants of capital structure consisting of: variable growth of sales, asset structure, profitability, liquidity, business risk , time interest earned, age of the firm and capital structure have an influence together on value of the firm. 6.Recomemmendation 6.1. In a funding decision is that the capital structure must consider the impact on the value of the firm, it is important for companies to know whether the optimal source of funds comes from internal or external. 6.2. Determinants of capital structure consisting of: variable sales growth,profitability, liquidity, firm age, influence to value of the firm, therefore the company should considering the operational cost efficiency and optimization of the use of funds so that the benefit can be expected of shareholders, so the stock price avalue of the firm will rise. 6.3. Determinants of Capital Structure comprising: a variable activa structure, business risk and time interest earned had no influence on value of the firm, hence the need for operational performance and good financial management to maintain the company's performance in order to increase profits and value of the firm. 6.4. Determinants of capital structure and capital structure, providing a positive and significant influence on value of the firm, so companies must optimize it with or near-equal and comprehensive, the determinant of capital structure and capital structure as well as possible. 7.Limitation This research limitation, further studies are expected to use a large sample size and more variables that can influence the capital structure and its implications for the value of the firm, so as to show the reaction of capital markets thoroughly. This study is only the consumption goods industry sector, with these limitations, realize that there is not a perfect study, so we need to carry next research with such feedback that can provide better results from this study. 8.References Antonious, A.,Guney,Y.& Paudyal,K.2002,” Determinants of corporate capital structure : Evidence from European Countries,” Working PaperUniversity of Durham. Bevan, A and Danbolt, J,2000, “ Dinamic in the determinants of capital structure in the UK,” Working paper on the University Glasgow. Booth, L, Aivazian, V., Demerguc-Kunt,A. and Maksimovic, V. 2001, “ Capital structure in developing countrie,” Journal of Finance, 56(1). Chung, K.H,1993, “ Asset characteristics and corporate debt policy.” Journal of Businees Financial and Accounting .20(1). Darmanto dan Manurung, Adler H, 2010,” Pengujian teori trade-off dan pecking order” Jurnal Nikko Scurities Indonesia, Jakarta. Farah, Margareta dan Adtya, Ramdhan, 2010, “Faktor-faktor yang mempengaruhi struktur
modal pada perusahaan manufaktur “ Jurnal Bisnis dan Akuntansi Vol.12.No.2, Universitas Trisakti, Jakarta.
Friska, Firnanti, 2011,” Faktor- faktor yang mempengaruhi struktur modal perusahaan manufaktur di Bursa Efek Indonesia,” Jurnal Bisnis dan Akuntansi Sekolah Tinggi Ilmu

International Journal of Education and Research Vol. 4 No. 6 June 2016
129
Ekonomi Trisakti , Jakarta. Gaud, Philippe, Hoesli, Martin and Andre Bender,2005,” Debt equity choice in Europe,” The FAME Research paper series Ilyas, dan Triyono, 2009, Faktor-faktor yang mempengaruhi struktur modal perusahaan
manufakturung yang terdaftar di BEI 2005-2009, Jurnal Unimus Semarang. Liwang, Paramitha, 2011,”Analisa faktor- faktor yang mempengaruhi struktur modal serta pengaruhnya terhadap harga saham pada perusahaan yang tergabung dalam LQ 45 periode tahun 2006-2009’.” Jurnal, Seminar Nasional Teknologi Informatika danKomunikasi FE.Universitas Kristen Maranatha, Bandung. Manurung, Adler H, 2011“ Determinan struktur kapital perusahaan di Indonesia” Jurnal Akuntansi Fakultas Ekonomi Universitas Tarumanegara Vol.XV, No.3 tahun 2011, Jakarta. Mengginson,WL,1997, “ Corprate finance theory.” USA, Addision – Wesley. Murhadi, Ria, 2011,” Determinan struktur modal : Studi di asia tenggara” Jurnal manajemen
dan kewirausahan, vol.13. No.2 tahun 2011, Fakultas Bisnis dan Ekonomika, Universitas Surabaya.
Myers,S.C, and Majulif. N, 1997.” Corporate financing and investment decesion when firm have
information that investors do not have,” Journal of Financial Economics. 13. Perry,L.G and Rumbey,J.N,1991 “ The inmpect of ownership structure on corporte debt Policy.”
Time series cross sectional Analysis the financial review.33. Ramlall, Indranarain,2009,” Determinants of capital structure among Non- Quoted
Mauritian firm under specificity of leverage : Looking for a modified peking order theory ,” International Research Journal of Finance and Economics, Vol.31.
Rajan, RG and L.Zingales,1995,” What do we know about capital structure ? Some evidence From
International data,” Journal of Financial Manajement.Vol.50. Seftianne dan Handayani, 2011 “ Faktor-faktor yang mempengaruhi struktur modal pada
perusahaan publik sektor manufaktur” Jurnal Busnis dan Akuntansi Vo.13 .No.1 Universitas Al-Azhar Jakarta.
Sinthayani, Dian,2015,” Determinan Strukturmodal ( Studi komparatif pada Manufature
Multinational Corporation dan Domestik Corporation), E-Jurnal Manajemen Unud, Vol. 4, No. 10.
Shaw, John.C,2003, “ Corporate governance and risk : A system approach,” John Wiley & Sons,
1nc, New Jersey. Titman,S. & Wessels,R.1998,” The determinants of capital structure choice”, Journal of Finance,
43(1). Um,T.2001,” Determination of capital structure and prediction of bankruptcy in
Korea,”Unpublished PhD Thesis.ithaca: Cornell University.

ISSN: 2411-5681 www.ijern.com
130
UJI STASIONERITAS DATA
Variabel GRS
Pool unit root test: Summary Series: GRS_ADES, GRS_AISA, GRS_DLTA, GRS_INDF, GRS_MLBI, GRS_MYOR, GRS_SKLT, GRS_ULTJ, GRS_GGRM, GRS_HMSP, GRS_RMBA, GRS_DVLA, GRS_INAF, GRS_KAEF, GRS_KLBF, GRS_MERCK, GRS_PYFA, GRS_SCPI, GRS_TSPC, GRS_MBTO, GRS_MRAT, GRS_TCID, GRS_UNVR, GRS_ROTI, GRS_KDSI, GRS_KICI Date: 04/27/16 Time: 13:06 Sample: 2009 2013 Exogenous variables: Individual effects Automatic selection of maximum lags Automatic selection of lags based on SIC: 0 Newey-West bandwidth selection using Bartlett kernel Balanced observations for each test Cross- Method Statistic Prob.** sections Obs Null: Unit root (assumes common unit root process) Levin, Lin & Chu t* -41.3002 0.0000 26 104
Null: Unit root (assumes individual unit root process) Im, Pesaran and Shin W-stat -7.39487 0.0000 26 104 ADF - Fisher Chi-square 90.8683 0.0007 26 104 PP - Fisher Chi-square 102.450 0.0000 26 104 ** Probabilities for Fisher tests are computed using an asymptotic Chi -square distribution. All other tests assume asymptotic normality.
Variabel SAK
Pool unit root test: Summary Series: SAK_ADES, SAK_AISA, SAK_DLTA, SAK_INDF, SAK_MLBI, SAK_MYOR, SAK_SKLT, SAK_ULTJ, SAK_GGRM, SAK_HMSP, SAK_RMBA, SAK_DVLA, SAK_INAF, SAK_KAEF, SAK_KLBF, SAK_MERCK, SAK_PYFA, SAK_SCPI, SAK_TSPC, SAK_MBTO, SAK_MRAT, SAK_TCID, SAK_UNVR, SAK_ROTI, SAK_KDSI, SAK_KICI Date: 04/27/16 Time: 13:07 Sample: 2009 2013 Exogenous variables: None Automatic selection of maximum lags Automatic selection of lags based on SIC: 0 Newey-West bandwidth selection using Bartlett kernel Balanced observations for each test Cross- Method Statistic Prob.** sections Obs Null: Unit root (assumes common unit root process) Levin, Lin & Chu t* -6.19430 0.0000 26 104

International Journal of Education and Research Vol. 4 No. 6 June 2016
131
Null: Unit root (assumes individual unit root process) ADF - Fisher Chi-square 70.4010 0.0455 26 104 PP - Fisher Chi-square 83.4296 0.0037 26 104 ** Probabilities for Fisher tests are computed using an asymptotic Chi -square distribution. All other tests assume asymptotic normality.
Variabel PRO?
Pool unit root test: Summary Series: PRO_ADES, PRO_AISA, PRO_DLTA, PRO_INDF, PRO_MLBI, PRO_MYOR, PRO_SKLT, PRO_ULTJ, PRO_GGRM, PRO_HMSP, PRO_RMBA, PRO_DVLA, PRO_INAF, PRO_KAEF, PRO_KLBF, PRO_MERCK, PRO_PYFA, PRO_SCPI, PRO_TSPC, PRO_MBTO, PRO_MRAT, PRO_TCID, PRO_UNVR, PRO_ROTI, PRO_KDSI, PRO_KICI Date: 04/27/16 Time: 13:09 Sample: 2009 2013 Exogenous variables: Individual effects, individual linear trends Automatic selection of maximum lags Automatic selection of lags based on SIC: 0 Newey-West bandwidth selection using Bartlett kernel Balanced observations for each test Cross- Method Statistic Prob.** sections Obs Null: Unit root (assumes common unit root process) Levin, Lin & Chu t* -28.7685 0.0000 26 104 Breitung t-stat 2.71550 0.9967 26 78
Null: Unit root (assumes individual unit root process) Im, Pesaran and Shin W-stat -1.56359 0.0590 26 104 ADF - Fisher Chi-square 57.9070 0.2665 26 104 PP - Fisher Chi-square 96.6344 0.0002 26 104 ** Probabilities for Fisher tests are computed using an asymptotic Chi -square distribution. All other tests assume asymptotic normality.
Variabel LNLIQ?
Pool unit root test: Summary Series: LNLIQ_ADES, LNLIQ_AISA, LNLIQ_DLTA, LNLIQ_INDF, LNLIQ_MLBI, LNLIQ_MYOR, LNLIQ_SKLT, LNLIQ_ULTJ, LNLIQ_GGRM, LNLIQ_HMSP, LNLIQ_RMBA, LNLIQ_DVLA, LNLIQ_INAF, LNLIQ_KAEF, LNLIQ_KLBF, LNLIQ_MERCK, LNLIQ_PYFA, LNLIQ_SCPI, LNLIQ_TSPC, LNLIQ_MBTO, LNLIQ_MRAT, LNLIQ_TCID, LNLIQ_UNVR, LNLIQ_ROTI, LNLIQ_KDSI, LNLIQ_KICI Date: 04/26/16 Time: 14:47 Sample: 2009 2013 Exogenous variables: Individual effects Automatic selection of maximum lags Automatic selection of lags based on SIC: 0

ISSN: 2411-5681 www.ijern.com
132
Newey-West bandwidth selection using Bartlett kernel Balanced observations for each test Cross- Method Statistic Prob.** sections Obs Null: Unit root (assumes common unit root process) Levin, Lin & Chu t* -10.6504 0.0000 26 104
Null: Unit root (assumes individual unit root process) Im, Pesaran and Shin W-stat -3.11690 0.0009 26 104 ADF - Fisher Chi-square 74.1530 0.0235 26 104 PP - Fisher Chi-square 83.9022 0.0033 26 104 ** Probabilities for Fisher tests are computed using an asymptotic Chi -square distribution. All other tests assume asymptotic normality.
Variabel RIB?
Pool unit root test: Summary Series: RIB_ADES, RIB_AISA, RIB_DLTA, RIB_INDF, RIB_MLBI, RIB_MYOR, RIB_SKLT, RIB_ULTJ, RIB_GGRM, RIB_HMSP, RIB_RMBA, RIB_DVLA, RIB_INAF, RIB_KAEF, RIB_KLBF, RIB_MERCK, RIB_PYFA, RIB_SCPI, RIB_TSPC, RIB_MBTO, RIB_MRAT, RIB_TCID, RIB_UNVR, RIB_ROTI, RIB_KDSI, RIB_KICI Date: 04/27/16 Time: 13:13 Sample: 2009 2013 Exogenous variables: None Automatic selection of maximum lags Automatic selection of lags based on SIC: 0 Newey-West bandwidth selection using Bartlett kernel Balanced observations for each test Cross- Method Statistic Prob.** sections Obs Null: Unit root (assumes common unit root process) Levin, Lin & Chu t* -4.71787 0.0000 26 104
Null: Unit root (assumes individual unit root process) ADF - Fisher Chi-square 92.7267 0.0004 26 104 PP - Fisher Chi-square 95.2690 0.0002 26 104 ** Probabilities for Fisher tests are computed using an asymptotic Chi -square distribution. All other tests assume asymptotic normality.
International Journal of Education and Research Vol. 4 No. 6 June 2016
133
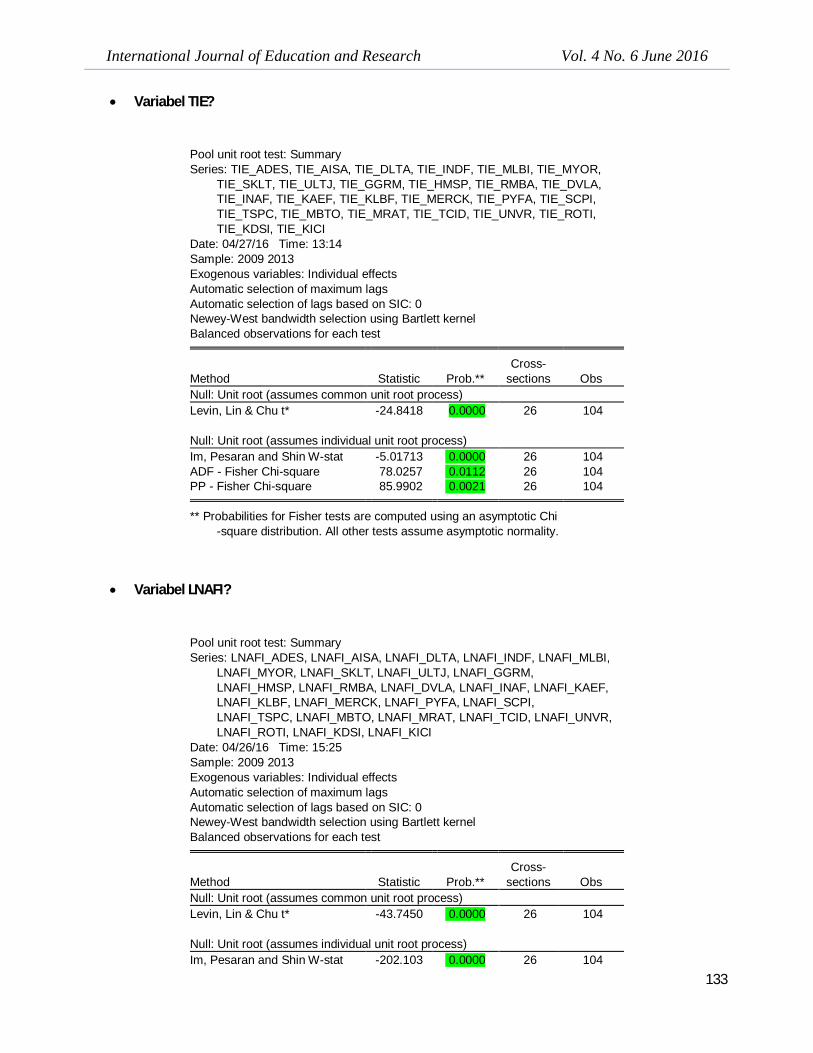
Variabel TIE?
Pool unit root test: Summary Series: TIE_ADES, TIE_AISA, TIE_DLTA, TIE_INDF, TIE_MLBI, TIE_MYOR, TIE_SKLT, TIE_ULTJ, TIE_GGRM, TIE_HMSP, TIE_RMBA, TIE_DVLA, TIE_INAF, TIE_KAEF, TIE_KLBF, TIE_MERCK, TIE_PYFA, TIE_SCPI, TIE_TSPC, TIE_MBTO, TIE_MRAT, TIE_TCID, TIE_UNVR, TIE_ROTI, TIE_KDSI, TIE_KICI Date: 04/27/16 Time: 13:14 Sample: 2009 2013 Exogenous variables: Individual effects Automatic selection of maximum lags Automatic selection of lags based on SIC: 0 Newey-West bandwidth selection using Bartlett kernel Balanced observations for each test Cross- Method Statistic Prob.** sections Obs Null: Unit root (assumes common unit root process) Levin, Lin & Chu t* -24.8418 0.0000 26 104
Null: Unit root (assumes individual unit root process) Im, Pesaran and Shin W-stat -5.01713 0.0000 26 104 ADF - Fisher Chi-square 78.0257 0.0112 26 104 PP - Fisher Chi-square 85.9902 0.0021 26 104 ** Probabilities for Fisher tests are computed using an asymptotic Chi -square distribution. All other tests assume asymptotic normality.
Variabel LNAFI?
Pool unit root test: Summary Series: LNAFI_ADES, LNAFI_AISA, LNAFI_DLTA, LNAFI_INDF, LNAFI_MLBI, LNAFI_MYOR, LNAFI_SKLT, LNAFI_ULTJ, LNAFI_GGRM, LNAFI_HMSP, LNAFI_RMBA, LNAFI_DVLA, LNAFI_INAF, LNAFI_KAEF, LNAFI_KLBF, LNAFI_MERCK, LNAFI_PYFA, LNAFI_SCPI, LNAFI_TSPC, LNAFI_MBTO, LNAFI_MRAT, LNAFI_TCID, LNAFI_UNVR, LNAFI_ROTI, LNAFI_KDSI, LNAFI_KICI Date: 04/26/16 Time: 15:25 Sample: 2009 2013 Exogenous variables: Individual effects Automatic selection of maximum lags Automatic selection of lags based on SIC: 0 Newey-West bandwidth selection using Bartlett kernel Balanced observations for each test Cross- Method Statistic Prob.** sections Obs Null: Unit root (assumes common unit root process) Levin, Lin & Chu t* -43.7450 0.0000 26 104
Null: Unit root (assumes individual unit root process) Im, Pesaran and Shin W-stat -202.103 0.0000 26 104

ISSN: 2411-5681 www.ijern.com
134
ADF - Fisher Chi-square 489.319 0.0000 26 104 PP - Fisher Chi-square 484.353 0.0000 26 104 ** Probabilities for Fisher tests are computed using an asymptotic Chi -square distribution. All other tests assume asymptotic normality.
Variabel STM?
Pool unit root test: Summary Series: STM_ADES, STM_AISA, STM_DLTA, STM_INDF, STM_MLBI, STM_MYOR, STM_SKLT, STM_ULTJ, STM_GGRM, STM_HMSP, STM_RMBA, STM_DVLA, STM_INAF, STM_KAEF, STM_KLBF, STM_MERCK, STM_PYFA, STM_SCPI, STM_TSPC, STM_MBTO, STM_MRAT, STM_TCID, STM_UNVR, STM_ROTI, STM_KDSI, STM_KICI Date: 04/27/16 Time: 13:15 Sample: 2009 2013 Exogenous variables: Individual effects, individual linear trends Automatic selection of maximum lags Automatic selection of lags based on SIC: 0 Newey-West bandwidth selection using Bartlett kernel Balanced observations for each test Cross- Method Statistic Prob.** sections Obs Null: Unit root (assumes common unit root process) Levin, Lin & Chu t* -16.7802 0.0000 26 104 Breitung t-stat 5.52777 1.0000 26 78
Null: Unit root (assumes individual unit root process) Im, Pesaran and Shin W-stat -9.46120 0.0000 26 104 ADF - Fisher Chi-square 70.3045 0.0462 26 104 PP - Fisher Chi-square 100.376 0.0001 26 104 ** Probabilities for Fisher tests are computed using an asymptotic Chi -square distribution. All other tests assume asymptotic normality.
Variabel LNNIP?
Pool unit root test: Summary Series: LNNIP_ADES, LNNIP_AISA, LNNIP_DLTA, LNNIP_INDF, LNNIP_MLBI, LNNIP_MYOR, LNNIP_SKLT, LNNIP_ULTJ, LNNIP_GGRM, LNNIP_HMSP, LNNIP_RMBA, LNNIP_DVLA, LNNIP_INAF, LNNIP_KAEF, LNNIP_KLBF, LNNIP_MERCK, LNNIP_PYFA, LNNIP_SCPI, LNNIP_TSPC, LNNIP_MBTO, LNNIP_MRAT, LNNIP_TCID, LNNIP_UNVR, LNNIP_ROTI, LNNIP_KDSI, LNNIP_KICI Date: 04/27/16 Time: 13:15 Sample: 2009 2013 Exogenous variables: Individual effects Automatic selection of maximum lags Automatic selection of lags based on SIC: 0

International Journal of Education and Research Vol. 4 No. 6 June 2016
135
Newey-West bandwidth selection using Bartlett kernel Balanced observations for each test Cross- Method Statistic Prob.** sections Obs Null: Unit root (assumes common unit root process) Levin, Lin & Chu t* -14.9575 0.0000 26 104
Null: Unit root (assumes individual unit root process) Im, Pesaran and Shin W-stat -4.15184 0.0000 26 104 ADF - Fisher Chi-square 82.2353 0.0048 26 104 PP - Fisher Chi-square 106.357 0.0000 26 104 ** Probabilities for Fisher tests are computed using an asymptotic Chi -square distribution. All other tests assume asymptotic normality.

ISSN: 2411-5681 www.ijern.com
136
LNNIP? GRS? SAK? PRO? LNLIQ? RIB? TIE? LNAFI? STM?
POOL
Dependent Variable: LNNIP? Method: Pooled Least Squares Date: 04/27/16 Time: 13:17 Sample: 2009 2013 Included observations: 5 Cross-sections included: 26 Total pool (balanced) observations: 130
Variable Coefficient Std. Error t-Statistic Prob. GRS? -0.001845 0.003324 -0.555009 0.5799
SAK? 0.005272 0.004389 1.201154 0.2320 PRO? 0.166993 0.019951 8.370357 0.0000
LNLIQ? -0.242247 0.085201 -2.843247 0.0052 RIB? -0.000561 0.000616 -0.910959 0.3641 TIE? 1.15E-05 1.06E-05 1.086290 0.2795 STM? 0.000596 0.000101 5.898620 0.0000
LNAFI? -0.008478 0.083202 -0.101902 0.9190 R-squared 0.642167 Mean dependent var 0.977675
Adjusted R-squared 0.621636 S.D. dependent var 1.200647 S.E. of regression 0.738534 Akaike info criterion 2.291265 Sum squared resid 66.54281 Schwarz criterion 2.467729 Log likelihood -140.9322 Hannan-Quinn criter. 2.362968 Durbin-Watson stat 0.837011
REGRESS FIXED
Dependent Variable: LNNIP? Method: Pooled Least Squares Date: 04/27/16 Time: 13:18 Sample: 2009 2013 Included observations: 5 Cross-sections included: 26 Total pool (balanced) observations: 130
Variable Coefficient Std. Error t-Statistic Prob. C -1.785564 1.234662 -1.446196 0.1514
GRS? -0.003778 0.002501 -1.510695 0.1342 SAK? -0.004638 0.008876 -0.522580 0.6025 PRO? 0.064220 0.026934 2.384377 0.0191
LNLIQ? -0.111575 0.074000 -1.507767 0.1349 RIB? -0.000496 0.000401 -1.236075 0.2194 TIE? 1.30E-05 9.20E-06 1.417772 0.1595 STM? 0.000137 8.97E-05 1.528067 0.1298
LNAFI? 0.941086 0.414590 2.269917 0.0254 Fixed Effects (Cross)
_ADES--C 1.789242 _AISA--C -0.115292
International Journal of Education and Research Vol. 4 No. 6 June 2016
137
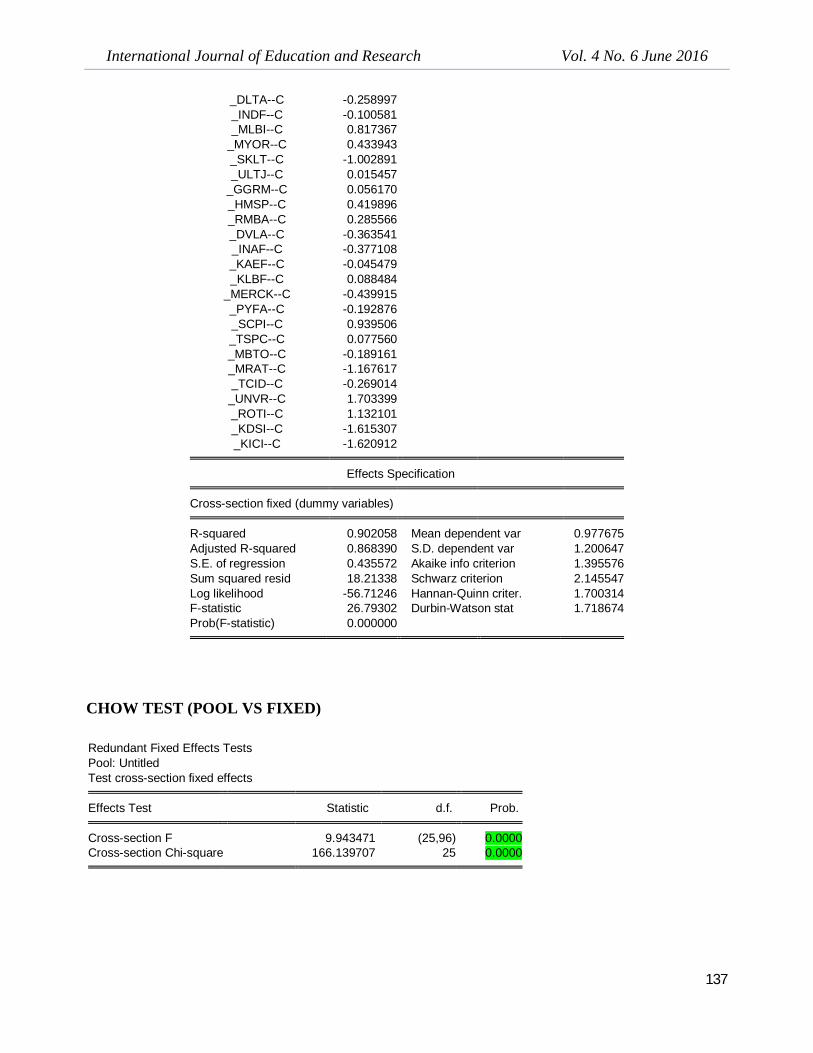
_DLTA--C -0.258997 _INDF--C -0.100581 _MLBI--C 0.817367
_MYOR--C 0.433943 _SKLT--C -1.002891 _ULTJ--C 0.015457
_GGRM--C 0.056170 _HMSP--C 0.419896 _RMBA--C 0.285566 _DVLA--C -0.363541 _INAF--C -0.377108 _KAEF--C -0.045479 _KLBF--C 0.088484
_MERCK--C -0.439915 _PYFA--C -0.192876 _SCPI--C 0.939506 _TSPC--C 0.077560 _MBTO--C -0.189161 _MRAT--C -1.167617 _TCID--C -0.269014 _UNVR--C 1.703399 _ROTI--C 1.132101 _KDSI--C -1.615307 _KICI--C -1.620912
Effects Specification Cross-section fixed (dummy variables) R-squared 0.902058 Mean dependent var 0.977675
Adjusted R-squared 0.868390 S.D. dependent var 1.200647 S.E. of regression 0.435572 Akaike info criterion 1.395576 Sum squared resid 18.21338 Schwarz criterion 2.145547 Log likelihood -56.71246 Hannan-Quinn criter. 1.700314 F-statistic 26.79302 Durbin-Watson stat 1.718674 Prob(F-statistic) 0.000000
CHOW TEST (POOL VS FIXED) Redundant Fixed Effects Tests Pool: Untitled Test cross-section fixed effects
Effects Test Statistic d.f. Prob. Cross-section F 9.943471 (25,96) 0.0000
Cross-section Chi-square 166.139707 25 0.0000

ISSN: 2411-5681 www.ijern.com
138
HIPOTESIS CHOW
Regress Random
Dependent Variable: LNNIP? Method: Pooled EGLS (Cross-section random effects) Date: 04/27/16 Time: 13:20 Sample: 2009 2013 Included observations: 5 Cross-sections included: 26 Total pool (balanced) observations: 130 Swamy and Arora estimator of component variances
Variable Coefficient Std. Error t-Statistic Prob. C -1.574420 0.830438 -1.895890 0.0604
GRS? -0.004158 0.002312 -1.798711 0.0746 SAK? 0.004823 0.006043 0.798241 0.4263 PRO? 0.108364 0.020792 5.211801 0.0000
LNLIQ? -0.130054 0.067568 -1.924799 0.0566 RIB? -0.000644 0.000390 -1.652222 0.1011 TIE? 1.38E-05 8.56E-06 1.607426 0.1106 STM? 0.000233 8.27E-05 2.817302 0.0057
LNAFI? 0.657827 0.273432 2.405811 0.0177 Random Effects (Cross)
_ADES--C 1.183340 _AISA--C -0.204653 _DLTA--C -0.087643 _INDF--C -0.177140 _MLBI--C 0.291093
_MYOR--C 0.468132 _SKLT--C -0.804568 _ULTJ--C 0.021011
_GGRM--C 0.208571 _HMSP--C 0.212262 _RMBA--C 0.551622 _DVLA--C -0.258154 _INAF--C -0.176955 _KAEF--C -0.038588 _KLBF--C 0.140353
_MERCK--C -0.346242 _PYFA--C -0.282159 _SCPI--C 1.003795 _TSPC--C 0.155332 _MBTO--C 0.011793 _MRAT--C -0.784877 _TCID--C -0.237709 _UNVR--C 0.970925 _ROTI--C 0.696631 _KDSI--C -1.319752 _KICI--C -1.196421
Effects Specification S.D. Rho Cross-section random 0.531125 0.5979

International Journal of Education and Research Vol. 4 No. 6 June 2016
139
Idiosyncratic random 0.435572 0.4021 Weighted Statistics R-squared 0.363923 Mean dependent var 0.336642
Adjusted R-squared 0.321868 S.D. dependent var 0.569701 S.E. of regression 0.469141 Sum squared resid 26.63134 F-statistic 8.653558 Durbin-Watson stat 1.318358 Prob(F-statistic) 0.000000
Unweighted Statistics R-squared 0.568529 Mean dependent var 0.977675
Sum squared resid 80.23663 Durbin-Watson stat 0.437576
HAUSMAN TEST (Fixed VS Random)
Correlated Random Effects - Hausman Test Pool: Untitled Test cross-section random effects
Test Summary Chi-Sq. Statistic Chi-Sq. d.f. Prob.
Cross-section random 27.369748 8 0.0006
REGRESI DENGAN MODEL TERBAIK FIXED EFFECT
Dependent Variable: LNNIP? Method: Pooled Least Squares Date: 04/27/16 Time: 13:21 Sample: 2009 2013 Included observations: 5 Cross-sections included: 26 Total pool (balanced) observations: 130
Variable Coefficient Std. Error t-Statistic Prob. C -1.785564 1.234662 -1.446196 0.1514
GRS? -0.003778 0.002501 -1.510695 0.1342 SAK? -0.004638 0.008876 -0.522580 0.6025 PRO? 0.064220 0.026934 2.384377 0.0191
LNLIQ? -0.111575 0.074000 -1.507767 0.1349 RIB? -0.000496 0.000401 -1.236075 0.2194 TIE? 1.30E-05 9.20E-06 1.417772 0.1595 STM? 0.000137 8.97E-05 1.528067 0.1298
LNAFI? 0.941086 0.414590 2.269917 0.0254 Fixed Effects (Cross)
_ADES--C 1.789242

ISSN: 2411-5681 www.ijern.com
140
_AISA--C -0.115292 _DLTA--C -0.258997 _INDF--C -0.100581 _MLBI--C 0.817367
_MYOR--C 0.433943 _SKLT--C -1.002891 _ULTJ--C 0.015457
_GGRM--C 0.056170 _HMSP--C 0.419896 _RMBA--C 0.285566 _DVLA--C -0.363541 _INAF--C -0.377108 _KAEF--C -0.045479 _KLBF--C 0.088484
_MERCK--C -0.439915 _PYFA--C -0.192876 _SCPI--C 0.939506 _TSPC--C 0.077560 _MBTO--C -0.189161 _MRAT--C -1.167617 _TCID--C -0.269014 _UNVR--C 1.703399 _ROTI--C 1.132101 _KDSI--C -1.615307 _KICI--C -1.620912
Effects Specification Cross-section fixed (dummy variables) R-squared 0.902058 Mean dependent var 0.977675
Adjusted R-squared 0.868390 S.D. dependent var 1.200647 S.E. of regression 0.435572 Akaike info criterion 1.395576 Sum squared resid 18.21338 Schwarz criterion 2.145547 Log likelihood -56.71246 Hannan-Quinn criter. 1.700314 F-statistic 26.79302 Durbin-Watson stat 1.718674 Prob(F-statistic) 0.000000
REGRESI DENGAN MODEL TERBAIK FIXED EFFECT DENGAN PENIMBANG
CROSS SECTION WEIGHT
Dependent Variable: LNNIP? Method: Pooled EGLS (Cross-section weights) Date: 04/27/16 Time: 13:22 Sample: 2009 2013 Included observations: 5 Cross-sections included: 26 Total pool (balanced) observations: 130 Linear estimation after one-step weighting matrix
Variable Coefficient Std. Error t-Statistic Prob.

International Journal of Education and Research Vol. 4 No. 6 June 2016
141
C -1.624186 0.770359 -2.108350 0.0376 GRS? -0.003559 0.001467 -2.426206 0.0171 SAK? -0.008235 0.005809 -1.417589 0.1595 PRO? 0.062786 0.018787 3.342001 0.0012
LNLIQ? -0.097645 0.046846 -2.084399 0.0398 RIB? -0.000455 0.000294 -1.545287 0.1256 TIE? 8.55E-06 6.76E-06 1.264516 0.2091 STM? 9.88E-05 5.78E-05 1.707999 0.0909
LNAFI? 0.939799 0.242921 3.868737 0.0002 Fixed Effects (Cross)
_ADES--C 1.837205 _AISA--C -0.066724 _DLTA--C -0.359149 _INDF--C -0.046203 _MLBI--C 0.922370
_MYOR--C 0.410405 _SKLT--C -0.978121 _ULTJ--C 0.043989
_GGRM--C -0.003330 _HMSP--C 0.448066 _RMBA--C 0.258133 _DVLA--C -0.405495 _INAF--C -0.434738 _KAEF--C -0.096973 _KLBF--C 0.050655
_MERCK--C -0.387981 _PYFA--C -0.170585 _SCPI--C 0.966682 _TSPC--C 0.043527 _MBTO--C -0.278084 _MRAT--C -1.251549 _TCID--C -0.285020 _UNVR--C 1.857448 _ROTI--C 1.239701 _KDSI--C -1.638438 _KICI--C -1.675792
Effects Specification Cross-section fixed (dummy variables) Weighted Statistics R-squared 0.962561 Mean dependent var 1.091841
Adjusted R-squared 0.949691 S.D. dependent var 1.677971 S.E. of regression 0.431345 Sum squared resid 17.86163 F-statistic 74.79300 Durbin-Watson stat 2.040266 Prob(F-statistic) 0.000000
Unweighted Statistics R-squared 0.901234 Mean dependent var 0.977675
Sum squared resid 18.36650 Durbin-Watson stat 1.702140

ISSN: 2411-5681 www.ijern.com
142
1. Non Multikolinieritas
Correlations
GRS SAK PRO LNLIQ RIB TIE STM LNAFI
GRS Pearson Correlation 1 .258** .243** -.118 .078 .084 .054 .040
Sig. (2-tailed) .003 .005 .182 .377 .341 .541 .652
N 130 130 130 130 130 130 130 130
SAK Pearson Correlation .258** 1 -.008 -.441** .116 -.201* -.060 -.211*
Sig. (2-tailed) .003 .931 .000 .189 .022 .497 .016
N 130 130 130 130 130 130 130 130
PRO Pearson Correlation .243** -.008 1 -.106 .046 .671** -.210* .407**
Sig. (2-tailed) .005 .931 .230 .602 .000 .016 .000
N 130 130 130 130 130 130 130 130
LNLIQ Pearson Correlation -.118 -.441** -.106 1 -.145 .021 -.061 .076
Sig. (2-tailed) .182 .000 .230 .101 .814 .493 .390
N 130 130 130 130 130 130 130 130
RIB Pearson Correlation .078 .116 .046 -.145 1 -.161 .014 -.086
Sig. (2-tailed) .377 .189 .602 .101 .067 .879 .328
N 130 130 130 130 130 130 130 130
TIE Pearson Correlation .084 -.201* .671** .021 -.161 1 -.079 .372**
Sig. (2-tailed) .341 .022 .000 .814 .067 .374 .000
N 130 130 130 130 130 130 130 130
STM Pearson Correlation .054 -.060 -.210* -.061 .014 -.079 1 .092
Sig. (2-tailed) .541 .497 .016 .493 .879 .374 .297
N 130 130 130 130 130 130 130 130
LNAFI Pearson Correlation .040 -.211* .407** .076 -.086 .372** .092 1
Sig. (2-tailed) .652 .016 .000 .390 .328 .000 .297
N 130 130 130 130 130 130 130 130
**. Correlation is significant at the 0.01 level (2-tailed).
*. Correlation is significant at the 0.05 level (2-tailed).