deterioration rates of minnesota concrete bridge decks · we analyzed the data to determine how...
TRANSCRIPT
Deterioration Rates of Minnesota Concrete Bridge Decks
Sara L. Nelson, Primary Author Olson and Nesvold Engineers, P.S.C. 7825 Washington Ave S. Suite 100
Bloomington, MN 55439
October 2014
Research Project Final Report 2014-40

To request this document in an alternative format call 651-366-4718 or 1-800-657-3774 (Greater Minnesota) or email your request to [email protected]. Please request at least one week in advance.

Technical Report Documentation Page 1. Report No. 2. 3. Recipients Accession No. MN/RC 2014-40 4. Title and Subtitle 5. Report Date
Deterioration Rates of Minnesota Concrete Bridge Decks October 2014 6.
7. Author(s) 8. Performing Organization Report No. Sara L. Nelson, PE 9. Performing Organization Name and Address 10. Project/Task/Work Unit No. Olson & Nesvold Engineers 7825 Washington Avenue S. Suite 100 Bloomington, MN 55439
11. Contract (C) or Grant (G) No.
(c) 02782
12. Sponsoring Organization Name and Address 13. Type of Report and Period Covered Minnesota Department of Transportation Research Services & Library 395 John Ireland Boulevard, MS 330 St. Paul, Minnesota 55155-1899
Final Report 14. Sponsoring Agency Code
15. Supplementary Notes http://www.lrrb.org/pdf/201440.pdf 16. Abstract (Limit: 250 words) Bridge decks are deteriorating across the state of Minnesota and limited funds are available to rehabilitate or replace them. The Minnesota Department of Transportation (MnDOT) Bridge Office is estimating construction costs well into the future to secure appropriate funding and to facilitate project programming. The rate at which bridge decks deteriorate is an important element used to estimate construction costs.
MnDOT provided decades of inventory and inspection bridge data for this project. This included National Bridge Inventory (NBI) condition code data for 2601 bridges with concrete decks. Based on conversations with MnDOT, it was agreed that deck deterioration rates would be determined by the length of time bridge decks stay, or drop, at NBI condition codes.
We analyzed the data to determine how many years, on average, a bridge deck remains at the various NBI condition code states. We also analyzed the data to determine what factors affect the rate of bridge deck deterioration. We looked at type of deck reinforcement (black bars, epoxy coated top bars, and all epoxy coated bars), presence of concrete overlay, average daily traffic (ADT), presence of 3 inches of cover to the top mat of reinforcement, superstructure material, and location.
17. Document Analysis/Descriptors 18. Availability Statement Bridge decks, Deterioration, Cost estimating, Data collection, Data analysis
No restrictions. Document available from: National Technical Information Services, Alexandria, VA 22312
19. Security Class (this report) 20. Security Class (this page) 21. No. of Pages 22. Price Unclassified Unclassified 54
Deterioration Rates of Minnesota Concrete Bridge Decks
Final Report
Prepared by:
Sara L. Nelson, PE Olson and Nesvold Engineers, P.S.C. 7825 Washington Ave S. Suite 100
Bloomington, MN 55439
October 2014
Published by:
Minnesota Department of Transportation Research Services & Library
395 Ireland Boulevard, MS 330 St. Paul, MN 55155
This report represents the results of research conducted by the author and does not necessarily represent the views or policies of the Minnesota Department of Transportation or Olson and Nesvold Engineers, P.S.C. This report does not contain a standard of specified technique.
The Minnesota Department of Transportation and Olson and Nesvold Engineers, P.S.C. do not endorse products or manufacturers. Any trade or manufacturers’ names that may appear herein do so solely because they are considered essential to this report.

Acknowledgements
The author would like to thank the following people for their valuable assistance in providing data, input and ideas, and for reviewing the report. Their names are listed below in no particular order. Thank you for sharing your expertise and guidance.
1. Dustin Thomas, MnDOT Bridge Office 2. Dan Warzala, MnDOT Research Services 3. Thomas Martin, MnDOT 4. Duane Green, MnDOT Bridge Office 5. Paul Rowekamp, MnDOT Bridge Office 6. David Hedeen, MnDOT 7. Sarah Sondag, MnDOT 8. Steve Olson, ONE 9. Arlen Ottman, ONE
Table of Contents Chapter 1. Introduction ............................................................................................................... 1 Chapter 2. Findings of Other Studies ......................................................................................... 2 Chapter 3. Data Sources and Handling of Data .......................................................................... 3
3.1 Data Sources ..................................................................................................................... 3 3.2 Data Demographics .......................................................................................................... 3 3.3 Handling of Data .............................................................................................................. 6
Chapter 4. Analysis..................................................................................................................... 9 4.1 Number of Years at NBI Condition Codes ...................................................................... 9 4.2 Analysis of Bridges ........................................................................................................ 10 4.3 Analysis of Redecked Bridges ....................................................................................... 17 4.4 Analysis of Bridges Overlaid at Least Three Years after Original Construction ........... 20 4.5 Analysis of Bridges with Prestressed Concrete Girders or Continuous Steel Girders ... 20 4.6 Analysis of Bridges within the Metro District and Outside of the Metro District ......... 31
Chapter 5. Results ..................................................................................................................... 37 5.1 Findings .......................................................................................................................... 37 5.2 Deterioration Tables ....................................................................................................... 39
Chapter 6. Data Maintenance and Further Study ..................................................................... 42 6.1 Data Maintenance ........................................................................................................... 42 6.2 Further Study .................................................................................................................. 42
Appendix A – MnDOT Bridge Office Deck Policies and their Approximate Revision Dates
List of Figures
Figure 3.1: Superstructure Material for Concrete Deck Bridges .................................................... 4 Figure 3.2: Year the Concrete Deck Bridges Were Built ............................................................... 5 Figure 3.3: Type of Reinforcement in Concrete Deck Bridges ...................................................... 5 Figure 3.4: Type of Overlay on Concrete Deck Bridges ................................................................ 6 Figure 4.1: Deck Deterioration for Bridges Built During or After 1990 with a Concrete Overlay ....................................................................................................................................................... 13 Figure 4.2: Deck Deterioration for Bridges Built During or After 1990 without a Concrete Overlay.......................................................................................................................................... 14 Figure 4.3: Deck Deterioration for Bridges Built Between 1975 and 1989 with Epoxy Coated Top Bars and a Concrete Overlay ................................................................................................. 14 Figure 4.4: Deck Deterioration for Bridges Built Between 1975 and 1989 with Epoxy Coated Top Bars and without a Concrete Overlay.................................................................................... 15 Figure 4.5: Deck Deterioration for Bridges Built Between 1975 and 1989 without Epoxy Coated Bars, with and without a Concrete Overlay .................................................................................. 15 Figure 4.6: Deck Deterioration for Bridges Built Before 1975 without Epoxy Coated Bars and with a Concrete Overlay ............................................................................................................... 16 Figure 4.7: Deck Deterioration for Bridges Built Before 1975 without Epoxy Coated Bars and without a Concrete Overlay .......................................................................................................... 16 Figure 4.8: Deck Deterioration for Bridges Redecked During or After 1990 with or without a Concrete Overlay .......................................................................................................................... 19 Figure 4.9: Deck Deterioration for Bridges Redecked Before 1990 with Epoxy Coated Top Bars and with or without a Concrete Overlay ....................................................................................... 19 Figure 4.10: Deck Deterioration for Prestressed Concrete Girder Bridges Built During or After 1990 with a Concrete Overlay ...................................................................................................... 24 Figure 4.11: Deck Deterioration for Continuous Steel Girder Bridges Built During or After 1990 with a Concrete Overlay ............................................................................................................... 24 Figure 4.12: Deck Deterioration for Prestressed Concrete Girder Bridges Built During or After 1990 without a Concrete Overlay ................................................................................................. 25 Figure 4.13: Deck Deterioration for Prestressed Concrete Girder Bridges Built Between 1975 and 1989 with Epoxy Coated Top Bars and a Concrete Overlay ................................................. 26 Figure 4.14: Deck Deterioration for Continuous Steel Girder Bridges Built Between 1975 and 1989 with Epoxy Coated Top Bars and a Concrete Overlay ........................................................ 26 Figure 4.15: Deck Deterioration for Prestressed Concrete Girder Bridges Built Between 1975 and 1989 with Epoxy Coated Top Bars and without a Concrete Overlay .................................... 27 Figure 4.16: Deck Deterioration for Continuous Steel Girder Bridges Built Between 1975 and 1989 with Epoxy Coated Top Bars and without a Concrete Overlay........................................... 27 Figure 4.17: Deck Deterioration for Prestressed Concrete Girder Bridges Built Between 1975 and 1989 without Epoxy Coated Bars, with and without a Concrete Overlay ............................. 28 Figure 4.18: Deck Deterioration for Prestressed Concrete Girder Bridges Built Before 1975 without Epoxy Coated Bars and with a Concrete Overlay ........................................................... 29

Figure 4.19: Deck Deterioration for Continuous Steel Girder Bridges Built Before 1975 without Epoxy Coated Bars and with a Concrete Overlay ........................................................................ 29
Figure 4.21: Deck Deterioration for the Metro District Bridges Built During or After 1990 with a
Figure 4.22: Deck Deterioration for Bridges Outside of the Metro District Built During or After
Figure 4.20: Deck Deterioration for Prestressed Concrete Girder Bridges Built Before 1975 without Epoxy Coated Bars and without a Concrete Overlay ...................................................... 30
Concrete Overlay .......................................................................................................................... 35
1990 with and without a Concrete Overlay .................................................................................. 35 Figure 4.23: Deck Deterioration for the Metro District Bridges Built Between 1975 and 1989 with Epoxy Coated Top Bars and with a Concrete Overlay ......................................................... 36 Figure 4.24: Deck Deterioration for Bridges Outside of the Metro District Built Between 1975 and 1989 with Epoxy Coated Top Bars and with or without a Concrete Overlay........................ 36
List of Tables
Table 4.1: MnDOT’s Deck Protection Policy Changes by Year ................................................. 10
Table 4.8: Average Number of Years at Deck NBI Condition Code for Prestressed Concrete
Table 4.9: Average Number of Years at Deck NBI Condition Code for Continuous Steel Girder
Table 4.11: Average Number of Years at Deck NBI Condition Code for Bridges in the Metro
Table 5.1: Deck Deterioration Table for the Metro District Bridges Built During and After 1990; and Bridges Outside of the Metro District Built During and After 1990 with ADT Greater than
Table 5.2: Deck Deterioration Table for Bridges Outside of the Metro District Built During and
Table 5.3: Deck Deterioration Table for the Metro District Bridges Built Between 1975 and
Table 5.4: Deck Deterioration Table for Bridges Outside of the Metro District Built Between
Table 5.5: Deck Deterioration Table for All Bridges Built Between 1975 and 1989 without
Table 4.2: Number of Bridges in Each Category......................................................................... 11 Table 4.3: Average Number of Years at Deck NBI Condition Code .......................................... 12 Table 4.4: Number of Redecked Bridges in Each Category ........................................................ 18 Table 4.5: Average Number of Years at Deck NBI Condition Code for Redecked Bridges ....... 18 Table 4.6: Number of Prestressed Concrete Girder Bridges in Each Category ........................... 21 Table 4.7: Number of Continuous Steel Girder Bridges in Each Category................................. 22
Girder Bridges............................................................................................................................... 23
Bridges .......................................................................................................................................... 23 Table 4.10: Number of Bridges in Each Category in the Metro District and All Other Districts 32
District and All Other Districts ..................................................................................................... 33
10K................................................................................................................................................ 39
After 1990 with ADT Equal to or Less than 10K ......................................................................... 39
1989 with Epoxy Coated Top Bars ............................................................................................... 40
1975 and 1989 with Epoxy Coated Top Bars ............................................................................... 40
Epoxy Coated Bars ....................................................................................................................... 40 Table 5.6: Deck Deterioration Table for All Bridges Built Before 1975 .................................... 41

Executive Summary
Bridge decks are deteriorating across the state of Minnesota and limited funds are available to rehabilitate or replace them. The Minnesota Department of Transportation (MnDOT) Bridge Office is estimating construction costs well into the future to secure appropriate funding and to facilitate project programming. The rate at which bridge decks deteriorate is an important element used to estimate construction costs.
MnDOT provided decades of inventory and inspection bridge data for this project. This included National Bridge Inventory (NBI) condition code data for 2601 bridges with concrete decks. Based on conversations with MnDOT, it was agreed that deck deterioration rates would be determined by the length of time bridge decks stay, or drop, at NBI condition codes. A bridge deck typically starts out at a NBI condition code of 9 (excellent) and drops throughout its life. The final NBI condition code of 0 means the bridge deck has failed and must be replaced, rehabilitation is no longer possible. None of the bridges in the database are at a NBI condition code of 0 and few are at a condition code of 4 (poor) and below.
We analyzed the data to determine how many years, on average, a bridge deck remains at the various NBI condition code states. We also analyzed the data to determine what factors affect the rate of bridge deck deterioration. We looked at type of deck reinforcement (black bars, epoxy coated top bars, and all epoxy coated bars), presence of concrete overlay, average daily traffic (ADT), presence of 3 inches of cover to the top mat of reinforcement, superstructure material, and location. Some information wasn’t available directly and needed to be inferred. For instance, the type of deck reinforcement and amount of cover to the top mat of reinforcement were determined by comparing the year the bridge was built to when policy changes were implemented in the Bridge Office.
The analysis showed that type of deck reinforcement and location within the state are the biggest factors when it comes to average number of years at deck NBI condition codes. Bridges with epoxy coated bars perform better than bridges without epoxy coated bars. In addition, bridges located within the Metro District drop to a NBI condition code of 7 faster than other districts. This could be due to when bridge deck cracks started to be sealed and how often the cracks have been resealed since. Other districts started sealing deck cracks earlier than the Metro District, and perform it more frequently. This is likely because they have better access to the bridge decks since the bridges have lower ADT and narrower decks. In addition, bridges within the metro area could have more frequent application of de-icing chemicals. ADT and the presence of a concrete overlay also play a part in deck deterioration, but not large enough to warrant separate deterioration tables.
The deck deterioration tables should be maintained and updated on at least a four-year cycle. As additional data is integrated into the dataset, we would expect the number of years for the NBI condition codes at the end of each curve to increase, and we would also expect additional NBI condition codes to have sufficient data to warrant presentation in the tables.

Chapter 1. Introduction
Limited funding during recent years has increased the need to scrutinize capital costs associated with extensive bridge repairs. The MnDOT Bridge Office is being asked to estimate future project costs if only standard bridge maintenance activities are completed now. Initially, these questions caused MnDOT to estimate how many years they believe bridge decks can last according to their engineering judgment. Because these questions are being asked more frequently, MnDOT requested a study to analyze their inspection records and use that data to estimate how many years a bridge deck may last, and what type of factors influence the longevity of a bridge deck.
Two main items were discussed at the kick off meeting for this research project. First, what data would be used to track bridge deterioration rates and second, what factors do we believe affect bridge deterioration rates.
For the first item, the bridge deterioration rates could be tracked by their NBI condition ratings or by their structural element condition ratings provided by inspectors. The NBI condition ratings have been in place for decades. We have access to NBI data back to 1983. The structural element condition ratings are less subjective to the inspector, but have only been used in Minnesota since 2003. Currently, the structural element condition ratings are recorded for each bridge during their yearly or bi-annual inspection. These condition ratings are then converted into corresponding NBI condition codes which are also reported to the Federal Highway Administration (FHWA). Since we have a larger database of NBI condition codes, these codes were used to track bridge deterioration rates. NBI condition codes vary between a 9 and 0. A code of 9 would be in excellent condition, while a 0 would indicate that the bridge component failed.
Deck type and ADT are believed to be some of the key factors which affect deck deterioration rates. Deck types are broken out by reinforcement type, presence of overlay or no overlay, and amount of concrete cover to the top mat of reinforcement. As described later in the report, some of these factors needed to be determined based on the year the bridge was built. Maintenance practices and de-icing application also likely play a significant role in deck deterioration, but these are more difficult to track. These last two items were ignored for this analysis.
This report briefly discusses previous studies and reports completed by others on similar topics, and also discusses the current study completed for MnDOT. Chapter 2 provides information on previous studies: what was analyzed and their findings. Chapter 3 discusses what data we analyzed and how it was handled. Chapter 4 discusses the analysis in more detail. Chapter 5 discusses the results and provides deterioration tables to assist in estimating long-term bridge funding needs. Finally, chapter 6 discusses how to maintain the dataset. It also describes updating the charts and additional topics that could be studied in the future.
1

Chapter 2. Findings of Other Studies
Reinforced concrete bridge decks have been studied for decades. These studies often examine only one or two parameters associated with a deck and investigators are typically assessing performance within a relatively short time window. For example, the type of superstructure supporting the bridge may be investigated (E.g., steel beams versus prestressed concrete beams) or the type of reinforcement (black bars versus epoxy coated bars) have been examined in many studies.
Many studies have looked at deck cracking. The notion being that the primary cause of bridge deck deterioration is the ingress of water and salts into cracks that leads to corrosion of reinforcement which in turn leads to a reduced service life for the bridge deck. Consequently, many investigators have looked into bridge deck shrinkage cracking.
A handful of studies have looked at the long-term performance of sets of bridges (and their bridge decks) in service.
Xanathos reports that the rule of thumb for bridge deterioration using NBI condition codes is approximately 1/10 of one condition code per year. This rule of thumb is assumed to be the same for bridge decks, bridge superstructures, and bridge substructures. It is also assumed to be the same for a drop from a condition code 9 to condition code 8 as it is for a drop from a 5 to a 4. While satisfactory for a crude starting point it is understood from inspection data that different elements have different deterioration rates (bridge decks versus pier caps) and that condition codes drop faster at the start and end of an elements service life compared to the middle of its service life.
In 2006 Zimmerman et al. examined the performance of low slump concrete overlays in Minnesota on 492 bridges. This study focused on the performance of one specific overlay type placed on concrete bridge decks in Minnesota from 1974 to 1981. Using 20 years of bridge inspection data, this study found that shorter overlay service lives were found for: • Reinforced concrete superstructures compared to steel and prestressed concrete. • Longer spans compared to shorter spans, and • Higher ADT compared to Lower ADT traffic levels.
This study also found that deterioration rates for the decks (and overlays) were nonlinear and were best described by a series of piecewise linear curves.
2

Chapter 3. Data Sources and Handling of Data
3.1 Data Sources
MnDOT provided the Pontis database which included nine different tables in Microsoft Access containing data on 2621 state owned bridges with decks. The data for District 4 was inadvertently left out of this dataset. These tables include information used by MnDOT and FHWA to help maintain an inventory of their bridges. Types of data includes administrative information, superstructure and deck material, ADT, clearances, and inspection data back to 1990. Some of the data provided in the tables overlap from one table to the next and some data is only provided in one table. These tables provided all the bridges to be analyzed which could be tracked by their bridge number. These tables also provided all information which could be analyzed to determine which factors may affect deck deterioration.
In addition to the database received from MnDOT, we used NBI data obtained from the FHWA during a previous MnDOT deck deterioration study. These files supplemented the inspection data back to 1983 to provide a better basis for the deck deterioration curves.
3.2 Data Demographics
The first task performed on the data was to determine what type of bridges were included in the database: deck type, superstructure type, year built, type of reinforcement, and type of overlay.
Of these 2621 bridges, 2601 have concrete decks while the other 20 bridges have either a timber deck, precast panel deck or open grating. It was also found that the majority of the concrete deck bridges are prestressed concrete or continuous steel bridges. Figure 3.1 provides a breakdown of the superstructure material on the 2601 bridges. The majority of the prestressed concrete and continuous steel superstructures are girder bridges.
MnDOT’s construction practices have evolved over time as new practices are utilized (E.g., overlays, epoxy coated bars, and cover thickness). The impact of these changes on the performance of bridge decks is of interest. Consequently information important to this study includes the year the bridge was built, the type of deck reinforcement, and type of overlay, and other details. Figures 3.2 through 3.4 provide a breakdown of this information.
3

Num
ber o
f Brid
ges
1600
1400
1200
1000
800
600
400
200
0 Concrete Continuous Steel Continuous Prestressed Prestressed
Concrete Steel Concrete Concrete Continuous
Multiple Box
1393
820
147 150 87
4
Superstructure Material Beam
Figure 3.1: Superstructure Material for Concrete Deck Bridges
4

Num
ber o
f Brid
ges
1400
1200
1000
800
600
400
200
0
1226
739
636
1916-1974 1975-1989 1990+
Num
ber o
f Brid
ges
1600
1400
1200
1000
800
600
400
200
0 Black Bars Epoxy Coated Bars Galvanized Bars Cathodic Unknown
Protection
1516
1033
50 1 1
Figure 3.2: Year the Concrete Deck Bridges Were Built
Figure 3.3: Type of Reinforcement in Concrete Deck Bridges
5
Num
ber o
f Brid
ges
2500
2000
1500
1000
500
0
1945
587
5 28 3 32 1
Monolithic Integral Latex Low Slump Epoxy Bituminous Other Deck Concrete Concrete Concrete Overlay Overlay
Overlay Overlay
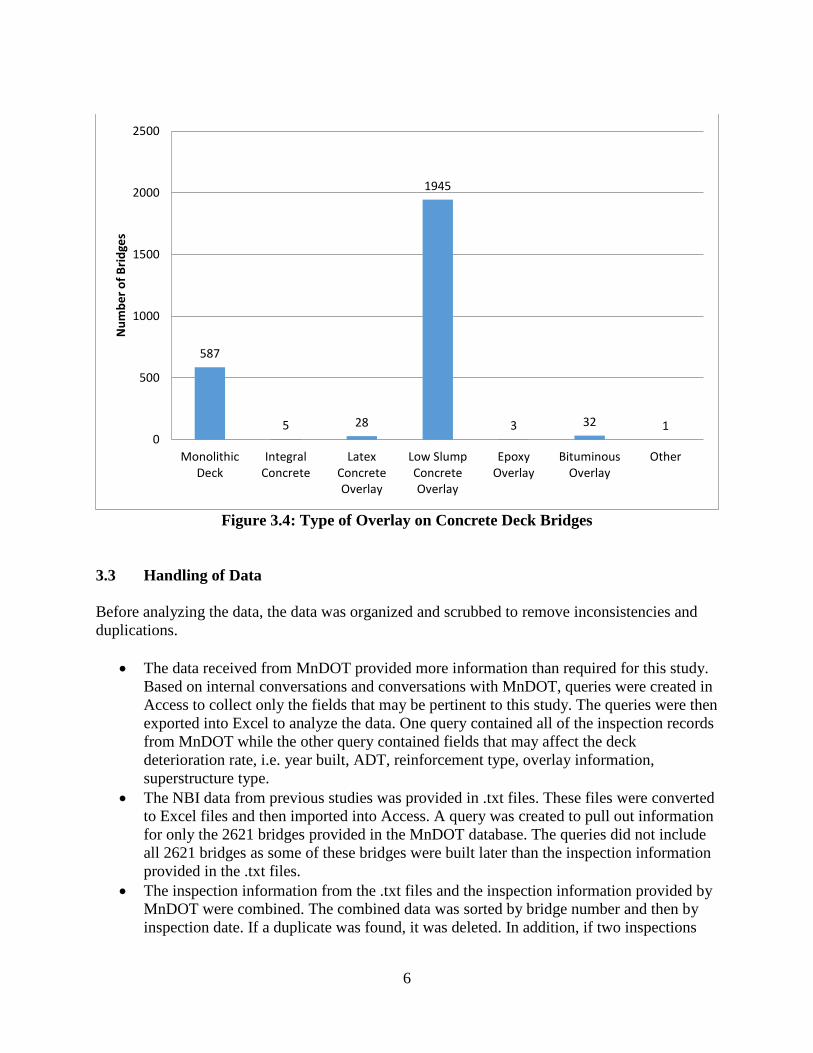
Figure 3.4: Type of Overlay on Concrete Deck Bridges
3.3 Handling of Data
Before analyzing the data, the data was organized and scrubbed to remove inconsistencies and duplications.
• The data received from MnDOT provided more information than required for this study. Based on internal conversations and conversations with MnDOT, queries were created in Access to collect only the fields that may be pertinent to this study. The queries were then exported into Excel to analyze the data. One query contained all of the inspection records from MnDOT while the other query contained fields that may affect the deck deterioration rate, i.e. year built, ADT, reinforcement type, overlay information, superstructure type.
• The NBI data from previous studies was provided in .txt files. These files were converted to Excel files and then imported into Access. A query was created to pull out information for only the 2621 bridges provided in the MnDOT database. The queries did not include all 2621 bridges as some of these bridges were built later than the inspection information provided in the .txt files.
• The inspection information from the .txt files and the inspection information provided by MnDOT were combined. The combined data was sorted by bridge number and then by inspection date. If a duplicate was found, it was deleted. In addition, if two inspections
6
were found in one year with the same NBI code, one was deleted. This was completed to prevent errors while analyzing the data.
• While looking at the NBI codes for the deck, occasionally codes would rise or fall 1 point for one or two years and then would return to the previous number without any documented rehabilitation. These rises/falls were neglected and the condition code was manually changed to match the initial number. This was completed to prevent reporting shorter time intervals at each NBI code. For example, if a bridge was at a 7 for seven years, then at a 6 for one year, and then back up to a 7 for six years, the analysis would only show the bridge being at a 7 for seven years instead of it likely being at a 7 for fourteen years.
• After completing preliminary analyses, the time intervals at each NBI code didn’t seem realistic. It was decided that “tails” could be affecting the result. A “tail” is data that is incomplete for one of two reasons: 1. It’s an end “tail” in that the bridge may stay at the current NBI code for years to come which are not included in the analysis as they are unknown, or 2. It’s a beginning “tail” in that we did not have the earlier inspection data to include how long the NBI code had been at that number for years prior. It was considered to be a beginning “tail” if the first inspection date was 3 years or more after the year the bridge was built. The first iteration of removing the “tails” removed all “tails” completely. It was found that this eliminated too much data. For example, a bridge could have been at a 7 for fifteen years and it was disregarded since it was the NBI code input for the last inspection. The second and final iteration removed only the “tails” with a time interval of 9 years or less.
A few assumptions were made to simplify the analysis. The assumptions are as follows:
• Only bridges with concrete decks were included in the analysis. The DKSTRUCTYP field equals 1.
• The bridge has epoxy coated bars if the DKPROTECT field equals 1. The fifty bridges with galvanized bars and one bridge with cathodic protected bars are treated as if they have black bars.
• The original construction date of the bridge is determined from the field YEARBUILT. This is used as the base field when determining if the overlay and deck is part of the original construction.
• The bridge has a concrete overlay if the DKSURFTYPE equals 3 (latex concrete overlay) or 4 (low slump concrete overlay). All other types of deck surfaces are treated as if the bridge does not have an overlay. See Figure 3.4 for other types of deck surfaces and the number of each.
• The value of ADT was determined from the field ADTTOTAL. If the value was 1, the bridge is likely a ramp. All bridges with an ADT of 1 were included in the group of bridges with ADT less than 4000.
• The age of the deck was determined by comparing the year under REBARS_INSTALLED to the year under YEARBUILT. (The year under REBARS_INSTALLED is the year epoxy coated bars were installed in the deck.) If the year under REBARS_INSTALLED is at least 3 years later than the year under YEARBUILT, the deck was assumed to be redecked. For nine bridges, the year under REBARS_INSTALLED was blank, but DKPROTECT showed epoxy bars. Five of these
7

bridges were built after 1975. For these five bridges, the year under YEARBUILT was manually input into the REBARS_INSTALLED field. Four of these bridges were built before 1975 and the field YEARRECON had a date. YEARRECON typically is used for federally funded reconstruction projects which could be anything from new overlay to a much more extensive rehabilitation project. For these four bridges, the year under YEARRECON was manually input into the REBARS_INSTALLED field.
• The age of the overlay was determined by comparing the year under DECK_PROTECT_INSTALLED to the year under YEARBUILT. If the year under DECK_PROTECT_INSTALLED is at least 3 years later than the year under YEARBUILT, the bridge was assumed to be overlaid after the original construction.
8

Chapter 4. Analysis
4.1 Number of Years at NBI Condition Codes
After the data was organized and cleaned up, the first task of the analysis was to determine the number of years a bridge deck stayed at a certain NBI condition code. This task was completed in Excel working with a few different tabs in a spreadsheet.
The inspection records for all of the bridges are contained in one tab in a spreadsheet. Among other information, this tab contains the bridge number, year built, inspection date, and the NBI deck condition code. Each bridge has quite a few rows of data, as each inspection record is one row. The information was first sorted by bridge number and then by inspection date, from oldest to most recent.
After the data was sorted, two columns were added to document if the NBI condition code was a begin “tail” or end “tail”. All bridges have an end “tail”, but not a begin “tail”. The spreadsheet only considers the first inspection record to be a begin “tail” if this inspection occurred more than 3 years after the bridge was built.
Next, columns were added to record if the NBI condition code changed from one year to the next. If the NBI code is the same as the previous year, a “1” is placed in the column; if the code is different, a “0” is placed in the column. Two columns complete this task: one column includes “1” when the inspection record is a “tail”, the other column includes a “0” when the inspection record is a “tail”.
Two columns were then added to keep a running tally of years at a specific NBI condition code. If the column mentioned in the paragraph above contains a “1”, the number of years between the inspection date in this row and the inspection date when the NBI condition code was first one specific number is recorded in this column. Two columns are used again as one column includes the running tally of “tails” while the other column does not.
Next, two columns were added to only record the maximum (last of the running tally) number of years that the deck remained at a NBI condition code. Note that the bridge may return to this condition code again at a different period of time and it will also be recorded in this column. One column records the maximum number of years at the NBI condition code including all “tails”. The other column records the maximum number of years that the NBI condition code only including “tails” with values greater than 9 years. Three other columns were created by these maximum number of years columns for ease of data sorting. One column contained the bridge number, one contained the inspector, and the last column contained the NBI condition code for which the maximum number of years is associated with.
The last five columns mentioned in the above paragraph were copied into a separate tab called “Breakdown of NBI by No Years” purely to manipulate less information. When in this tab, all blank rows were deleted and the data was sorted by bridge number, then NBI condition code (smallest to largest), then by years at that NBI condition code (largest to smallest). The data was sorted such that the greatest number of years at a condition code is first to ensure that the
9

VLOOKUP command will return the highest number of years at a specific NBI condition code. As mentioned above, the bridge may return to certain NBI condition codes throughout its lifetime. After significant maintenance or rehabilitation is done, the deck NBI condition code typically increases.
The data in the tab called “Breakdown of NBI by No Years” was filtered by NBI condition code. All of the data for NBI condition code 9 was copied into a tab called “Years as No. 9” and similarly for all other NBI condition codes. Using VLOOKUP command, the number of years at each NBI condition code were copied into a tab which contained all other pertinent information about each bridge. This last tab called “Main Data” is where all other analyses occurred.
In the tab “Main Data”, two columns were added to state whether the bridge has been redecked or if the bridge has a concrete overlay which was placed at least 3 years after the original construction of the deck. These columns were used to analyze the deterioration of a bridge with a new deck or new concrete overlay.
4.2 Analysis of Bridges
The initial analysis was to provide data which corresponds to the bridge replacement and rehabilitation grid from MnDOT’s Bridge Replacement and Improvement Management (BRIM) program. This grid separates bridges by year built, overlay or no overlay, and ADT values. After a few iterations, the breakdown by year built was slightly modified. The intent of breaking down the bridges by year built was to separate when policies changed regarding use of epoxy coated bars and additional cover to the top mat of steel. The final year built breakdowns with respective policy changes are listed below in Table 4.1.
Table 4.1: MnDOT’s Deck Protection Policy Changes by Year Year Built Policy Change 1990 and after All epoxy coated bars in deck 1975-1989 3” cover to top mat of steel Before 1975 Less than 3” cover to top mat of steel
Epoxy coated bars were first used in the early 1970’s. At first only the top mat of steel was epoxy coated and then all bars were epoxy coated for all bridges starting in late 1989. The database does have a code which could be filled in to document which bridges have top epoxy coated bars only: ELEMKEY equal to 429, 430, 431, or 432. Only nine bridges had a code of 430 and none of the other codes were used. Due to the limited use of these codes, the year the bridge was built was used to determine if the epoxy bars were top only or the entire bridge deck. If the bridge was built before 1990 and the DKPROTECT field was equal to one, the epoxy coated bars were assumed to be the top mat only. If the bridge was built in 1990 or later and the DKPROTECT field was equal to one, the epoxy coated bars were assumed to be all reinforcement in the deck.
In the Excel spreadsheet tab called “Main Data”, the bridges were filtered by YEARBUILT, then by DKPROTECT, then by DKSURFTYPE, and last by ADTTOTAL. The number of bridges in each category were recorded. This data is provided in Table 4.2.
10

Year Total % of Number of Bridges Built Deck type Number Database ADT>10k 4-10k <4k Epoxy top & bottom with 3" cover 1990+ Has concrete overlay 576 25% 257 165 154 1990+ No concrete overlay 163 7% 26 36 101 Epoxy top only with 3" cover 1975-89 Has concrete overlay 365 16% 174 117 74 1975-89 No concrete overlay 153 6% 12 41 100 No epoxy with 3" cover 1975-89 Has concrete overlay 90 4% 33 25 32 1975-89 No concrete overlay 28 1% 2 1 25 No epoxy with less than 3" cover <1975 Has concrete overlay 780 33% 301 257 222 <1975 No concrete overlay 187 8% 20 16 151
Legend: Included in 1 chart Included in 1 chart
Table 4.2: Number of Bridges in Each Category
Only 2342 bridges are categorized in Table 4.2 instead of the complete set of 2601 bridges. The remaining bridges were originally built prior to 1975 and have been redecked since their original construction. The data for these bridges are not included in this analysis to ensure that similar bridges are being compared, i.e. bridges that have their original deck.
As seen in Table 4.2, some categories do not have many bridges represented. The minimum total number of bridges that we analyzed separately was 50. For this reason, bridges built between 1975 and 1989 which do not have epoxy coated bars were all analyzed together instead of breaking this year built category down by overlay (which has 90 bridges) or no overlay (which has 28 bridges). These are the only 2 rows which were analyzed together. All other rows shown in Table 4.1 were analyzed separately. Some rows do not have many bridges in each ADT category. If the number of bridges in an ADT category is less than 20, the information is not provided in Table 4.3 and Figures 4.1 through 4.7. We considered combining bridges in different ADT categories, but ADT at first seemed to play a bigger role in the performance of bridge decks over the presence of an overlay.
After the number of bridges were recorded in each category, the average number of years at each NBI condition code was recorded along with the number of bridges included in that average. For example, there are a total of 222 bridges that were built before 1975 that have a concrete overlay and an average ADT less than 4000. But of the 222 bridges, only 125 bridges have a deck NBI condition code of 8. Table 4.3 provides the average number of years at a NBI condition code for each category. Some cells state “No Data” or “Limited Data”. If the average number of years at a NBI condition code is based on 7 bridges or less, the data is not provided in the table as it was deemed less reliable as it was based on a small number of bridges.
11

Deck NBI Condition Code <= 5 Deck NBI Condition Code = 6 Deck NBI Condition Code = 7 Deck NBI Condition Code >= 8
Year built Deck type ADT>10k 4-10k <4k ADT>10k 4-10k <4k ADT>10k 4-10k <4k ADT>10k 4-10k <4k 1990+ Has concrete overlay No Data No Data No Data Limited Data Limited Data No Data 11.9 14 12.2 6.7 8.7 9.3
No concrete overlay No Data Limited Data No Data No Data No Data Limited Data 14.7 14.7 13.7 6.5 13.2 16.3 1975-89 Has concrete overlay Limited Data Limited Data Limited Data 12.4 12.5 13.2 17.9 17.5 16.5 9.5 11.4 12.1
Epoxy No concrete overlay No Data Limited Data Limited Data Limited Data Limited Data 15.8 Limited Data 17.5 14.7 Limited Data 13.1 15 1975-89 Has concrete overlay Limited Data No Data Limited Data 12.3 Limited Data 11.4 12.6 12.2 11.6 12.3 12.6 16.1
No Epoxy No concrete overlay <1975 Has concrete overlay 7.8 11.2 13.1 11.7 12.2 10.5 15.6 14.5 16 10 12 13
No concrete overlay 10.0 Limited Data 13.8 10.0 Limited Data 14 13.3 Limited Data 9.8 9.1 Limited Data 11
Table 4.3: Average Number of Years at Deck NBI Condition Code
12

5
6
7
8
9
10
0 5 10 15 20
Deck
NBI
Con
ditio
n Co
de
Number of Years
ADT >10K (257 bridges)
ADT 4-10K (165 bridges)
ADT <4K (154 bridges)
MnDOT Assumed
Graph includes 25% of all bridges considered in the study.
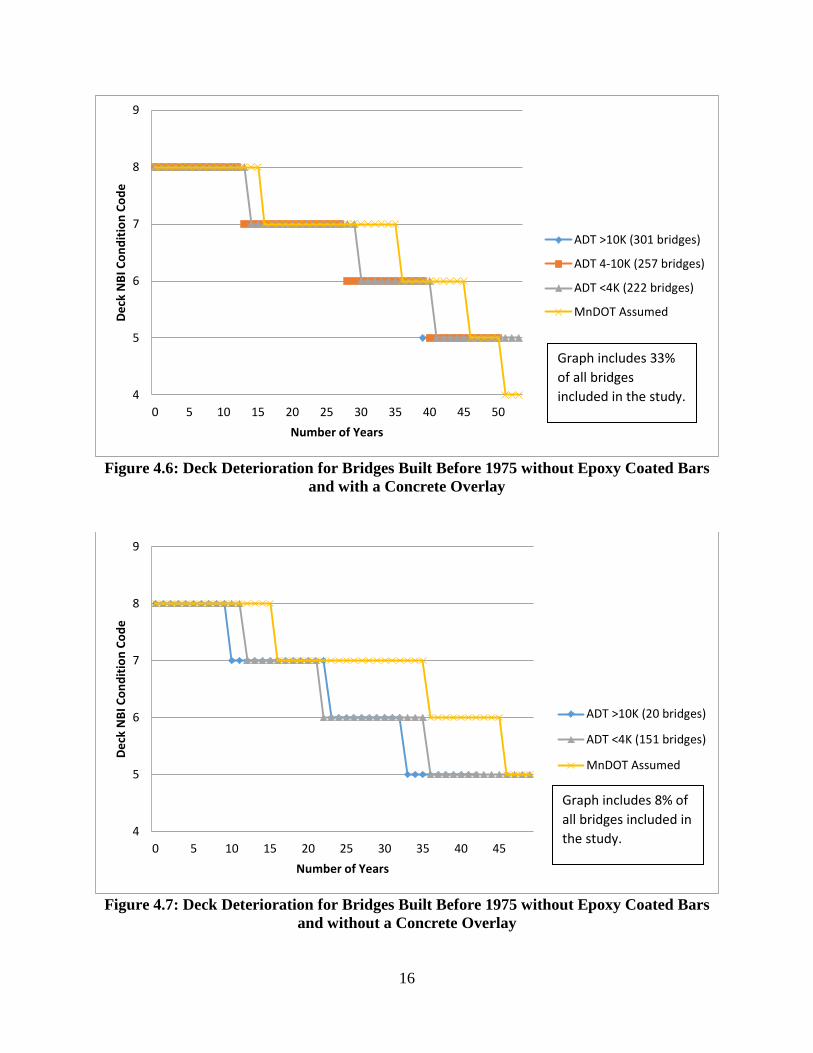
The data presented in Table 4.3 is also presented in graphical format in Figures 4.1 through 4.7. Each ADT breakdown is presented by a separate line in each figure. In addition, a line was added to include the number of years at each NBI condition code MnDOT assumed prior to this study. These number of years at each NBI condition code were a quick rough estimate used for preliminary planning purposes.
Figure 4.1: Deck Deterioration for Bridges Built During or After 1990 with a Concrete Overlay
13

5
6
7
8
9
10
0 5 10 15 20 25 30
Deck
NBI
Con
ditio
n Co
de
Number of Years
ADT >10K (26 bridges)
ADT 4-10K (36 bridges)
ADT <4K (101 bridges)
MnDOT Assumed
Graph includes 7% of all bridges included in the study.
Figure 4.2: Deck Deterioration for Bridges Built During or After 1990 without a Concrete Overlay
5
6
7
8
9
10
0 5 10 15 20 25 30 35 40
Deck
NBI
Con
ditio
n Co
de
Number of Years
ADT >10K (174 bridges)
ADT 4-10K (117 bridges)
ADT <4K (74 bridges)
MnDOT Assumed
Graph includes 16% of all bridges included in the study.
Figure 4.3: Deck Deterioration for Bridges Built Between 1975 and 1989 with Epoxy Coated Top Bars and a Concrete Overlay
14

5
6
7
8
9
10
0 5 10 15 20 25 30 35 40 45
Deck
NBI
Con
ditio
n Co
de
Number of Years
ADT 4-10K (41 bridges)
ADT <4K (100 bridges)
MnDOT Assumed
Graph includes 6% of all bridges included in the study.
Figure 4.4: Deck Deterioration for Bridges Built Between 1975 and 1989 with Epoxy Coated Top Bars and without a Concrete Overlay
5
6
7
8
9
10
0 5 10 15 20 25 30 35
Deck
NBI
Con
ditio
n Co
de
Number of Years
ADT >10K (35 bridges)
ADT 4-10K (26 bridges)
ADT <4K (57 bridges)
MnDOT Assumed
Graph includes 5% of all bridges included in the study.
Figure 4.5: Deck Deterioration for Bridges Built Between 1975 and 1989 without Epoxy Coated Bars, with and without a Concrete Overlay
15
4
5
6
7
8
9
0 5 10 15 20 25 30 35 40 45
Deck
NBI
Con
ditio
n Co
de
Number of Years
ADT >10K (20 bridges)
ADT <4K (151 bridges)
MnDOT Assumed
Graph includes 8% of all bridges included in the study.
4
5
6
7
8
9
0 5 10 15 20 25 30 35 40 45 50
Deck
NBI
Con
ditio
n Co
de
Number of Years
ADT >10K (301 bridges)
ADT 4-10K (257 bridges)
ADT <4K (222 bridges)
MnDOT Assumed
Graph includes 33% of all bridges included in the study.
Figure 4.6: Deck Deterioration for Bridges Built Before 1975 without Epoxy Coated Bars and with a Concrete Overlay
Figure 4.7: Deck Deterioration for Bridges Built Before 1975 without Epoxy Coated Bars and without a Concrete Overlay
16
4.3 Analysis of Redecked Bridges
Similar to the analysis completed for all bridges which have their original decks, an analysis was completed for all redecked bridges. First, the spreadsheet used for the analysis described in Section 4.2 was copied to create a spreadsheet of redecked bridges. All bridges are still included in this copied spreadsheet, but only bridges with a new deck are analyzed. As described in Section 3.3, a bridge is considered to have a new deck if the year under “REBARS_INSTALLED” is at least three years after the year under “YEARBUILT”.
In the new spreadsheet, all inspection data provided before the bridge was redecked was manually deleted. This was to ensure no NBI condition code data provided before the bridge was redecked was included in the analysis. After deleting the irrelevant inspection data, the information presented in the tabs “Breakdown of NBI by No Years”, “Years at No. 9”, and following were updated. The data provided in the tab “Main Data” was automatically updated with the VLOOKUP command.
Next, the number of bridges was determined for each category, similar to Table 4.2. All redecked bridges have epoxy coated bars and were redecked after 1975. The year redecked provided in Table 4.4 is only before or after 1990 since the other categories do not apply. Because the number of redecked bridges without a concrete overlay is right around 50, the analysis combines bridges with and without a concrete overlay.
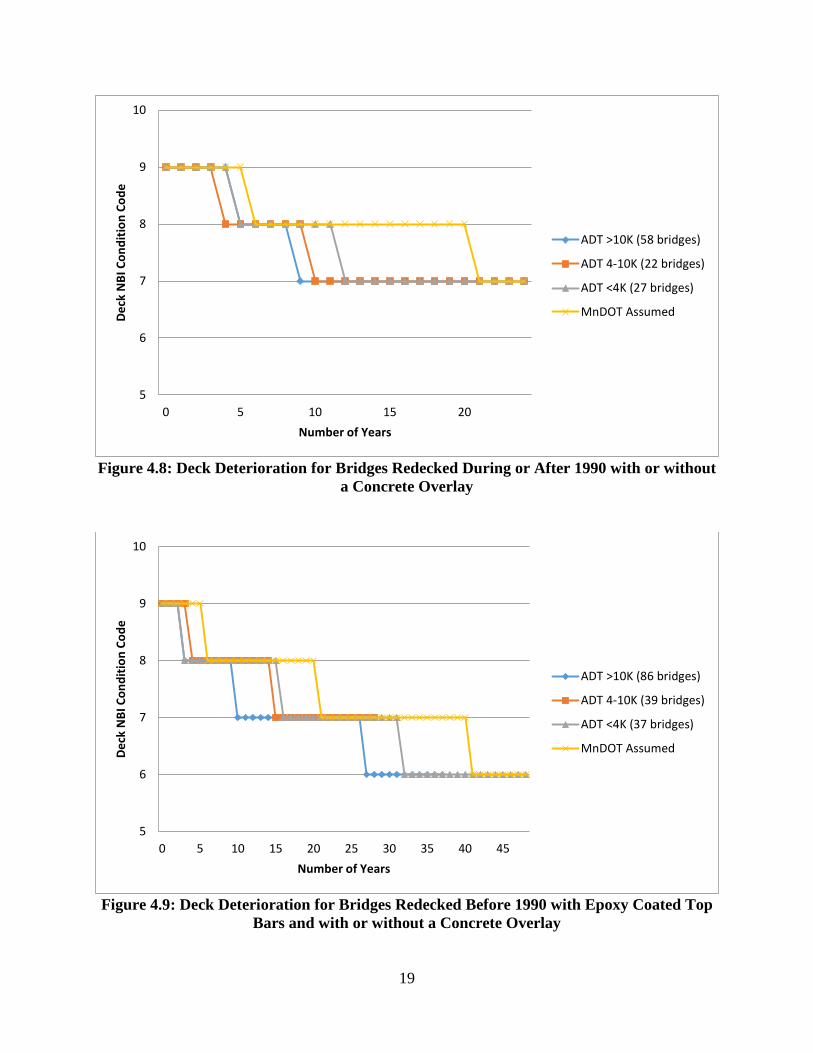
After the number of bridges in each category were determined, the average number of years at each NBI condition code was recorded. This information is provided in Table 4.5. The use of “Limited Data” in Table 4.5 is similar to its use in Table 4.3. Figures 4.8 and 4.9 provide a graphical presentation of the data in Table 4.5.
17

Table 4.4: Number of Redecked Bridges in Each Category Year Total Number of Bridges
Redecked Deck type Number ADT>10k 4-10k <4k Has concrete overlay 63 38 17 8 1990+
No concrete overlay 44 20 5 19 Has concrete overlay 108 81 22 5 <1990
No concrete overlay 54 5 17 32
Legend: Included in 1 chart Included in 1 chart
Table 4.5: Average Number of Years at Deck NBI Condition Code for Redecked Bridges
Deck NBI Condition Code <= 5 Deck NBI Condition Code = 6 Deck NBI Condition Code = 7 Deck NBI Condition Code >= 8 Year Redecked Deck type ADT>10k 4-10k <4k ADT>10k 4-10k <4k ADT>10k 4-10k <4k ADT>10k 4-10k <4k
1990+ Has concrete overlay No Data No Data No Data Limited Data Limited Data No Data 13.3 14.6 12.7 7.9 8.4 10.3 No concrete overlay
<1990 Has concrete overlay Limited Data No Data No Data 10.9 12.9 17.3 17.3 13.7 15.9 8.9 13.3 14.7 No concrete overlay
18
5
6
7
8
9
10
0 5 10 15 20
Deck
NBI
Con
ditio
n Co
de
Number of Years
ADT >10K (58 bridges)
ADT 4-10K (22 bridges)
ADT <4K (27 bridges)
MnDOT Assumed
Figure 4.8: Deck Deterioration for Bridges Redecked During or After 1990 with or without a Concrete Overlay
5
6
7
8
9
10
0 5 10 15 20 25 30 35 40 45
Deck
NBI
Con
ditio
n Co
de
Number of Years
ADT >10K (86 bridges)
ADT 4-10K (39 bridges)
ADT <4K (37 bridges)
MnDOT Assumed
Figure 4.9: Deck Deterioration for Bridges Redecked Before 1990 with Epoxy Coated Top Bars and with or without a Concrete Overlay
19

4.4 Analysis of Bridges Overlaid at Least Three Years after Original Construction
Another maintenance item that was analyzed to determine how it affected deck deterioration was the application of a concrete overlay after the original construction, whether it was a re-overlay or overlaying an older deck for the first time.
First, the spreadsheet used for the analysis described in Section 4.2 was copied to create a spreadsheet of bridges overlaid after the original construction. In the new spreadsheet, all bridges are still included, but only bridges which were overlaid at least three years after the original construction were analyzed. As described in Section 3.3, a bridge is considered to have a new overlay if the year under “DECK_PROTECT_INSTALLED” is at least three years after the year under “YEARBUILT”.
All inspection data provided before the date in “DECK_PROTECT_INSTALLED” was manually deleted. This was to ensure no NBI condition code data provided before the bridge was re-overlaid or overlaid for the first time was included in the analysis. After deleting the irrelevant inspection data, the information presented in the tabs “Breakdown of NBI by No Years”, “Years at No. 9”, and following were updated. The data provided in the tab “Main Data” was automatically updated with the VLOOKUP command.
The number of bridges in each category and number of years at each deck NBI condition code were recorded and analyzed. A few items were noticed. First, for half of the bridges that possess a new concrete overlay, the deck NBI condition code did not increase right after the new concrete overlay was applied. We anticipated to see the NBI condition code to increase by at least 1 value. In addition, we noticed that bridges that were built prior to 1975 and had a concrete overlay applied after the original construction appeared to deteriorate faster than the average of all bridges built prior to 1975 with or without a concrete overlay. This could be due more to the original condition of the deck prior to the application of the new concrete overlay. When the overlay program began, overlays were first applied to the worst condition decks. These decks already likely had high concentrations of chlorides at the rebar. The actual data is not provided in this report since over half of the bridges did not increase a deck NBI condition code after the deck was overlaid.
4.5 Analysis of Bridges with Prestressed Concrete Girders or Continuous Steel Girders
In a previous deck deterioration study, the type of superstructure material was found to play a significant part in how quickly the deck deteriorated. Two common superstructure materials were analyzed separately to determine if these affected the deterioration of the decks: prestressed concrete girders and continuous steel girders.
The spreadsheet used for the analysis described in Section 4.2 was used for this analysis also. Instead of only filtering on YEARBUILT, DKPROTECT, DKSURFTYPE and ADTTOTAL, the bridges were also filtered MATERIALMAIN and DESIGNMAIN. MATERIALMAIN equal to 4 denotes a steel superstructure while a value of 5 denotes a prestressed concrete superstructure. DESIGNMAIN equal to 2 denotes a girder bridge.
20

Table 4.6: Number of Prestressed Concrete Girder Bridges in Each Category Total Number of Bridges
Year Built Deck type Number ADT>10k 4-10k <4k Epoxy top & bottom with 3" cover 1990+ Has concrete overlay 418 188 115 115 1990+ No concrete overlay 128 24 29 75 Epoxy top only with 3" cover 1975-89 Has concrete overlay 144 72 49 23 1975-89 No concrete overlay 95 4 29 62 No epoxy with 3" cover 1975-89 Has concrete overlay 69 22 21 26 1975-89 No concrete overlay 19 2 1 16 No epoxy without 3" cover <1975 Has concrete overlay 358 122 134 102 <1975 No concrete overlay 75 3 4 68 Legend: Included in 1 chart Included in 1 chart
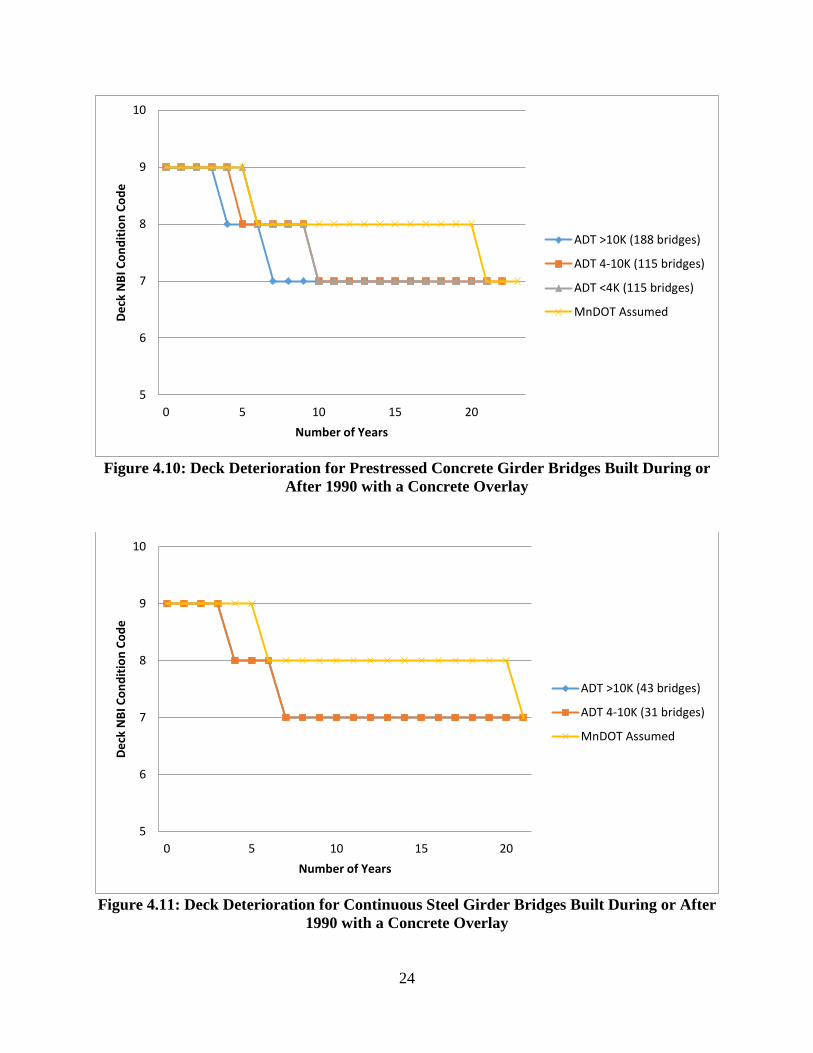
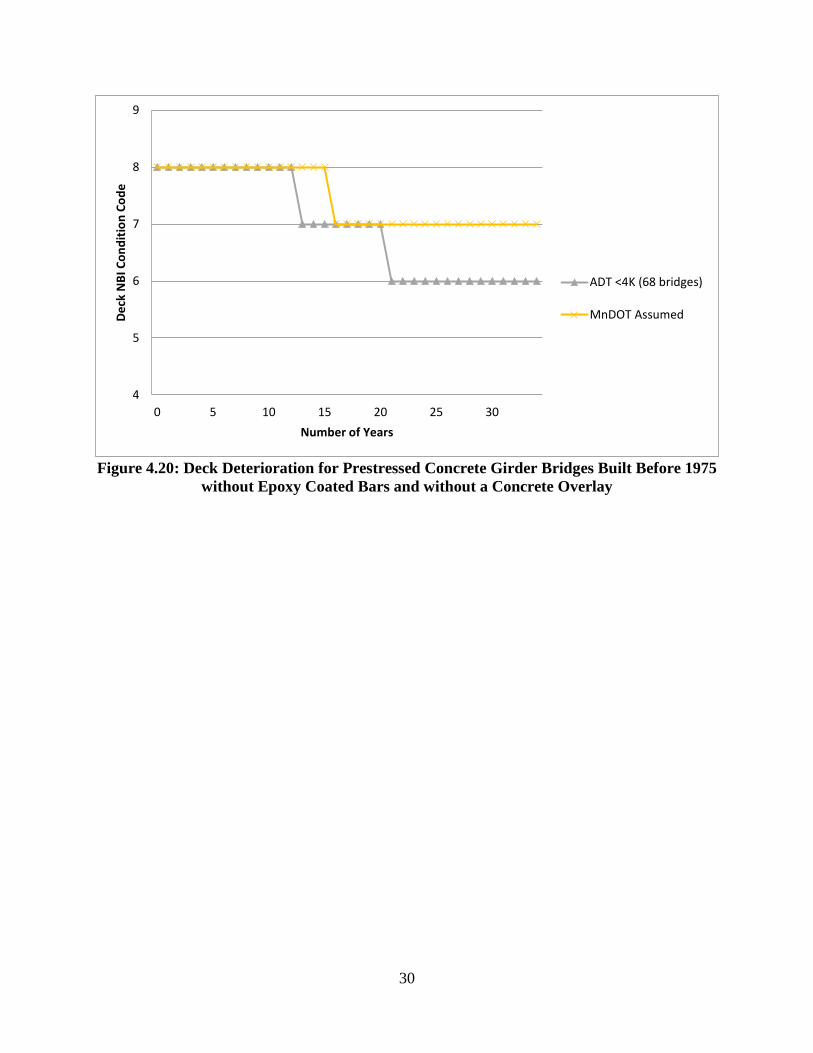
As with the other analyses, the total number of bridges per category and the average number of years at a specific deck NBI condition code were recorded. Tables 4.6 through 4.9 provide the numerical representation and Figures 4.10 through 4.20 provide the graphical representation of the data. Rows that are not shaded in Tables 4.6 and 4.7 do not have a corresponding figure due to the lack of data. Rows were not combined differently than the total group of bridges to ensure that comparisons between specific material type and the total group of bridges could be made accurately.
21

Table 4.7: Number of Continuous Steel Girder Bridges in Each Category Total Number of Bridges
Year Built Deck type Number ADT>10k 4-10k <4k Epoxy top & bottom with 3" cover 1990+ Has concrete overlay 87 43 31 13 1990+ No concrete overlay 16 1 6 9 Epoxy top only with 3" cover 1975-89 Has concrete overlay 177 78 58 41 1975-89 No concrete overlay 39 4 11 24 No epoxy with 3" cover 1975-89 Has concrete overlay 16 10 4 2 1975-89 No concrete overlay 6 0 0 6 No epoxy without 3" cover <1975 Has concrete overlay 310 145 99 66 <1975 No concrete overlay 24 4 4 16 Legend: Included in 1 chart Included in 1 chart
22

Table 4.8: Average Number of Years at Deck NBI Condition Code for Prestressed Concrete Girder Bridges Deck NBI Condition Code <= 5 Deck NBI Condition Code = 6 Deck NBI Condition Code = 7 Deck NBI Condition Code >= 8
Year built Deck type ADT>10k 4-10k <4k ADT>10k 4-10k <4k ADT>10k 4-10k <4k ADT>10k 4-10k <4k 1990+ Has concrete overlay No Data No Data No Data No Data Limited Data No Data 10.9 12.9 11.7 6.8 9.2 8.4
No concrete overlay No Data No Data No Data No Data No Data No Data 13.9 15.5 11.4 6.5 14.4 17 1975-89 Has concrete overlay No Data Limited Data Limited Data Limited Data Limited Data Limited Data 18 16.8 14 11 13.2 15.4 Epoxy No concrete overlay No Data Limited Data Limited Data Limited Data Limited Data 16.3 Limited Data 17.0 13.4 Limited Data 10.1 17 1975-89 No Epoxy
Has concrete overlay No concrete overlay
No Data No Data No Data 13 Limited Data Limited Data 14 12.9 11.4 12.9 13 16
<1975 Has concrete overlay 8.4 12.4 Limited Data 9.6 11.2 10.4 17 14.4 16.4 11.9 13.2 14.2 No concrete overlay No Data No Data Limited Data Limited Data Limited Data 14 Limited Data Limited Data 8.3 Limited Data No Data 14.3
Table 4.9: Average Number of Years at Deck NBI Condition Code for Continuous Steel Girder Bridges Deck NBI Condition Code <= 5 Deck NBI Condition Code = 6 Deck NBI Condition Code = 7 Deck NBI Condition Code >= 8
Year built Deck type ADT>10k 4-10k <4k ADT>10k 4-10k <4k ADT>10k 4-10k <4k ADT>10k 4-10k <4k 1990+ Has concrete overlay No Data No Data No Data Limited Data No Data No Data 14.6 15.4 Limited Data 6 6.5 Limited Data
No concrete overlay No Data Limited Data No Data No Data No Data Limited Data No Data Limited Data Limited Data No Data Limited Data Limited Data 1975-89 Has concrete overlay Limited Data No Data Limited Data 12.8 10.7 13.6 17.7 17.8 16.8 7.1 9.4 8.8 Epoxy No concrete overlay No Data No Data Limited Data No Data Limited Data Limited Data Limited Data Limited Data 15.5 Limited Data Limited Data 12 1975-89 No Epoxy
Has concrete overlay No concrete overlay
Limited Data No Data Limited Data Limited Data Limited Data Limited Data Limited Data Limited Data Limited Data Limited Data Limited Data Limited Data
<1975 Has concrete overlay 7.5 11.1 11.6 12.6 13.3 10.2 14.6 14.7 16.6 8.5 8.7 10.2 No concrete overlay Limited Data Limited Data Limited Data Limited Data Limited Data Limited Data Limited Data Limited Data Limited Data Limited Data Limited Data Limited Data
23
10
9
Deck
NBI
Con
ditio
n Co
de
8
7
6
5
ADT >10K (43 bridges)
ADT 4-10K (31 bridges)
MnDOT Assumed
0 5 10 15 20
Number of Years
Figure 4.11: Deck Deterioration for Continuous Steel Girder Bridges Built During or After 1990 with a Concrete Overlay
5
6
7
8
9
10
0 5 10 15 20
Deck
NBI
Con
ditio
n Co
de
Number of Years
ADT >10K (188 bridges)
ADT 4-10K (115 bridges)
ADT <4K (115 bridges)
MnDOT Assumed
Figure 4.10: Deck Deterioration for Prestressed Concrete Girder Bridges Built During or After 1990 with a Concrete Overlay
24

5
6
7
8
9
10
0 5 10 15 20 25 30
Deck
NBI
Con
ditio
n Co
de
Number of Years
ADT >10K (24 bridges)
ADT 4-10K (29 bridges)
ADT <4K (75 bridges)
MnDOT Assumed
Figure 4.12: Deck Deterioration for Prestressed Concrete Girder Bridges Built During or After 1990 without a Concrete Overlay
25

5
6
7
8
9
10
0 5 10 15 20 25 30
Deck
NBI
Con
ditio
n Co
de
Number of Years
ADT >10K (72 bridges)
ADT 4-10K (49 bridges)
ADT <4K (23 bridges)
MnDOT Assumed
Figure 4.13: Deck Deterioration for Prestressed Concrete Girder Bridges Built Between 1975 and 1989 with Epoxy Coated Top Bars and a Concrete Overlay
5
6
7
8
9
10
0 5 10 15 20 25 30 35 40
Deck
NBI
Con
ditio
n Co
de
Number of Years
ADT >10K (78 bridges)
ADT 4-10K (58 bridges)
ADT <4K (41 bridges)
MnDOT Assumed
Figure 4.14: Deck Deterioration for Continuous Steel Girder Bridges Built Between 1975 and 1989 with Epoxy Coated Top Bars and a Concrete Overlay
26

5
6
7
8
9
10
0 5 10 15 20 25 30 35 40 45
Deck
NBI
Con
ditio
n Co
de
Number of Years
ADT 4-10K (29 bridges)
ADT <4K (62 bridges)
MnDOT Assumed
Figure 4.15: Deck Deterioration for Prestressed Concrete Girder Bridges Built Between 1975 and 1989 with Epoxy Coated Top Bars and without a Concrete Overlay
5
6
7
8
9
10
0 5 10 15 20 25
Deck
NBI
Con
ditio
n Co
de
Number of Years
ADT <4K (24 bridges)
MnDOT Assumed
Figure 4.16: Deck Deterioration for Continuous Steel Girder Bridges Built Between 1975 and 1989 with Epoxy Coated Top Bars and without a Concrete Overlay
27

5
6
7
8
9
10
0 5 10 15 20 25 30 35 40
Deck
NBI
Con
ditio
n Co
de
Number of Years
ADT >10K (24 bridges)
ADT 4-10K (22 bridges)
ADT <4K (42 bridges)
MnDOT Assumed
Figure 4.17: Deck Deterioration for Prestressed Concrete Girder Bridges Built Between 1975 and 1989 without Epoxy Coated Bars, with and without a Concrete Overlay
28

4
5
6
7
8
9
0 5 10 15 20 25 30 35 40 45 50
Deck
NBI
Con
ditio
n Co
de
Number of Years
ADT >10K (122 bridges)
ADT 4-10K (134 bridges)
ADT <4K (102 bridges)
MnDOT Assumed
Figure 4.18: Deck Deterioration for Prestressed Concrete Girder Bridges Built Before 1975 without Epoxy Coated Bars and with a Concrete Overlay
4
5
6
7
8
9
0 5 10 15 20 25 30 35 40 45
Deck
NBI
Con
ditio
n Co
de
Number of Years
ADT >10K (145 bridges)
ADT 4-10K (99 bridges)
ADT <4K (66 bridges)
MnDOT Assumed
Figure 4.19: Deck Deterioration for Continuous Steel Girder Bridges Built Before 1975 without Epoxy Coated Bars and with a Concrete Overlay
29
4
5
6
7
8
9
0 5 10 15 20 25 30
Deck
NBI
Con
ditio
n Co
de
Number of Years
ADT <4K (68 bridges)
MnDOT Assumed
Figure 4.20: Deck Deterioration for Prestressed Concrete Girder Bridges Built Before 1975 without Epoxy Coated Bars and without a Concrete Overlay
30
4.6 Analysis of Bridges within the Metro District and Outside of the Metro District
The analysis on the total set of bridges described and shown in Section 4.2 implies that bridges built after 1975 with epoxy bars (whether top only or top and bottom bars) perform better without a concrete overlay than with a concrete overlay. This seems counterintuitive which caused us to look into this further.
One thought was with regards to bridge location and district maintenance practices. After looking into different combinations of districts, the one district that stood out was the Metro District. Most bridges in the metro area drop down to a NBI condition code of 7 faster than bridges in other districts. Bridges in the metro area comprise almost 60% of the total number of bridges built during or after 1990 and with a concrete overlay. In contrast, bridges in the metro area only comprise about 20% of the total number of bridges built during or after 1990 but without a concrete overlay. For bridges built between 1989 and 1975, bridges in the metro area comprise over 75% of the total number of bridges with a concrete overlay and less than 10% of the total number of bridges without a concrete overlay. For this reason, the average number of years at NBI condition codes of 8 and 9 are smaller for bridges with a concrete overlay versus without a concrete overlay. Table 4.10 provides the number of bridges in the Metro District and all other districts. The first four rows are the total number of bridges as shown in Table 4.2. The numbers are provided here for reference.
31
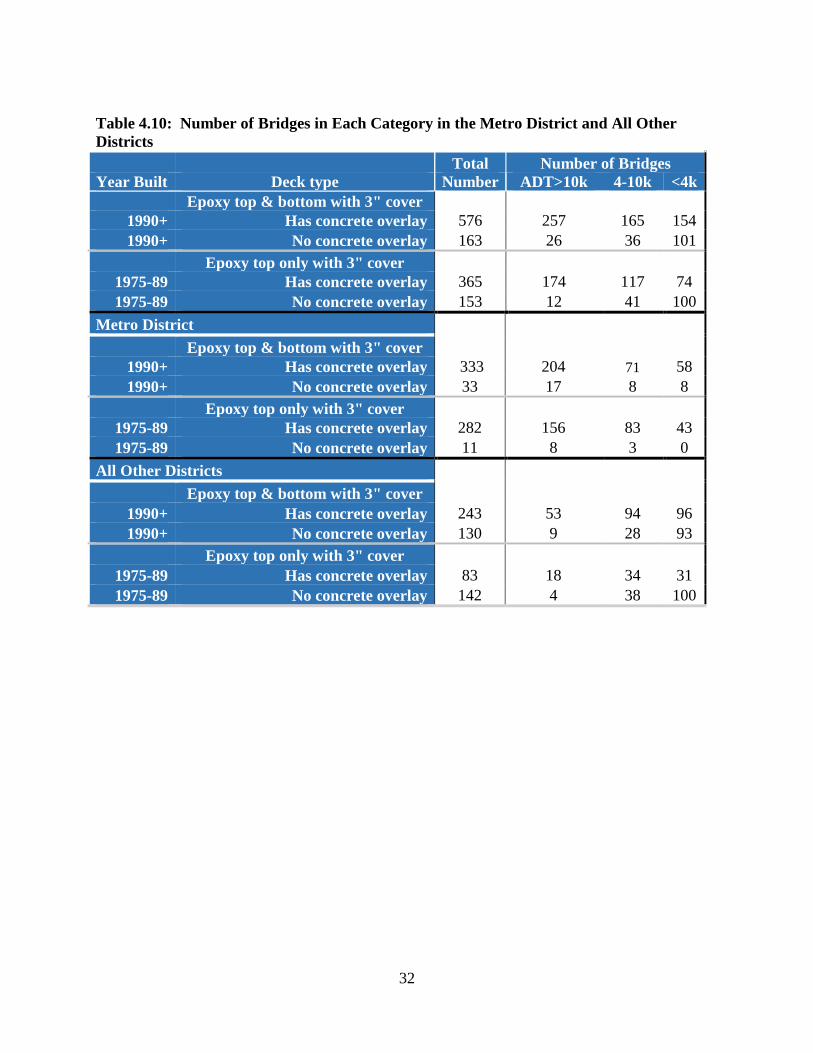
Table 4.10: Number of Bridges in Each Category in the Metro District and All Other Districts
Total Number of Bridges Year Built Deck type Number ADT>10k 4-10k <4k
Epoxy top & bottom with 3" cover 1990+ Has concrete overlay 576 257 165 154 1990+ No concrete overlay 163 26 36 101
Epoxy top only with 3" cover 1975-89 Has concrete overlay 365 174 117 74 1975-89 No concrete overlay 153 12 41 100
Metro District Epoxy top & bottom with 3" cover
1990+ Has concrete overlay 333 204 71 58 1990+ No concrete overlay 33 17 8 8
Epoxy top only with 3" cover 1975-89 Has concrete overlay 282 156 83 43 1975-89 No concrete overlay 11 8 3 0
All Other Districts Epoxy top & bottom with 3" cover
1990+ Has concrete overlay 243 53 94 96 1990+ No concrete overlay 130 9 28 93
Epoxy top only with 3" cover 1975-89 Has concrete overlay 83 18 34 31 1975-89 No concrete overlay 142 4 38 100
32

Table 4.11: Average Number of Years at Deck NBI Condition Code for Bridges in the Metro District and All Other Districts
Year built 1990+
Deck type Has concrete overlay No concrete overlay
Deck NBI Condition Code <= 5 ADT>10k 4-10k <4k
Deck NBI Condition Code = 6 ADT>10k 4-10k <4k
Deck NBI Condition Code = 7 ADT>10k 4-10k <4k
Deck NBI Condition Code >= 8 ADT>10k 4-10k <4k
No Data No Data No Data No Data Limited Data No Data
Limited Data Limited Data No Data No Data No Data Limited Data
11.9 14 12.2 14.7 14.7 13.7
6.7 8.7 9.3 6.5 13.2 16.3
1975-89 Epoxy
Has concrete overlay No concrete overlay
Limited Data Limited Data Limited Data No Data Limited Data Limited Data
12.4 12.5 13.2 Limited Data Limited Data 15.8
17.9 17.5 16.5 Limited Data 17.5 14.7
9.5 11.4 12.1 Limited Data 13.1 15
Metro District Bridges Only 1990+ Has concrete overlay
No concrete overlay No Data No Data
No Data No Data
No Data No Data
Limited Data No Data
No Data No Data
No Data No Data
12.1 Limited Data
14.7 Limited Data
12.3 Limited Data
6.2 Limited Data
6.4 Limited Data
7.5 Limited Data
1975-89 Epoxy
Has concrete overlay No concrete overlay
Limited Data No Data
No Data No Data
No Data No Data
12.2 Limited Data
10.3 Limited Data
12.2 No Data
17.8 16.9
17.7 Limited Data
16.6 No Data
9.1 Limited Data
7.9 Limited Data
8 No Data
Bridges in All Other Districts 1990+ Has concrete overlay
No concrete overlay No Data No Data
No Data Limited Data
No Data No Data
No Data No Data
Limited Data No Data
No Data Limited Data
10.6 Limited Data
12.3 Limited Data
Limited Data 14.2
8.3 Limited Data
10.1 14.8
10.5 16.5
1975-89 Epoxy
Has concrete overlay No concrete overlay
No Data No Data
Limited Data Limited Data
Limited Data Limited Data
Limited Data Limited Data
17.9 Limited Data
14 15.8
Limited Data Limited Data
16.9 18.0
16.2 14.7
Limited Data Limited Data
14.6 13.0
17 15
33
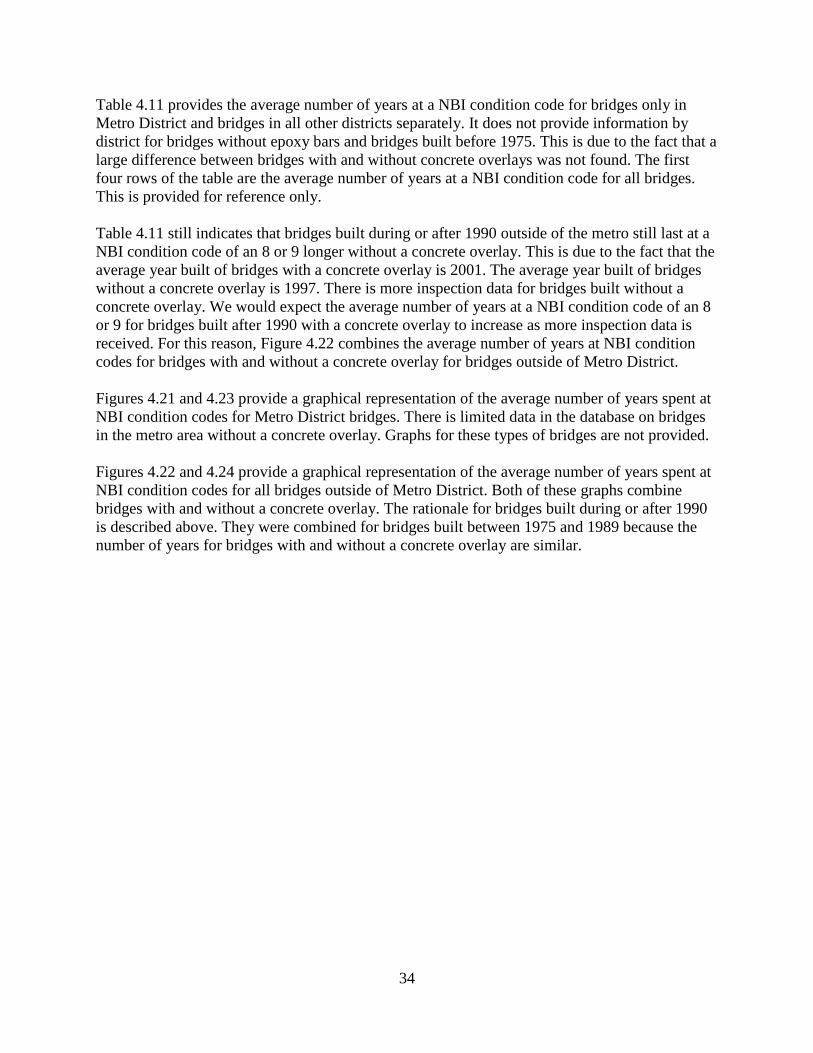
Table 4.11 provides the average number of years at a NBI condition code for bridges only in Metro District and bridges in all other districts separately. It does not provide information by district for bridges without epoxy bars and bridges built before 1975. This is due to the fact that a large difference between bridges with and without concrete overlays was not found. The first four rows of the table are the average number of years at a NBI condition code for all bridges. This is provided for reference only.
Table 4.11 still indicates that bridges built during or after 1990 outside of the metro still last at a NBI condition code of an 8 or 9 longer without a concrete overlay. This is due to the fact that the average year built of bridges with a concrete overlay is 2001. The average year built of bridges without a concrete overlay is 1997. There is more inspection data for bridges built without a concrete overlay. We would expect the average number of years at a NBI condition code of an 8 or 9 for bridges built after 1990 with a concrete overlay to increase as more inspection data is received. For this reason, Figure 4.22 combines the average number of years at NBI condition codes for bridges with and without a concrete overlay for bridges outside of Metro District.
Figures 4.21 and 4.23 provide a graphical representation of the average number of years spent at NBI condition codes for Metro District bridges. There is limited data in the database on bridges in the metro area without a concrete overlay. Graphs for these types of bridges are not provided.
Figures 4.22 and 4.24 provide a graphical representation of the average number of years spent at NBI condition codes for all bridges outside of Metro District. Both of these graphs combine bridges with and without a concrete overlay. The rationale for bridges built during or after 1990 is described above. They were combined for bridges built between 1975 and 1989 because the number of years for bridges with and without a concrete overlay are similar.
34

5
6
7
8
9
10
0 5 10 15 20
Deck
NBI
Con
ditio
n Co
de
Number of Years
ADT >10K (204 bridges)
ADT 4-10K (71 bridges)
ADT <4K (58 bridges)
MnDOT Assumed
5
6
7
8
9
10
0 5 10 15 20 25
Deck
NBI
Con
ditio
n Co
de
Number of Years
ADT >10K (64 bridges)
ADT 4-10K (122 bridges)
ADT <4K (189 bridges)
MnDOT Assumed
Figure 4.22: Deck Deterioration for Bridges Outside of the Metro District Built During or
Figure 4.21: Deck Deterioration for the Metro District Bridges Built During or After 1990 with a Concrete Overlay
After 1990 with and without a Concrete Overlay
35

36
Figure 4.23: Deck Deterioration for the Metro District Bridges Built Between 1975 and
1989 with Epoxy Coated Top Bars and with a Concrete Overlay
Figure 4.24: Deck Deterioration for Bridges Outside of the Metro District Built Between
1975 and 1989 with Epoxy Coated Top Bars and with or without a Concrete Overlay
5
6
7
8
9
10
0 5 10 15 20 25 30 35
Deck
NBI
Con
ditio
n Co
de
Number of Years
ADT >10K (156 bridges)
ADT 4-10K (83 bridges)
ADT <4K (43 bridges)
MnDOT Assumed
5
6
7
8
9
10
0 5 10 15 20 25 30 35 40 45
Deck
NBI
Con
ditio
n Co
de
Number of Years
ADT 4-10K (72 bridges)
ADT <4K (131 bridges)
MnDOT Assumed

37
Chapter 5. Results 5.1 Findings When the analysis began, we assumed many different items affected the deterioration of a concrete bridge deck. As the analysis continued, we identified which factors affected deck deterioration more than others. First, all of the bridges with original decks were analyzed based on presence of epoxy coated bars (top only or both top and bottom mats), presence of concrete overlay, 3 inches of cover to the top mat of steel, and ADT. We found the following:
• Bridges built after 1975, which are bridges with 3 inches of cover, appear to perform better without a concrete overlay than with. (This was later reanalyzed by district and found to not necessarily be accurate.)
• Bridges with less ADT perform slightly better or the same as bridges with a higher ADT. • Bridges without epoxy coated bars and built between 1975 and 1989 deteriorate faster
than other bridges. Mainly, time spent at a NBI condition code of 7 is less than other categories.
• Bridges built prior to 1975 are the only category with enough data at a NBI condition code of 5 to report.
Next, bridges that have been redecked since their original construction were analyzed. In general, we found that the decks perform similar to a new deck. Special deterioration tables were not created for redecked bridges; deterioration tables based on the age of the deck should be used. In other words, if the bridge was built in 1972, but the deck was reconstructed in 1992, the deterioration table for bridges built after 1990 should be used. Analysis of bridges that have been reoverlaid or overlaid for the first time a minimum of three years after the original construction shows that these bridges deteriorate faster than the total set of bridges that still have their original decks. We believe this is more due to the fact that this analysis is only looking at bridges which are already in fair condition, in other words the worst of the bunch. Chlorides may have already entered the deck and these are not being removed prior to reoverlaying the deck. Separate deterioration tables were not created for bridges which are reoverlaid. The standard deterioration tables should be used. The analysis found that prestressed concrete girder bridges perform slightly better than the total set of bridges and continuous steel girders perform slightly worse than the total set of bridges. Because the difference is only a couple of years, separate deterioration tables were not created. Bridges in different districts were also analyzed separately. Bridges in the Metro District were found to drop to a NBI condition code of 7 faster than other districts. Among other factors, this could be due to more frequent de-icing chemical applications in the metro area. It is also likely due to the fact that other districts started crack sealing their decks earlier than Metro District. The other districts sometimes reapply these sealants more frequently likely because they have better access due lower ADT and the absence of middle lanes. The middle lane is difficult to access

present, the overall deck NBI condition code is lower than if the entire deck is sealed. Separate deterioration tables were created for Metro District.
One last item considered was the presence of a concrete overlay. As noted above, when considering the total set of bridges with their original decks, bridges with a concrete overlay appear to deteriorate faster than bridges without a concrete overlay. When we broke the bridges out between the Metro District and all other districts, bridges built during or after 1990 outside of Metro District still appear to deteriorate faster with a concrete overlay than without. (Because most bridges in Metro District have a concrete overlay, limited data was available on bridges in Metro District without a concrete overlay.) This could be for two reasons. We looked at the average year built on all bridges outside of Metro District built after 1990 with and without a concrete overlay. The average year built for bridges with a concrete overlay outside of Metro District is 2001. The average year built for bridges without a concrete overlay outside of Metro District is 1997. More inspection data is available for bridges without a concrete overlay which could be increasing the average number of years at a NBI condition code of 8. Bridges with a concrete overlay could potentially still be an 8, but haven’t been an 8 for more than 9 years and are therefore not being shown in our tables. Another reason why bridges with a concrete overlay could be dropping to a NBI condition code of 7 faster is because of cracks that could have formed in the overlay soon after placement. Previously concrete overlays were placed on a dry deck to enhance bonding, but this likely caused differential shrinkage. Within the past 5 years, the concrete overlays are now placed on a pre-wet deck to limit the differential shrinkage. Separate deterioration tables for bridges with and without a concrete overlay were not created because the difference in consideration is only a couple of years. Separate deterioration tables may be considered in the future when enough data is available to show that a bridge with a concrete overlay takes longer time to drop to a NBI condition code of a 5, than a bridge without a concrete overlay.
One item MnDOT wanted information on was how many years a bridge typically stays at a NBI condition code of 5 or 4. Less than 20 bridges built after 1975 have data at a NBI condition code greater than 9 years. With such a small sampling, this data wasn’t deemed to be an accurate representation of how long a bridge can last at a condition code of 5. Bridges built before 1975 did have some information on how long a bridge can last at a NBI condition code of 5, but we found that bridges rarely get down to a NBI condition code of 4. Out of about 49 500 inspection records for all 2621 bridges, less than 5% of the bridges (2% of the inspection records) had a condition code of 4. It appears that MnDOT typically repairs the decks before they become structurally deficient.
In summary:
• Bridge with epoxy coated rebar and increased cover perform the best • Overlays are likely beneficial but early age cracking drops the condition code so they do
not stand out in the data as much as anticipated • Early and regular crack sealing and deck flushing reduces deterioration based on a
comparison of the Metro and Outstate Districts (Metro District has access limitations due to ADT and roadway widths)
38

• Current deck policies are expected to perform well, but a longer condition history is needed to show the true performance of concrete overlays and epoxy coated rebar in the top and bottom mat of the decks.
5.2 Deterioration Tables
Six different deck deterioration tables were created and are recommended to be used for long-range planning. Some of the condition curves shown earlier in this report were combined due to similar performance. The largest factors affecting deck deterioration are presence of epoxy coated bars, amount of cover to top mat of reinforcement and whether the bridge is located inside or outside of Metro District. Instead of stating exact policy change (i.e. location of epoxy coated bar and amount of cover) year built is provided under the tables for clarity and ease of use. All tables, unless noted differently, are for bridges with and without a concrete overlay and for all ADT categories.
Table 5.1: Deck Deterioration Table for the Metro District Bridges Built During and After 1990; and Bridges Outside of the Metro District Built During and After 1990 with ADT Greater than 10K
Deck NBI Condition
Code
Years at NBI Condition
Code
Deck Age when NBI Reached
9 3 0 8 3 3 7 13 6 6 19
Table 5.2: Deck Deterioration Table for Bridges Outside of the Metro District Built During and After 1990 with ADT Equal to or Less than 10K
Deck NBI Condition
Code
Years at NBI Condition
Code
Deck Age when NBI Reached
9 5 0 8 6 5 7 14 11 6 25
39

Table 5.3: Deck Deterioration Table for the Metro District Bridges Built Between 1975 and 1989 with Epoxy Coated Top Bars
Deck NBI Condition
Code
Years at NBI Condition
Code
Deck Age when NBI Reached
9 2 0 8 6 2 7 18 8 6 11 26 5 37
Table 5.4: Deck Deterioration Table for Bridges Outside of the Metro District Built Between 1975 and 1989 with Epoxy Coated Top Bars
Deck NBI Condition
Code
Years at NBI Condition
Code
Deck Age when NBI Reached
9 2 0 8 12 2 7 17 14 6 17 31 5 48
Table 5.5: Deck Deterioration Table for All Bridges Built Between 1975 and 1989 without Epoxy Coated Bars
Deck NBI Condition
Code
Years at NBI Condition
Code
Deck Age when NBI Reached
9 0 0 8 13 0 7 12 13 6 12 25 5 37
40
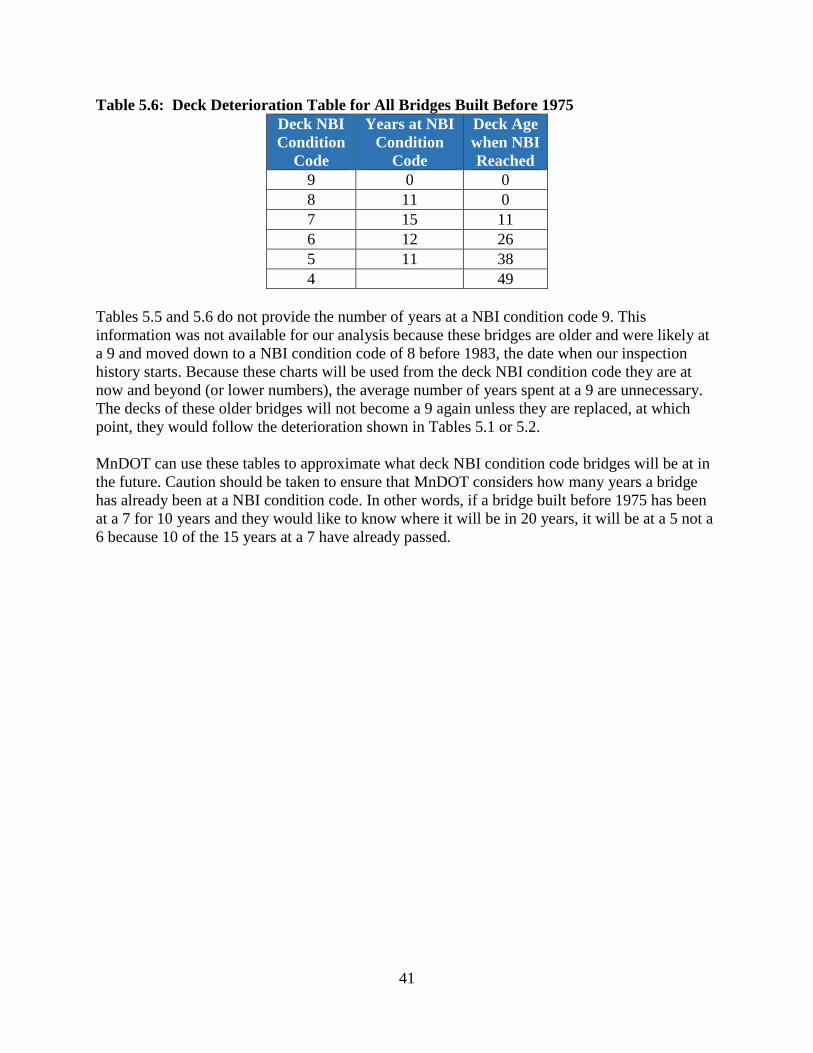
Table 5.6: Deck Deterioration Table for All Bridges Built Before 1975 Deck NBI Condition
Code
Years at NBI Condition
Code
Deck Age when NBI Reached
9 0 0 8 11 0 7 15 11 6 12 26 5 11 38 4 49
Tables 5.5 and 5.6 do not provide the number of years at a NBI condition code 9. This information was not available for our analysis because these bridges are older and were likely at a 9 and moved down to a NBI condition code of 8 before 1983, the date when our inspection history starts. Because these charts will be used from the deck NBI condition code they are at now and beyond (or lower numbers), the average number of years spent at a 9 are unnecessary. The decks of these older bridges will not become a 9 again unless they are replaced, at which point, they would follow the deterioration shown in Tables 5.1 or 5.2.
MnDOT can use these tables to approximate what deck NBI condition code bridges will be at in the future. Caution should be taken to ensure that MnDOT considers how many years a bridge has already been at a NBI condition code. In other words, if a bridge built before 1975 has been at a 7 for 10 years and they would like to know where it will be in 20 years, it will be at a 5 not a 6 because 10 of the 15 years at a 7 have already passed.
41
Chapter 6. Data Maintenance and Further Study
6.1 Data Maintenance
The data should be maintained on a cycle not to exceed 4 years. We would expect the number of years for the NBI condition codes at the end of each curve to increase and we would also expect additional NBI condition codes to start adding on to the end of the curves. For example, for bridges built during and after 1990, we would anticipate the number of years at a NBI condition code of 8 and 7 to increase beyond 5 and 15 years, respectively. Also, we would expect a NBI condition code of 6 to be added onto the table as data becomes available. Similarly, for bridges built between 1975 and 1989, the number of years at 7 and 6 may increase and likely data on years at a code of 5 will become available.
To maintain the data, MnDOT can copy the new inspection records for each year into the “all inspection data” tab of the spreadsheet. Once this is completed, the tab should be sorted by the BRKEY and all formulas in Columns K through U can be copied down. Afterwards, follow the steps in the last three paragraphs of Section 4.1 to update the columns called “No. Yrs. 9” through “No. Yrs. 3” in the “Main Data” tab of the spreadsheet.
Once the data in the “Main Data” tab is updated, columns can be filtered to determine the updated average number of years at each NBI condition code for each category shown in Table 4.3 and 4.11. Based on what is found, the tables provided in Section 5.2 can either be revised or remain as-is.
6.2 Further Study
As years go by and as funding is available, different items could be analyzed and added to this study or improve upon this study. For one thing, MnDOT is experimenting with different concrete mixes for decks and different types of overlays. As more inspection data is available on high performance decks and epoxy chip seal overlays, these items could be analyzed.
In addition certain structural element condition codes could be analyzed. Specifically, element 358 and 359 represent the amount of cracking on the top side and underside of the deck, respectively. The codes for these elements are updated during the annual or bi-annual inspection. These codes could be tracked similarly to the NBI condition codes to see if they provide different deck deterioration rates.
Another option which could be considered is maintenance records. The amount of maintenance records is vast and would be time-consuming to process. If one district is known to out-perform other districts, possibly that district could be looked at specifically to determine if they appear to provide better or more consistent maintenance to their bridges. The master spreadsheet provided with this study could be used to determine if one district has higher average number of years at NBI condition codes of 8 or 9.
42

Deck materials, traffic counts, and de-icing materials are constantly improving. As inspection history becomes available on any of these items and others, studies can be completed to determine their performance.
43
Appendix A
MnDOT Bridge Office Deck Policies and their Approximate Revision Dates

MnDOT Bridge Office Deck Policies and their Approximate Revision Dates
As provided by MnDOT
In the 1960’s early deck deterioration was found throughout the country. This likely was a result of the heavy use of de-icing materials to keep the road clear of ice and a result of using non-waterproof joints. Below are some of the policies MnDOT implemented through the direction of the FHWA to extend the life of concrete bridge decks.
Concrete Overlays The first concrete overlays were applied to existing bridge decks in 1974 (2 applications). In 1975 19 existing bridges were overlaid.
In 1976 overlays were placed on new bridges for the first time. Starting in approximately July of 1996, the ADT above which a concrete overlay is required was reduced from 10 000 to 2000.
Epoxy Coated Rebars MnDOT’s use of epoxy coated rebars in the deck and railing began in 1973.
All bridges let after November 21, 1986 with a High Traffic Volume and a Heavy Application of De-Icers, were to have both top and bottom mats of reinforcement epoxy coated.
The policy for all bridges let on or after June 23, 1989 stated: “All reinforcement bars for bridges, except for those which are entirely embedded in footings, shall be epoxy coated.” In November of 1990 this was clarified to also include concrete retaining walls.
Prior to January 1, 1992, the specification for the thickness of the epoxy coating on rebars was 512 mils, per AASHTO M 284. After January 1, 1992, the requirement was changed to 8-12 mils.
Concrete Deck Mix Design Through the mid 1970’s MnDOT used a 3Y mix. In the mid 1970’s, MnDOT switched to a 3X33 or 3X36 mix design. Due to transverse cracking problems with the 3X mix, plans completed after April 30, 1991 were to be designed using a 3Y33 or 3Y36 concrete deck mix design with a minimum cement content of 611 pounds.
Rebar Top Cover Prior to 1969, bridge decks were likely designed with 1 ½ inches of top cover. From 1969 to the mid 1970’s, the top cover was increased to 2 inches for most deck designs
However, starting in 1970, some bridges were specified to have 2 ½ inches of cover to the top transverse bar, which normally had a #3 longitudinal bar above the transverse bar.
Starting in approximately 1975, all decks were designed with 3 inches of top cover.
A-1