detector needs for direct spectroscopic biosignature ... needs for direct spectroscopic biosignature...
TRANSCRIPT

NASA Goddard
Detector Needs for Direct Spectroscopic Biosignature Characterization
Bernard J. Rauscher NASA Goddard Space Flight Center
Presented at SPIE Optics + Photonics UV/Optical/IR Space Telescopes and Instruments: Innovative Technologies and Concepts VII
Paper 9602-129 August 2015, San Diego, CA USA 1

NASA Goddard
Presented at SPIE Optics + Photonics UV/Optical/IR Space Telescopes and Instruments: Innovative Technologies and Concepts VII
Paper 9602-129 August 2015, San Diego, CA USA 2
Green = Necessary for life; Red = Biosignature; Blue = Helps to rule out false positives
Biosignatures in the Visible and Near-IR
Spectrum from Turnbull et al. 2006, ApJ, 644, 55114Green = Necessary for life; Red = Biosignature; Blue = Helps to rule out false positives
Minimum Requirements1. Rocky planet2. H2O in green (one good detection will do)3. Primary biosignatures in red (don’t need
them all)4. Confirming biosignatures are in blue
(methane very important)
Biosignatures in the Visible and Near-IRwe can separate these spectra. The presence of cumulus cloudssuggests an active troposphere, with convective upwelling anddown-welling, and the existence of weather patterns that mightbe detected with long-term observations.
Finally, we note that the vegetation signal did not appear tobe present at a detectable level in these data. This is perhaps sur-prising, given the view of Earth shown in Figure 2. As mentionedin x 1, the vegetation signal is represented by a sharp increase inreflectivity redward of 0.72 !m, and the optical data presentedin Paper I appear to show this feature. However, plant reflectancefalls off again in the near-infrared due to liquid water vibrationalabsorption features (see Clark 1999). In fact, the near-infraredspectrum of plants is very similar to that of clouds, which mayexplain why we were not able to clearly identify it in our data. At!0.7 !m, where we would expect to see the vegetation ‘‘jump,’’the signal-to-noise ratio of our data was very low, and we cannotclaim any clear contribution from plants to our near-infraredearthshine spectrum.
4. CONCLUSIONS AND FUTURE WORK
In Figure 7, we present the combined data from Paper I andthe new observations presented here. The optical data have beensmoothed to match the resolution of the near-infrared data, andthe two data sets were merged at 0.8 !m. The entire data set wasthen normalized to 1.0 at 0.5 !m. At these wavelengths, ourworld is spectrally distinct from Venus and Mars (Traub 2003;Mustard & Bell 1994; Klassen et al. 1999), the gas giant planets(Fink & Larson 1979), and their satellites (Carlson et al. 1996;Cruikshank et al. 2005).What can we say about the Earth, basedon these data? First, from the strong water bands, we would con-fidently conclude that Earth is a habitable planet. Furthermore,the simultaneous detection of methane and abundant oxygen isstrongly suggestive of either biological activity or some unusualatmospheric or geological process that can sustain large amountsof atmospheric oxygen in the presence of reduced gases (e.g., a‘‘runaway greenhouse’’ situation as described by Kasting et al.[1993] could generate a large oxygen signal, but only for a shortperiod of time). From the clear-air and cloud fractions requiredin our model to fit the data, we would also conclude that theplanet has a dynamic atmosphere. Thus, the spectral albedo couldbe expected to show slight changes with time, and with long-termmonitoring we may be able to deduce the planet’s timescale forweather patterns. We could also expect to see periodic changesdue to planet rotation if the surface has strong nonuniformities,and we could hope to constrain continental and ocean cover, per-haps even mineral types or hints of pigments in widespreadphotosynthetic organisms.
Given these conclusions, it is advisable to consider endowingthe TPF-C mission with the capability of working in the near-infrared. This would place an additional burden on the mission,in terms of a detector and spectrometer, and it would not be pos-sible to reach as close to the star as would be desired in all cases,owing to the diffraction limitation of a few times k /D of mostcoronagraphs (whereD is the diameter of the telescope). Further-more, the decreasing planetary reflectance at these wavelengthsmay lengthen exposure times for detection. A thorough assess-ment of the observations that would be possible at near-infraredwavelengths, with various choices of coronagraph and for starsin the solar neighborhood, would tell whether it is worthwhileto have a near-infrared capability on TPF-C.
Two lines of observational work that need a better under-standing for interpreting earthshine data are (1) a more rigorousstudy of the scattered-light sky spectrum and the way in which it
changes with position relative to the bright Moon and (2) a bet-ter understanding of the spectra of different types of clouds.In terms of validating models that reconstruct the Earth based
on its spectrum, we need to know, what is the full range of pa-rameters, in terms of cloud types, cloud heights, atmosphericwater content, abundances of other gaseous components, and sur-face compositions, that will generate a satisfactory fit to the data,within the observational uncertainties? It is important to clearlymap out the degeneracies between the different components ofour models, so that we can understand the likelihood that a givenmodel reflects reality when we begin to characterize extrasolarplanets.Many other insights could result from the study of how the
Earth’s spectrum changes over time. For example, periodic changesdue to planet rotation could be used to create a map of fractionalland and ocean area as a function of longitude (see Ford et al.2001). We must also ask, how much does cloud cover wash outspectral signatures of the surface? Seasonal changes, and evenchanges associated with atmospheric chemistry in response tothe Solar transient events and cycles, are interesting topics thatmay be relevant to the interpretation of terrestrial exoplanetspectra and would also contribute to our understanding of theEarth-Sun system. A long-term earthshine monitoring campaign,covering all longitudes and seasons, would be a crucial part ofpreparing for the launch of TPF-C. However, if such a campaignrequires contributions from multiple observatories, great caremust be taken to account for different instrumental and localatmospheric effects before we can confidently interpret the spec-trum of our planet’s many faces.
We thank Lisa Kaltenegger and Sara Seager for comments onthe manuscript. This work was supported in part by NASA grantNAG5-13045 (W. T.). M. C. T. was supported by a postdoctoralfellowship from the NASA Astrobiology Institute and the Na-tional Research Council. M. C. T. also thanks J. Lunine for sup-port of this work, as well as J. Kasting, P. Montanes-Rodriguez,and G. Tinetti for sharing their insights. We are grateful toC. Corbally, S. J., of the Vatican Observatory, and to M. Nelsonfor their help with 1.8 m VATT operations. We would also liketo thank the anonymous referee for several helpful suggestions.
Fig. 7.—Earth’s observed reflectance spectrum, at visible and near-infraredwavelengths, created from a composite of the data in this paper (0.8–2.4 !m)and the data presented in Paper I (0.5–0.8 !m). The strongest molecular signaturesare indicated, as are the wavelengths where Rayleigh scattering and vegetationreflection are most significant.
TURNBULL ET AL.558 Vol. 644
Spectrum from Turnbull et al. 2006, ApJ, 644, 551
VRE

NASA Goddard
Presented at SPIE Optics + Photonics UV/Optical/IR Space Telescopes and Instruments: Innovative Technologies and Concepts VII
Paper 9602-129 August 2015, San Diego, CA USA 3
• Toy model assumes a perfect coronagraph• Assumptions
• Background flux is (very roughly)≲ 0.001 cnt/s/pix!
• Realistic scattered light increases background somewhat, but we want detectors that can take advantage of the best coronagraph or starshade that we can get!
• An SPD is clearly preferred
• More realistic models reach the same conclusion, a SPD is clearly preferred to maximize ExoEarth yields using a coronagraph and IFU spectrograph (Stark, Roberge, & Mandell, et al. 2015, ApJ, 808, 149)
NASA Goddard
Presented at SPIE Optics + Photonics UV/Optical/IR Space Telescopes and Instruments: Innovative Technologies and Concepts VII
Paper 9602-129 August 2015, San Diego, CA USA 4
Coronagraph Detectors
1 AU
10 pc
A Single Photon Detector1 (SPD) is Clearly Preferred for Spectroscopic Biosignature Characterization
1 AU
10 pc
our zodi
their zodi = 2×
our zodi
Earth Twin at 10 pc
0.1 arcsec
! 25% efficient IFU spectrograph
! pixel size = 0.7 ×1.22 %critD
! % = 550 nm
! R = %Δ%
= 150
! Background = 3× zodi
1 Better than photon counting, an SPD counts individual photons without adding appreciable noise from any other sourceNASA Goddard

NASA Goddard
Presented at SPIE Optics + Photonics UV/Optical/IR Space Telescopes and Instruments: Innovative Technologies and Concepts VII
Paper 9602-129 August 2015, San Diego, CA USA 4
How Detector Noise Affects ExoEarth Yield
expect the characterization coronagraph’s contrast to be at leastas important as the detection coronagraph’s contrast.
The bottom left panel in Figure 8 shows the yield as afunction of the systematic noise floor. The systematic noisefloor is plotted as the “limiting magnitude,” or the difference inmagnitudes between the star and the dimmest planet that can bedetected at the desired threshold S/N. As shown in Stark et al.(2014), if one’s goal is to find Earth twins, there is no benefit toobserving planets fainter than 26.5 mag dimmer than theirhost star.
The bottom middle panels in Figure 8 show the yield as afunction of throughput and bandwidth. These two quantities aremathematically equivalent in the detection exposure timeequation, so we may expect them to have identical sensitivities.However, under our current assumptions, the throughputfactors into both detection time and characterization time,whereas the bandwidth only factors into detection time. Thedependence of yield on throughput is roughly equal to that oftotal exposure time, as expected since they both control thenumber of photons collected within the mission lifetime. Thepriority rank selection effect previously discussed produces themodest dependence on both of these parameters. We note thatin reality, bandwidth will affect the wavefront controloverheads (which we do not model in this paper) and thusindirectly affect the spectral characterization time.
Finally, the lower-right panel shows the yield as a functionof the planet’s PSF areal broadening factor, b. Again, we findthe same moderately weak dependence: yield is b(1 )0.33µ . Asshown by Equations (7)–(15) in Stark et al. (2014), in thebackground-limited regime in which the planet’s count rate ismuch less than the background count rate, exposure time isinversely proportional to both throughput and (1 )W . Adoubling of the planet’s PSF size will roughly reduce the yieldby ∼25%.
Figure 9 shows the yield as a function of the detector noisecount rates. We have not included ϕ values in these plots as weassumed noiseless detectors for the baseline mission. For thedetection coronagraph, detector noise count rates0.06 counts s−1 decrease the yield by >5%. For the character-ization coronagraph, detector noise count rates 0.5 counts s−1
decrease the yield by >5%. Clearly the yield depends morestrongly on the noise count rate of the detection coronagraph.
However, this does not necessarily mean that the required readnoise and dark current of the detection coronagraph’s detectorare lower.To translate the above count rates into combinations of read
noise and dark current (RN, ξ), we use Equation (2) andassume values for τexpose and npix. We assume the length of anindividual exposure τexpose = 1000 s to allow for the removalof cosmic ray artifacts. The number of pixels over which theplanet’s photometric aperture is spread, npix, depends on theoptical layout of the instrument.For detection, we imagine three types of instruments that
could be used: a simple imager (assuming spectral informationis not needed for wavefront control), an imager with afrequency-resolving detector, and an integral fieldspectrograph (IFS). If the detection coronagraph is a simpleimager or is frequency-resolving, the planet’s photometricaperture would be spread over ∼4 pixels assuming imperfectcentering and Nyquist sampling of the PSF. If the detectioncoronagraph is an IFS, then the planet’s photometric aperturewould be spread over 4 lenslets, each of which is dispersedonto 6 pixels (2 in the frequency domain and 3 in the spatialdomain) per spectral channel. Assuming R = 50, such thatthere are 10 spectral channels over the 20% detection bandpass,the IFS would spread the planet’s photometric aperture over240 pixels.For spectral characterization, we imagine two types of
instruments: an imager with energy-resolving detector and anIFS. Similar to a broadband detection, the planet’s photometricaperture would be spread over 4 pixels for each spectralchannel in an energy-resolving detector. As discussed pre-viously, the IFS would spread the planet’s photometric apertureover 24 pixels per spectral channel (4 lenslets, 6 pixels perlenslet).Figure 10 shows the fraction of the yield realized for
different instruments. The left panels show the impact ofdetector noise on yield for the V band detectioncoronagraph only. The right panels show the impact of detectornoise on yield for the 1 μm characterization coronagraph only.These curves were created by interpolating the yield curvesfrom Figure 9 and adopting the values of npix described above.They were calculated without any exposure time limitationsdue to stability requirements or motion of the observed planet.
Figure 9. ExoEarth candidate yield as a function of detector noise count rates.
10
The Astrophysical Journal, 808:149 (16pp), 2015 August 1 Stark et al.
Credit: Stark, Roberge, & Mandell, et al. 2015, ApJ, 808, 149

NASA Goddard
Presented at SPIE Optics + Photonics UV/Optical/IR Space Telescopes and Instruments: Innovative Technologies and Concepts VII
Paper 9602-129 August 2015, San Diego, CA USA 5
Technology Component Parameter Required State-of-the-Art Current
TRL
Technology, Engineering,
Manufacturing Gap
Vis-NIR Single Photon Detectors for Enabling
Exoplanet Science
Operational Bandwidth
400 nm – 1.8 µm (2.5 µm goal)
EMCCD technology is promising, but require radiation hardness testing, and have a hard cutoff at 1.1 µm; HgCdTe APDs are candidates for NIR but need improvements in dark counts rates; Superconducting MKID and TES detectors meet requirements, but need cryogenic temperatures
3 – 5 Technology, Engineering,
Manufacturing
Read Noise << 1 e− Dark Current < 0.001 e−/pix/s Spurious Count Rate
Small compared to integrated dark current
Quantum Efficiency > 80% over entire band
Format > 2k × 2k pixels
Other
Radiation hard, minimum 5-year lifetime at SEL2, Non-cryogenic operation preferable
UV Single Photon Detectors for Enhanced
Exoplanet Science
Operational Bandwidth 200 nm – 400 nm
GaN-based EBCMOS and MCP detectors meet required noise specifications, but require improvements in quantum efficiency to > 50% and improvements in lifetime Superconducting MKID and TES detectors also apply here
2 – 4 Technology, Engineering,
Manufacturing
Read Noise << 1 e− Dark Current < 0.001 e−/pix/s Spurious Count Rate
Small compared to integrated dark current
Quantum Efficiency > 50% over the entire band
Format > 2k × 2k pixels
Other
Radiation hard, minimum 5-year lifetime at SEL2, Non-cryogenic operation preferable
Large-format High-Sensitivity UV
Detectors for General Astrophysics
Operational Bandwidth 90 nm – 300 nm
Same as above δ-doped EMCCD also a candidate here, but requires improved radiation hardness and reduction in clock-induced charge
4 Engineering, Manufacturing
Read Noise < 5 e− Quantum Efficiency > 70%
Format > 2k × 2k pixels
Other
Radiation hard, minimum lifetime at SEL2, Non-cryogenic operation preferable, Visible blind
ATLAST’s Detector “Technology Gap” Analysis
From Bolcar, M.R. 2015, “Technology Development for the Advanced Technology Large Aperture Space Telescope (ATLAST) as a Candidate Large UV-Optical-Infrared (LUVOIR) Surveyor”, Proc SPIE (this conference), Paper 9602-8
MKID and TES detectos are energy resolving. For these, the required spectral resolution is R > 70 with a goal of R > 150

NASA Goddard
Presented at SPIE Optics + Photonics UV/Optical/IR Space Telescopes and Instruments: Innovative Technologies and Concepts VII
Paper 9602-129 August 2015, San Diego, CA USA 6
Candidate Detector Technologies forExoEarth Identification and Characterization
• Imaging used for candidate identification • Spectroscopy used for biosignature characterization • This table is a work in progress, additions welcome if NASA TRL ≥ 3, corrections welcome
Technology Imaging Spec. Imaging Spec. Imaging Spec. WFSG1 Speckle Nulling Imaging Spec. Imaging Spec.Electron-bombarded CMOS
Testing needed Testing needed
Microchannel Plate Detectors
Brightness limits; Low QE; Finite Lifetime
Brightness limits; Low QE; Finite Lifetime
CCD (δ-doped) Rad. hardnessCMOS (δ-doped)EMCCD (δ-doped)
Rad. hardness Rad. hardness Rad. hardness
p-channel CCD (δ-doped)Si PIN Hybrid (δ-doped)Wide Bandgap Hybrid
TRL < 4 TRL < 4 TRL < 4 TRL < 4
CCD Rad. hardness Rad. hardnessCMOS Testing needed Testing neededEMCCD Rad. hardness Rad. hardness Rad. hardness Rad. hardnessp-channel CCD TRL ≥ 6 TRL ≥ 6Si PIN Hybrid TRL ≥ 6 TRL ≥ 6HgCdTe Hybrid TRL ≥ 6 TRL ≥ 6 TRL ≥ 6HgCdTe APD Hybrid
Reduce dark current
Reduce dark current
Testing needed Testing needed Reduce dark current
Reduce dark current
HgCdTe HybridMKID array TRL < 5 TRL < 5 TRL < 5 TRL < 5 TRL < 5 TRL < 5 TRL < 5 TRL < 5 TRL < 5 TRL < 5 TRL < 5 TRL < 5TES array TRL < 5 TRL < 5 TRL < 5 TRL < 5 TRL < 5 TRL < 5 TRL < 5 TRL < 5 TRL < 5 TRL < 5 TRL < 5 TRL < 5SNSPD Reduce dark
currentReduce dark
currentReduce dark
currentReduce dark
currentReduce dark
currentReduce dark
currentReduce dark
currentReduce dark
currentReduce dark
currentReduce dark
currentReduce dark
currentReduce dark
current
Si:As Hybrid TRL ≥ 61 Wavefront sensing/guiding
TRL ≥ 6; Sufficiently mature for pre Phase-APromising technology, more work needed in specific areasPromising technologyCryocooler required
Mid-IR5 µm — 8 µm (TBC)
Far UV90 (TBC) — 200 nm
Near-UV200 — 350 nm
Near-IR950 nm — 5 µm
Visible350 — 950 nm

NASA Goddard
Presented at SPIE Optics + Photonics UV/Optical/IR Space Telescopes and Instruments: Innovative Technologies and Concepts VII
Paper 9602-129 August 2015, San Diego, CA USA 7
For Spectroscopic Characterization,more Detector Candidates would be Good
• Non-cryogenic detectors are strongly preferred by coronagraph optics experts if they can meet performance requirements
• Yellow indicates that I am not aware of any fundamental reason why the read noise could not be further reduced with targeted development
Visible Near-IR Mid-IRTechnology 350 — 950 nm 950 nm — 5 µm 5 µm — 8 µm
CCD Rad. hardnessCMOSEMCCD Rad. hardnessp-channel CCDSi PIN HybridHgCdTe HybridHgCdTe APD Hybrid Reduce dark current Reduce dark currentMKID array TRL < 5 TRL < 5 TRL < 5TES array TRL < 5 TRL < 5 TRL < 5
SNSPD Reduce dark current
Reduce dark current
Reduce dark current
Si:As Hybrid
TRL ≥ 6; Sufficiently mature for pre Phase-APromising technology, more work needed in specific areasPromising technologyCryocooler requiredMay be worth looking into with additional optimization
Cryogenic detectors

NASA Goddard
Presented at SPIE Optics + Photonics UV/Optical/IR Space Telescopes and Instruments: Innovative Technologies and Concepts VII
Paper 9602-129 August 2015, San Diego, CA USA 8
δ-doped Si + AR coating
100 1000500200 2000300150 15007000.0
0.2
0.4
0.6
0.8
1.0
Wavelength HnmL
QE
Achieved & Proposed QE vs. Wavelength and Life Signatureswecanseparatethesespectra.Thepresenceofcumuluscloudssuggestsanactivetroposphere,withconvectiveupwellinganddown-welling,andtheexistenceofweatherpatternsthatmightbedetectedwithlong-termobservations.
Finally,wenotethatthevegetationsignaldidnotappeartobepresentatadetectablelevelinthesedata.Thisisperhapssur-prising,giventheviewofEarthshowninFigure2.Asmentionedinx1,thevegetationsignalisrepresentedbyasharpincreaseinreflectivityredwardof0.72!m,andtheopticaldatapresentedinPaperIappeartoshowthisfeature.However,plantreflectancefallsoffagaininthenear-infraredduetoliquidwatervibrationalabsorptionfeatures(seeClark1999).Infact,thenear-infraredspectrumofplantsisverysimilartothatofclouds,whichmayexplainwhywewerenotabletoclearlyidentifyitinourdata.At!0.7!m,wherewewouldexpecttoseethevegetation‘‘jump,’’thesignal-to-noiseratioofourdatawasverylow,andwecannotclaimanyclearcontributionfromplantstoournear-infraredearthshinespectrum.
4.CONCLUSIONSANDFUTUREWORK
InFigure7,wepresentthecombineddatafromPaperIandthenewobservationspresentedhere.Theopticaldatahavebeensmoothedtomatchtheresolutionofthenear-infrareddata,andthetwodatasetsweremergedat0.8!m.Theentiredatasetwasthennormalizedto1.0at0.5!m.Atthesewavelengths,ourworldisspectrallydistinctfromVenusandMars(Traub2003;Mustard&Bell1994;Klassenetal.1999),thegasgiantplanets(Fink&Larson1979),andtheirsatellites(Carlsonetal.1996;Cruikshanketal.2005).WhatcanwesayabouttheEarth,basedonthesedata?First,fromthestrongwaterbands,wewouldcon-fidentlyconcludethatEarthisahabitableplanet.Furthermore,thesimultaneousdetectionofmethaneandabundantoxygenisstronglysuggestiveofeitherbiologicalactivityorsomeunusualatmosphericorgeologicalprocessthatcansustainlargeamountsofatmosphericoxygeninthepresenceofreducedgases(e.g.,a‘‘runawaygreenhouse’’situationasdescribedbyKastingetal.[1993]couldgeneratealargeoxygensignal,butonlyforashortperiodoftime).Fromtheclear-airandcloudfractionsrequiredinourmodeltofitthedata,wewouldalsoconcludethattheplanethasadynamicatmosphere.Thus,thespectralalbedocouldbeexpectedtoshowslightchangeswithtime,andwithlong-termmonitoringwemaybeabletodeducetheplanet’stimescaleforweatherpatterns.Wecouldalsoexpecttoseeperiodicchangesduetoplanetrotationifthesurfacehasstrongnonuniformities,andwecouldhopetoconstraincontinentalandoceancover,per-hapsevenmineraltypesorhintsofpigmentsinwidespreadphotosyntheticorganisms.
Giventheseconclusions,itisadvisabletoconsiderendowingtheTPF-Cmissionwiththecapabilityofworkinginthenear-infrared.Thiswouldplaceanadditionalburdenonthemission,intermsofadetectorandspectrometer,anditwouldnotbepos-sibletoreachasclosetothestaraswouldbedesiredinallcases,owingtothediffractionlimitationofafewtimesk/Dofmostcoronagraphs(whereDisthediameterofthetelescope).Further-more,thedecreasingplanetaryreflectanceatthesewavelengthsmaylengthenexposuretimesfordetection.Athoroughassess-mentoftheobservationsthatwouldbepossibleatnear-infraredwavelengths,withvariouschoicesofcoronagraphandforstarsinthesolarneighborhood,wouldtellwhetheritisworthwhiletohaveanear-infraredcapabilityonTPF-C.
Twolinesofobservationalworkthatneedabetterunder-standingforinterpretingearthshinedataare(1)amorerigorousstudyofthescattered-lightskyspectrumandthewayinwhichit
changeswithpositionrelativetothebrightMoonand(2)abet-terunderstandingofthespectraofdifferenttypesofclouds.
IntermsofvalidatingmodelsthatreconstructtheEarthbasedonitsspectrum,weneedtoknow,whatisthefullrangeofpa-rameters,intermsofcloudtypes,cloudheights,atmosphericwatercontent,abundancesofothergaseouscomponents,andsur-facecompositions,thatwillgenerateasatisfactoryfittothedata,withintheobservationaluncertainties?Itisimportanttoclearlymapoutthedegeneraciesbetweenthedifferentcomponentsofourmodels,sothatwecanunderstandthelikelihoodthatagivenmodelreflectsrealitywhenwebegintocharacterizeextrasolarplanets.
ManyotherinsightscouldresultfromthestudyofhowtheEarth’sspectrumchangesovertime.Forexample,periodicchangesduetoplanetrotationcouldbeusedtocreateamapoffractionallandandoceanareaasafunctionoflongitude(seeFordetal.2001).Wemustalsoask,howmuchdoescloudcoverwashoutspectralsignaturesofthesurface?Seasonalchanges,andevenchangesassociatedwithatmosphericchemistryinresponsetotheSolartransienteventsandcycles,areinterestingtopicsthatmayberelevanttotheinterpretationofterrestrialexoplanetspectraandwouldalsocontributetoourunderstandingoftheEarth-Sunsystem.Along-termearthshinemonitoringcampaign,coveringalllongitudesandseasons,wouldbeacrucialpartofpreparingforthelaunchofTPF-C.However,ifsuchacampaignrequirescontributionsfrommultipleobservatories,greatcaremustbetakentoaccountfordifferentinstrumentalandlocalatmosphericeffectsbeforewecanconfidentlyinterpretthespec-trumofourplanet’smanyfaces.
WethankLisaKalteneggerandSaraSeagerforcommentsonthemanuscript.ThisworkwassupportedinpartbyNASAgrantNAG5-13045(W.T.).M.C.T.wassupportedbyapostdoctoralfellowshipfromtheNASAAstrobiologyInstituteandtheNa-tionalResearchCouncil.M.C.T.alsothanksJ.Lunineforsup-portofthiswork,aswellasJ.Kasting,P.Montanes-Rodriguez,andG.Tinettiforsharingtheirinsights.WearegratefultoC.Corbally,S.J.,oftheVaticanObservatory,andtoM.Nelsonfortheirhelpwith1.8mVATToperations.Wewouldalsoliketothanktheanonymousrefereeforseveralhelpfulsuggestions.
Fig.7.—Earth’sobservedreflectancespectrum,atvisibleandnear-infraredwavelengths,createdfromacompositeofthedatainthispaper(0.8–2.4!m)andthedatapresentedinPaperI(0.5–0.8!m).Thestrongestmolecularsignaturesareindicated,asarethewavelengthswhereRayleighscatteringandvegetationreflectionaremostsignificant.
TURNBULLETAL. 558Vol.644
O3 260 nm
GaNphotocathode
GaN + KBrphotocathode
AR coated Si
we can separate these spectra. The presence of cumulus cloudssuggests an active troposphere, with convective upwelling anddown-welling, and the existence of weather patterns that mightbe detected with long-term observations.
Finally, we note that the vegetation signal did not appear tobe present at a detectable level in these data. This is perhaps sur-prising, given the view of Earth shown in Figure 2. As mentionedin x 1, the vegetation signal is represented by a sharp increase inreflectivity redward of 0.72 !m, and the optical data presentedin Paper I appear to show this feature. However, plant reflectancefalls off again in the near-infrared due to liquid water vibrationalabsorption features (see Clark 1999). In fact, the near-infraredspectrum of plants is very similar to that of clouds, which mayexplain why we were not able to clearly identify it in our data. At!0.7 !m, where we would expect to see the vegetation ‘‘jump,’’the signal-to-noise ratio of our data was very low, and we cannotclaim any clear contribution from plants to our near-infraredearthshine spectrum.
4. CONCLUSIONS AND FUTURE WORK
In Figure 7, we present the combined data from Paper I andthe new observations presented here. The optical data have beensmoothed to match the resolution of the near-infrared data, andthe two data sets were merged at 0.8 !m. The entire data set wasthen normalized to 1.0 at 0.5 !m. At these wavelengths, ourworld is spectrally distinct from Venus and Mars (Traub 2003;Mustard & Bell 1994; Klassen et al. 1999), the gas giant planets(Fink & Larson 1979), and their satellites (Carlson et al. 1996;Cruikshank et al. 2005).What can we say about the Earth, basedon these data? First, from the strong water bands, we would con-fidently conclude that Earth is a habitable planet. Furthermore,the simultaneous detection of methane and abundant oxygen isstrongly suggestive of either biological activity or some unusualatmospheric or geological process that can sustain large amountsof atmospheric oxygen in the presence of reduced gases (e.g., a‘‘runaway greenhouse’’ situation as described by Kasting et al.[1993] could generate a large oxygen signal, but only for a shortperiod of time). From the clear-air and cloud fractions requiredin our model to fit the data, we would also conclude that theplanet has a dynamic atmosphere. Thus, the spectral albedo couldbe expected to show slight changes with time, and with long-termmonitoring we may be able to deduce the planet’s timescale forweather patterns. We could also expect to see periodic changesdue to planet rotation if the surface has strong nonuniformities,and we could hope to constrain continental and ocean cover, per-haps even mineral types or hints of pigments in widespreadphotosynthetic organisms.
Given these conclusions, it is advisable to consider endowingthe TPF-C mission with the capability of working in the near-infrared. This would place an additional burden on the mission,in terms of a detector and spectrometer, and it would not be pos-sible to reach as close to the star as would be desired in all cases,owing to the diffraction limitation of a few times k /D of mostcoronagraphs (whereD is the diameter of the telescope). Further-more, the decreasing planetary reflectance at these wavelengthsmay lengthen exposure times for detection. A thorough assess-ment of the observations that would be possible at near-infraredwavelengths, with various choices of coronagraph and for starsin the solar neighborhood, would tell whether it is worthwhileto have a near-infrared capability on TPF-C.
Two lines of observational work that need a better under-standing for interpreting earthshine data are (1) a more rigorousstudy of the scattered-light sky spectrum and the way in which it
changes with position relative to the bright Moon and (2) a bet-ter understanding of the spectra of different types of clouds.In terms of validating models that reconstruct the Earth based
on its spectrum, we need to know, what is the full range of pa-rameters, in terms of cloud types, cloud heights, atmosphericwater content, abundances of other gaseous components, and sur-face compositions, that will generate a satisfactory fit to the data,within the observational uncertainties? It is important to clearlymap out the degeneracies between the different components ofour models, so that we can understand the likelihood that a givenmodel reflects reality when we begin to characterize extrasolarplanets.Many other insights could result from the study of how the
Earth’s spectrum changes over time. For example, periodic changesdue to planet rotation could be used to create a map of fractionalland and ocean area as a function of longitude (see Ford et al.2001). We must also ask, how much does cloud cover wash outspectral signatures of the surface? Seasonal changes, and evenchanges associated with atmospheric chemistry in response tothe Solar transient events and cycles, are interesting topics thatmay be relevant to the interpretation of terrestrial exoplanetspectra and would also contribute to our understanding of theEarth-Sun system. A long-term earthshine monitoring campaign,covering all longitudes and seasons, would be a crucial part ofpreparing for the launch of TPF-C. However, if such a campaignrequires contributions from multiple observatories, great caremust be taken to account for different instrumental and localatmospheric effects before we can confidently interpret the spec-trum of our planet’s many faces.
We thank Lisa Kaltenegger and Sara Seager for comments onthe manuscript. This work was supported in part by NASA grantNAG5-13045 (W. T.). M. C. T. was supported by a postdoctoralfellowship from the NASA Astrobiology Institute and the Na-tional Research Council. M. C. T. also thanks J. Lunine for sup-port of this work, as well as J. Kasting, P. Montanes-Rodriguez,and G. Tinetti for sharing their insights. We are grateful toC. Corbally, S. J., of the Vatican Observatory, and to M. Nelsonfor their help with 1.8 m VATT operations. We would also liketo thank the anonymous referee for several helpful suggestions.
Fig. 7.—Earth’s observed reflectance spectrum, at visible and near-infraredwavelengths, created from a composite of the data in this paper (0.8–2.4 !m)and the data presented in Paper I (0.5–0.8 !m). The strongest molecular signaturesare indicated, as are the wavelengths where Rayleigh scattering and vegetationreflection are most significant.
TURNBULL ET AL.558 Vol. 644
AR coated HgCdTe

NASA Goddard
Presented at SPIE Optics + Photonics UV/Optical/IR Space Telescopes and Instruments: Innovative Technologies and Concepts VII
Paper 9602-129 August 2015, San Diego, CA USA 9
Electron Multiplying CCD(EMCCD)
HOME CONFERENCES + EXHIBITIONS PUBLICATIONS EDUCATION MEMBERSHIP INDUSTRY RESOURCES CAREER CENTER NEWS + VIDEOS
Your Selections
EMCCD
Clear All Refinements
Refine This Search
Technologies & Applications
Electron multiplying chargecoupled devices (4)Design and modelling (2)
Quantum efficiency (2)
Galactic astronomy (2)
Equipment and services (1)Optics (1)
Optical design (1)
Display: 20 per page Sort By: Relevance
7 search results within SPIE Optics + Photonics 2015
Search within EMCCD
UPCOMING PRESENTATIONElectron multiplication CCD detector technology advancement for the WFIRST-AFTA coronagraphintegral field spectrographLeon K. Harding, Michael Cherng, Richard Demers, Michael E. Hoenk, Darren Michaels, Bijan Nemati, Pavani Peddada11 August 2015 • 2:30 - 2:50 PM | Part of SPIE Optical Engineering + Applications
UPCOMING PRESENTATIONMaturing CCD photon counting technology for space flightUdayan Mallik, Richard G. Lyon, Michael McElwain, Dominic J. Benford, Mark Clampin, Brian A. HIcks12 August 2015 • 4:10 - 4:30 PM | Part of SPIE Optical Engineering + Applications
CREATE AN ACCOUNT | SIGN IN ABOUT SPIE | CONTACT US | HELP | VIEW CART (0 ITEMS)
SEARCH
SEARCH
Photomasks (1)
Optical coatings (1)
Atomic layer deposition (1)Transmittance (1)
Optical filters (1)
Bandpass filters (1)
Iterated function systems (1)
UPCOMING PRESENTATIONNoise and dark performance for FIREBall-2 EMCCD delta-doped CCD detectorErika T. Hamden, Nicole Lingner, Gillian Kyne, Patrick Morrissey, D. Christopher Martin10 August 2015 • 9:00 - 9:20 AM | Part of SPIE Optical Engineering + Applications
UPCOMING PRESENTATIONThe impact of radiation damage on photon counting with an EM-CCD for the WFIRST-AFTAcoronagraphNathan L. Bush, David J. Hall, Andrew D. Holland, Ross Burgon, Neil J. Murray, Jason P. D. Gow, Matthew R. Soman, DougJordan, Richard Demers, Leon K. Harding, Michael E. Hoenk, Darren Michaels, Bijan Nemati, Pavani Peddada11 August 2015 • 2:10 - 2:30 PM | Part of SPIE Optical Engineering + Applications
UPCOMING PRESENTATIONDetector performance for the FIREBall-2 UV experimentApril D. Jewell, Erika T. Hamden, Hwei Ru Ong, John Hennessy, Timothy Goodsall, Charles Shapiro, Samuel R. Cheng, Todd J.Jones, Alexander G. Carver, Michael E. Hoenk, David Schiminovich, D. C. Martin, Shouleh Nikzad10 August 2015 • 8:40 - 9:00 AM | Part of SPIE Optical Engineering + Applications
UPCOMING PRESENTATIONFireball-2: a UV multi-object spectrograph for detecting the low z circumgalactic mediumDavid Schiminovich, Erika T. Hamden, D. Christopher Martin, Bruno Milliard, Robert Grange, Shouleh Nikzad, Lauren Corlies,Robert Crabill, Didier Ferrand, Albert Gomes, Anne-Sophie Hutter, Marc Jaquet, April Jewell, Gillian Kyne, Vincent Lamande,Gerard Lemaitre, Michele Limon, Nicole Lingner, Marc Llored, Mateusz Matuszewski, Pierre Mege, Frederi Mirc, PatrickMorrissey, Hwei Ru Ong, Alain Origne, Sandrine Pascal, Celine Peroux, Samuel Quiret, Didier Vibert, Jose M. Zorrilla10 August 2015 • 8:20 - 8:40 AM | Part of SPIE Optical Engineering + Applications
UPCOMING PRESENTATIONRequirements and design reference mission for the WFIRST-AFTA coronagraph instrumentRichard Demers, Frank G. Dekens, Robert J. Calvet, Zensheu Chang, Robert T. Effinger, Eric M. Ek, Laura Jones, Anthony Loc,Bijan Nemati, Martin Charley Noecker, Timothy Neville, Hung Pham, Hong Tang, Juan Villalvazo11 August 2015 • 8:00 - 8:20 AM | Part of SPIE Optical Engineering + Applications
Other EMCCD Talks at this Conference Include…

NASA Goddard
Presented at SPIE Optics + Photonics UV/Optical/IR Space Telescopes and Instruments: Innovative Technologies and Concepts VII
Paper 9602-129 August 2015, San Diego, CA USA 10
Electron Multiplying CCDs (EMCCD) for Visible• Uses impact ionization by
electrons to function like a solid state image intensifier
• Basic principles first documented in 1992 by Hynceck of Texas Instruments1
• Subsequently patented by e2v in Europe2 and Hynceck in U.S.3
• Can be used as: (1) conventional CCD, (2) intensified CCD, and (3) photon counting Geiger CCD
• Baselined for use in the WFIRST coronagraph1 Hynecek, J. 1992, IEEE Transactions on Electron Devices, 39, 1972
2 Burt, D.J. and Bell, R.T. 1998, European Patent Office, Patent EP 0 866 501 A13 Hynecek, J. 2001, U.S. Patent Office, Patent US 6,278,142 B1
rn
Any one exposure consists of many integrations. In each integration, pixel values are set equal to 0 or 1. While the actual output from the electron multiplier can have any value in the range 0 to 216-1 ADU (referenced to the output of a 16-bit ADC), for photon counting, a discriminator is used to determine whether a count has occurred or not. In practice, an astronomer would might typically choose a sigma-clipping discriminator algorithm. In other words, all pixel values that are >4-5× the readout noise are counted as events.
Of course, there are effects such as CIC and dark current, that can undermine this simple operations concept. Likewise, the onset of saturation in an EMCCD, when used with a binary discriminator, presents its own challenges. Although we have done a significant amount of work on the issue of saturation, space limitations prevent us from discussing them here. For this reason, we plan to publish paper in the near future that will discuss the measurements in more detail and the theory of EMCCDs operations.
One important role of the Fabry-Perot spectrograph will be to explore how this simple operations concept needs to be modified for use with real devices and under real observing conditions. However, in the final analysis, we are more interested in exploring and understanding the underlying potential of the technology, than in ascertaining the applicability of currently available EMCCDs to any one observing program or instrument.
4. Demonstration of EMCCD Operating Modes e2v’s CCD97 and CCD201 L3 EMCCDs can be used in four different output modes, depending on the voltage that is applied to the high voltage clock phase and the output pin that is selected. These are as follows.
Classical CCD, electron multiplying output gEM = 1×. As with a classical CCD, output signal is proportional to flux.
Intensified imaging gEM > 1×. Output signal is proportional to flux and gEM.
Because there is a 2 “excess noise factor” that is applied to the Poisson noise of the source, this mode is of limited applicability to low-background astronomy. For more information on intensified imaging and the excess noise factor, see [4].
Photon counting gEM >1000× . A discriminator is used to determine whether one or more photons has arrived during the integration time.
Classical CCD, classical CCD output EM output was not used. This mode was not tested. We note, however, that even if serious problems were encountered using EM on orbit, a user could in software select the classical CCD output. For this reason, there is never any disadvantage for an instrument using an EMCCD vis-à-vis one using classical CCDs.
Fig. 4, taken using an Offner relay to illuminate an Air Force test pattern in the DCL, demonstrates correct functionality of each of the three modes that was tested.
Fig. 4. Imaging an Air Force test pattern illuminated by an Offner relay. Images are as follows; (left) classical CCD mode
using EM output, (middle) intensified imaging mode, and (3) photon counting. The illumination level was about the same in all three cases. Because the purpose of this figure is to demonstrate correct function, no special care was taken to ensure matching of gray levels, etc. The apparent signal-to-noise ratio increases are, however, real.
Proc. of SPIE Vol. 6276 62761H-4
Conventional CCD Intensified Imager Photon CountingFig. Credit: Wen, Y., Rauscher, B. J., Baker, R. G., et al. 2006, Proc SPIE, 6276, 44
Fig. Credit: e2v CCD201

NASA Goddard
Presented at SPIE Optics + Photonics UV/Optical/IR Space Telescopes and Instruments: Innovative Technologies and Concepts VII
Paper 9602-129 August 2015, San Diego, CA USA 11
EMCCD Operating Principle

NASA Goddard
Presented at SPIE Optics + Photonics UV/Optical/IR Space Telescopes and Instruments: Innovative Technologies and Concepts VII
Paper 9602-129 August 2015, San Diego, CA USA 12
EMCCD Architecture
31 October 2006 Laboratoire d'Astrophysique de MarseilleMarseille, France
46
Operating Principal (2)
• Scientific CCDs normally have readout noise floors of 2-5 e- rms.• Avalanche gain technology (electron multiplication) allows sub-electron read-noise.
Example of avalanche-gain architecture (e2v CCD65)
• Several important considerations:• Cooling to suppress dark current becomes very important• Good control of operating temperature and HV-clock level are important for gain stability• Noise statistics are non-Gaussian resulting from the stochastic gain process• Clock-induced charge can become significant at sub-electron signal levels
s
NASA Goddard
Presented at SPIE Optics + Photonics UV/Optical/IR Space Telescopes and Instruments: Innovative Technologies and Concepts VII
Paper 9602-129 August 2015, San Diego, CA USA 13
Imagerie CCD 31
FIGURE 1.17: Gauche : Gain EM moyen appliqué sur les charges générées par effetthermique dans le registre EM, pour un registre EM de 536 éléments. La lignepointillée montre le rapport 1 :1. Droite : Le rapport entre le gain total du registreEM et le gain moyen des charges générées par effet thermique à l’intérieur duregistre EM.
FIGURE 1.18: Génération de charges par ionisation par impact des trous lorsqu’unehorloge est sortie de son état d’inversion. Ce processus crée l’injection de charge.Source : Janesick (2001).
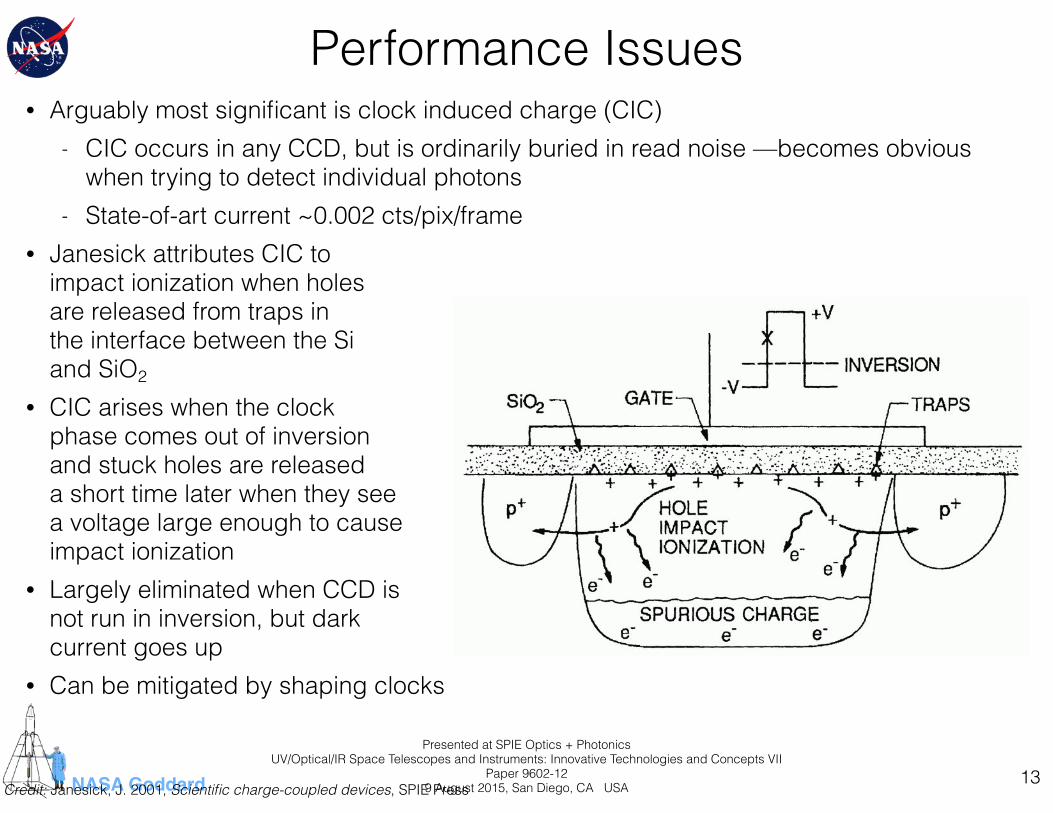
• Arguably most significant is clock induced charge (CIC) - CIC occurs in any CCD, but is ordinarily buried in read noise —becomes obvious
when trying to detect individual photons - State-of-art current ~0.002 cts/pix/frame
• Janesick attributes CIC toimpact ionization when holesare released from traps inthe interface between the Siand SiO2
• CIC arises when the clock phase comes out of inversionand stuck holes are releaseda short time later when they seea voltage large enough to causeimpact ionization
• Largely eliminated when CCD is not run in inversion, but darkcurrent goes up
• Can be mitigated by shaping clocks
Performance Issues
Credit: Janesick, J. 2001, Scientific charge-coupled devices, SPIE Press

NASA Goddard
Presented at SPIE Optics + Photonics UV/Optical/IR Space Telescopes and Instruments: Innovative Technologies and Concepts VII
Paper 9602-129 August 2015, San Diego, CA USA 14
EMCCDs: Where Work is Needed for ATLAST• New EMCCDs arguably meet performance
requirements for spectroscopic biosignature characterization
• However, they will degrade in the space radiation environment (as would any conventional CCD)
• JPL is conducting a radiation test now for WFIRST, but performance requirements for ATLAST will be more challenging
• Design enhancements to increase radiation tolerance beneficial
• Further reduction in clock induced charge beneficial • Improving the red QE beneficial

NASA Goddard
Presented at SPIE Optics + Photonics UV/Optical/IR Space Telescopes and Instruments: Innovative Technologies and Concepts VII
Paper 9602-129 August 2015, San Diego, CA USA 15
Microwave Kinetic Inductance Device (MKID)

NASA Goddard
Presented at SPIE Optics + Photonics UV/Optical/IR Space Telescopes and Instruments: Innovative Technologies and Concepts VII
Paper 9602-129 August 2015, San Diego, CA USA 16
MKIDs for the Visible and near-IR
Fig. Credit: Mazin, B. A., Meeker, S. R., Strader, M. J., et al. 2013, PASP, 125, 1348–1361
Tc is about 800 mK. Due to the long penetration depth ofthese films (∼1000 nm), the surface inductance is a high25 pH=square, allowing a very compact resonator fitting in a222 × 222 μm square. A square microlens array with a 92%optical fill factor is used to focus light onto the photosensitiveinductor. Microlens arrays with overall sizes over 100 mm areavailable from commercial vendors. High fill factor multilayerMKIDS, with the inductor made on top of a parallel platecapacitor, are possible for applications where the microlens ar-ray is problematic, such as the deep UV. The pixel pitch is easilycontrolled, with pitches between 75–500 μm relatively easy toachieve. The quasi-particle lifetime in our TiN films is 50–100 μs. This sets the pulse decay time, allowing a maximumcount rate of approximately 2500 counts pixel!1 s!1 beforeproblems arise in separating pulses.
After significant development (Mazin et al. 2012), we havearrived at the 2024 (44 × 46) pixel array shown in Figure 2 and3. Typical performance for single pixel devices is R ∼ 10 at4000 Å. Over an entire array, we see a median spectral resolu-tion R ∼ 8 at 4000 Å (§ 7.2). Typically >90% of the resonatorsshow up in frequency sweeps, but due to the variations in theTiN gap there are a significant number of collisions (two ormore pixels with resonant frequencies closer together than500 kHz), reducing usable pixels, as discussed in § 7.1. Aftercutting out collisions and pixels with especially high or lowquality factor, we usually have ∼70% of our pixels usable. Amore uniform film, such as the ones made at the National In-stitute of Standards and Technology (NIST) with Ti/TiN multi-layers (Vissers et al. 2012) or with atomic layer deposition(ALD), could significantly reduce the number of collisions, dra-matically improving yield.
Even with the current moderate spectral resolution and yield,these arrays are very useful tools for narrow field-of-view astro-physics.
3. OPTICAL DESIGN
An optical system, shown in Figure 4, has been designedwith Zemax to couple ARCONS with the f=30 beam at the Pal-omar 200 inch Coudé focus. A very similar system (using just adifferent dewar entrance lens) is used to couple to the Lick 3 mCoudé focus. This focus is stationary, which makes interfacingwith the cryostat (and its compressor) significantly easier, andthe time resolution of the MKIDs means that rotation of the im-age plane over time can be easily removed.
The optical path is as follows: light bounces off the primaryand secondary, then off the Coudé M3 that directs light downthe polar axis of the equatorial mount. Once in the Coudé ante-chamber, a 100 mm diameter pickoff mirror (M4) sends the lighttowards the dewar entrance window. Before the dewar entrance,two pickoff mirrors form a ∼25″ wide slit and direct the rest ofthe field of view towards the guide camera’s reimaging optics.Immediately in front of the entrance window is a commercialThorlabs 25 mm filter wheel, which can hold up to six filters
FIG. 2.—Photograph of a 2024 pixel UVOIR MKID array (with microlensremoved for clarity) in a microwave package. See the electronic edition ofthe PASP for a color version of this figure.
FIG. 3.—Left: Microscope image of a portion of the 2024 pixel MKID arrayused at the Palomar 200 inch telescope. A microlens focuses the light on to the40 × 40 μm inductor. Various features of interest are labeled. Right: Zoomed inview of the array in the left panel. See the electronic edition of the PASP for acolor version of this figure.
FIG. 4.—Optical layout of ARCONS. Light enters ARCONS at the left side ofthe figure and is absorbed in the MKID array on the right side of the figure. Seethe electronic edition of the PASP for a color version of this figure.
ARCONS: OPTICAL TO NIR IMAGING SPECTROPHOTOMETER 1351
2013 PASP, 125:1348–1361
This content downloaded from 128.154.208.150 on Thu, 20 Feb 2014 14:52:55 PMAll use subject to JSTOR Terms and Conditions
Incident photons detected in inductor
A 2024 pixel UVOIR MKID array with microlens array removed
Left) Microscope image of a 2024 pixel MKID array used at the Palomar 5-m telescope. Right) Zoomed in view.
~40 µm
An MKID array was used for UVOIR astronomy at the Palomar 5-m (Mazin et al. 2013, PASP, 125, 1348)
NASA Goddard
Presented at SPIE Optics + Photonics UV/Optical/IR Space Telescopes and Instruments: Innovative Technologies and Concepts VII
Paper 9602-129 August 2015, San Diego, CA USA 17
MKID Operating Principle
these detectors have generally been used with individual preampli-fiers and wiring for the output signals, which is clearly impracticalfor large arrays. Instead, a multiplexed readout approach is needed,in which preamplifiers and signal wiring are shared among multipledetectors. Multiplexing schemes are now being developed fortransition-edge sensors15,16, but will require complex, custom-designed superconducting electronics, located close to the detectorarray. Our detector concept17 is based on the microwave measure-ment of the complex impedance of a thin superconducting film, andallows a simple frequency-domain approach to multiplexing. Thisresults in a dramatic simplification of the detector array andassociated cryogenic electronics, and harnesses the rapid advancesin wireless communications electronics. The results we presentinclude the demonstration of single X-ray photon detection witha high signal-to-noise ratio and a measurement of the detectornoise. Although much work remains to be done to optimize theperformance, and to produce and use practical detector arrays, thedevices already achieve very interesting levels of sensitivity.In order to explain the operation of our detector, wemust quickly
review the electrodynamics of superconductors18. As its nameimplies, a superconductor has zero resistance for d.c. electrical
current. This supercurrent is carried by pairs of electrons, knownas Cooper pairs. Cooper pairs are bound together by the electron–phonon interaction, with a binding energy 2D < 3.5kBTc, where Tc
is the superconducting transition temperature. However, supercon-ductors have a nonzero impedance for a.c. currents. An electric fieldapplied near the surface of a superconductor causes the Cooperpairs to accelerate, allowing energy storage in the form of kineticenergy. Because the supercurrent is non-dissipative, this energy maybe extracted by reversing the electric field. Similarly, energy may bestored in the magnetic field inside the superconductor, whichpenetrates only a short distance, l < 50 nm, from the surface.The overall effect is that a superconductor has a surface inductanceL s ¼ m0l, due to the reactive energy flow between the super-conductor and the electromagnetic field. The surface impedanceZs ¼ Rs þ iqLs also includes a surface resistance Rs, which describesa.c. losses at angular frequency q caused by the small fraction ofelectrons that are not in Cooper pairs, which are called ‘quasipar-ticles’. For temperatures Tmuch lower than Tc, Rs ,, qLs.
Photons with sufficient energy (hn . 2D) may break apart one ormore Cooper pairs (Fig. 1a). The absorption of a high-energyphoton creates Nqp < hhn/D quasiparticles; the excess quasiparti-
Figure 1 An illustration of the detection principle. a, Photons with energy hn . 2D are
absorbed in a superconducting film cooled to T ,, Tc, breaking Cooper pairs and
creating a number of quasiparticle excitations Nqp ¼ hhn/D. In this diagram, Cooper
pairs (C) are shown at the Fermi level, and the density of states for quasiparticles18, Ns(E ),
is plotted as the shaded area as a function of quasiparticle energy E. b, The increase inquasiparticle density changes the (mainly inductive) surface impedance Zs ¼ R s þ iq Lsof the film, which is used as part of a microwave resonant circuit. The resonant circuit is
depicted schematically here as a parallel LC circuit which is capacitively coupled to a
through line. The effect of the surface inductance L s is to increase the total inductance L,
while the effect of the surface resistance Rs is to make the inductor slightly lossy (adding a
series resistance). c, On resonance, the LC circuit loads the through line, producing a dipin its transmission. The quasiparticles produced by the photons increase both L s and R s,
which moves the resonance to lower frequency (due to L s), andmakes the dip broader and
shallower (due to R s). Both of these effects contribute to changing the amplitude
(producing power change dP ) (c) and phase (d) of a microwave probe signal transmittedthough the circuit. The definition of the phase angle used here is explained in Fig. 3. The
amplitude and phase curves shown in this illustration are actually the data measured for
the test device (Fig. 2) at 120mK (solid lines) and 260mK (dashed lines). This choice of
circuit design, which has high transmission away from resonance, is very well suited for
frequency-domain multiplexing, because multiple resonators operating at slightly
different frequencies could all be coupled to the same through line.
Figure 2 A microscope photograph of the device tested. Light and dark regions are the
aluminium film and bare sapphire substrate, respectively. A, coplanar waveguide (CPW)
through line used for excitation and readout. B, Meandered quarter-wavelength resonator
section, with an overall length of 3 mm, and resonance frequency around 10 GHz. C,
coupling capacitor. D, short-circuit termination. The coupling region is magnified in the
inset; the diagram shows the equivalent circuit. Both CPW lines have a 50Q characteristic
impedance, and are fabricated from a single 2,200-A-thick aluminum film (T c ¼ 1.23 K)
using standard contact photolithography. The centre conductor of width 3 mm is
separated by 2-mm gaps from ground planes on either side. The fraction a of the total
inductance per unit length contributed by the surface inductance of the aluminium film
can be written as a sum of centre strip and ground plane terms, a ¼ acentre þ aground.
These are calculated to be acentre < 0.04 and aground < 0.02 using a finite-element
method26, assuming an effective penetration depth l ¼ 50 nm. The measured resonator
quality factor Q ¼ f0 /Df is 52,500 at low temperatures T ,, Tc (Fig. 1). This device is
mainly sensitive to photon events in the centre strip (V ¼ 2,000mm3) of the CPW line
rather than in the ground plane, because the microwave current in the ground plane is
concentrated near the edge of the CPW line; quasiparticles generated in the ground plane
near the edge of the CPW line can easily diffuse away. Similarly, the device is more
sensitive to centre strip events occurring near the short-circuited end, where the
standing-wave pattern of the microwave current reaches a maximum. Quasiparticles
generated in the centre strip may also diffuse out of the short-circuited end; the peak
response therefore occurs roughly one diffusion length (,1mm) from this end. Photon
events in the through line are not seen, because there is no resonant enhancement of the
surface impedance effect.
letters to nature
NATURE |VOL 425 | 23 OCTOBER 2003 | www.nature.com/nature818 © 2003 Nature Publishing Group
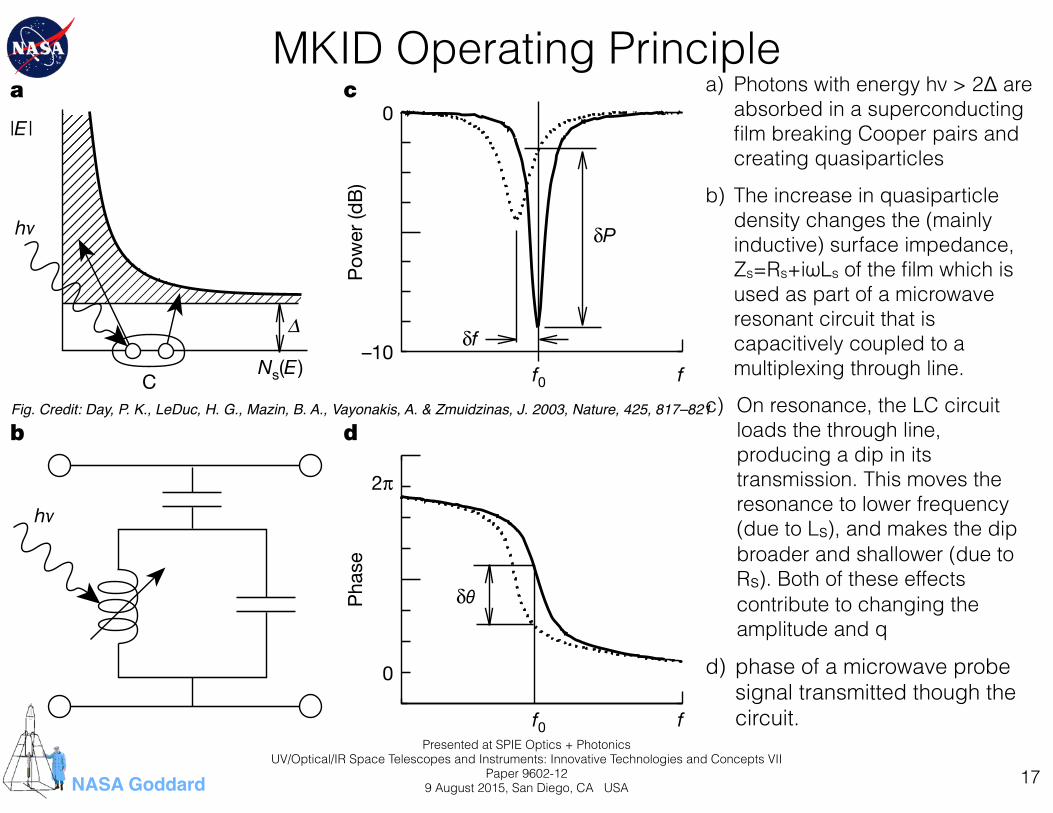
Fig. Credit: Day, P. K., LeDuc, H. G., Mazin, B. A., Vayonakis, A. & Zmuidzinas, J. 2003, Nature, 425, 817–821
a) Photons with energy hν > 2Δ are absorbed in a superconducting film breaking Cooper pairs and creating quasiparticles
b) The increase in quasiparticle density changes the (mainly inductive) surface impedance, Zs=Rs+iωLs of the film which is used as part of a microwave resonant circuit that is capacitively coupled to a multiplexing through line.
c) On resonance, the LC circuit loads the through line, producing a dip in its transmission. This moves the resonance to lower frequency (due to Ls), and makes the dip broader and shallower (due to Rs). Both of these effects contribute to changing the amplitude and q
d) phase of a microwave probe signal transmitted though the circuit.

NASA Goddard
Presented at SPIE Optics + Photonics UV/Optical/IR Space Telescopes and Instruments: Innovative Technologies and Concepts VII
Paper 9602-129 August 2015, San Diego, CA USA 18
MKIDs: Where Work is Needed• Higher energy resolving power is required for spectroscopic biosignature
characterization
- median(R) ~ 8 at 400 nm is documented1
- R > 70 required
- R > 150 goal
• Larger arrays are needed
- 2024 pixels documented1
- ~ 100 x 100 arrays required
- We understand that work on larger arrays is already in progress
• More information on the achieved detection efficiency is needed
- Published values suggest that the detection efficiency of the ARCONS MKIDs+µ-lens+Electronics may be < 30% at 1 µm1
- > 35% required for ~700 nm < λ < 2.5 µm
1 Mazin, B. A., Meeker, S. R., Strader, M. J., et al. 2013, Publications of the Astronomical Society of the Pacific, 125, 1348–1361

NASA Goddard
Presented at SPIE Optics + Photonics UV/Optical/IR Space Telescopes and Instruments: Innovative Technologies and Concepts VII
Paper 9602-129 August 2015, San Diego, CA USA 19
Summary• The search for life on exoplanets using spectroscopic biosignatures is real —expected to
be an important topic in the next Decadal Survey and NASA missions are already being planned
• Significant technical challenges include precision large-scale optics, ultra-stable structures, starlight suppression, and detectors
• Good candidate detectors exist, but all need work before they will be ready
• One important distinction is that between conventional semiconductor detectors and superconducting single photon detectors
- Semiconductor detectors require a spectrograph and run warm. But, no semiconductor detector has simultaneously met read noise and dark current requirements for spectroscopic biosignature characterization after radiation exposure
- Superconducting detectors including MKIDs and TESs run at T < 1 K, but have already met read noise and dark current requirements. More work needed to deliver required built in spectral resolution and acceptable QE
• These challenges are real, but solvable, with appropriate strategic investment and development

NASA Goddard
Presented at SPIE Optics + Photonics UV/Optical/IR Space Telescopes and Instruments: Innovative Technologies and Concepts VII
Paper 9602-129 August 2015, San Diego, CA USA 20
Backup Charts

NASA Goddard
Presented at SPIE Optics + Photonics UV/Optical/IR Space Telescopes and Instruments: Innovative Technologies and Concepts VII
Paper 9602-129 August 2015, San Diego, CA USA 21
What is,“Direct Spectroscopic Biosignature Characterization”?
• Direct = imaging the exoplanet itself
- Contrasts with transit technique that measures the effect of an exoplanet on light from its host star
- Uses a coronagraph or starshade to suppress light from the host star
• Spectroscopic = low resolution (R = λ / Δλ ~ 100) imaging spectroscopy to measure atmospheric features in the exoplanet
• Biosignature = aim is to characterize molecular and other atmospheric features that are thought to indicate biological processes

NASA Goddard
Presented at SPIE Optics + Photonics UV/Optical/IR Space Telescopes and Instruments: Innovative Technologies and Concepts VII
Paper 9602-129 August 2015, San Diego, CA USA 22
Biosignatures: Spectroscopic Signs of Life
• With modeling, spectroscopy allows us to detect life on other worlds that are too far away for us to travel to directly
• Care will be needed to weed out false positives where the detection of O2 and O3 is not a sign of life
• Comprehensive modeling of diverse data sets is key
• UV, visible, and IR wavelengths all carry important information
we can separate these spectra. The presence of cumulus cloudssuggests an active troposphere, with convective upwelling anddown-welling, and the existence of weather patterns that mightbe detected with long-term observations.
Finally, we note that the vegetation signal did not appear tobe present at a detectable level in these data. This is perhaps sur-prising, given the view of Earth shown in Figure 2. As mentionedin x 1, the vegetation signal is represented by a sharp increase inreflectivity redward of 0.72 !m, and the optical data presentedin Paper I appear to show this feature. However, plant reflectancefalls off again in the near-infrared due to liquid water vibrationalabsorption features (see Clark 1999). In fact, the near-infraredspectrum of plants is very similar to that of clouds, which mayexplain why we were not able to clearly identify it in our data. At!0.7 !m, where we would expect to see the vegetation ‘‘jump,’’the signal-to-noise ratio of our data was very low, and we cannotclaim any clear contribution from plants to our near-infraredearthshine spectrum.
4. CONCLUSIONS AND FUTURE WORK
In Figure 7, we present the combined data from Paper I andthe new observations presented here. The optical data have beensmoothed to match the resolution of the near-infrared data, andthe two data sets were merged at 0.8 !m. The entire data set wasthen normalized to 1.0 at 0.5 !m. At these wavelengths, ourworld is spectrally distinct from Venus and Mars (Traub 2003;Mustard & Bell 1994; Klassen et al. 1999), the gas giant planets(Fink & Larson 1979), and their satellites (Carlson et al. 1996;Cruikshank et al. 2005).What can we say about the Earth, basedon these data? First, from the strong water bands, we would con-fidently conclude that Earth is a habitable planet. Furthermore,the simultaneous detection of methane and abundant oxygen isstrongly suggestive of either biological activity or some unusualatmospheric or geological process that can sustain large amountsof atmospheric oxygen in the presence of reduced gases (e.g., a‘‘runaway greenhouse’’ situation as described by Kasting et al.[1993] could generate a large oxygen signal, but only for a shortperiod of time). From the clear-air and cloud fractions requiredin our model to fit the data, we would also conclude that theplanet has a dynamic atmosphere. Thus, the spectral albedo couldbe expected to show slight changes with time, and with long-termmonitoring we may be able to deduce the planet’s timescale forweather patterns. We could also expect to see periodic changesdue to planet rotation if the surface has strong nonuniformities,and we could hope to constrain continental and ocean cover, per-haps even mineral types or hints of pigments in widespreadphotosynthetic organisms.
Given these conclusions, it is advisable to consider endowingthe TPF-C mission with the capability of working in the near-infrared. This would place an additional burden on the mission,in terms of a detector and spectrometer, and it would not be pos-sible to reach as close to the star as would be desired in all cases,owing to the diffraction limitation of a few times k /D of mostcoronagraphs (whereD is the diameter of the telescope). Further-more, the decreasing planetary reflectance at these wavelengthsmay lengthen exposure times for detection. A thorough assess-ment of the observations that would be possible at near-infraredwavelengths, with various choices of coronagraph and for starsin the solar neighborhood, would tell whether it is worthwhileto have a near-infrared capability on TPF-C.
Two lines of observational work that need a better under-standing for interpreting earthshine data are (1) a more rigorousstudy of the scattered-light sky spectrum and the way in which it
changes with position relative to the bright Moon and (2) a bet-ter understanding of the spectra of different types of clouds.In terms of validating models that reconstruct the Earth based
on its spectrum, we need to know, what is the full range of pa-rameters, in terms of cloud types, cloud heights, atmosphericwater content, abundances of other gaseous components, and sur-face compositions, that will generate a satisfactory fit to the data,within the observational uncertainties? It is important to clearlymap out the degeneracies between the different components ofour models, so that we can understand the likelihood that a givenmodel reflects reality when we begin to characterize extrasolarplanets.Many other insights could result from the study of how the
Earth’s spectrum changes over time. For example, periodic changesdue to planet rotation could be used to create a map of fractionalland and ocean area as a function of longitude (see Ford et al.2001). We must also ask, how much does cloud cover wash outspectral signatures of the surface? Seasonal changes, and evenchanges associated with atmospheric chemistry in response tothe Solar transient events and cycles, are interesting topics thatmay be relevant to the interpretation of terrestrial exoplanetspectra and would also contribute to our understanding of theEarth-Sun system. A long-term earthshine monitoring campaign,covering all longitudes and seasons, would be a crucial part ofpreparing for the launch of TPF-C. However, if such a campaignrequires contributions from multiple observatories, great caremust be taken to account for different instrumental and localatmospheric effects before we can confidently interpret the spec-trum of our planet’s many faces.
We thank Lisa Kaltenegger and Sara Seager for comments onthe manuscript. This work was supported in part by NASA grantNAG5-13045 (W. T.). M. C. T. was supported by a postdoctoralfellowship from the NASA Astrobiology Institute and the Na-tional Research Council. M. C. T. also thanks J. Lunine for sup-port of this work, as well as J. Kasting, P. Montanes-Rodriguez,and G. Tinetti for sharing their insights. We are grateful toC. Corbally, S. J., of the Vatican Observatory, and to M. Nelsonfor their help with 1.8 m VATT operations. We would also liketo thank the anonymous referee for several helpful suggestions.
Fig. 7.—Earth’s observed reflectance spectrum, at visible and near-infraredwavelengths, created from a composite of the data in this paper (0.8–2.4 !m)and the data presented in Paper I (0.5–0.8 !m). The strongest molecular signaturesare indicated, as are the wavelengths where Rayleigh scattering and vegetationreflection are most significant.
TURNBULL ET AL.558 Vol. 644Earth seen as an exoplanet
Earthshine spectrum from Turnbull et al. 2006, ApJ, 644, 551
σSpectroscopic feature (cm-1) R = λ/Δλ λ Ref. Importancea
O3 31,000 16 320 1 Source is O2; UV shieldRayleigh scattering N/A 5 < 500 2 Protective atmosphereO3 17,125 5 580 1,2O2 14,515 54 690 1 Plants emit; animals inhaleH2O 13,815 37 720 1 Needed for lifeCH4 13,780 57 730 1 Can have biological originCloud/surface reflection N/A 8 750 2 Rotation indicatorO2 13,105 69 760 1,2Land plant reflection N/A 8 770 2 Vegetated land areaCH4 12,635 29 790 1H2O 12,175 35 820 1CH4 11,215 32 890 1H2O 10,625 17 940 1,2CH4 10,035 20 1,000 1CO2 9,530 40 1,050 1 Important to surface temperatureH2O 8,815 19 1,130 1CO2 8,240 34 1,210 1O2 7,895 72 1,270 1H2O 7,110 10 1,410 1CO2 6,295 11 1,590 1CH4 5,900 10 1,690 1H2O 5,330 11 1,880 1CO2 4,930 16 2,030 1CH4 4,305 8 2,320 1H2O 1,428 10 7,000 1CH4 1,306 13 7,650 1CH4 1,253 6 7,980 1Cont. 1,154 8 8,670 1CO2 1,074 19 9,310 1O3 1,036 17 9,650 1CO2 960 16 10,420 1Cont. 895 5 11,170 1CO2 668 4 14,960 1H2O 488 3 20,490 1H2O 350 4 28,570 1H2O 250 2 40,000 1
1Des Marais et al. 2002, “Remote Sensing of Planetary Properties and Biosignatures on Extrasolar Terrestrial Planets..” Astrobiology 2 (2): 153–81. doi:10.1089/15311070260192246.2Postman, M. et al. 2009, “Advanced Technology Large-Aperture Space Telescope (ATLAST): Characterizing Habitable Worlds.” arXiv.org.
aFor each feature, we state its importance only the first time that it is mentioned.
Some relevant features and what they tell us
O3 at 260 nm is also very important

NASA Goddard
Presented at SPIE Optics + Photonics UV/Optical/IR Space Telescopes and Instruments: Innovative Technologies and Concepts VII
Paper 9602-129 August 2015, San Diego, CA USA 23
NASA Technology Readiness Levels1. Basic principles observed and reported: Transition from scientific research to applied research. Essential
characteristics and behaviors of systems and architectures. Descriptive tools are mathematical formulations or algorithms.
2. Technology concept and/or application formulated: Applied research. Theory and scientific principles are focused on specific application area to define the concept. Characteristics of the application are described. Analytical tools are developed for simulation or analysis of the application.
3. Analytical and experimental critical function and/or characteristic proof-of- concept: Proof of concept validation. Active Research and Development (R&D) is initiated with analytical and laboratory studies. Demonstration of technical feasibility using breadboard or brassboard implementations that are exercised with representative data.
4. Component/subsystem validation in laboratory environment: Standalone prototyping implementation and test. Integration of technology elements. Experiments with full-scale problems or data sets.
5. System/subsystem/component validation in relevant environment: Thorough testing of prototyping in representative environment. Basic technology elements integrated with reasonably realistic supporting elements. Prototyping implementations conform to target environment and interfaces.
6. System/subsystem model or prototyping demonstration in a relevant end-to-end environment (ground or space): Prototyping implementations on full-scale realistic problems. Partially integrated with existing systems. Limited documentation available. Engineering feasibility fully demonstrated in actual system application.
7. System prototyping demonstration in an operational environment (ground or space): System prototyping demonstration in operational environment. System is at or near scale of the operational system, with most functions available for demonstration and test. Well integrated with collateral and ancillary systems. Limited documentation available.
8. Actual system completed and "mission qualified" through test and demonstration in an operational environment (ground or space): End of system development. Fully integrated with operational hardware and software systems. Most user documentation, training documentation, and maintenance documentation completed. All functionality tested in simulated and operational scenarios. Verification and Validation (V&V) completed.
9. Actual system "mission proven" through successful mission operations (ground or space): Fully integrated with operational hardware/software systems. Actual system has been thoroughly demonstrated and tested in its operational environment. All documentation completed. Successful operational experience. Sustaining engineering support in place.
TRL