detection with eight decades dynamic range doubly resonant
TRANSCRIPT

Page 1/15
Doubly resonant sub-ppt photoacoustic gasdetection with eight decades dynamic rangeZhen Wang
Changchun Institute of Optics, Fine Mechanics and Physics, Chinese Academy of SciencesHui Zhang
Changchun Institute of Optics, Fine Mechanics and Physics, Chinese Academy of SciencesQiang Wang
Changchun Institute of Optics, Fine Mechanics and Physics, Chinese Academy of SciencesSimone Borri
CNR-INO - Istituto Nazionale di Ottica https://orcid.org/0000-0001-8471-2803Iacopo Galli
CNRPaolo De Natale
CNR https://orcid.org/0000-0002-3308-8569Wei Ren ( [email protected] )
The Chinese University of Hong Kong https://orcid.org/0000-0001-6681-593X
Article
Keywords: gas detection, sensors, dynamic range
Posted Date: May 18th, 2021
DOI: https://doi.org/10.21203/rs.3.rs-431688/v1
License: This work is licensed under a Creative Commons Attribution 4.0 International License. Read Full License
Page 2/15
AbstractGas sensors with high sensitivity, wide dynamic range, high selectivity, fast response, and small footprintare desirable across a broad range of applications in energy, environment, safety, and public health.However, designing a compact gas sensor with ultra-high sensitivity and ultra-wide dynamic rangeremains a challenge. Laser-based photoacoustic spectroscopy (PAS) is a promising candidate to �ll thisgap. Herein, we report a novel method to simultaneously enhance the acoustic and light waves for PASusing integrated optical and acoustic resonators. This increases sensitivity by more than two orders ofmagnitude and extends the dynamic range by more than three orders of magnitude, compared with thestate-of-the-art photoacoustic gas sensors. We demonstrate the concept by exploiting a near-infraredabsorption line of acetylene (C2H2) at 1531.59 nm, achieving a detection limit of 0.5 parts-per-trillion
(ppt), a noise equivalent absorption (NEA) of 5.7×10⁻¹³ cm-1 and a linear dynamic range of eight orders ofmagnitude. This study enables the realization of compact ultra-sensitive and ultra-wide-dynamic-rangegas sensors in a number of different �elds.
IntroductionGas detection plays a signi�cant role in almost all aspects of our modern society such as energy,environment, transportation, agriculture, safety, and security. Among many different types of gas sensors,laser-based ones are best suited to provide several combined key features: accuracy, sensitivity,selectivity, portability, fast response, and safety. By measuring light attenuation through a gas sample,quantitative gas analysis can be performed using the Beer-Lambert law. These optical sensors areincreasingly required in a number of �elds, including environmental monitoring [1,2], marine science [3,4],biological studies [5,6], and breath analysis [7,8]. State-of-the-art laser absorption sensors using amultipass cell can achieve a noise equivalent absorption (NEA) as low as 10-10 cm-1 with an effectivepath length of hundred meters [9]. To further enhance sensitivity, the absorption path length can beincreased to kilometers by using a high-�nesse optical cavity. Among the most sensitive laser-based gassensing techniques, noise-immune cavity-enhanced optical heterodyne spectroscopy (NICE-OHMS)achieved a NEA of 10-14 cm-1 when operating at an extremely low pressure of 1.8 mTorr [10]; theminimum detectable concentration of a speci�c molecule has been achieved by saturated-absorptioncavity ring-down (SCAR) with a limit of a few parts-per-quadrillion (ppq) [6, 11]. However, the lineardynamic range of this class of optical gas sensors is generally limited to 4-5 orders of magnitude and theoverall footprint and weight are still quite large for many applications requiring very compact analyzers.Therefore, numerous applications require versatile gas sensors that can detect sub-part-per-billion (ppb)background concentration in ambient and hundred parts-per-million (ppm) concentration in the targetemission, as well.
To get a combined high sensitivity and wide dynamic range, photoacoustic spectroscopy (PAS) is apromising candidate. Indeed, the photoacoustic signal linearly increases with the absorbed laser power,rather than undergoing signi�cant power attenuation after a long absorption path. Instead of directly
Page 3/15
measuring light attenuation, PAS relies on the detection of acoustic waves generated in the vibrationalrelaxation process of molecules excited by photon absorption. Photoacoustic gas sensors also inherit theadvantages of high selectivity, high sensitivity, and fast response, like other laser-based spectroscopicmethods. In particular, the use of acoustic transducers instead of photodetectors makes PAS sensorsmore compatible with various laser wavelengths, as sensitive photodetectors are not always availableover a wide wavelength range. To date, numerous studies have been focused on advancing PAS bydesigning new photoacoustic cells, inventing new acoustic transducers, and using different laser sources[12-19]. State-of-the-art PAS-based gas sensors have detection sensitivity between 10-8 and 10-11 cm-1 inNEA and a linear dynamic range of �ve orders of magnitude [20-24].
In this work, we report a PAS sensor with opto-acoustic resonance enhancement for ultra-sensitive andultra-wide-dynamic-range gas detection. The novel photoacoustic detection module consists of a high-Q-factor acoustic resonator placed inside an optical resonator for the signi�cant ampli�cation of thephotoacoustic signal (Fig. 1). A novel photoacoustic design, leveraging on a double standing wave effect,achieves a combined acoustic ampli�cation factor of 175 times and laser power enhancement of almostthree orders of magnitude. Using a near-infrared diode laser at 1531.59 nm as a proof-of-principle, weshow that our acetylene (C2H2) sensor reaches a record sensitivity of 10-13 cm-1 (NEA) and anunprecedented linear dynamic range of eight orders of magnitude. Moreover, the C2H2 sensor is validatedin a relevant environment to measure ambient background concentration.
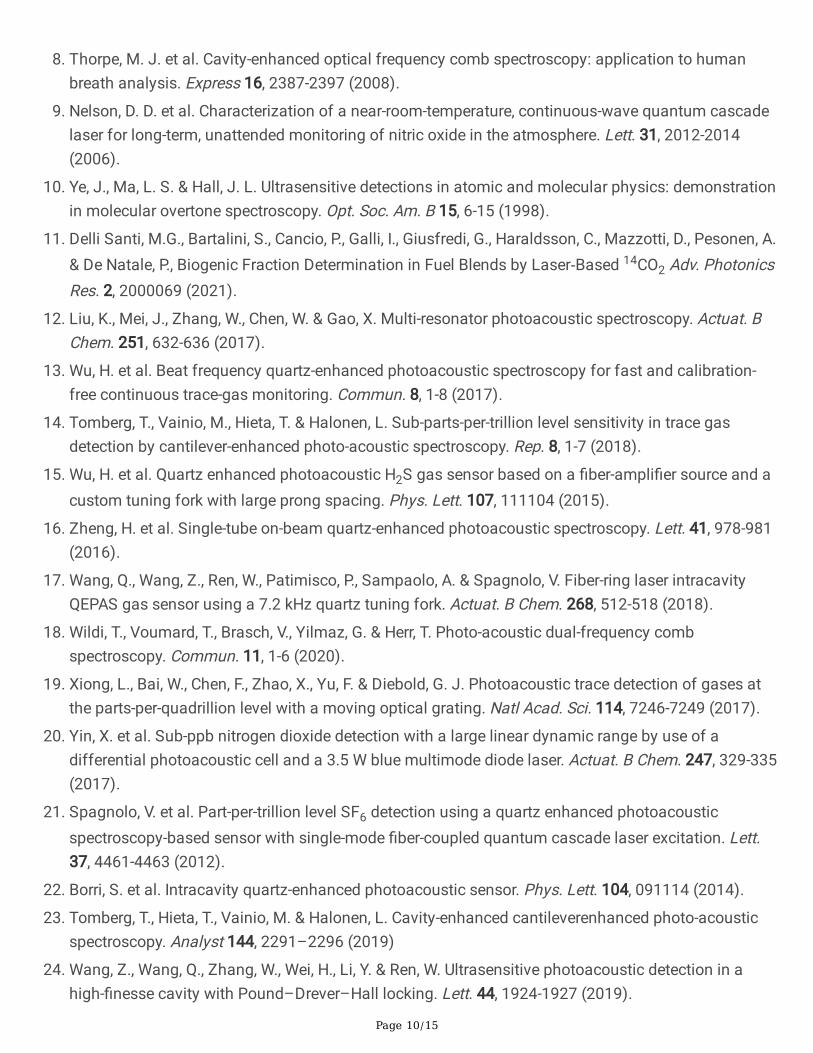
ResultsTheory. Figure 1 shows the basics of opto-acoustic resonance for PAS. The core gas sensing elementconsists of an optical resonator, an acoustic resonator, and an acoustic transducer, which are arranged ina coupled con�guration. Indeed, when the optical frequency of the incident laser is in resonance with alongitudinal cavity mode of the optical resonator, a standing optical wave is formed between theresonator mirrors. A high-�nesse optical resonator can signi�cantly build up the laser power, by severalorders of magnitude [25], directly enhancing the photoacoustic signal which scales linearly with the laserpower. The laser intensity is modulated at the same resonance frequency as the acoustic resonator. Aspeci�cally designed one-dimensional longitudinal tube can be used to amplify the acoustic signal byforming a standing acoustic wave inside it. Any types of acoustic transducers can be used to detect theampli�ed acoustic wave. In this work, we use both a quartz tuning fork (QTF), resonant at the samefrequency as the acoustic resonator, and an electret microphone for demonstration. As shown in Fig. 1,the QTF locates nearby the antinode of the standing acoustic wave, which is generated by the acousticresonator composed of two stainless-steel tubes placed at the opposite sides of the QTF [26]. The otherphotoacoustic sensor con�guration using an electret microphone is described in the Supplementary Note3.
The frequency-dependent photoacoustic signal (S) at its resonant frequency f is given by:
Page 4/15
where b is the laser power buildup factor, g is the acoustic wave enhancement factor, K is the sensorconstant, Win is the incident laser power, λ is the laser wavelength, αeff(λ) is the effective absorbance bythe analyte, τ(P) is the relaxation time at the gas pressure P, and ε is the radiation-to-sound conversione�ciency [27], which depends on f and τ. Note that the factor g is independent of laser power but isrelated to the geometry, to the material, and to the Q-factor of the acoustic resonator, as well as to thefrequency of sound waves [28]. The power buildup factor b is determined by the �nesse of the opticalresonator, which needs to be properly selected so that a wide linear dynamic range and a high sensitivitycan be simultaneously obtained (see Methods).
Experimental setup. The schematic of the PAS sensor is shown in Fig. 2. An external cavity diode laser(ECDL) is used to detect the P(11) line of C2H2 at 1531.59 nm. The ECDL is phase modulated by anelectro-optic modulator (EOM) at 20 MHz and locked to the optical resonator using the Pound-Drever-Hall(PDH) method [29]. Details of the application of the PDH method to PAS can be found in [24]. In this work,the current and piezo transducer (PZT) feedback loops are both used for a more robust lockingperformance. Each mirror of the optical resonator has a radius of curvature of 150 mm and re�ectivity of99.923% (�nesse 4078) at the laser wavelength, as measured by cavity ring-down (see SupplementaryNote 1). Compared with other cavity-enhanced absorption spectroscopic methods [6,10], the opticalresonator used here for the opto-acoustic resonance features a much shorter length (60 mm in this work).Two mode matching lenses (f1 and f2) are used to maximize the coupling e�ciency (84%) between thelaser and the optical resonator (see Supplementary Note 2). With a maximum incident laser power of 300mW, the intracavity optical power is boosted to 264 W in this work (see Methods).
The intracavity laser beam passes through the acoustic resonator, consisting of two stainless-steel tubes(inner diameter 1.3 mm, length 23 mm), and does not touch any surface. The central axis of the acousticresonator is about 1.2 mm below the top of the QTF prongs, thus optimizing the piezoelectricalconversion e�ciency [15]. The two tubes are placed at a distance of ~60 μm from the QTF, so that it liesnear the antinode of the acoustic wave and leaves its Q-factor unaffected. The beam waist (340 μm indiameter) is located between the two prongs of the QTF, which has a resonant frequency of 7.2 kHz and aQ-factor ~8000 (gas pressure 760 Torr) [15]. Photoacoustic gas sensors using QTF as an acoustictransducer have been previously developed for detecting many different gas species [15-17]. The opticalresonator, the acoustic resonator and the QTF are all enclosed inside a chamber. A high-speed lithiumniobate optical switch is used to chop the laser beam at the same frequency as the resonant frequency ofthe QTF. The piezoelectric current from the QTF is collected by a trans-impedance ampli�er and thenampli�ed by a low-noise voltage preampli�er. Finally, a lock-in ampli�er with a detection bandwidth of 1Hz is used to demodulate the �rst harmonic signal (1f) at the sensor output.
Double standing wave enhancement. To evaluate the enhancement effects due to the integrated acousticand optical resonators, the PAS-1f signal of the C2H2 line at 1531.59 nm is measured under three
Page 5/15
different con�gurations. Figure 3 compares the typical PAS-1f signal measured using a bare QTF (2%C2H2), a QTF with the mere acoustic resonator (0.1% C2H2), and a QTF with the complete opto-acousticresonator (1 ppm C2H2). Note that different C2H2 concentrations are used for these three con�gurationsbecause of their quite different sensitivity. All the experiments are performed at the same incident laserpower of 12 mW, lock-in detection bandwidth of 1 Hz, and gas pressure of 760 Torr. After normalizationby the gas concentration, a comparison of Fig. 3(a) and Fig. 3(b) shows that the acoustic resonatorenhances the PAS-1f signal by 175 times. Besides, the optical resonator provides another enhancementfactor of 980, as emerging from a comparison of Fig. 3(b) and Fig. 3(c). Hence, the combined opto-acoustic ampli�cation provides an overall enhancement of the PAS signal by a factor of 105 via thedouble standing wave effect.
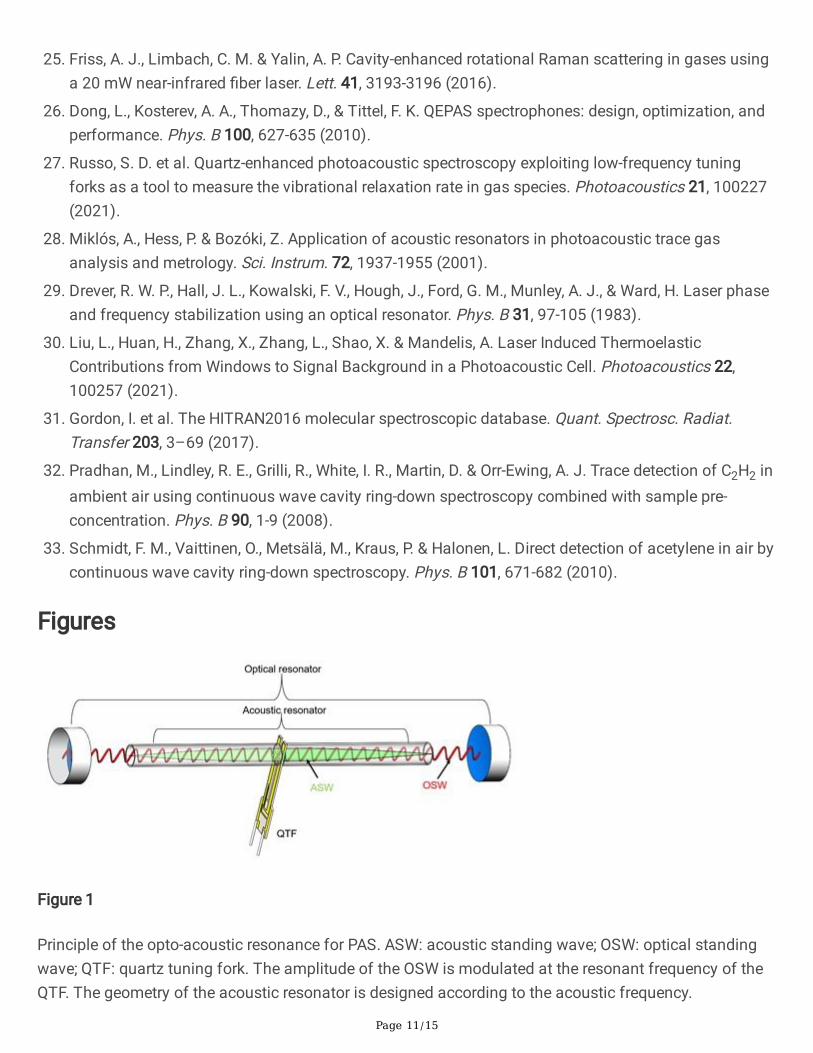
Ultra-sensitive gas detection. Figure 4 shows the PAS-1f signal measured by the photoacoustic sensor foran incident optical power of 12 mW. The measurement is performed at 760 Torr for different C2H2
concentrations (100 ppb and 10 ppb in nitrogen balance) and high-purity nitrogen (99.999% purity) whenthe laser wavelength is tuned from 1531.32 nm to 1531.75 nm. The peak values at 1531.59 nm are 4.05mV (100 ppb C2H2) and 0.68 mV (10 ppb C2H2), respectively. Note that the background signal iscontributed by the thermoelastic effect due to unwanted absorption at the optical window and resonatormirror [30]. This background signal has not been subtracted from the PAS-1f signal shown in Fig. 4.Interestingly, due to the excellent signal-to-noise ratio, a neighboring water line near 1531.37 nm emerges,as shown in Fig. 4(b). This is probably due to residual water in the gas chamber after the desiccationprocess (see Methods). Our hypothesis is con�rmed by repeating the measurement with pure nitrogen(water vapor < 0.3 ppm) shown in Fig. 4(c). To reduce the measurement uncertainty, a multi-spectral�tting method, with prior knowledge of infrared spectra from the HITRAN database [31], is implemented.Hence, the background signal is automatically eliminated during the �tting procedure.
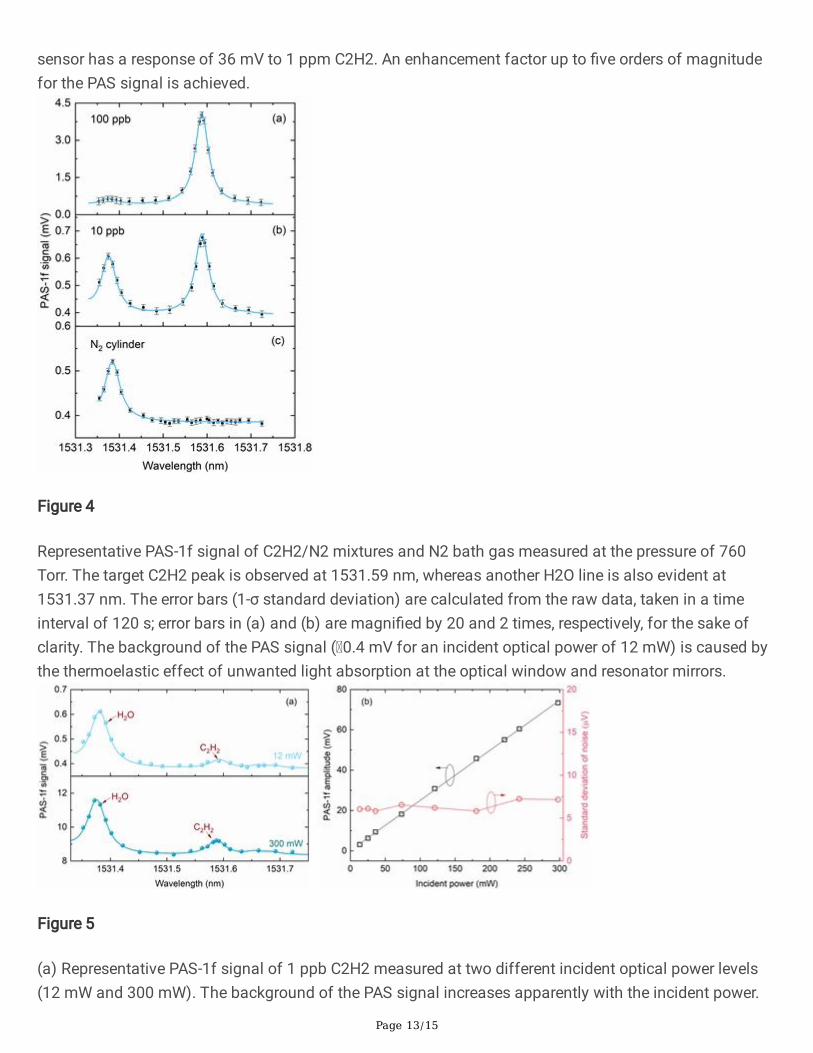
The relationship between the PAS-1f signal and incident laser power is also investigated. Figure 5(a)compares the PAS-1f signal at 1 ppb C2H2 under two different incident power levels (12 mW and 300mW). The peak value of the PAS-1f signal is increased by a factor of about 22.5 when the incident laserpower is increased from 12 mW to 300 mW (a factor of 25). The slight deviation of the enhancementfactor between laser power and PAS signal is due to the variation of the optical coupling e�ciency. Byrepeating the measurement at 100 ppb C2H2, Fig. 5(b) shows the variation of the PAS-1f amplitude withthe incident optical power. The sensor signal increases almost linearly (0.25 mV/mW) with the incidentpower. In contrast, the noise level remains almost unchanged over the entire power range, as shown inFig. 5(b) (1-σ standard deviation of N2 over 120 s). This makes this set-up very promising to furtherincrease detection sensitivity by simply increasing the incident laser power.
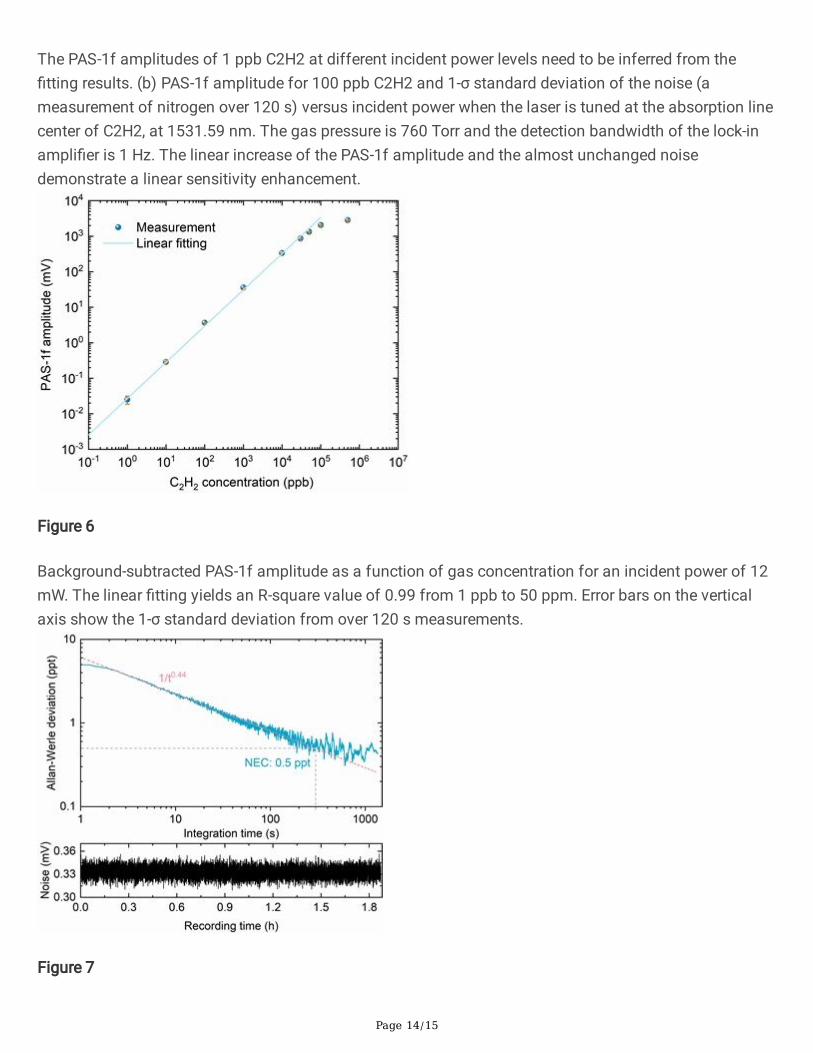
Test of dynamic range and detection limit. The linear response of the sensor is tested at the pressure of760 Torr by �lling the gas chamber with different C2H2/N2 mixtures. Fig. 6 shows the background-subtracted PAS-1f amplitude as a function of C2H2 concentration, varying in a 1 ppb-500 ppm interval.The sensor shows a very good linear response with a slope of 36.4 μV/ppb and an R-square value of 0.99
Page 6/15
from 1 ppb to 50 ppm. However, the sensor deviates from the linear response at higher C2H2
concentrations due to the apparent degradation of optical �nesse of the optical resonator.
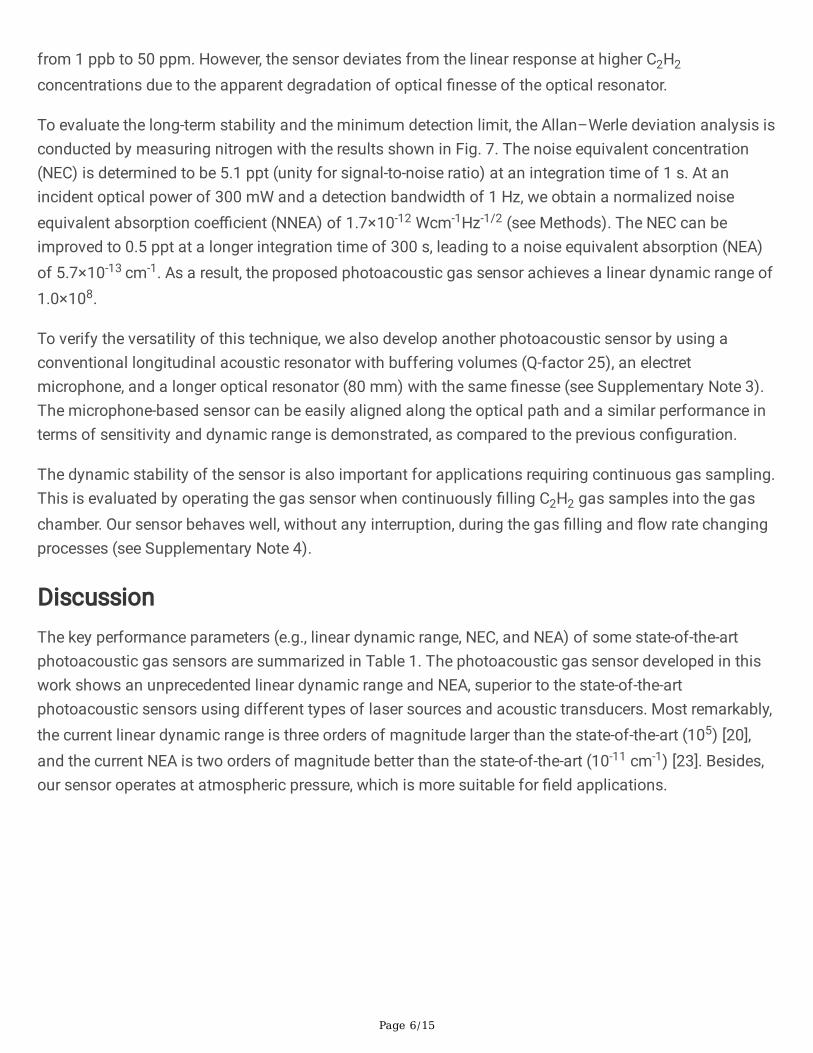
To evaluate the long-term stability and the minimum detection limit, the Allan–Werle deviation analysis isconducted by measuring nitrogen with the results shown in Fig. 7. The noise equivalent concentration(NEC) is determined to be 5.1 ppt (unity for signal-to-noise ratio) at an integration time of 1 s. At anincident optical power of 300 mW and a detection bandwidth of 1 Hz, we obtain a normalized noiseequivalent absorption coe�cient (NNEA) of 1.7×10⁻¹² Wcm-1Hz-1/2 (see Methods). The NEC can beimproved to 0.5 ppt at a longer integration time of 300 s, leading to a noise equivalent absorption (NEA)of 5.7×10⁻¹³ cm-1. As a result, the proposed photoacoustic gas sensor achieves a linear dynamic range of1.0×108.
To verify the versatility of this technique, we also develop another photoacoustic sensor by using aconventional longitudinal acoustic resonator with buffering volumes (Q-factor 25), an electretmicrophone, and a longer optical resonator (80 mm) with the same �nesse (see Supplementary Note 3).The microphone-based sensor can be easily aligned along the optical path and a similar performance interms of sensitivity and dynamic range is demonstrated, as compared to the previous con�guration.
The dynamic stability of the sensor is also important for applications requiring continuous gas sampling.This is evaluated by operating the gas sensor when continuously �lling C2H2 gas samples into the gaschamber. Our sensor behaves well, without any interruption, during the gas �lling and �ow rate changingprocesses (see Supplementary Note 4).
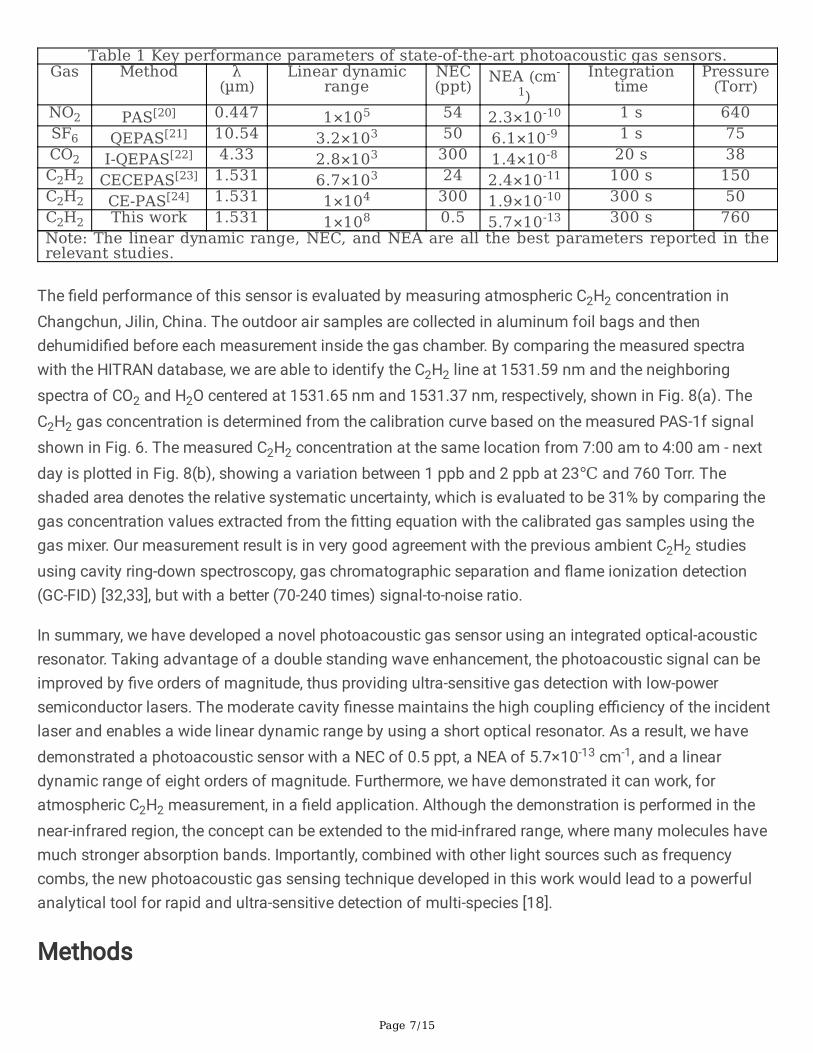
DiscussionThe key performance parameters (e.g., linear dynamic range, NEC, and NEA) of some state-of-the-artphotoacoustic gas sensors are summarized in Table 1. The photoacoustic gas sensor developed in thiswork shows an unprecedented linear dynamic range and NEA, superior to the state-of-the-artphotoacoustic sensors using different types of laser sources and acoustic transducers. Most remarkably,the current linear dynamic range is three orders of magnitude larger than the state-of-the-art (105) [20],and the current NEA is two orders of magnitude better than the state-of-the-art (10-11 cm-1) [23]. Besides,our sensor operates at atmospheric pressure, which is more suitable for �eld applications.
Page 7/15
Table 1 Key performance parameters of state-of-the-art photoacoustic gas sensors.Gas Method λ
(µm)Linear dynamic
rangeNEC(ppt) NEA (cm-
1)Integration
timePressure
(Torr)NO2 PAS[20] 0.447 1×10⁵ 54 2.3×10⁻¹⁰ 1 s 640SF6 QEPAS[21] 10.54 3.2×10³ 50 6.1×10⁻⁹ 1 s 75CO2 I-QEPAS[22] 4.33 2.8×10³ 300 1.4×10⁻⁸ 20 s 38C2H2 CECEPAS[23] 1.531 6.7×10³ 24 2.4×10⁻¹¹ 100 s 150C2H2 CE-PAS[24] 1.531 1×10⁴ 300 1.9×10⁻¹⁰ 300 s 50C2H2 This work 1.531 1×10⁸ 0.5 5.7×10⁻¹³ 300 s 760Note: The linear dynamic range, NEC, and NEA are all the best parameters reported in therelevant studies.
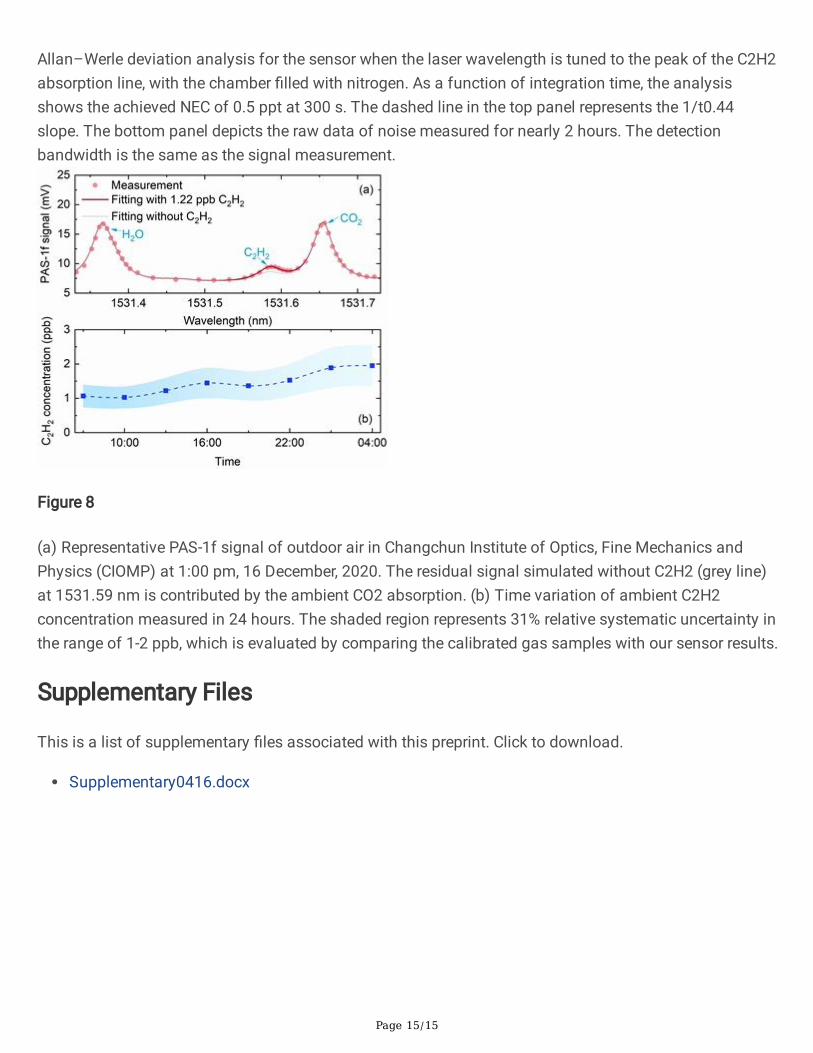
The �eld performance of this sensor is evaluated by measuring atmospheric C2H2 concentration inChangchun, Jilin, China. The outdoor air samples are collected in aluminum foil bags and thendehumidi�ed before each measurement inside the gas chamber. By comparing the measured spectrawith the HITRAN database, we are able to identify the C2H2 line at 1531.59 nm and the neighboringspectra of CO2 and H2O centered at 1531.65 nm and 1531.37 nm, respectively, shown in Fig. 8(a). TheC2H2 gas concentration is determined from the calibration curve based on the measured PAS-1f signalshown in Fig. 6. The measured C2H2 concentration at the same location from 7:00 am to 4:00 am - nextday is plotted in Fig. 8(b), showing a variation between 1 ppb and 2 ppb at 23℃ and 760 Torr. Theshaded area denotes the relative systematic uncertainty, which is evaluated to be 31% by comparing thegas concentration values extracted from the �tting equation with the calibrated gas samples using thegas mixer. Our measurement result is in very good agreement with the previous ambient C2H2 studiesusing cavity ring-down spectroscopy, gas chromatographic separation and �ame ionization detection(GC-FID) [32,33], but with a better (70-240 times) signal-to-noise ratio.
In summary, we have developed a novel photoacoustic gas sensor using an integrated optical-acousticresonator. Taking advantage of a double standing wave enhancement, the photoacoustic signal can beimproved by �ve orders of magnitude, thus providing ultra-sensitive gas detection with low-powersemiconductor lasers. The moderate cavity �nesse maintains the high coupling e�ciency of the incidentlaser and enables a wide linear dynamic range by using a short optical resonator. As a result, we havedemonstrated a photoacoustic sensor with a NEC of 0.5 ppt, a NEA of 5.7×10⁻¹³ cm-1, and a lineardynamic range of eight orders of magnitude. Furthermore, we have demonstrated it can work, foratmospheric C2H2 measurement, in a �eld application. Although the demonstration is performed in thenear-infrared region, the concept can be extended to the mid-infrared range, where many molecules havemuch stronger absorption bands. Importantly, combined with other light sources such as frequencycombs, the new photoacoustic gas sensing technique developed in this work would lead to a powerfulanalytical tool for rapid and ultra-sensitive detection of multi-species [18].
Methods
Page 8/15
Selection of �nesse for the optical resonator. The �nesse of the optical resonator needs to be properlyselected in this work. First, the selection of a higher �nesse theoretically provides a larger powerenhancement factor. However, the linewidth of the cavity mode decreases with the increased �nesse,making it more challenging to achieve a high coupling e�ciency of the laser into the optical resonator.Second, the linear dynamic range of the sensor is affected by the �nesse. The �nesse is determined bythe round-trip loss inside the optical resonator which includes the mirror transmission and absorption,gas absorption, and loss induced by the acoustic module. The �nesse increases with the larger re�ectivityof cavity mirrors, but it decreases apparently when the loss induced by gas absorption becomescomparable. Hence, the physical length of the optical resonator should be selected as short as possible tominimize the gas-absorption loss inside the cavity. In this work, a moderate �nesse of about 4000 (mirrorre�ectivity, 99.923%) and a physical length of 60 mm is used.
Calibration of intracavity laser power. According to the main text, the optical resonator enhances thephotoacoustic signal by a factor of 980. Considering the 84% coupling e�ciency, the intracavity powerenhancement factor is 1166, which is slightly lower than the theoretical buildup factor of 1300. This isprobably due to the extra cavity loss caused by the QTF. As the empty cavity has a �nesse of 4078, anadditional loss of 0.017% can deteriorate the buildup factor from 1300 to 1166. When the incident poweris adjusted from 12 mW to 300 mW, there is an extra 10% degradation of coupling e�ciency. Hence, themaximum of the intracavity power is determined to be 264 W.
Gas chamber dehumidi�cation. To mitigate the interference of the residual water molecules inside thevacuum cavity, the gas chamber is heated to 60oC and purged continuously by dry nitrogen for severalhours. To protect the QTF which is quite close to the acoustic resonator, the heating temperature iscontrolled not quite high. It is possible to have some residual water inside the chamber.
NNEA calculation. The NNEA coe�cient can be calculated by the following equation:
where αmin is the noise equivalent absorption (NEA) coe�cient, Win is the incident power and BW is thedetection bandwidth. With the NEC of 5.1 ppt in Fig. 7, NEA can be easily obtained by referencing to theHITRAN database [31]. The incident power is 300 mW. Together with the detection bandwidth of 1 Hz, theNNEA of 1.7×10⁻¹² Wcm-1Hz-1/2 can be calculated.
DeclarationsData availability
The data that support the �ndings within this paper are available from the corresponding authors uponreasonable request.
Page 9/15
Acknowledgements
This research was supported by the Strategic Priority Research Program of Chinese Academy of Sciences(XDA17040513, XDA22020502), National Natural Science Foundation of China (NSFC) (51776179,62005267), General Research Fund (14209220) from the University Grants Committee, Seed Project(ITS/242/19) from the Innovation and Technology Commission. We thank Professor Vincenzo Spagnolofrom the Technical University of Bari for providing us the custom QTF.
Author contributions
Z.W., Q.W. and W.R. conceived the idea, designed the experiments, discussed the results and prepared themanuscript. Z.W. built the systems and conducted the experiments. H.Z. and Q.W. assisted in building thesystems and conducting the experiments. S.B., I.G. and P.D.N. assisted in the PDH locking and opticalcoupling. W.R. and Q.W. supervised and coordinated the project.
Competing interests
The authors declare no competing interests.
Additional information
Supplementary information is available for this paper.
Correspondence and requests for materials should be addressed to Q.W. or W.R.
References1. Kreuzer, L. B. & Patel, C. K. N. Nitric oxide air pollution: detection by optoacoustic spectroscopy.
Science 173, 45-47 (1971).
2. Rieker, G. B. et al. Frequency-comb-based remote sensing of greenhouse gases over kilometer airpaths. Optica 1, 290-298 (2014).
3. Kort, E. A. et al. Atmospheric observations of Arctic Ocean methane emissions up to 82 north. Geosci.5, 318-321 (2012).
4. Thornton, B. F., Prytherch, J., Andersson, K., Brooks, I. M., Salisbury, D., Tjernström, M. & Crill, P. M.Shipborne eddy covariance observations of methane �uxes constrain Arctic sea emissions. Adv. 6,eaay7934 (2020).
5. Adato, R. & Altug, H. In-situ ultra-sensitive infrared absorption spectroscopy of biomoleculeinteractions in real time with plasmonic nanoantennas. Commun. 4, 1-10 (2013).
�. Galli, I. et al. Spectroscopic detection of radiocarbon dioxide at parts-per-quadrillion sensitivity.Optica 3, 385-388 (2016).
7. Wang, C. & Sahay, P. Breath analysis using laser spectroscopic techniques: breath biomarkers,spectral �ngerprints, and detection limits. Sensors 9, 8230-8262 (2009).
Page 10/15
�. Thorpe, M. J. et al. Cavity-enhanced optical frequency comb spectroscopy: application to humanbreath analysis. Express 16, 2387-2397 (2008).
9. Nelson, D. D. et al. Characterization of a near-room-temperature, continuous-wave quantum cascadelaser for long-term, unattended monitoring of nitric oxide in the atmosphere. Lett. 31, 2012-2014(2006).
10. Ye, J., Ma, L. S. & Hall, J. L. Ultrasensitive detections in atomic and molecular physics: demonstrationin molecular overtone spectroscopy. Opt. Soc. Am. B 15, 6-15 (1998).
11. Delli Santi, M.G., Bartalini, S., Cancio, P., Galli, I., Giusfredi, G., Haraldsson, C., Mazzotti, D., Pesonen, A.& De Natale, P., Biogenic Fraction Determination in Fuel Blends by Laser‐Based 14CO2 Adv. PhotonicsRes. 2, 2000069 (2021).
12. Liu, K., Mei, J., Zhang, W., Chen, W. & Gao, X. Multi-resonator photoacoustic spectroscopy. Actuat. BChem. 251, 632-636 (2017).
13. Wu, H. et al. Beat frequency quartz-enhanced photoacoustic spectroscopy for fast and calibration-free continuous trace-gas monitoring. Commun. 8, 1-8 (2017).
14. Tomberg, T., Vainio, M., Hieta, T. & Halonen, L. Sub-parts-per-trillion level sensitivity in trace gasdetection by cantilever-enhanced photo-acoustic spectroscopy. Rep. 8, 1-7 (2018).
15. Wu, H. et al. Quartz enhanced photoacoustic H2S gas sensor based on a �ber-ampli�er source and acustom tuning fork with large prong spacing. Phys. Lett. 107, 111104 (2015).
1�. Zheng, H. et al. Single-tube on-beam quartz-enhanced photoacoustic spectroscopy. Lett. 41, 978-981(2016).
17. Wang, Q., Wang, Z., Ren, W., Patimisco, P., Sampaolo, A. & Spagnolo, V. Fiber-ring laser intracavityQEPAS gas sensor using a 7.2 kHz quartz tuning fork. Actuat. B Chem. 268, 512-518 (2018).
1�. Wildi, T., Voumard, T., Brasch, V., Yilmaz, G. & Herr, T. Photo-acoustic dual-frequency combspectroscopy. Commun. 11, 1-6 (2020).
19. Xiong, L., Bai, W., Chen, F., Zhao, X., Yu, F. & Diebold, G. J. Photoacoustic trace detection of gases atthe parts-per-quadrillion level with a moving optical grating. Natl Acad. Sci. 114, 7246-7249 (2017).
20. Yin, X. et al. Sub-ppb nitrogen dioxide detection with a large linear dynamic range by use of adifferential photoacoustic cell and a 3.5 W blue multimode diode laser. Actuat. B Chem. 247, 329-335(2017).
21. Spagnolo, V. et al. Part-per-trillion level SF6 detection using a quartz enhanced photoacousticspectroscopy-based sensor with single-mode �ber-coupled quantum cascade laser excitation. Lett.37, 4461-4463 (2012).
22. Borri, S. et al. Intracavity quartz-enhanced photoacoustic sensor. Phys. Lett. 104, 091114 (2014).
23. Tomberg, T., Hieta, T., Vainio, M. & Halonen, L. Cavity-enhanced cantileverenhanced photo-acousticspectroscopy. Analyst 144, 2291–2296 (2019)
24. Wang, Z., Wang, Q., Zhang, W., Wei, H., Li, Y. & Ren, W. Ultrasensitive photoacoustic detection in ahigh-�nesse cavity with Pound–Drever–Hall locking. Lett. 44, 1924-1927 (2019).
Page 11/15
25. Friss, A. J., Limbach, C. M. & Yalin, A. P. Cavity-enhanced rotational Raman scattering in gases usinga 20 mW near-infrared �ber laser. Lett. 41, 3193-3196 (2016).
2�. Dong, L., Kosterev, A. A., Thomazy, D., & Tittel, F. K. QEPAS spectrophones: design, optimization, andperformance. Phys. B 100, 627-635 (2010).
27. Russo, S. D. et al. Quartz-enhanced photoacoustic spectroscopy exploiting low-frequency tuningforks as a tool to measure the vibrational relaxation rate in gas species. Photoacoustics 21, 100227(2021).
2�. Miklós, A., Hess, P. & Bozóki, Z. Application of acoustic resonators in photoacoustic trace gasanalysis and metrology. Sci. Instrum. 72, 1937-1955 (2001).
29. Drever, R. W. P., Hall, J. L., Kowalski, F. V., Hough, J., Ford, G. M., Munley, A. J., & Ward, H. Laser phaseand frequency stabilization using an optical resonator. Phys. B 31, 97-105 (1983).
30. Liu, L., Huan, H., Zhang, X., Zhang, L., Shao, X. & Mandelis, A. Laser Induced ThermoelasticContributions from Windows to Signal Background in a Photoacoustic Cell. Photoacoustics 22,100257 (2021).
31. Gordon, I. et al. The HITRAN2016 molecular spectroscopic database. Quant. Spectrosc. Radiat.Transfer 203, 3–69 (2017).
32. Pradhan, M., Lindley, R. E., Grilli, R., White, I. R., Martin, D. & Orr-Ewing, A. J. Trace detection of C2H2 inambient air using continuous wave cavity ring-down spectroscopy combined with sample pre-concentration. Phys. B 90, 1-9 (2008).
33. Schmidt, F. M., Vaittinen, O., Metsälä, M., Kraus, P. & Halonen, L. Direct detection of acetylene in air bycontinuous wave cavity ring-down spectroscopy. Phys. B 101, 671-682 (2010).
Figures
Figure 1
Principle of the opto-acoustic resonance for PAS. ASW: acoustic standing wave; OSW: optical standingwave; QTF: quartz tuning fork. The amplitude of the OSW is modulated at the resonant frequency of theQTF. The geometry of the acoustic resonator is designed according to the acoustic frequency.

Page 12/15
Figure 2
Schematic of the photoacoustic sensor with opto-acoustic resonance. ECDL, external cavity diode laser;EOM, electro-optic modulator; FC, �ber collimator; 1/4 λ, quarter-wave plate; 1/2 λ, half-wave plate; PBS,polarization beam splitter; PD, photodetector; PZT, piezo transducer. The opto-acoustic resonance elementhas the same con�guration as that shown in Fig. 1, which is enclosed in a gas chamber. Inset: photo ofthe opto-acoustic resonance setup inside the gas chamber.
Figure 3
PAS-1f signal measured by three different con�gurations: (a) bare QTF, (b) QTF with acoustic resonator,and (c) QTF with acoustic and optical resonators. The amplitude of the single-pass PAS signal at 2%C2H2 using the bare QTF is about 4.24 mV. Bene�tting from the double standing wave enhancement, the
Page 13/15
sensor has a response of 36 mV to 1 ppm C2H2. An enhancement factor up to �ve orders of magnitudefor the PAS signal is achieved.
Figure 4
Representative PAS-1f signal of C2H2/N2 mixtures and N2 bath gas measured at the pressure of 760Torr. The target C2H2 peak is observed at 1531.59 nm, whereas another H2O line is also evident at1531.37 nm. The error bars (1-σ standard deviation) are calculated from the raw data, taken in a timeinterval of 120 s; error bars in (a) and (b) are magni�ed by 20 and 2 times, respectively, for the sake ofclarity. The background of the PAS signal ( 0.4 mV for an incident optical power of 12 mW) is caused bythe thermoelastic effect of unwanted light absorption at the optical window and resonator mirrors.
Figure 5
(a) Representative PAS-1f signal of 1 ppb C2H2 measured at two different incident optical power levels(12 mW and 300 mW). The background of the PAS signal increases apparently with the incident power.
Page 14/15
The PAS-1f amplitudes of 1 ppb C2H2 at different incident power levels need to be inferred from the�tting results. (b) PAS-1f amplitude for 100 ppb C2H2 and 1-σ standard deviation of the noise (ameasurement of nitrogen over 120 s) versus incident power when the laser is tuned at the absorption linecenter of C2H2, at 1531.59 nm. The gas pressure is 760 Torr and the detection bandwidth of the lock-inampli�er is 1 Hz. The linear increase of the PAS-1f amplitude and the almost unchanged noisedemonstrate a linear sensitivity enhancement.
Figure 6
Background-subtracted PAS-1f amplitude as a function of gas concentration for an incident power of 12mW. The linear �tting yields an R-square value of 0.99 from 1 ppb to 50 ppm. Error bars on the verticalaxis show the 1-σ standard deviation from over 120 s measurements.
Figure 7
Page 15/15
Allan–Werle deviation analysis for the sensor when the laser wavelength is tuned to the peak of the C2H2absorption line, with the chamber �lled with nitrogen. As a function of integration time, the analysisshows the achieved NEC of 0.5 ppt at 300 s. The dashed line in the top panel represents the 1/t0.44slope. The bottom panel depicts the raw data of noise measured for nearly 2 hours. The detectionbandwidth is the same as the signal measurement.
Figure 8
(a) Representative PAS-1f signal of outdoor air in Changchun Institute of Optics, Fine Mechanics andPhysics (CIOMP) at 1:00 pm, 16 December, 2020. The residual signal simulated without C2H2 (grey line)at 1531.59 nm is contributed by the ambient CO2 absorption. (b) Time variation of ambient C2H2concentration measured in 24 hours. The shaded region represents 31% relative systematic uncertainty inthe range of 1-2 ppb, which is evaluated by comparing the calibrated gas samples with our sensor results.
Supplementary Files
This is a list of supplementary �les associated with this preprint. Click to download.
Supplementary0416.docx