detection qualification and types of detectors in...
TRANSCRIPT

Detection Qualification and Types of Detectors in HPLC
Dr. Shulamit Levin
Detection in HPLC
Dr. Shulamit Levin,
Tra
nsm
itta
nce
%
Ab
sorb
ance
AU
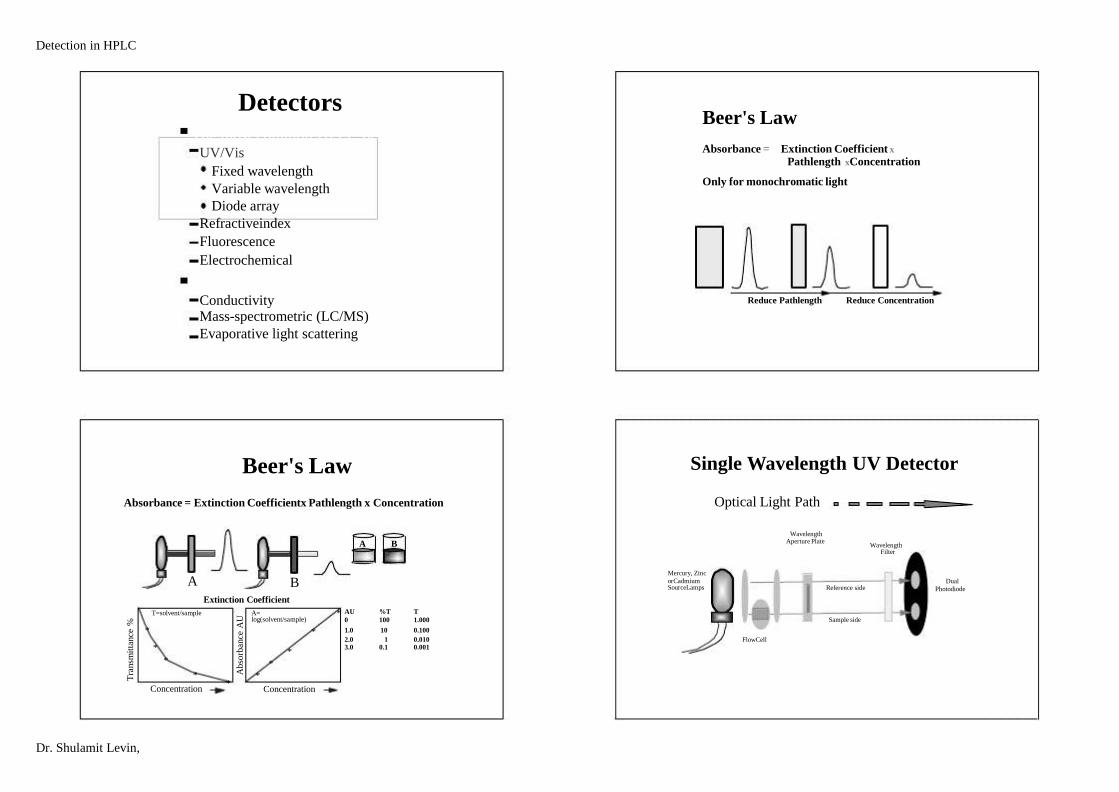
Conductivity Mass-spectrometric (LC/MS)
Evaporative light scattering
Detectors The most common HPLC detectors: UV/Vis
Fixed wavelength
Variable wavelength
Diode array
Refractiveindex
Fluorescence
Electrochemical
Less common:
Reduce Pathlength Reduce Concentration
Beer's Law Absorbance = Extinction Coefficient x
Pathlength xConcentration
Only for monochromatic light
Beer's Law Absorbance = Extinction Coefficientx Pathlength x Concentration
A B Extinction Coefficient
AU
0
%T
100
T
1.000
1.0 10 0.100
2.0 3.0
1 0.1
0.010 0.001
T=solvent/sample A= log(solvent/sample)
A B
*
*
*
*
Concentration *
*
*
*
*
Concentration
*
Mercury, Zinc
orCadmium SourceLamps
Dual
Photodiode
Sample side
Reference side
Single Wavelength UV Detector Optical Light Path
Wavelength
Aperture Plate Wavelength
Filter
FlowCell
Detection in HPLC
Dr. Shulamit Levin,
AM
Q
Gly
cin
e G
luta
min
e
Asp
arti
c A
cid
Glu
tam
ic A
cid
His
tidin
e A
rgin
ine Th
reon
ine
Ala
nin
e
Pro
lin
e
Alp
ha-
amin
obuty
ric
acid
Hyd
roxyp
roli
ne
Ser
ine
Isole
uci
ne
Orn
ithin
e L
euci
ne Lys
ine
Ab
sorb
an
ce
Ab
sorb
an
ce
Try
pto
ph
an
Ph
enyl
alan
ine
Tyr
osi
ne
Cys
teic
Aci
d
Vai
ne
Mte
hio
nin
e
Asp
arag
ine
NH
3
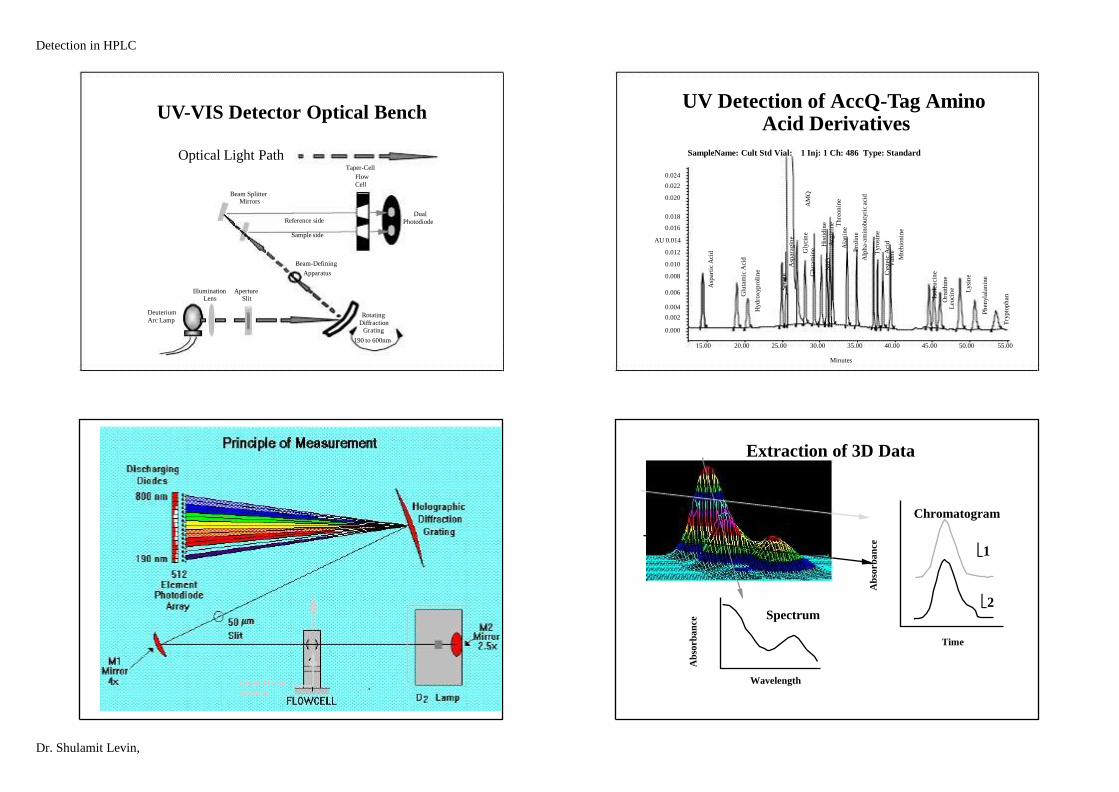
Deuterium
Arc Lamp Rotating
Diffraction Grating
190 to 600nm
Flow
Cell
Beam Splitter Mirrors
Dual
Photodiode
Aperture Slit Illumination Lens
UV-VIS Detector Optical Bench Optical Light Path Taper-Cell
Reference side
Sample side
Beam-Defining Apparatus
UV Detection of AccQ-Tag Amino Acid Derivatives SampleName: Cult Std Vial: 1 Inj: 1 Ch: 486 Type: Standard
0.004
0.002
0.000
0.006
0.024
0.022
0.020
15.00 20.00 25.00 30.00 35.00 40.00 45.00 50.00 55.00
0.018 0.016
AU 0.014 0.012 0.010 0.008
Liquid from column
Wavelength
Spectrum
Time
Minutes Extraction of 3D Data Chromatogram
1
2
Detection in HPLC
Dr. Shulamit Levin,
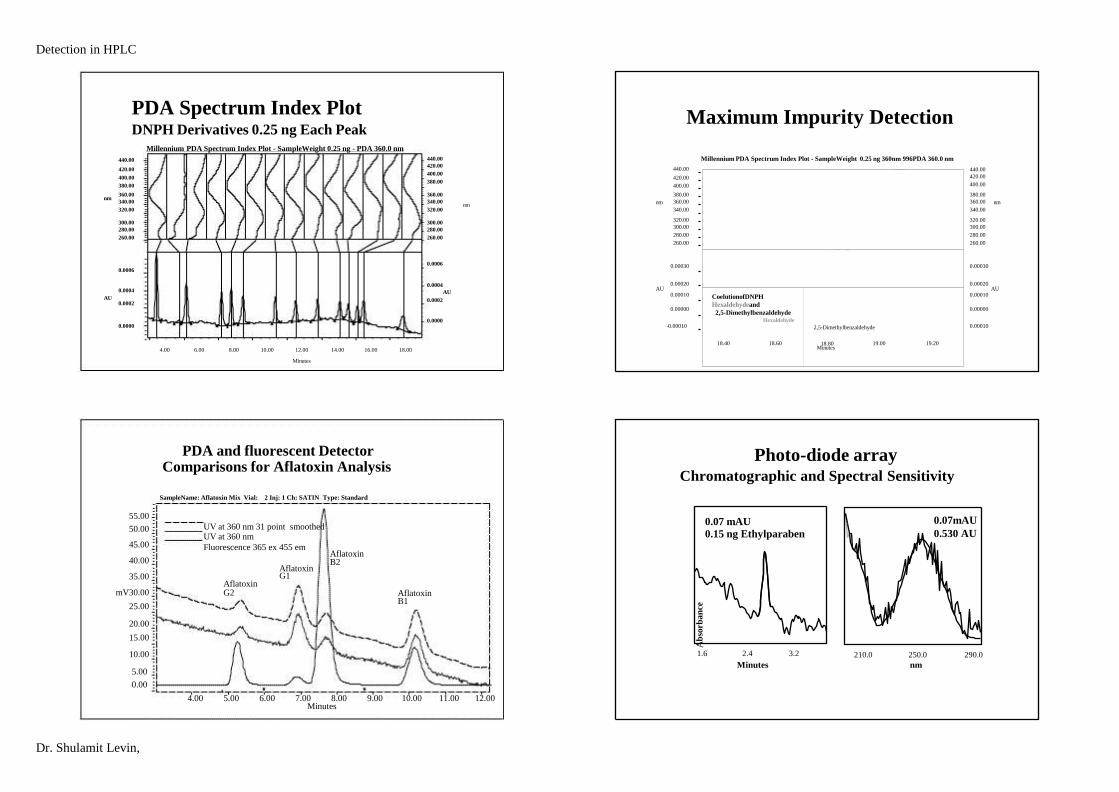
CoelutionofDNPH
Hexaldehydeand
2,5-Dimethylbenzaldehyde Hexaldehyde
2,5-Dimethylbenzaldehyde
Ab
sorb
an
ce
nm
4.00 6.00 8.00 10.00 12.00 14.00 16.00 18.00
360.00
340.00
320.00
360.00
340.00
320.00
440.00
420.00
400.00
380.00
nm
0.0000 0.0000
0.0004
0.0002
300.00
280.00
260.00 0.0006
300.00
280.00
260.00 0.0006
AU
0.0004 AU
0.0002
380.00
360.00
340.00
380.00
360.00
340.00
440.00
420.00
400.00
nm nm
-0.00010 0.00010
0.00020
0.00010
0.00000
0.00020
0.00010
0.00000
320.00 300.00 280.00 260.00 0.00030
320.00
300.00
280.00
260.00 0.00030
18.40 18.60 18.80 Minutes
19.00 19.20
AU AU
Maximum Impurity Detection Millennium PDA Spectrum Index Plot - SampleWeight 0.25 ng 360nm 996PDA 360.0 nm
440.00
420.00
400.00
Minutes PDA and fluorescent Detector Comparisons for Aflatoxin Analysis SampleName: Aflatoxin Mix Vial: 2 Inj: 1 Ch: SATIN Type: Standard
5.00
0.00
10.00
20.00
15.00
4.00 5.00 6.00 7.00 8.00 9.00 10.00 11.00 12.00
55.00
50.00
45.00
40.00
35.00
mV30.00
25.00
Minutes
Aflatoxin B1
UV at 360 nm 31 point smoothed UV at 360 nm
Fluorescence 365 ex 455 em Aflatoxin B2 Aflatoxin G1 Aflatoxin G2
Photo-diode array Chromatographic and Spectral Sensitivity
1.6 2.4 3.2
Minutes
0.07 mAU
0.15 ng Ethylparaben
210.0 250.0 290.0
nm
0.07mAU
0.530 AU
Detection in HPLC PDA Spectrum Index Plot DNPH Derivatives 0.25 ng Each Peak Millennium PDA Spectrum Index Plot - SampleWeight 0.25 ng - PDA 360.0 nm 440.00 420.00 400.00 380.00
Dr. Shulamit Levin,
Fluorescence Electrochemical
Less common:
Conductivity
Mass-spectrometric (LC/MS)
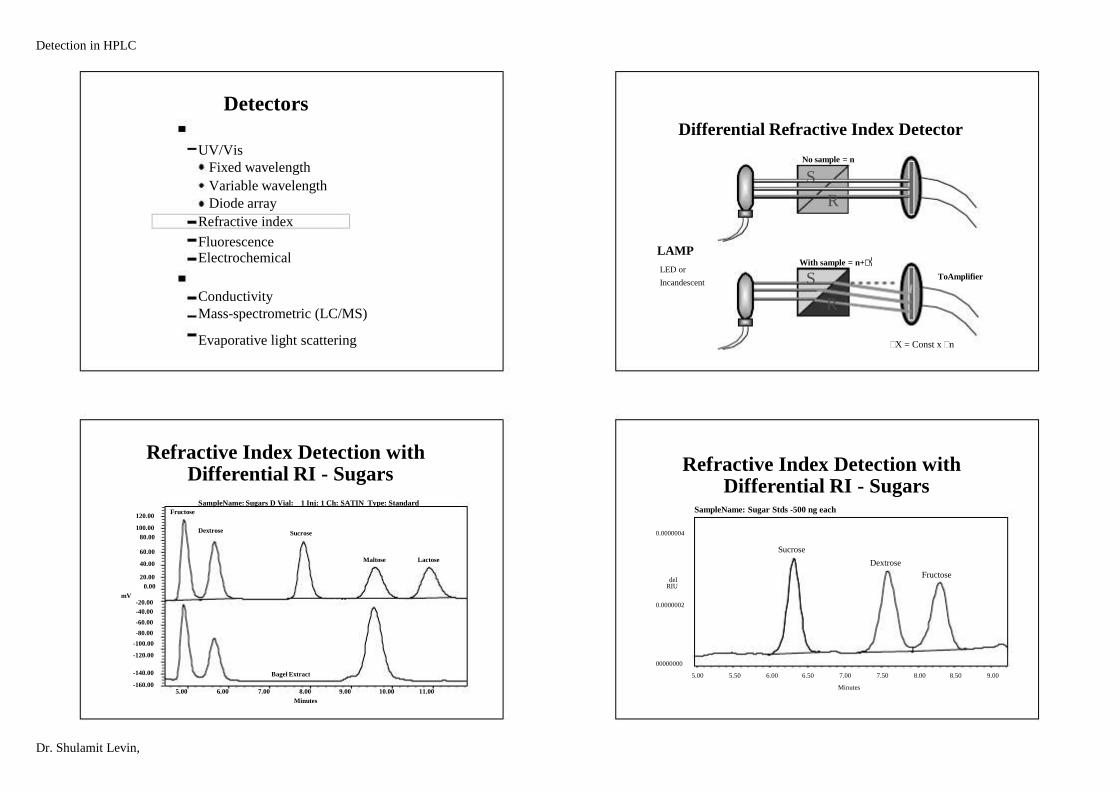
Detectors
The most common HPLC detectors:
UV/Vis
Fixed wavelength
Variable wavelength
Diode array
Refractive index
LAMP
LED or
Incandescent ToAmplifier
With sample = n+�
S
R
Differential Refractive Index Detector No sample = n
S
R
-160.00
-140.00
-20.00 -40.00 -60.00 -80.00
-100.00
-120.00
20.00 0.00
40.00
60.00
100.00 80.00
120.00
5.00 6.00 7.00 8.00 9.00 10.00 11.00
mV
Minutes
Fructose
Dextrose Sucrose
Maltose Lactose
Evaporative light scattering Refractive Index Detection with Differential RI - Sugars SampleName: Sugars D Vial: 1 Inj: 1 Ch: SATIN Type: Standard
Bagel Extract
�X = Const x �n
Refractive Index Detection with Differential RI - Sugars
SampleName: Sugar Stds -500 ng each
5.00 5.50 6.00 6.50 7.00 7.50 8.00 8.50 9.00
Minutes
Sucrose
Dextrose
Fructose
0.0000002 00000000
0.0000004
del RIU
Detection in HPLC
Dr. Shulamit Levin,

1260000
190000
96400
10300
5570
2890000
Del
RIU
50.00 0.00
150.00
100.00
550.00
500.00
450.00
400.00
350.00
300.00
250.00
200.00
700.00
650.00
600.00
20.00 22.00 24.00 26.00 28.00 30.00
MV
Dow 1683 18.00
192300
5.0 7.0 8.0 6.0 Minutes
1 2
Sensitivity Refractive Index Detector 250 ng on column
1=Tristearin
2=Myristic acid
Styragel HR 0.5, 4.6 x 300 mm,
35°C, 0.35 mL/min dRI sensitivity =
32X, 32°C
Fixed wavelength
Minutes Detectors
The most common HPLC detectors:
UV/Vis
Fluorescence Detectors
Excitation filter
Cell
LAMP Emission filter
Photomultiplier
Short pass - transmits all wavelengths below a specified cutoff
Long pass - transmits all wavelengths above a specified cutoff
Band pass - blocks all wavelengths outside a specified band
Detection in HPLC Refractive Index Detection with
Differential RI - Polymers SampleName: GPC STDS
800.00 750.00
Variable wavelength Diode array
Refractiveindex
Fluorescence
Electrochemical
Less common: Conductivity
Mass-spectrometric (LC/MS)
Evaporative light scattering Dr. Shulamit Levin,

Res
po
nse
LAMP
Fluorescence Detector Optical Bench Photomultiplier
Emission
Grating
Excitation Grating
Mirror
Torroidal Mirror
Beam Splittter
Flow Cell
tube
Mirror
Photo
diode Excitation Slit
Emission Slit
Torroidal Mirror
Sensitivity Fluorescence Detector
0.1 pg Anthracene
Excitation = 251 nm
Emission = 406 nm
0.0 1.0 2.0 3.0 4.0 5.0
5 mV
mV
20.00 40.00
Minutes
60.00
Fluorescence vs. UV Detection AMQ
AccQ-Tag aminoacid
analysis
Fluorescence
Excitation=250 nm
Emission=395 nm
UV 254 nm
Evaporative light scattering
Minutes Detectors
The most common HPLC detectors:
UV/Vis
Fixed wavelength
Variable wavelength
Diode array
Refractiveindex
Fluorescence
Electrochemical
Less common: Conductivity
Mass-spectrometric (LC/MS)
Detection in HPLC
Dr. Shulamit Levin,

Electrochemical Detector
Reference Electrode
Working Electrode
Analyte is oxidized or reduced
+ -
Electrolyte (mobile phase) Auxiliary Electrode
As compounds are oxidized or reduced, a current proportional to concentration is produced.
Electrochemical Detection of
Catecholamines & Related Compounds
1.
2.
Norepinepherine
Epinepherine
150ppb
200ppb
3.
4.
Normetanepherine
Dopamine
50 ppb
200ppb
5.
6.
7.
Metanepherine
3-Methoxytyramine
4-Methoxytyramine
200ppb 75 ppb 500 ppb
2.00 4.00 6.00 8.00 10.00 12.00
Minutes
0.00
nAmps
1 2
3
4 5
6
7
Pulsed Amperometric Detection of Monosaccharides
1.
2.
3.
4.
5.
Fucose
Galactosamine
Glucosamine
Galactose
Glucose
6. Mannose
20.00 Minutes
mV
0.00 5.00
300
1 2
3 4
5
6
UV/Vis
Fixed wavelength
Variable wavelength
Diode array Refractiveindex
Fluorescence
Electrochemical
Less common: Conductivity
Mass-spectrometric (LC/MS) Evaporative light scattering
Detectors The most common HPLC detectors:
Detection in HPLC
Dr. Shulamit Levin,
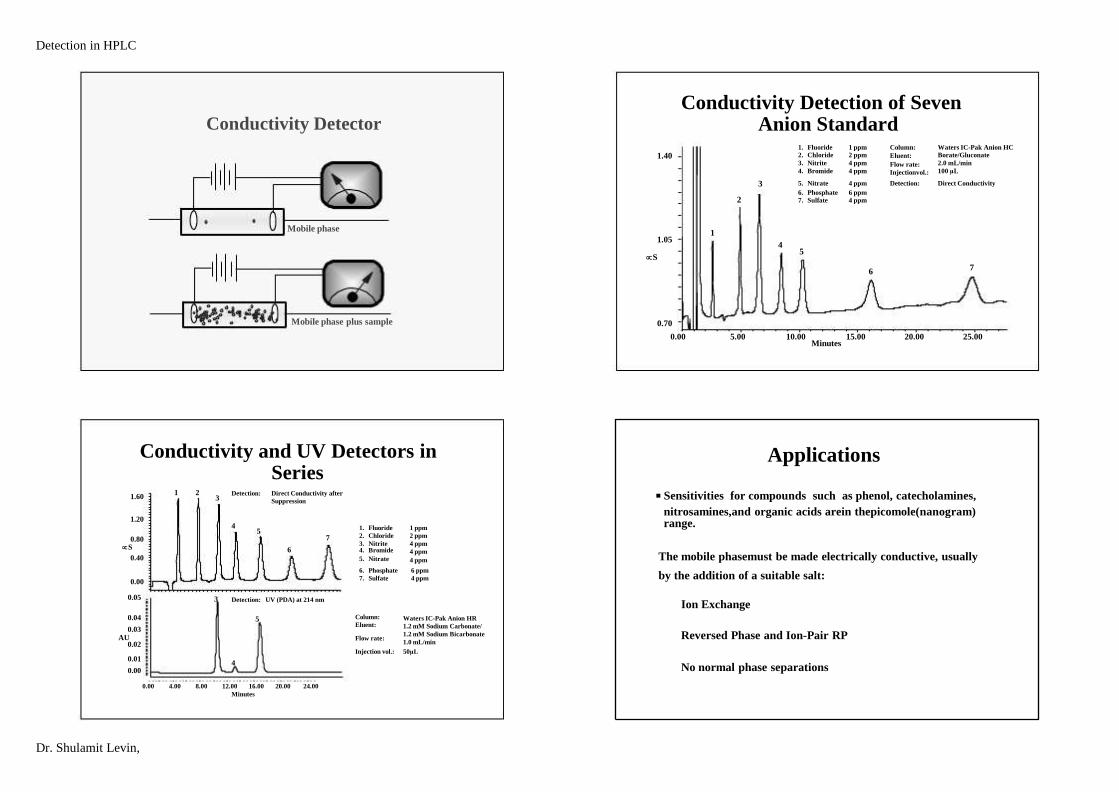
Conductivity Detector
Mobile phase
Mobile phase plus sample
Conductivity Detection of Seven Anion Standard
0.70
1.05
1.40
S
0.00 5.00 10.00 15.00 20.00 25.00 Minutes
1
2
3
4 5
6 7
1. 2.
3.
4.
Fluoride Chloride
Nitrite
Bromide
5. Nitrate
6. 7.
Phosphate Sulfate
1 ppm 2 ppm
4 ppm
4 ppm
4 ppm
6 ppm 4 ppm
Column:
Eluent:
Flow rate:
Injectionvol.:
Detection:
Waters IC-Pak Anion HC Borate/Gluconate
2.0 mL/min
100 µL
Direct Conductivity
Conductivity and UV Detectors in Series
1.20 0.80 S 0.40
1.60 1 2
3
4 5
6
7
0.00 4.00 8.00 12.00 16.00 20.00 24.00
Minutes
0.01
0.00
0.00
0.05
0.04 0.03 AU 0.02
3
4
5 Column:
Eluent:
Flow rate:
Injection vol.:
Waters IC-Pak Anion HR
1.2 mM Sodium Carbonate/
1.2 mM Sodium Bicarbonate
1.0 mL/min
50µL
Detection: Direct Conductivity after
Suppression
Detection: UV (PDA) at 214 nm
1.
2.
3. 4.
5.
Fluoride
Chloride
Nitrite Bromide
Nitrate
6.
7.
Phosphate
Sulfate
1 ppm
2 ppm
4 ppm
4 ppm
4 ppm
6 ppm
4 ppm
Applications
Sensitivities for compounds such as phenol, catecholamines,
nitrosamines,and organic acids arein thepicomole(nanogram) range. The mobile phasemust be made electrically conductive, usually
by the addition of a suitable salt: Ion Exchange
Reversed Phase and Ion-Pair RP
No normal phase separations
Detection in HPLC
Dr. Shulamit Levin,

beta-emitters and many soft gamma and positron emitters
encounteredin bio-medical researchand pharmaceuticalquality
control.
EVAPORATIVE LIGHT SCATTERING The scattered lightis detected by a
silicone photodiode located at a 90º angle from the laser. The
photodiode produces a signal
which is sent to the analog outputs for collection. A light trap is located 180º from the laser to
collect any light not scattered by
particles in the aerosol stream. How LC-MS Works
Mass
Spectrum
Source Analyzer Ion
Detector
Data
System
LC/MS
Interface
HPLC Separation
Desolvation
Ionization Sorting of Ions Detection Date
Processing
x
Detection in HPLC Detectors
The most common HPLC detectors:
UV/Vis
Fixed wavelength
Variable wavelength
Diode array
Refractiveindex
Fluorescence
Electrochemical
Less common: Conductivity
Mass-spectrometric (LC/MS)
Evaporative light scattering Radioactive Detector Primarily used for the measurement of 3H, 14C, and 32P,
Dr. Shulamit Levin,
D DE ET TE ECT TO OR R
DETECTOR
REFLECTRON MODE
DE ET TE EC C TT OO RR
DETECTOR
REF FL LE EC CT TR RO ON N M O D E MODE
++ +
128.82
2.00 4.00 6.00 8.00 10.00 Time 0
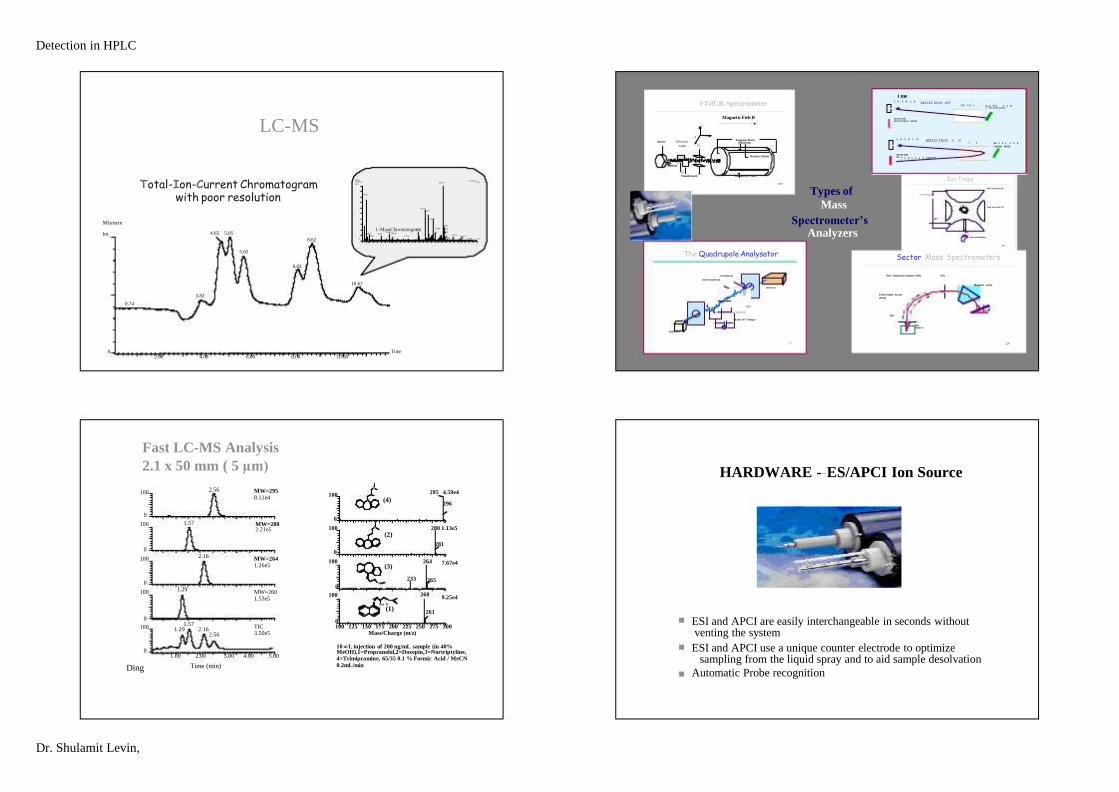
Mixture
Int. 4.65 5.05
3.82
0.74
8.62
5.65
8.02
10.62
Total-Ion-Current Chromatogram with poor resolution
60 m/z 0
1: ScanES+ 4.34e5 262.87
Mix (10.696)
100 59.99
%
195.98
68.92 76.87 80
1: MassChromatogram 120.80 98.85 170.92 100 120 140 160 180 200 220
213.90 222.87
235.87 240.88 240 260
263.87
264.85
267.91 280
287.01 300
309.02 320 333.84 340
LC-MS
ElectronMultiplier
Inlet
End Cap Electrode Ring Electrode, R f
Axial Modulation
Ion Traps + + + ++
Types of
Mass
Spectrometer’s Analyzers
ll r Tiime Off Flliightt Mas ss s Ana aly yzze ers s
S S O O U U R R C C E E
DETECTOR RE
REFLECTRON NO O N N D
LINEAR RMODE E
DRIFT TTUBE E
S S O O U U R R C C E E
DETECTOR REFLECTRON MODE
REFLECTRON OFF C LLIN E A R M O D E
I DRIFT TUB B E E
220
Ion Source
Slit
Magnetic sector
Electrostatic Sector
(ESA)
Detector
Slit Nier -Johnson-Geometry (EB)
190
Sector Mass Spectrometers
199
FT-ICR-Spectrometer
DC
Source
Filament
DC DC Transferoptic Transmitter Plates
Receiver Plates
Elektroden Sender
Trapping Plates Electrodes
Y
Z X
Magnetic Fielt B
77
IonSource
Detector
non resonant Ion
resonant Ion
dcand Rf Voltages
The Quadrupole Analysator
1.00 2.00 3.00
Time (min)
4.00 5.00 0
0
100
0
100
0
100
0
100
100 MW=295 8.11e4
2.56
MW=280 2.21e5
1.57
MW=264 1.26e5
2.16
MW=260 1.53e5
1.29
TIC 3.50e5
1.57 1.29 2.16 2.56
Ding
10 L injection of 200 ng/mL sample (in 40% MeOH),1=Propranolol,2=Doxepin,3=Nortriptyline, 4=Trimipramine, 65/35 0.1 % Formic Acid / MeCN
0.2mL/min
0 100 125 150 175 200 225 250 275 300 Mass/Charge (m/z)
0
100
0
100
100 295 4.59e4 296
280 1.13e5
281 7.67e4 264
233
9.25e4
265
260
261
0
100
O
N
N
N
NH
O N
OH H
(1)
(2)
(3)
(4)
Fast LC-MS Analysis
2.1 x 50 mm ( 5 µm) HARDWARE --ES/APCI Ion Source
ESI and APCI are easily interchangeable in seconds without venting the system
ESI and APCI use a unique counter electrode to optimize sampling from the liquid spray and to aid sample desolvation
Automatic Probe recognition
Detection in HPLC
Dr. Shulamit Levin,
+ SH M SH + +
SH M
MH +
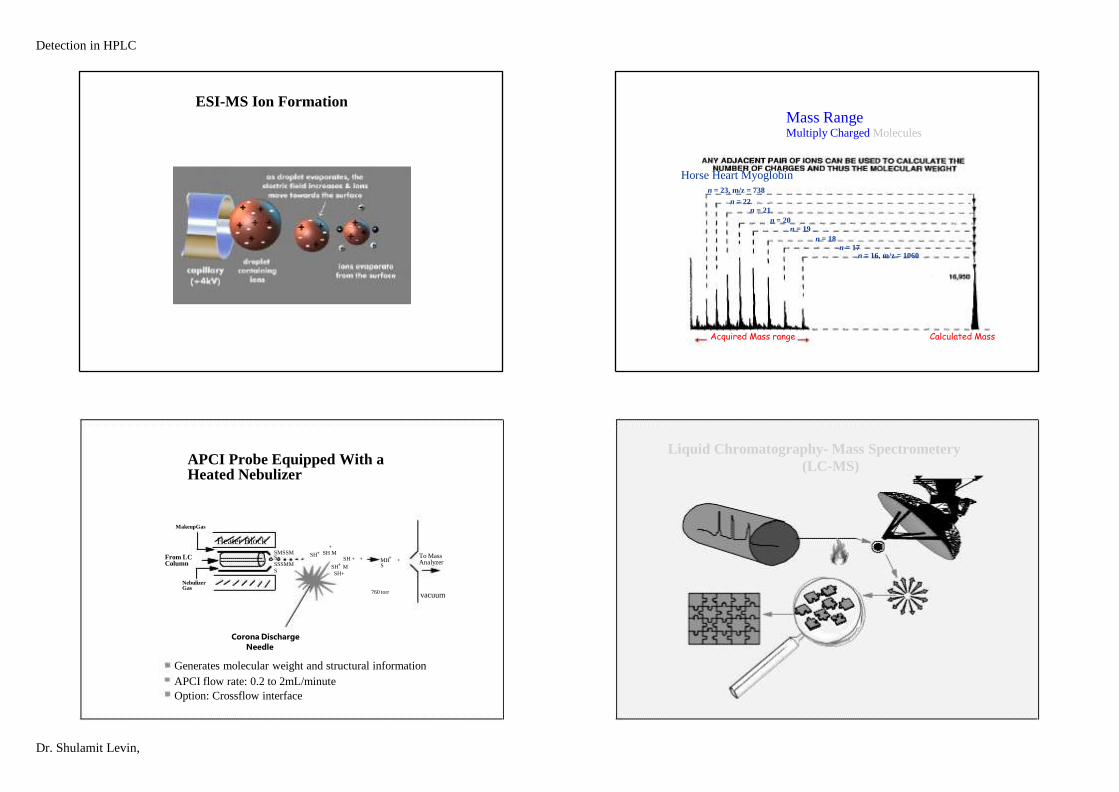
ESI-MS Ion Formation Mass Range Multiply Charged Molecules
Horse Heart Myoglobin
n = 23, m/z = 738 n = 22 n = 21 n = 20 n = 19 n = 18 n = 17 n = 16, m/z = 1060
Calculated Mass Acquired Mass range
From LC Column
Nebulizer Gas
Heater Block
APCI Probe Equipped With a Heated Nebulizer MakeupGas
SMSSM S
SSSMM
S
SH
+
+
SH+
S
+ To Mass Analyzer
760 torr vacuum
Liquid Chromatography- Mass Spectrometery
(LC-MS)
Detection in HPLC
Corona Discharge Needle
Generates molecular weight and structural information
APCI flow rate: 0.2 to 2mL/minute
Option: Crossflow interface
Dr. Shulamit Levin,
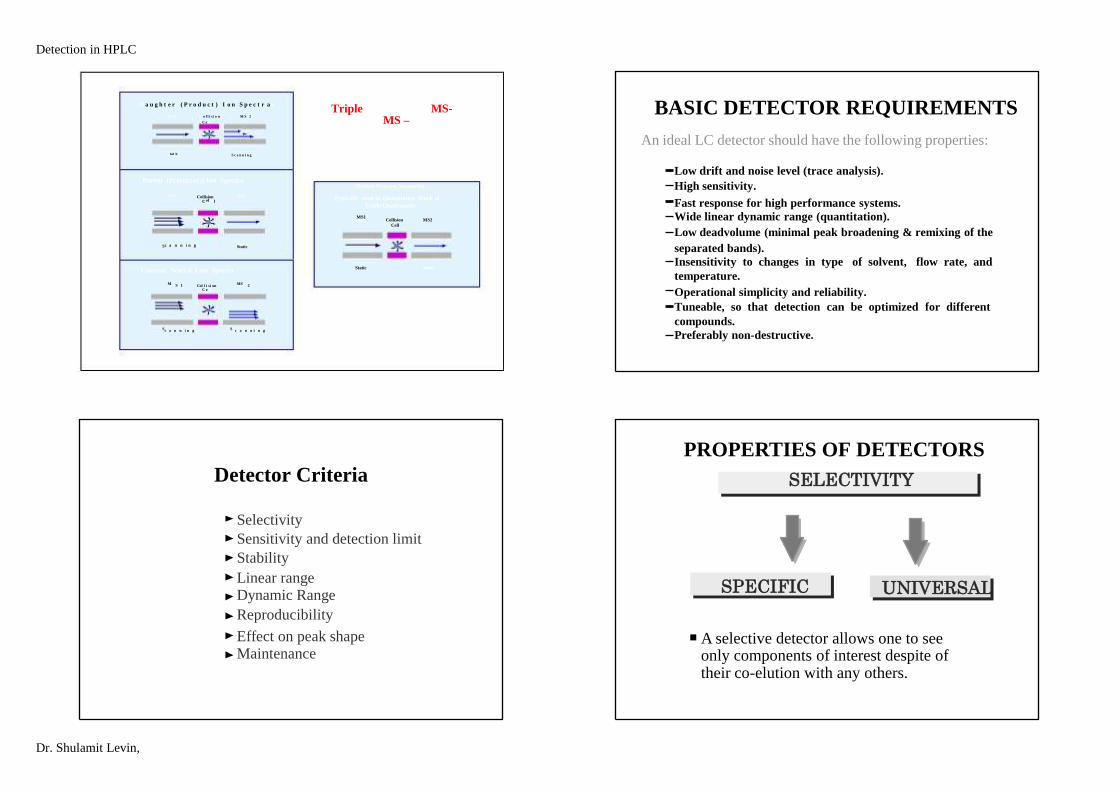
C Celll
MS1 Collision MS2
Cell
Sc ca an nn niin ng g Static
M S S1 1 M S 2 2
Sc ca an nn niin ng g Sc ca an nn niin ng g
Static
Triple QuadrupolesMS- MS –
Modes of Operation
Multiple Reaction Monitoring
Cell
Typically used in Quantitative Work of Triple Quadrupoles MS1 Collision MS2
Static
i
MS1 MS2 Collision el
S Static Constant Neutral Loss Spectra
M Colllliisiion C e ll
MS
S S
Fast response for high performance systems.
Wide linear dynamic range (quantitation).
Low deadvolume (minimal peak broadening & remixing of the
separated bands).
Insensitivity to changes in type of solvent, flow rate, and
temperature.
Operational simplicity and reliability.
Tuneable, so that detection can be optimized for different
compounds.
Preferably non-destructive.
BASIC DETECTOR REQUIREMENTS An ideal LC detector should have the following properties: Low drift and noise level (trace analysis).
High sensitivity.
Detector Criteria Selectivity
Sensitivity and detection limit
Stability
Linear range Dynamic Range
Reproducibility
Effect on peak shape Maintenance
PROPERTIES OF DETECTORS
SELECTIVITY
UNIVERSAL SPECIFIC
A selective detector allows one to see only components of interest despite of their co-elution with any others.
Detection in HPLC D a u g h tte rr ( P r o d u c tt)) IIo n S p e c ttrra a M S 1 C o l l i s iio n M S S22 C e ll Statticc S c a n n i n g Parent (Precursor)) Ion Spectra
Dr. Shulamit Levin,

PROPERTIES OF DETECTORS
SENSITIVITY R
E
S
P
O
N
S
E
CONCENTRATION
Sensitivity of a detector is not the minimum
amount that can be detected.
PROPERTIES OF DETECTORS DETECTION LIMIT
hsignal = 2 x h noise
h signal
h noise
Limit of quantitation
Lowest concentration that can be determined with acceptable precision
Signal-to-noise ratio of 10:1
Detector Sensitivity Limit of detection Lowest concentration that can be detected
Signal-to-noise ratio of 2:1 or 3:1
No apparent
noise
Minutes
2.8 3.0 3.2 3.4
0.2 AU
Chromatographic Sensitivity Signal-to-Noise Ratio 0.001
AU
Minutes
2.00 3.00 4.00
Noise
Detection in HPLC
Dr. Shulamit Levin,

AU
Increase Signal-to-Noise Ratio
Signal-to-noise (S/N) is peak height to noise
Increase S/N by increasing peak height
3:1
6:1
8:1
Factors Increasing UV Signal
Increase sample concentration
Increase injection volume
Choice of wavelength (s) Low volume flow cell
Flow cell pathlength
Factors Affecting Noise in UV Detectors
Optics bench design
Increase S/N by decreasing noise Chromatographic Sensitivity
Single Wavelength vs Maxplot
-0.002
0.000
0.006 0.004 0.002
0.008
0.010
0.0 2.0 4.0 6.0
220 nm
0.0 2.0 4.0 6.0
Minutes
Maxplot
Lamp energy Wavelengths
Mobile phase composition
Pump pulsation
Electronics PROPERTIES OF DETECTORS
BASELINE STABILITY
SHORT RANGE
LONG RANGE
DRIFT
NOISE
Detection in HPLC
Minutes
Dr. Shulamit Levin,
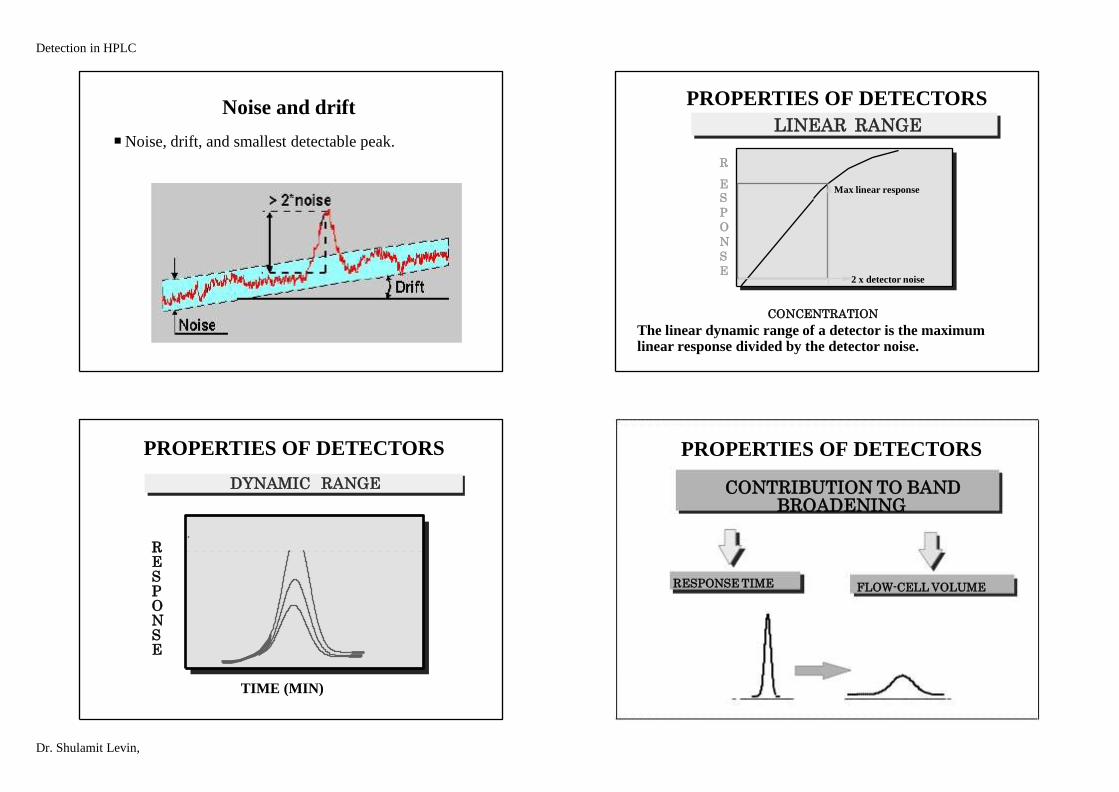
E S
P
O
N
S
E
Max linear response 2 x detector noise
PROPERTIES OF DETECTORS
LINEAR RANGE R
TIME (MIN)
R E S P O N S E
PROPERTIES OF DETECTORS DYNAMIC RANGE
RESPONSE TIME FLOW-CELL VOLUME
CONCENTRATION
The linear dynamic range of a detector is the maximum linear response divided by the detector noise. PROPERTIES OF DETECTORS CONTRIBUTION TO BAND BROADENING
Detection in HPLC Noise and drift Noise, drift, and smallest detectable peak.
Dr. Shulamit Levin,
PROPERTIES OF DETECTORS REPEATABILITY OF RESPONSE TEMPERATURE, FLOW RATE, ELECTRONICS
PROPERTIES OF DETECTORS MAINTENANCE AND COST EASY HANDLING OF FLOW-CELL
EASY A/D CONVERSION SAFETY
Detection in HPLC
Dr. Shulamit Levin,