detection of natural barriers to lake sturgeon movement...
TRANSCRIPT

Detection of Natural Barriers to Lake Sturgeon Movement within the Namakan River,
Ontario
A. B. Welsh, State University of New York – Oswego, Department of Biological Sciences, 7060
State Route 104, Oswego, NY 13126; [email protected]
D. T. McLeod, Ontario Ministry of Natural Resources, Fort Frances District, 922 Scott Street,
Fort Frances, Ontario P9A 1J4; [email protected]
Corresponding author: Amy Welsh, State University of New York – Oswego, Department of
Biological Sciences, 7060 State Route 104, Oswego, NY 13126; phone: 315-312-2774; fax: 315-
312-3059; [email protected]

1
2
3
4
5
6
7
8
9
10
11
12
13
14
15
16
17
18
19
20
21
Welsh, A. and McLeod, D. Detection of Natural Barriers to Lake Sturgeon Movement within
the Namakan River, Ontario.
Abstract
Many lake sturgeon (Acipenser fulvescens Rafinesque, 1817) populations are below historic
population sizes and migration barriers have likely contributed to some of these population
declines. Dams and natural barriers can potentially isolate populations along a single river and
can have a strong effect on the ability of lake sturgeon to move upstream. Along the Namakan
River in Ontario, a series of natural rapids could impede lake sturgeon movement and fragment
the sturgeon into several small populations. Lake sturgeon movement patterns were assessed
using genetics and acoustic telemetry. Samples were collected from five locations along the
river, each one separated by a rapid or falls, and were analyzed at 12 microsatellite loci. No
significant genetic differences were observed between the five segments, indicating that the lake
sturgeon groups are not isolated. There were no significant differences in genetic diversity
between the five segments. Therefore, migration is likely occurring both upstream and
downstream. The acoustic telemetry study also confirmed bidirectional movement of adult fish.
The natural rapids and falls along the Namakan River do not appear to be a significant barrier to
lake sturgeon movement and the lake sturgeon within this river represent a single population.
2

Introduction 22
23
24
25
26
27
28
29
30
31
32
33
34
35
36
37
38
39
40
41
42
43
44
The lake sturgeon (Acipenser fulvescens Rafinesque, 1817) has a wide range throughout
North America, including the Great Lakes and St Lawrence River, Lake Winnipeg, Hudson Bay,
and the Mississippi River systems. Many populations throughout their range are reduced in size
relative to historic population numbers due mainly to overfishing and habitat modifications
(Peterson et al. 2007). Although fishing has been restricted in many jurisdictions, habitat
changes, such as the construction and operation of dams, continue to have an effect on some lake
sturgeon populations. On the Ottawa River, greater abundance and faster growth of lake
sturgeon were observed on reaches that were not impounded (Haxton and Findlay 2008). On the
Mattagami River, hydroelectric operations appeared to have an effect on reproductive
development (McKinley et al. 1998). Flow regimes on the Sturgeon River had an impact on
sturgeon spawning activity (Auer 1996a). In the Red River of the North basin, lake sturgeon
have been extirpated due to dams blocking access to historic spawning grounds (Aadland et al.
2005).
Studies on lake sturgeon movements can provide additional information on the potential
impacts of natural and artificial barriers. Current studies offer conflicting information, with
some reporting large migration distances and others reporting minimal movement. In the Great
Lakes, a range of adult migration distances from 32-225 km have been reported (reviewed in
Auer 1996b). Movements of juveniles appear to be shorter (Holtgren and Auer 2004; Smith and
King 2005). In the upper Mississippi River, lake sturgeon movements ranged from 3-198 km,
with fish moving both upstream and downstream past dams (Knights et al. 2002). In the Ottawa
River, movements of four radio-tracked lake sturgeon were limited (Haxton 2003). The sturgeon
remained in their respective basins and the maximum distance traveled was 10 km.
3
45
46
47
48
49
50
51
52
53
54
55
56
57
58
59
60
61
62
63
64
65
66
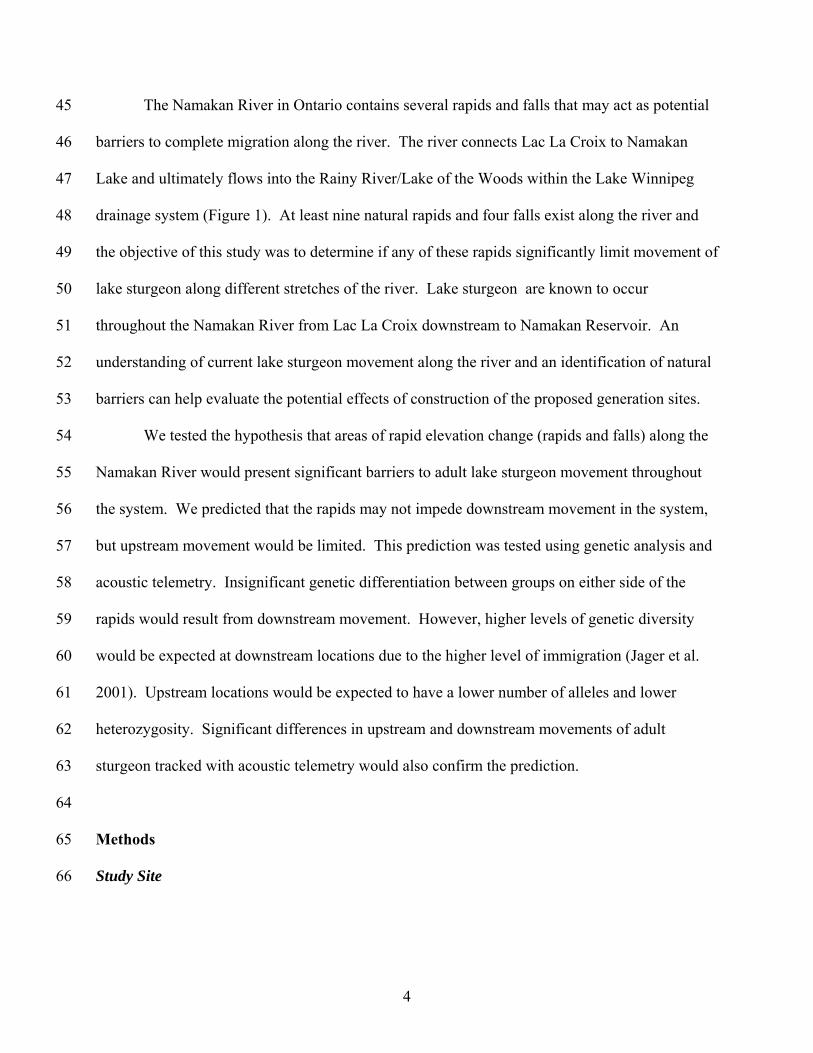
The Namakan River in Ontario contains several rapids and falls that may act as potential
barriers to complete migration along the river. The river connects Lac La Croix to Namakan
Lake and ultimately flows into the Rainy River/Lake of the Woods within the Lake Winnipeg
drainage system (Figure 1). At least nine natural rapids and four falls exist along the river and
the objective of this study was to determine if any of these rapids significantly limit movement of
lake sturgeon along different stretches of the river. Lake sturgeon are known to occur
throughout the Namakan River from Lac La Croix downstream to Namakan Reservoir. An
understanding of current lake sturgeon movement along the river and an identification of natural
barriers can help evaluate the potential effects of construction of the proposed generation sites.
We tested the hypothesis that areas of rapid elevation change (rapids and falls) along the
Namakan River would present significant barriers to adult lake sturgeon movement throughout
the system. We predicted that the rapids may not impede downstream movement in the system,
but upstream movement would be limited. This prediction was tested using genetic analysis and
acoustic telemetry. Insignificant genetic differentiation between groups on either side of the
rapids would result from downstream movement. However, higher levels of genetic diversity
would be expected at downstream locations due to the higher level of immigration (Jager et al.
2001). Upstream locations would be expected to have a lower number of alleles and lower
heterozygosity. Significant differences in upstream and downstream movements of adult
sturgeon tracked with acoustic telemetry would also confirm the prediction.
Methods
Study Site
4

The Namakan River is located immediately downstream of Lac La Croix and upstream of
Namakan Reservoir (Figure 1), approximately 80 km southeast of Fort Frances, Ontario. This
mesotrophic river is found in the southern range of the boreal forest in North America, and is
typical of Canadian Shield lakes and rivers with soft water and little submerged aquatic
vegetation. The Namakan River drains close to 8,860 km
67
68
69
70
71
72
73
74
75
76
77
78
79
80
81
82
83
84
85
86
87
88
89
2 in Ontario with an elevation drop of
19.2 m over a distance of 30.5 km from Lac La Croix to Namakan Reservoir (OPEG 2007).
A number of potential barriers to fish migration exist along the river from the outlet of
Lac La Croix downstream to the Namakan Reservoir. The following elevation changes are
reported for the various rapids/falls under average flow conditions: 3.2 m at Snake Falls (29 rkm
upstream), 4.0 m at Myrtle Falls and Ivy Falls (25 rkm upstream), 1.0 m at Twisted Rapids (20
rkm upstream), 0.7 m at Quetico Rapids (14.7 rkm upstream), 6.8 m at High Falls (11.7 rkm
upstream), 7.0 m at the Back Channel (over 2 km and 8-9 rapids; 10.2 rkm upstream), 3.0 m at
Hay Rapids (7.4 rkm upstream), and 1.6 m at Lady Rapids (4 rkm upstream) (Figure 1) (OPEG
2007).
Water levels and flows in the Namakan River are not regulated. A Meteorological
Service of Canada (Environment Canada) water level gauge at the outlet of Lac La Croix
provides relevant information on inflows to the Namakan River since 1921 (LWCB, 2008). A
maximum flow of 771 m3/sec was recorded in June, 1950 while a minimum flow of 15 m3/sec
was recorded in January, 1977 and February, 1924. Annual flow metrics derived from a recent
20-year period (1980-1999) provided a mean and median flow of 118 m3/sec and 87 m3/sec
respectively. Time exceeded (percentile) flows are estimated at 182 m3/sec (20%) and 51 m3/sec
(80%).
Sample Collection
5
90
91
92
93
94
95
96
97
98
99
100
101
102
103
104
105
106
107
108
109
110
111
112
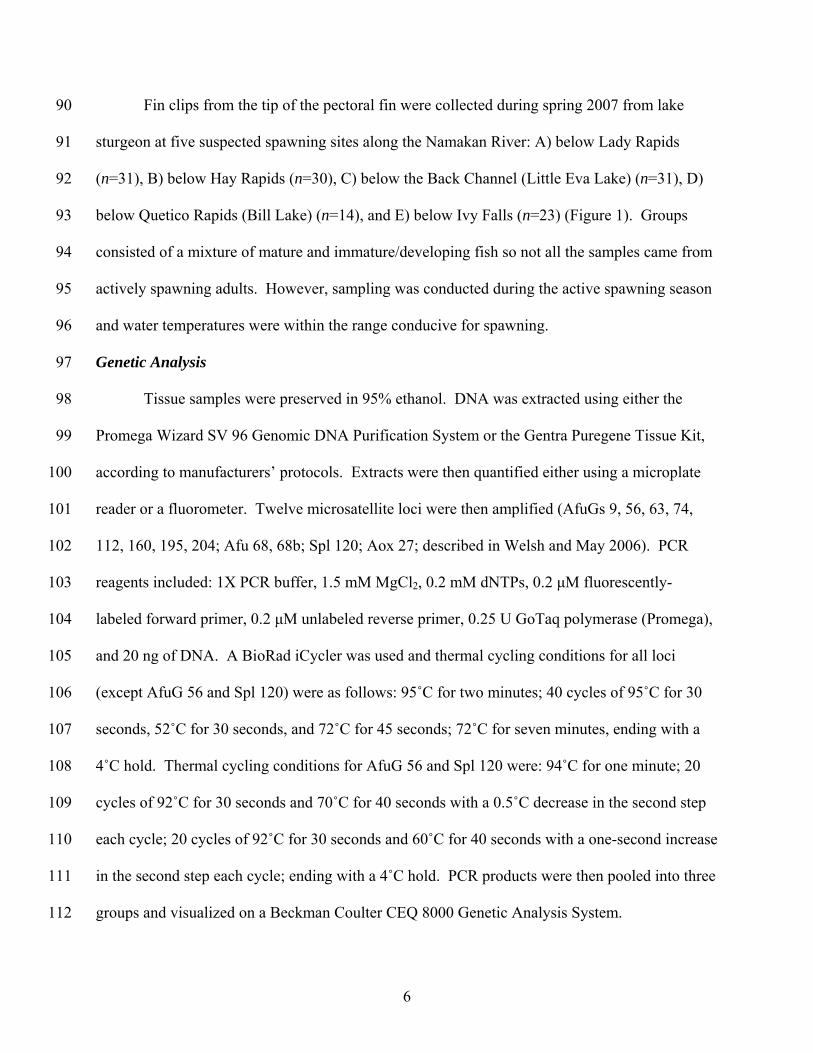
Fin clips from the tip of the pectoral fin were collected during spring 2007 from lake
sturgeon at five suspected spawning sites along the Namakan River: A) below Lady Rapids
(n=31), B) below Hay Rapids (n=30), C) below the Back Channel (Little Eva Lake) (n=31), D)
below Quetico Rapids (Bill Lake) (n=14), and E) below Ivy Falls (n=23) (Figure 1). Groups
consisted of a mixture of mature and immature/developing fish so not all the samples came from
actively spawning adults. However, sampling was conducted during the active spawning season
and water temperatures were within the range conducive for spawning.
Genetic Analysis
Tissue samples were preserved in 95% ethanol. DNA was extracted using either the
Promega Wizard SV 96 Genomic DNA Purification System or the Gentra Puregene Tissue Kit,
according to manufacturers’ protocols. Extracts were then quantified either using a microplate
reader or a fluorometer. Twelve microsatellite loci were then amplified (AfuGs 9, 56, 63, 74,
112, 160, 195, 204; Afu 68, 68b; Spl 120; Aox 27; described in Welsh and May 2006). PCR
reagents included: 1X PCR buffer, 1.5 mM MgCl2, 0.2 mM dNTPs, 0.2 µM fluorescently-
labeled forward primer, 0.2 µM unlabeled reverse primer, 0.25 U GoTaq polymerase (Promega),
and 20 ng of DNA. A BioRad iCycler was used and thermal cycling conditions for all loci
(except AfuG 56 and Spl 120) were as follows: 95˚C for two minutes; 40 cycles of 95˚C for 30
seconds, 52˚C for 30 seconds, and 72˚C for 45 seconds; 72˚C for seven minutes, ending with a
4˚C hold. Thermal cycling conditions for AfuG 56 and Spl 120 were: 94˚C for one minute; 20
cycles of 92˚C for 30 seconds and 70˚C for 40 seconds with a 0.5˚C decrease in the second step
each cycle; 20 cycles of 92˚C for 30 seconds and 60˚C for 40 seconds with a one-second increase
in the second step each cycle; ending with a 4˚C hold. PCR products were then pooled into three
groups and visualized on a Beckman Coulter CEQ 8000 Genetic Analysis System.
6

Each sampled group was tested for conformance to Hardy-Weinberg equilibrium (HWE)
and for linkage disequilibrium (LD) between locus pairs using the software GDA (Lewis and
Zaykin 2001). The five sampled groups were also pooled together to determine if the river as a
whole was in Hardy-Weinberg equilibrium. Genetic differentiation between groups along the
Namakan River was measured using the Weir and Cockerham (1984) estimator of F
113
114
115
116
117
118
119
120
121
122
123
124
125
126
127
128
129
130
131
132
133
134
ST (estimated
using the software Arlequin (Schneider et al. 2000)) and pairwise contingency tests of allele
frequency heterogeneity (Raymond and Rousset 1995), estimated using the software TFPGA
(Miller 1997). FST values can range from zero to one, with zero signifying no genetic
differentiation and one indicating complete differentiation at all loci. The significance of the
pairwise FST comparisons was based on 3,024 permutations. For the pairwise contingency tests,
10 batches of 2000 permutations each were run, with 1,000 dememorization steps. Significance
of the HWE, LD, pairwise FST, and contingency tests was assessed after a sequential Bonferroni
correction (Rice 1989). Genetic distance was also calculated and a Mantel test (Mantel 1967)
was performed to determine if there was a correlation between genetic distance and geographic
distance and the number of potential barriers. Significance of the Mantel test was based on 999
permutations and the analysis was performed using the software GENALEX (Peakall and
Smouse 2006).
Genetic diversity of each group along the Namakan River was also measured using
heterozygosity and allelic richness (number of alleles corrected for differences in sample size; El
Mousadik and Petit 1996). TFPGA was used to calculate heterozygosity and the software
FSTAT (Goudet 2001) was used to measure allelic richness. Significant differences in genetic
diversity were tested using t-tests. A regression was done to determine if there was a correlation
7
135
136
137
138
139
140
141
142
143
144
145
146
147
148
149
150
151
152
153
154
155
156
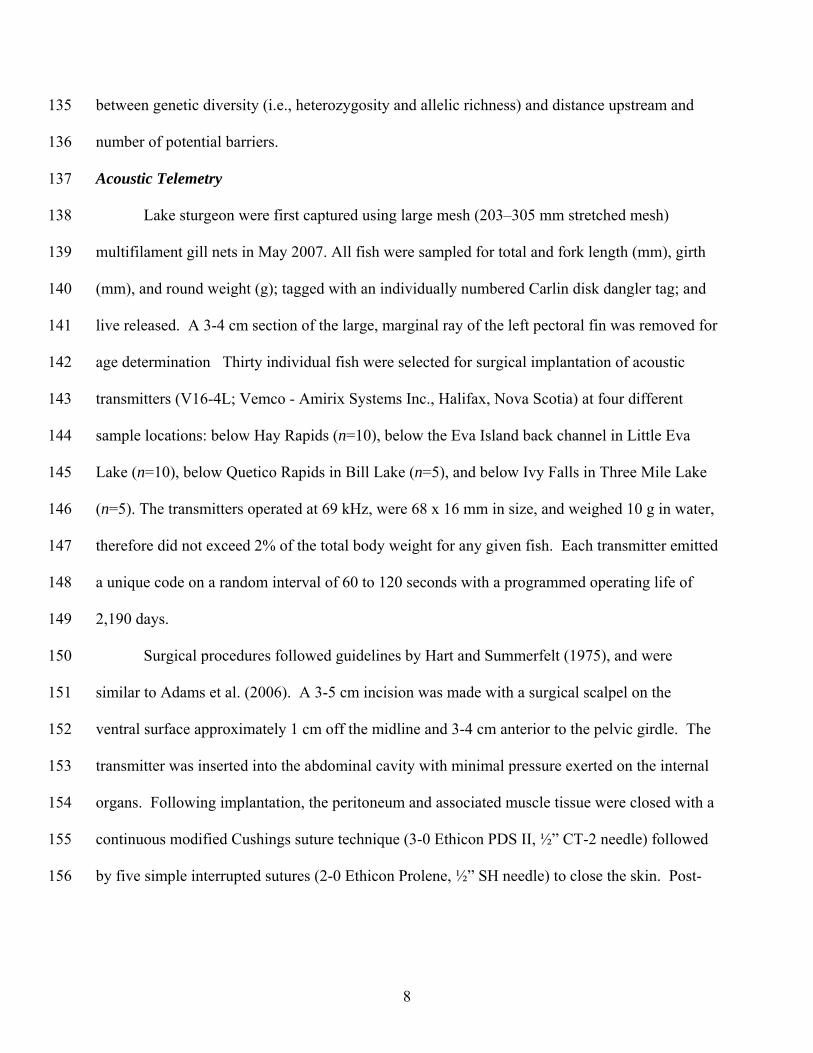
between genetic diversity (i.e., heterozygosity and allelic richness) and distance upstream and
number of potential barriers.
Acoustic Telemetry
Lake sturgeon were first captured using large mesh (203–305 mm stretched mesh)
multifilament gill nets in May 2007. All fish were sampled for total and fork length (mm), girth
(mm), and round weight (g); tagged with an individually numbered Carlin disk dangler tag; and
live released. A 3-4 cm section of the large, marginal ray of the left pectoral fin was removed for
age determination Thirty individual fish were selected for surgical implantation of acoustic
transmitters (V16-4L; Vemco - Amirix Systems Inc., Halifax, Nova Scotia) at four different
sample locations: below Hay Rapids (n=10), below the Eva Island back channel in Little Eva
Lake (n=10), below Quetico Rapids in Bill Lake (n=5), and below Ivy Falls in Three Mile Lake
(n=5). The transmitters operated at 69 kHz, were 68 x 16 mm in size, and weighed 10 g in water,
therefore did not exceed 2% of the total body weight for any given fish. Each transmitter emitted
a unique code on a random interval of 60 to 120 seconds with a programmed operating life of
2,190 days.
Surgical procedures followed guidelines by Hart and Summerfelt (1975), and were
similar to Adams et al. (2006). A 3-5 cm incision was made with a surgical scalpel on the
ventral surface approximately 1 cm off the midline and 3-4 cm anterior to the pelvic girdle. The
transmitter was inserted into the abdominal cavity with minimal pressure exerted on the internal
organs. Following implantation, the peritoneum and associated muscle tissue were closed with a
continuous modified Cushings suture technique (3-0 Ethicon PDS II, ½” CT-2 needle) followed
by five simple interrupted sutures (2-0 Ethicon Prolene, ½” SH needle) to close the skin. Post-
8
157
158
159
160
161
162
163
164
165
166
167
168
169
170
171
172
173
174
175
176
177
178
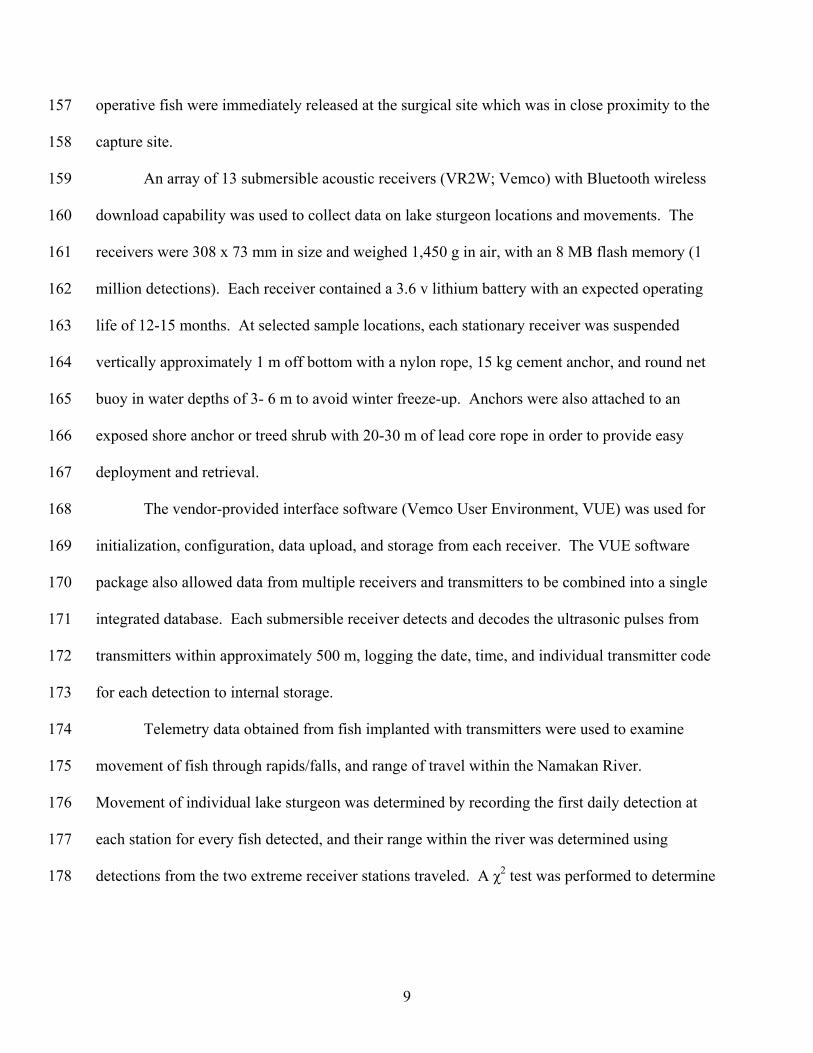
operative fish were immediately released at the surgical site which was in close proximity to the
capture site.
An array of 13 submersible acoustic receivers (VR2W; Vemco) with Bluetooth wireless
download capability was used to collect data on lake sturgeon locations and movements. The
receivers were 308 x 73 mm in size and weighed 1,450 g in air, with an 8 MB flash memory (1
million detections). Each receiver contained a 3.6 v lithium battery with an expected operating
life of 12-15 months. At selected sample locations, each stationary receiver was suspended
vertically approximately 1 m off bottom with a nylon rope, 15 kg cement anchor, and round net
buoy in water depths of 3- 6 m to avoid winter freeze-up. Anchors were also attached to an
exposed shore anchor or treed shrub with 20-30 m of lead core rope in order to provide easy
deployment and retrieval.
The vendor-provided interface software (Vemco User Environment, VUE) was used for
initialization, configuration, data upload, and storage from each receiver. The VUE software
package also allowed data from multiple receivers and transmitters to be combined into a single
integrated database. Each submersible receiver detects and decodes the ultrasonic pulses from
transmitters within approximately 500 m, logging the date, time, and individual transmitter code
for each detection to internal storage.
Telemetry data obtained from fish implanted with transmitters were used to examine
movement of fish through rapids/falls, and range of travel within the Namakan River.
Movement of individual lake sturgeon was determined by recording the first daily detection at
each station for every fish detected, and their range within the river was determined using
detections from the two extreme receiver stations traveled. A χ2 test was performed to determine
9

179
180
181
182
183
184
185
186
187
188
189
190
191
192
193
194
195
196
197
198
199
200
201
if there were significant differences in upstream and downstream movement across potential
barriers.
Results
Genetic Analysis
All loci in all five sampled groups were in Hardy-Weinberg equilibrium and locus pairs
showed no evidence of linkage disequilibrium. When the five sampled groups were pooled
together as a single population, all loci remained in Hardy-Weinberg equilibrium. There were no
significant genetic differences between the five spawning locations along the Namakan River
(Table 1). Pairwise FST values indicated low levels of genetic variation, ranging from 0.00-0.03.
All FST values and pairwise contingency values were not significant. Genetic distance was not
correlated with either geographic distance (R2 = 0.002; p = 0.075) or the number of potential
barriers (R2 = 0.002; p = 0.065) (Figure 2).
Average observed heterozygosity across all 12 loci ranged from 0.31 to 0.35. Average
allelic richness ranged from 2.30 to 2.54. Heterozygosity and allelic richness values were similar
among the five different groups (Figure 3). There were no significant differences in levels of
genetic diversity between any of the five groups. Genetic diversity was not correlated to the
distance upstream (heterozygosity: R2 = 0.000; p = 0.99; allelic richness: R2 = 0.008; p = 0.88)
or to the number of potential barriers (heterozygosity: R2 = 0.015; p = 0.85; allelic richness: R2 =
0.059; p = 0.69).
Acoustic Telemetry
Lake sturgeon implanted with transmitters had a mean total length of 1,211 mm (863-
1,662 mm), mean girth of 426 mm (329-659 mm), mean round weight of 11,453 g (4,250-30,800
10

202
203
204
205
206
207
208
209
210
211
212
213
214
215
216
217
218
219
220
221
222
223
224
g) and mean age of 27.9 year (16-47 years). Based on the round weight of individual fish,
implanted transmitters ranged from 0.03 to 0.23% of body weight. Sex could only be determined
on 15 of the implanted fish (7 females and 8 males). All of the implanted sturgeon were adults at
various stages of sexual development.
Eleven submersible receivers were deployed in the Namakan River on May 15 to 25,
2007. Two additional receivers were deployed on April 30 and May 22, 2008 below and above
Snake Falls, in order to investigate potential movements of telemetered fish through Myrtle, Ivy
and Snake Falls in the upper most reaches of the Namakan River (Figure 1). A total of
1,109,290 detections were recorded throughout the Namakan River over the 2007-2008 sampling
period (to October 21, 2008). The maximum number of detections from a single fish was
196,709, while the minimum was 249. In addition, one individual fish was detected at 11 of the
13 stations, over a distance of 28.8 km. Three individuals were detected at one station only, and
the mean number of receivers at which an individual fish was detected was 4.2 (SD = 2.8). Each
receiver detected a mean of 15.0 fish (SD = 9.7) with a range of 0-33.
Movements of individual fish through shallow rapids and falls along the river were also
evaluated based on detections from both upstream and downstream receivers (Table 2).
Movements through the proposed hydro development sites at Hay Rapids, Hay Falls, Back
Channel, and Ivy/Myrtle Falls were documented, as well as all other undeveloped sites along the
Namakan River and Quetico River. The only exceptions were that no movements were recorded
through Snake Falls or upstream at High Falls. The maximum number of movements (n = 64)
was observed at Twisted Rapids at the outlet of Three Mile Lake, and were equally distributed
between upstream and downstream over the sampling period. The most significant observations
were 7 recorded downstream movements of 5 individual fish over High Falls, an elevation drop
11

225
226
227
228
229
230
231
232
233
234
235
236
237
238
239
240
241
242
243
244
245
246
247
of 6.8 m. In addition, both upstream and downstream movements of sturgeon through 8-9
shallow rapids in the Back Channel first occurred in October, 2007, with a significantly greater
number of upstream movements (p<0.05) (Table 2). Of the 19 recorded fish movements, the
majority (74%) were moving upstream from Little Eva Lake to Bill Lake.
Discussion
Lake sturgeon in this telemetry study represented a broad segment of the adult
population, with total lengths ranging from 605 to 1,746 mm and ages ranging from 16 to 47
years. Lake sturgeon can be highly mobile and exhibit complex behaviour patterns, especially in
large systems where movements are not restricted. This study confirmed a smaller range of
movements from 0 to 29 km, which represents the entire distance of the Namakan River to below
Snake Falls. The total distance travelled by these fish will likely increase as additional
movements are documented downstream in the Namakan Reservoir. Several fish (n = 6) in this
study showed very limited movement with detections at only one receiver location. The extent
of movement within a season was also highly variable among fish; some fish readily moved
among habitats while movements of others were more constrained. Monthly movements within
the Namakan River indicate that individual sturgeon travelled over a range of 0 to 48.9
km/month from May to October. No movement of fish was observed between receiver locations
from November to April over the two study years. In the Namakan River, lake sturgeon appear
to move upstream in the late summer and fall to possibly forage and over-winter in lake
environments, as well as in early spring to reach potential upstream spawning areas.
Both the genetic and acoustic telemetry data suggest that the putative spawning groups
along the Namakan River represent a single population. If the rapids or High Falls along the
12
248
249
250
251
252
253
254
255
256
257
258
259
260
261
262
263
264
265
266
267
268
269
270
river have presented a long-term barrier to migration, genetic differences would have likely
accumulated between the groups. Instead, no significant genetic differences were observed
between the groups. However, the level of genetic differentiation was close to significant
between Quetico Rapids and Hay Rapids (without a sequential Bonferroni correction) and may
be due to lack of power resulting from the small sample size at Quetico Rapids. This lends
support for the apparent lack of upstream movement directly at High Falls identified in the
telemetry portion of the study. When the five sampled groups were pooled together, the sturgeon
in the river as a whole were in Hardy-Weinberg equilibrium. If deviations from HWE were
observed, it may have provided evidence for the presence of multiple populations (Wahlund
effect; Wahlund 1928). The lack of HWE deviations indicates that the Namakan River lake
sturgeon represent a single population. Individuals also do not become more genetically distant
at more geographically distance stretches of the river, indicating that sturgeon movements are
currently unimpeded along the Namakan River.
Additionally, there were no significant differences in genetic diversity between the five
groups and genetic diversity did not decrease with increasing upstream distance, indicating that
migration is likely occurring in both directions along the river. Asymmetrical movement would
likely result in differences in genetic diversity along the river. If lake sturgeon were primarily
moving downstream, upstream populations would be expected to have lower genetic diversity
due to lack of migration into those populations (Jager et al. 2001).
Telemetry findings confirm movements through all natural constrictions in the system
with the exception of Snake Falls and upstream movement at High Falls, which have an
elevation drop of 3.8 and 6.8 m respectively under average flow conditions. Although the Back
Channel around Eva Island and High Falls has an elevation change of approximately 7.0 m, the
13
271
272
273
274
275
276
277
278
279
280
281
282
283
284
285
286
287
288
289
290
291
292
293
numerous shallow rapids help dissipate this change over a distance of approximately 2 km. Lake
sturgeon appear to use this natural by-pass channel to migrate both upstream and downstream
around High Falls. Upstream movement was greater than downstream movement in the Back
Channel and this route likely compensates for the lack of upstream movement at High Falls. The
return in spring 2008 of 8 fish that departed the river during summer/fall 2007, and the upstream
movement of another 13 fish from the reservoir in 2008 indicates a high degree of preference to
the Namakan River.
Effects of river fragmentation can vary depending on the type of barrier and the life
histories of the species. In the Menominee River, Michigan, the lake sturgeon population was
found to be fragmented into sections by hydroelectric dams (Thuemler 1997). Knights et al.
(2002) also found that dams appeared to be intermittent barriers to upstream passage. However,
the genetic effects of fragmentation from dams may not be as apparent as the effects of natural
barriers due to differences in time since fragmentation (Deiner et al. 2007). The genetic effects
of dams may also be temporarily masked in long-lived species with long generation times like
the lake sturgeon. The putative natural barriers on the Namakan River have likely been in place
for a sufficient amount of time to permit genetic divergence if the rapids were true migration
barriers. Species characteristics can also provide insight into vulnerability to fragmentation.
Haponski et al. (2007) suggested that non-migratory fish may not become significantly isolated
in the presence of a low-head dam. In contrast, habitat specialists and species inhabiting the
edges of their range may be particularly vulnerable to fragmentation (Reid et al. 2008).
The genetic diversity observed in the Namakan River is lower than the diversity observed
in other Hudson Bay/James Bay populations and Great Lakes populations (DeHaan et al. 2006;
Welsh et al. 2008). The diversity is also lower than that observed for most freshwater fishes
14
294
295
296
297
298
299
300
301
302
303
304
305
306
307
308
309
310
311
312
313
314
315
316
(average heterozygosity = 0.46; DeWoody and Avise 2000). Possible reasons for low genetic
diversity include reduced population size, inbreeding, or genetic drift. However, because the
Namakan River population is in HWE, it is unlikely those attributes are responsible for the low
levels of genetic diversity. Alternatively, the low levels of genetic diversity may be an artifact of
the glacial history of the Hudson Bay drainage. Low genetic diversity in Hudson Bay
populations has been observed in previous genetic studies (McQuown et al. 2003; Welsh et al.
2008). Evidence using mitochondrial DNA suggests that lake sturgeon in the Hudson Bay
drainage may have originated from a different glacial refugia than the current Great Lakes
populations (Ferguson et al. 1993). Fewer postglacial dispersal routes into the Hudson Bay
(Mandrak and Crossman 1992) and longer periods of glaciation may have resulted in lower
genetic diversity in current populations relative to populations in the Great Lakes.
The rapids along the Namakan River do not represent reproductive barriers to lake
sturgeon and future management actions should preserve the integrity of this population. High
Falls appears to be the only potential barrier to upstream fish passage. However, the Back
Channel is providing a natural fish passage around High Falls, as the total elevation change is
dissipated over 8-9 sets of shallow rapids. Fragmentation along rivers resulting from artificial
barriers can lead to substantial genetic differentiation evolving within a few generations (e.g.,
Hanfling and Weetman 2006; Heggenes and Roed 2006). Continual upstream and downstream
migration can maintain the genetic diversity along all the segments of the river (Jager et al. 2001;
Reid et al. 2008) and prevent further erosion of the remaining genetic diversity in lake sturgeon
along the Namakan River.
Acknowledgements
15

317
318
319
320
321
322
323
Funding was provided by the Ontario Ministry of Natural Resources – Renewable Energy
Section and Fort Frances District. Stacey Baker provided assistance with genetic laboratory
work. Barb Elliott prepared the GIS map figure, and Christine Debruyne assisted with the
analysis of telemetry data. Lac La Croix First Nation, OPEG, Quetico Provincial Park, and
Voyageurs National Park each contributed telemetry equipment and field assistance for the
study, along with the support from several OMNR staff.
16
References 324
325
326
327
328
329
330
331
332
333
334
335
336
337
338
339
340
341
342
343
344
345
Aadland, L.P., Koel, T.M., Franzin, W.G., Stewart, K.W., and Nelson, P. 2005. Changes in fish
assemblage structure of the Red River of the North. In Symposium on changes in fish
community structures in large USA rivers. Edited by J.N. Rinne, R.M. Hughes, and B.
Calamusso. American Fisheries Society, Symposium 45, Bethesda, Maryland. pp. 293-321.
Auer, N.A. 1996a. Response of spawning lake sturgeons to change in hydroelectric facility
operation. Trans. Am. Fish. Soc. 125: 66-77.
Auer, N.A. 1996b. Importance of habitat and migration to sturgeons with emphasis on lake
sturgeon. Can. J. Fish. Aquat. Sci. 53(Suppl 1): 152-160.
DeHaan, P.W., Libants, S.T., Elliott, R.F., and Scribner, K.T. 2006. Genetic population
structure of remnant lake sturgeon populations in the upper Great Lakes basin. Trans. Am.
Fish. Soc. 135:1478-1492.
Deiner, K., Garza, J.C., Coey, R., and Girman, D.J. 2007. Population structure and genetic
diversity of trout (Oncorhynchus mykiss) above and below natural and man-made barriers in
the Russian River, California. Conserv. Genet. 8: 437-454.
DeWoody, J., and Avise, J. 2000. Microsatellite variation in marine, freshwater and
anadramous fishes compared with other animals. J. Fish. Biol. 56:461-473.
El Mousadik, A., and Petit, R.J. 1996. High level of genetic differentiation for allelic richness
among populations of the argan tree [Argania spinosa (L.) Skeels] endemic to Morocco.
Theor. Appl. Genet. 92:832-839.
Ferguson, M.M., Bernatchez, L., Gatt, M., Konkle, B.R., Lee, S., Malott, M.L., and McKinley,
R.S. 1993. Distribution of mitochondrial DNA variation in lake sturgeon (Acipenser
17
fulvescens) from the Moose River basin, Ontario, Canada. J. Fish Biol. 43(Suppl A): 91-
101.
346
347
348
349
350
351
352
353
354
355
356
357
358
359
360
361
362
363
364
365
366
367
Goudet, J. 2001. FSTAT, a program to estimate and test gene diversities and fixation indices
(version 2.9.3). Available from http://www.unil.ch/izea/softwares/fstat.html [accessed 31
March 2009].
Hanfling, B., and Weetman, D. 2006. Concordant genetic estimators of migration reveal
anthropogenically enhanced source-sink population structure in the river sculpin, Cottus
gobio. Genetics, 173:1487–1501
Haponski, A.E., Marth, T.A., and Stepien, C.A. 2007. Genetic divergence across a low-head
dam: a preliminary analysis using logperch and greenside darters. J. Gt. Lakes Res. 33: 117-
126.
Haxton, T.J. 2003. Movement of lake sturgeon, Acipenser fulvescens, in a natural reach of the
Ottawa River. Can. Field-Nat. 117: 541-545.
Haxton, T.J. and Findlay, C.S. 2008. Variation in lake sturgeon (Acipenser fulvescens)
abundance and growth among river reaches in a large regulated river. Can. J. Fish. Aquat.
Sci. 65: 645-657.
Heggenes, J., and Roed, K.H. 2006. Do dams increase genetic diversity in brown trout (Salmo
trutta)? Microgeographic differentiation in a fragmented river. Ecol. Freshw..Fish 15: 366-
375.
Holtgren, J.M., and Auer, N.A. 2004. Movement and habitat of juvenile lake sturgeon
(Acipenser fulvescens) in the Sturgeon River/Portage Lake system, Michigan. J. Freshw.
Ecol. 19: 419-432.
18

368
369
370
371
372
373
374
375
376
377
378
379
380
381
382
383
384
385
386
387
388
Jager, H.I., Chandler, J.A., Lepla, K.B., and Van Winkle, W. 2001. A theoretical study of river
fragmentation by dams and its effects on white sturgeon populations. Environ. Biol. Fishes,
60: 347-361.
Knights, B.C., Vallazza, J.M., Zigler, S.J., and Dewey, M.R. 2002. Habitat and movement of
lake sturgeon in the upper Mississippi River system, USA. Trans. Am. Fish. Soc. 131: 507-
522.
Lewis, P.O., and Zaykin, D. 2001. Genetic Data Analysis: Computer program for the analysis
of allelic data. Version 1.0 (d16c). Available from
http://lewis.eeb.uconn.edu/lewishome/software.html [accessed 31 March 2009].
LWCB. 2008. Lake of the Woods Control Board Basin Data – Lac La Croix. Available from
http://www.lwcb.ca/waterflowdata.html [accessed 28 August 2008].
Mandrak, N.E., and Crossman, E.J. 1992. Postglacial dispersal of freshwater fishes into
Ontario. Can. J. Zool. 70: 2247-2259.
Mantel, N. 1967. The detection of disease clustering and a generalized regression approach.
Cancer Res. 27: 209-220.
McKinley, S., Van der Kraak, G., and Power, G. 1998. Seasonal migrations and reproductive
patterns in the lake sturgeon, Acipenser fulvescens, in the vicinity of hydroelectric stations in
northern Ontario. Environ. Biol. Fishes, 51: 245-256.
McLeod, D. T. and Debruyne, C.. 2009. Movement and seasonal distribution of lake sturgeon in
the Namakan River, Ontario. Preliminary Report 2007-08. Ontario Ministry of Natural
Resources. Fort Frances District Report Series No. 82. 89 p.
19
389
390
391
392
393
394
395
396
397
398
399
400
401
402
403
404
405
406
407
408
409
410
411
Miller, M.P. 1997. Tools for population genetic analyses (TFPGA) 1.3: a Windows program for
the analysis of allozyme and molecular population genetic data. Available from
http://www.marksgeneticsoftware.net/ [accessed 12 January 2009].
OPEG. 2007. Environmental Field Study Plan: Namakan River Hydro Development Project.
Ojibway Power and Energy Group, Aurora, Ontario. 43 p.
Peakall, R., and Smouse, P.E. 2006. GENALEX 6: genetic analysis in Excel. Population
genetic software for teaching and research. Mol. Ecol. Notes, 6: 288-295.
Peterson, D.L., Vecsei, P., and Jennings, C.A. 2007. Ecology and biology of the lake sturgeon:
a synthesis of current knowledge of a threatened North American Acipenseridae. Rev. Fish.
Biol. Fish. 17: 59-76.
Raymond, M.L., and Rousset, F. 1995. An exact test for population differentiation. Evolution,
49:1280-1283.
Reid, S.M., Wilson, C.C., Mandrak, N.E., and Carl, L.M. 2008. Population structure and
genetic diversity of black redhorse (Moxostoma duquesnei) in a highly fragmented
watershed. Conserv. Genet. 9: 531-546.
Rice, W.R. 1989. Analyzing tables of statistical tests. Evolution, 43:223-225.
Schneider, S., Roessli, D., and Excoffier, L. 2000. Arlequin ver 2.000: a software for population
genetics data analysis. Available from http://anthro.unige.ch/arlequin [accessed 31 March
2009].
Smith, K.M., and King, D.K. 2005. Movement and habitat use of yearling and juvenile lake
sturgeon in Black Lake, Michigan. Trans. Am. Fish. Soc. 134: 1159-1172.
Thuemler, T.F. 1997. Lake sturgeon management in the Menominee River, a Wisconsin-
Michigan boundary water. Env. Biol. Fishes, 48: 311-317.
20
412
413
414
415
416
417
418
419
420
Wahlund, S. 1928. Composition of populations and correlation appearances viewed in relation
to the studies of inheritance. Hereditas, 11: 65-108.
Weir, B.S., and Cockerham, C.C. 1984. Estimating F-statistics for the analysis of population
structure. Evolution, 38:1358-1370.
Welsh, A., and May, B. 2006. Development and standardization of disomic microsatellite
markers for lake sturgeon genetic studies. J. Appl. Ichthyol. 22: 337-344.
Welsh, A., Hill, T., Quinlan, H., Robinson, C., and May, B. 2008. Genetic assessment of lake
sturgeon population structure in the Laurentian Great Lakes. N. Am. J. Fish. Manag. 28:
572-591.
21
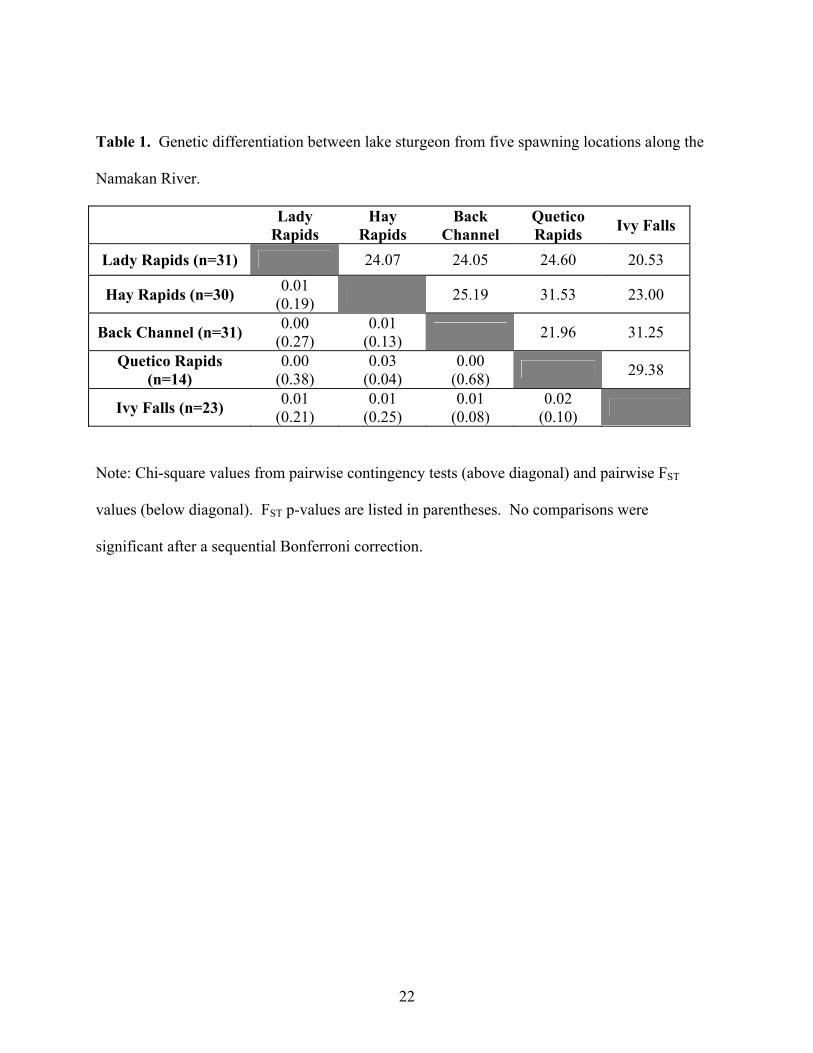
Table 1. Genetic differentiation between lake sturgeon from five spawning locations along the
Namakan River.
Lady Rapids
Hay Rapids
Back Channel
Quetico Rapids Ivy Falls
Lady Rapids (n=31) 24.07 24.05 24.60 20.53
Hay Rapids (n=30) 0.01 (0.19) 25.19 31.53 23.00
Back Channel (n=31) 0.00 (0.27)
0.01 (0.13) 21.96 31.25
Quetico Rapids (n=14)
0.00 (0.38)
0.03 (0.04)
0.00 (0.68) 29.38
Ivy Falls (n=23) 0.01 (0.21)
0.01 (0.25)
0.01 (0.08)
0.02 (0.10)
Note: Chi-square values from pairwise contingency tests (above diagonal) and pairwise FST
values (below diagonal). FST p-values are listed in parentheses. No comparisons were
significant after a sequential Bonferroni correction.
22
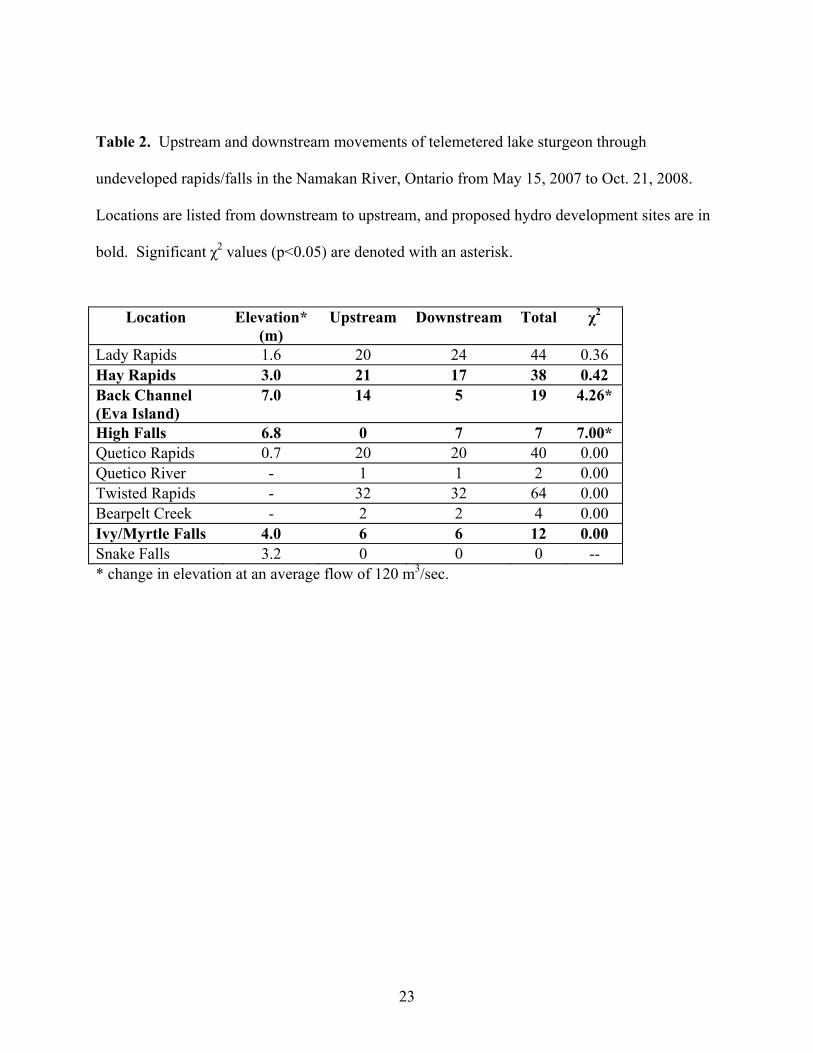
Table 2. Upstream and downstream movements of telemetered lake sturgeon through
undeveloped rapids/falls in the Namakan River, Ontario from May 15, 2007 to Oct. 21, 2008.
Locations are listed from downstream to upstream, and proposed hydro development sites are in
bold. Significant χ2 values (p<0.05) are denoted with an asterisk.
Location Elevation* (m)
Upstream
Downstream Total χ2
Lady Rapids 1.6 20 24 44 0.36 Hay Rapids 3.0 21 17 38 0.42 Back Channel (Eva Island)
7.0 14 5 19 4.26*
High Falls 6.8 0 7 7 7.00* Quetico Rapids 0.7 20 20 40 0.00 Quetico River - 1 1 2 0.00 Twisted Rapids - 32 32 64 0.00 Bearpelt Creek - 2 2 4 0.00 Ivy/Myrtle Falls 4.0 6 6 12 0.00 Snake Falls 3.2 0 0 0 -- * change in elevation at an average flow of 120 m3/sec.
23

Figure 1. Location of genetic sampling sites and VR2W acoustic telemetry receivers in the
Namakan River, Ontario.
Figure 2. Correlation between genetic distance and spatial measures. Correlations were not
significant (p>0.05). A) Genetic distance and geographic distance (km) (R2 = 0.002). B)
Genetic distance and number of potential barriers (R2 = 0.002).
Figure 3. Genetic diversity of the five putative spawning groups along the Namakan River.
Standard deviations are also displayed. There were no significant differences in genetic diversity
observed between the sampled groups. A) Observed heterozygosity averaged across all 12 loci.
B) Allelic richness averaged across all 12 loci.
24

Figure 1.
25
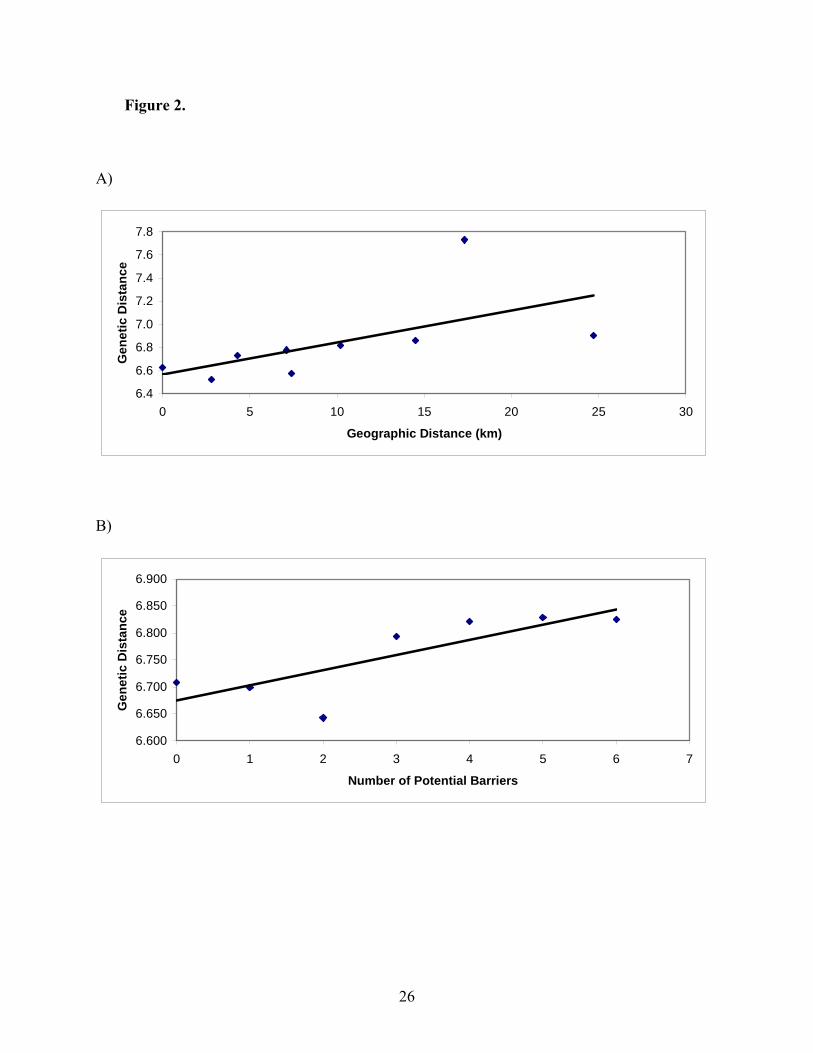
Figure 2.
A)
6.4
6.6
6.8
7.0
7.2
7.4
7.6
7.8
0 5 10 15 20 25 30
Geographic Distance (km)
Gen
etic
Dis
tanc
e
B)
6.600
6.650
6.700
6.750
6.800
6.850
6.900
0 1 2 3 4 5 6 7
Number of Potential Barriers
Gen
etic
Dis
tanc
e
26
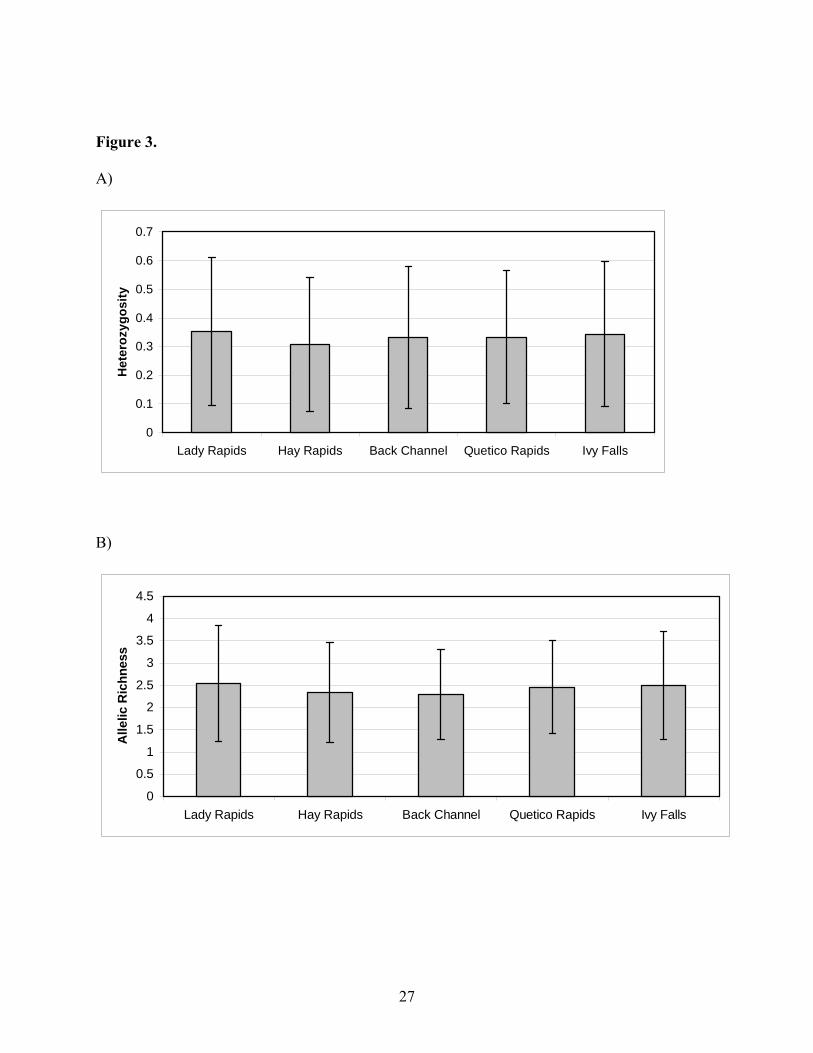
Figure 3.
A)
0
0.1
0.2
0.3
0.4
0.5
0.6
0.7
Lady Rapids Hay Rapids Back Channel Quetico Rapids Ivy Falls
Het
eroz
ygos
ity
B)
0
0.5
1
1.5
2
2.5
3
3.5
4
4.5
Lady Rapids Hay Rapids Back Channel Quetico Rapids Ivy Falls
Alle
lic R
ichn
ess
27