detection of displacements on tenerife island, canaries ... · yu et al. 2000) and ground...
TRANSCRIPT

Geophys. J. Int. (2005) 160, 33–45 doi: 10.1111/j.1365-246X.2005.02487.x
GJI
Geo
desy
,pot
ential
fiel
dan
dap
plie
dge
ophy
sics
Detection of displacements on Tenerife Island, Canaries,using radar interferometry
Jose Fernandez,1 Rosana Romero,2 Daniel Carrasco,2 Kristy F. Tiampo,3,∗Gema Rodrıguez-Velasco,1 Alfredo Aparicio,4 Vicente Arana4
and F. J. Gonzalez-Matesanz5
1Instituto de Astronomıa y Geodesia (CSIC-UCM), Fac. C, Matematicas, Plaza de Ciencias 3, Ciudad Universitaria, Madrid 28040, Spain.E-mail: Jose [email protected] Espacio, Mar Egeo, 4 Pol. Ind no. 1, San Fernando de Henares, Madrid 28850, Spain3CIRES, University of Colorado, Boulder, CO 80309, USA4Museo Nacional de Ciencias Naturales (CSIC), Jose Gutierrez Abascal 2, Madrid 28006, Spain5Instituto Geografico Nacional, Ministerio de Fomento, C/General Ibanez Ibero 3, Madrid 28003, Spain
Accepted 2004 September 21. Received 2004 August 12; in original form 2003 August 6
S U M M A R YTenerife is one of the most well monitored islands of the Canaries, but the surveillance generallyis centred on Las Canadas Caldera, where the Teide volcano is located. In the last 180 000 yr,the eruptions on Tenerife Island have never occurred in the same volcanic structure, exceptfor the Teide and Pico Viejo central volcanic system, so that a complete monitoring networkwould have to cover the whole island. As a result, Synthetic Aperture Radar Interferometry(InSAR) is being used on Tenerife, because this space technique can provide a displacementmap of the surface of the earth with centimetre precision. This paper presents the resultsobtained on Tenerife Island using 18 SAR images acquired by the ERS-1 and ERS-2 satellitesduring the period 1992–2000. Two important results have been obtained: no deformation onLas Canadas Caldera, coinciding with results obtained using terrestrial techniques, and twosubsidence episodes outside monitoring areas in the NW of the island, in the region of thelast historic eruptions. These results show that InSAR is a useful technique for monitoring theentire island, thus allowing us to discover deformations in areas that are not routinely or easilymonitored. This technique has been used in combination with Global Positioning System (GPS)observation of a global network on the island to define a new geodetic monitoring system. Thepossible causes of the deformations observed have been studied in an endeavour to discern ifthey might be of natural origin, in particular linked to a reactivation of prior volcanic activity.Examination of the geophysical observations on the island, human activities underway and theresults of the modelling seem to indicate that at least part of the deformations may be caused bychanges in the groundwater level and therefore are not linked to a volcanic reactivation. Thisresult is important because it implies that, if geodetic volcano monitoring is to be performedon the island, the system used must be capable of discerning between various possible originsof the deformation by analysing their patterns and ancillary information from other sources.In this regard, InSAR is a basic tool on account of its unpaired wide area coverage and spatialdensity.
Key words: crustal deformation, geodesy, groundwater level, SAR interferometry, Tenerife,volcano monitoring.
1 I N T RO D U C T I O N
As described extensively in the existing bibliography, volcanic ac-tivity often is manifested on the surface as ground deformation and
∗Now at: Department of Earth Sciences, University of Western Ontario,London, ON, Canada
gravity changes, which are eruption precursors in some cases. Con-sequently, the traditional monitoring systems based on the use ofseismic, hydrologic, or fumarolic activity observations have beencomplemented with geodetic observations (see e.g. Sigurdsson et al.2000). Geodetic techniques are being used extensively at active vol-canoes (see e.g. Fiske & Shepherd 1990; Dvorak & Dzurisin 1997;Segall & Davis 1997; Fernandez et al. 1999; Sigurdsson et al. 2000;
C© 2005 RAS 33
34 J. Fernandez et al.
Yu et al. 2000) and ground deformation measurement techniquesare proving a powerful tool for understanding the volcanic cycle.Geodetic volcano monitoring includes the deployment of long-terminstrumentation, such as clinometers and extensometers, and regu-lar geodetic network surveying campaigns using classic terrestrialtechniques or Global Positioning System (GPS). Radar interferom-etry technology can be highly useful in this context, as it is a suitabletool for ground deformation monitoring of active volcanic areas (seee.g. Massonnet & Feigl 1998; Burgmann et al. 2000; Hanssen 2001).A key issue is that, whereas geodetic surveying measurements onlyprovide information about certain selected points, Synthetic Aper-ture Radar Interferometry (InSAR) images provide areas of 100 ×100 km, detailing 2-D deformation trends throughout the whole areaof interest and its surroundings, permitting the extrapolation of thefield measurements and the analysis of areas beyond the reach ofthe field deployed instrumentation.
In general, major eruptions are associated with polygenetic volca-noes, i.e. central volcanoes or stratovolcanoes with recurrent erup-tions in the same volcanic structure, the area to be monitored usuallybeing well defined. However, it becomes harder to predict futureeruptions when their likelihood is not limited to a specific volcanobut to a wide active volcanic region. This is the situation in the vol-canic area of Tenerife, where there is an important stratovolcano,Teide, but the last historic eruptions (500 yr ago) did not occurrepeatedly in the same volcanic structure, but occurred at variouslocations around the island.
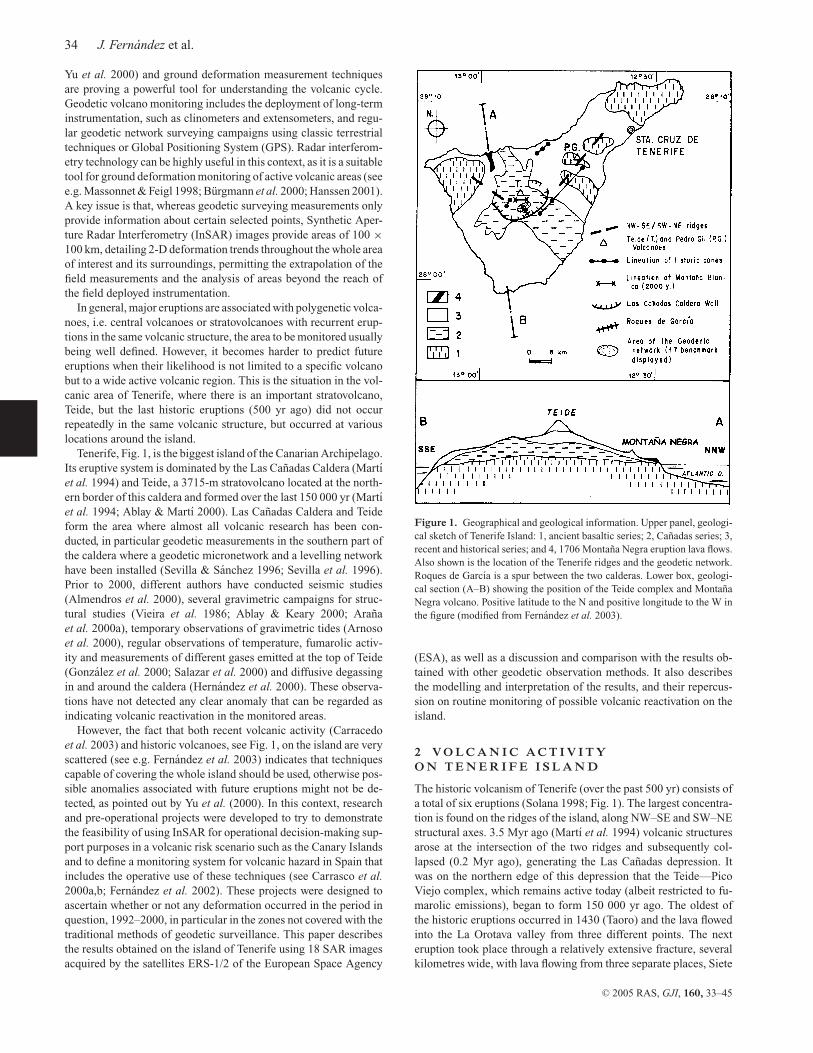
Tenerife, Fig. 1, is the biggest island of the Canarian Archipelago.Its eruptive system is dominated by the Las Canadas Caldera (Martıet al. 1994) and Teide, a 3715-m stratovolcano located at the north-ern border of this caldera and formed over the last 150 000 yr (Martıet al. 1994; Ablay & Martı 2000). Las Canadas Caldera and Teideform the area where almost all volcanic research has been con-ducted, in particular geodetic measurements in the southern part ofthe caldera where a geodetic micronetwork and a levelling networkhave been installed (Sevilla & Sanchez 1996; Sevilla et al. 1996).Prior to 2000, different authors have conducted seismic studies(Almendros et al. 2000), several gravimetric campaigns for struc-tural studies (Vieira et al. 1986; Ablay & Keary 2000; Aranaet al. 2000a), temporary observations of gravimetric tides (Arnosoet al. 2000), regular observations of temperature, fumarolic activ-ity and measurements of different gases emitted at the top of Teide(Gonzalez et al. 2000; Salazar et al. 2000) and diffusive degassingin and around the caldera (Hernandez et al. 2000). These observa-tions have not detected any clear anomaly that can be regarded asindicating volcanic reactivation in the monitored areas.
However, the fact that both recent volcanic activity (Carracedoet al. 2003) and historic volcanoes, see Fig. 1, on the island are veryscattered (see e.g. Fernandez et al. 2003) indicates that techniquescapable of covering the whole island should be used, otherwise pos-sible anomalies associated with future eruptions might not be de-tected, as pointed out by Yu et al. (2000). In this context, researchand pre-operational projects were developed to try to demonstratethe feasibility of using InSAR for operational decision-making sup-port purposes in a volcanic risk scenario such as the Canary Islandsand to define a monitoring system for volcanic hazard in Spain thatincludes the operative use of these techniques (see Carrasco et al.2000a,b; Fernandez et al. 2002). These projects were designed toascertain whether or not any deformation occurred in the period inquestion, 1992–2000, in particular in the zones not covered with thetraditional methods of geodetic surveillance. This paper describesthe results obtained on the island of Tenerife using 18 SAR imagesacquired by the satellites ERS-1/2 of the European Space Agency
Figure 1. Geographical and geological information. Upper panel, geologi-cal sketch of Tenerife Island: 1, ancient basaltic series; 2, Canadas series; 3,recent and historical series; and 4, 1706 Montana Negra eruption lava flows.Also shown is the location of the Tenerife ridges and the geodetic network.Roques de Garcıa is a spur between the two calderas. Lower box, geologi-cal section (A–B) showing the position of the Teide complex and MontanaNegra volcano. Positive latitude to the N and positive longitude to the W inthe figure (modified from Fernandez et al. 2003).
(ESA), as well as a discussion and comparison with the results ob-tained with other geodetic observation methods. It also describesthe modelling and interpretation of the results, and their repercus-sion on routine monitoring of possible volcanic reactivation on theisland.
2 V O L C A N I C A C T I V I T YO N T E N E R I F E I S L A N D
The historic volcanism of Tenerife (over the past 500 yr) consists ofa total of six eruptions (Solana 1998; Fig. 1). The largest concentra-tion is found on the ridges of the island, along NW–SE and SW–NEstructural axes. 3.5 Myr ago (Martı et al. 1994) volcanic structuresarose at the intersection of the two ridges and subsequently col-lapsed (0.2 Myr ago), generating the Las Canadas depression. Itwas on the northern edge of this depression that the Teide—PicoViejo complex, which remains active today (albeit restricted to fu-marolic emissions), began to form 150 000 yr ago. The oldest ofthe historic eruptions occurred in 1430 (Taoro) and the lava flowedinto the La Orotava valley from three different points. The nexteruption took place through a relatively extensive fracture, severalkilometres wide, with lava flowing from three separate places, Siete
C© 2005 RAS, GJI, 160, 33–45

Detection of displacements in Tenerife using InSAR 35
Fuentes (1704 December), Fasnia (1705 January) and Arenas (1705February). The Montana Negra volcano arose in 1706 May, withlava flows that reached the sea in just a few hours. The Chahorraeruption took place in 1879, on the slopes of the Teide—Pico Viejocomplex, and is the longest eruption on record, having lasted nearly 3months, and its lava flows occupied an extensive surface of the of LasCanadas depression. The last eruption, Chinyero, took place in 1909near Chahorra and Montana Negra and was the shortest on record(9 days). There are signs of other subhistoric eruptions, such ascertain pre-Columbian eruptions calculated to have taken place in1341, 1396 and 1444 (Arana et al. 2000b), although there is notenough information to characterize them completely. The erup-tions of the Media Montana and Guimar volcanoes to the southof the island and of Montana Blanca appear to be recent, though nothistoric.
Broadly speaking, all the eruptions listed above are similar innature, being strombolian-type monogenetic eruptions that gener-ate structures no more than 300 m high. The volume of materialreleased is very small, with small lava flows and eruptions that lastbetween a few days and 3 months. Most of the materials releasedare of a basaltic nature, which sometimes evolve from olivine toamphibolous facies and more seldom to intermediate facies (Solana1998), giving rise to changes in the viscosity, which seems to affecthow fast these lava flows reach the sea.
The felsic-plinian eruptions are another type of dangerous vol-canism associated with the central edifice of Las Canadas caldera. Itis non-historic volcanism and its deposits correspond to pyroclasticflows and ignimbritic rocks of phonolitic composition emitted dur-ing three cycles between 1.57 and 0.179 Ma (Martı & Gudmundsson2000). These materials are represented by the stratigraphic levelnamed ‘Bandas del Sur’ (Alonso et al. 1988), occupying a hugezone on the south of the island. The last salic explosive eruption oc-curred in Montana Blanca in the Teide slopes, 2000 yr ago (Ablayet al. 1995). For this reason, we also must consider the possibilityof eruption in the area of this emission centre.
This last type of volcanic activity alone would justify the defini-tion of a geodetic monitoring system to be implemented in a morebroad approach to the volcanic monitoring in the island, includingother techniques (e.g. seismology and geochemistry). Consideringas well the recent volcanic activity, this monitoring system mustbe capable of covering the whole island, not only the area of LasCanadas caldera.
3 S E N S I T I V I T Y T E S T R E S U LT SF O R T H E L A S C A N A DA S G E O D E T I CS Y S T E M
In the past, traditional geodetic monitoring of volcanic activity inTenerife could not be designed to cover the whole island, and insteadfocused on La Caldera and the Teide and Pico Viejo volcanoes, onthe assumption that, with limited resources, the risk was minimizedby monitoring these zones. Until recently, systematic monitoring ofthe whole island was discarded as a result of the high costs involvedand the limited risk.
Yu et al. (2000) used a theoretical model to conduct a sensitiv-ity test of the geodetic network in the Las Canadas Caldera. Thismodel (Okada 1985) uses a realistic source, a dyke, as in Tener-ife most basaltic eruptions have been fed by dykes (Marinoni &Gudmundsson 2000). They changed the depth and location of thedyke to study the variation of the displacements produced. Theyfound that the size and location of the intruded dyke plays a majorrole in determining both the displacement pattern and magnitude.
When the dyke is close to the surface, there is an inversion of thesurface displacement pattern and very large surface displacement atcertain benchmarks. Such phenomena could serve as precursors ofsuch dyke eruptions. Their study clearly shows the need to extendthe existing geodetic network to cover the full island for volcanomonitoring purposes. Obvious options are a GPS network, the useof InSAR or a combination of both techniques. Taking all this intoconsideration, the InSAR technique was regarded as a good optionfor global surveillance of the island.
4 A P P L I C AT I O N O F I N S A RI N T E N E R I F E
With the launch of the ERS-1 (1991) and ERS-2 (1995) satellitesfrom the ESA and the further developments in radar processing,InSAR began to be used for ground deformation measurement.This technique exploits the properties of coherent radar images tomake centimetre differential measurements between two differentdates of the satellite-to-ground distance, thanks to accurate phasemeasurements at microwave frequencies (see e.g. Massonnet 1997;Massonnet & Feigl 1998; Rosen et al. 2000; Hanssen 2001). Typ-ically, with the ERS satellites, a ground deformation of 28 mmresults in a 2π phase shift, or a fringe, in the interferogram. In prac-tical cases, we are able to deliver blanket coverage, with a densityup to four measurements per hectare (after spatial filtering to reducenoise) over a 100 × 100 km area, which is the typical satellite imagesize. Space-borne radar sensors behave like an electronic distancemeter capable of making a measurement update of an area understudy every 35 days, which is the time it takes for a satellite to re-visit the same zone. The key benefit is the possibility to provide the2-D perspective of the deformation trends over large areas and longtime spans. An additional advantage is the availability of a hugeworldwide data archive from the ERS satellites that enables a retro-spective study of ground deformation without any fieldwork; since1991, the data has been recorded by an ESA scientific backgroundmission and much of it remains unexploited.
The major limitations of the technique are associated with phasenoise, or coherence degradation over vegetated areas or surfaceswhose microwave backscattering is not stable over time (temporaldecorrelation; e.g. Massonnet & Feigl 1995). Typical volcanic land-scapes covered with lava and exposed rocks are well suited for theapplication of differential InSAR. The second limitation is associ-ated with changes in atmospheric propagation conditions, which,if not properly isolated, can be mistaken for ground displacement(e.g. Hanssen 2001). The main atmospheric factors that appear su-perimposed on the deformation patterns in the interferograms arewater vapour content and atmospheric layering (pressure and tem-perature), sometimes associated with topography (e.g. Puglisi &Coltelli 2001).
As a prerequisite to our study and as a key step to ensure thefeasibility of the technique for operational monitoring in our sce-nario, we needed to assess that the interferometric coherence washigh enough to enable ground deformation measurement over longtime spans (years). If the surface of the island remains coherent, thedifferential interferograms and the fringes that may appear in themcan be studied in an endeavour to determine their origin: grounddisplacements (that may be associated with new volcanic activity)or phase artefacts (caused by a poor quality digital elevation model,DEM, by atmospheric interferences, etc.). Our study of Tenerife wasbased on 18 images (Table 1), acquired by the ERS satellites of theESA from 1992–2000 and that were selected in accordance with thefollowing criteria.
C© 2005 RAS, GJI, 160, 33–45

36 J. Fernandez et al.
Table 1. ERS images from track 352 and frame 3036 used in the Tener-ife study. All were acquired from the descending pass. No. indicates theasigned number to each image, SAT denotes the satellite, E1 is ERS-1and E2 is ERS-2. Perpendicular baseline (B⊥) refers to the 1992 May 26image.
No. SAT ORBIT DATE TIME B⊥
1 E1 21382 17-08-95 11:42 5782 E2 1709 18-08-95 11:42 4893 E1 4505 26-05-92 11:41 04 E1 10517 20-07-93 11:42 2875 E1 20380 08-06-95 11:42 4586 E1 20881 13-07-95 11:42 1467 E1 21883 21-09-95 11:42 2418 E1 22885 30-11-95 11:42 2469 E2 6218 28-06-96 11:42 49410 E2 6719 02-08-96 11:42 47211 E2 7220 06-09-96 11:42 15012 E2 11228 13-06-97 11:42 37213 E2 14234 09-01-98 11:42 35814 E2 17240 07-08-98 11:42 65815 E2 26759 02-06-00 11:41 64216 E2 28262 15-09-00 11:41 46017 E2 28763 20-10-00 11:41 40018 E2 29765 29-12-00 11:41 125
(i) Baseline: the spatial distance between the two points of spacefrom which we obtain the two SAR images projected perpendicularto the line of sight. The perpendicular baseline (B⊥) ranges from afew metres to hundreds or even thousands of metres. The perpendic-ular baseline must never exceed 1200 m (theoretical critical baselinein interferometry for the ERS over flat terrain), because the phasedifferences in the two images would be too large to obtain a clearinterferogram. In practice, smaller baselines are used. We studiedthe island of Tenerife by combining images with a perpendicularbaseline of less than 350 m.
(ii) Selection of images in the driest months: in order to minimizetemporal decorrelation, most images were selected out of the winterseason, the months when Teide is likely to be covered in snow.
(iii) Images evenly spaced in time: the goal was to demonstratethat InSAR could be applied to monitoring volcanic activity on
Figure 2. Coherence images of Tenerife, showing how the coherence decreases as number of days between images (�d) increases. (a) 13Jun97–9Jan98;B⊥ = 14 m; �d = 210 days. (b) 2Aug96–15Sep00; B⊥ = 8 m; �d = 1505 days. B⊥ denotes perpendicular baseline.
Tenerife, so we endeavoured to obtain images of every year from1992 to 2000, in order to have temporal sampling of what occurredduring each year.
The selected SAR images were processed with the EPSIE softwaredeveloped by Indra Espacio (Martınez & Moreno 1997). The differ-ential interferograms were generated with an external DEM, witha resolution of 25 m, which enables accurate correction of the to-pographic components in the mountainous island for whatever thebaseline.
The use of an ancillary DEM, instead of correcting the topo-graphic phase from additional InSAR data (such as 1-day spacedERS-1/2 Tandem data), reduces the impact of atmospheric artefacts.This DEM is provided commercially by the Instituto GeograficoNacional Centro Nacional de Informacion Geografica (IGN-CNIG)and it is a standard product available over all the Spanish territory.It is obtained from the restitution level curves, as well as all thebounded points and break lines (watercourses, watersheds, etc.).A 25-m grid is applied to these 3-D files with the Stuttgart Con-tour Software (SCOP) programme, which uses the least-squares–collocation method. The quality of the Mapa Topografico Nacional(MTN) 25 can be estimated as 4.5 m of standard reliability.
We have obtained 21 differential interferograms, see Table 2, fromthe 18 SAR images. There follows a brief description of technicalresults.
(i) Coherence: Tenerife coherence images have shown that thesurface of certain parts of the island has remained stable over longperiods of time (up to 7 yr). The coherence is to be seen above allin the area of Las Canadas Caldera and the ridges (Fig. 2), in thoseregions where the last eruptions took place and that, according torecent studies (Arana et al. 2000b), pose the main volcanic hazardin line with the type of volcanism of the island. The high coherenceobtained in these areas is a result of the fact that they are coveredby the lava of the different eruptions with little or no vegetation andthat remains stable. The southern part of the island is also coher-ent in most of the images obtained, depending on the B⊥ and thetime that has elapsed between them. Fig. 2 displays examples thatshow the variation in coherence on the island for different B⊥ anddays. The smaller the time interval and the shorter the baseline
C© 2005 RAS, GJI, 160, 33–45

Detection of displacements in Tenerife using InSAR 37
Table 2. Pairs of images used to obtain the 21 interferograms using the 18 images indicating theperpendicular baseline in metres. No. is the assigned number to every image given in Table 1.
No. 4 5 6 7 8 9 10 11 12 13 14 15 16 17 18
3 2874 140 40 136 86 72 347 180 1625 85 99 1846 478910 101 185 81112 14 2813 30114 2315 168
between the two images, the greater is the coherence of the interfer-ogram (Fig. 2a). High coherence ensures a clear interferogram andbetter detection of any displacement that might occur on the surfaceof the island. The least coherent areas of the island are in the north,from Punta Teno in the west to Punta de Anaga in the east. Thecentre of the island is surrounded by a vegetation ring (pine trees),making it hard to obtain accurate phase measurements, even with ashort lapse of time between each image (Fig. 2a).
(ii) Differential fringes: the 21 differential interferograms ob-tained showed fringes. An interpretation of these is needed to dis-tinguish between deformation and atmospheric errors. Whereas bigdeformation patterns (over two cycles in a single interferogram)are easily evidenced, small deformations about one phase cycle canbe confused with atmospheric interference and require more thanone interferogram to be confirmed. In practice, this has to be doneby comparing interferograms from different dates with a commontime span or time-series. Next we describe the interpretation of theinterferograms.
All the interferograms with a time interval of more than 7 monthsshow concentric fringes in the northwestern part of the island(Montana Negra deformation in Garachico: Fig. 3, panel 1), ap-proximately 4 km to the south of Garachico, where the MontanaNegra volcano lava flow (1706; Fig. 1) reached the port of the town.The lava flow is surrounded by pine forests and undergrowth (brush-wood and shrubs). The vegetated areas are not coherent enough andare degraded even in a tandem interferogram (1-day separation),masking the deformation outside the lava flow. The interferogramswith a time interval of more than 4 yr and those processed withimages from 1998 to 2000 show an additional deformation patternwith a fringe attributable to a second deformation to the south of theaforementioned one (Chıo deformation: Fig. 3, panel 2), in an areaof the NW–SE ridge also covered by volcanic material. The hypoth-esis that these fringes were the result of atmospheric interferencewas discarded because they appeared in independent interferograms(i.e. interferograms that did not have any images in common and in-cluded the same time span) and the number of fringes seemed toincrease linearly with the interval of time between the images thatformed them (Fig. 3, panel 3). Both deformations correspond to asmall ground subsidence. The three fringes in the Garachico de-formation are equivalent to 8.4 cm in the LOS and, considering allthe deformation is vertical displacement, to 9.1 cm of subsidencebetween 1992 and 2000, over an area approximately 15 km2. Thereis one fringe in the Chıo deformation, equivalent, with the sameassumptions as before, to a subsidence of 3 cm between 1992 and
2000, over an area approximately 8 km2. The Garachico deforma-tion has evolved more steadily, by approximately 1 cm yr−1 since1992, whereas the Chıo deformation was almost the same size in1992–1998 as in 1998–2000 and seems to have increased more inthe latter period (Fig. 3, panel 3).
The most closely monitored area of the island, Las CanadasCaldera, has different fringes in most of the interferograms, albeitwithout the same pattern, suggesting that they are of atmosphericorigin. In addition, in several interferograms (e.g. Fig. 4, panel 4) thearea appears flat (without fringes), indicating the absence of defor-mations. Therefore, we can conclude that there was no significantdisplacement in the Las Canadas Caldera, at the centimetre level,between 1992 and 2000. This result coincides with those obtainedfrom the observations conducted in the La Caldera networks from1984 to 2000 (Fernandez et al. 2003).
All the Tenerife differential interferograms show, to a greater orlesser extent, interference (more than two fringes in some cases)that cannot be attributed to deformation, or to DEM errors (dis-carded beforehand as a result of the quality of the DEM used), butto atmospheric errors. The two main causes of atmospheric errorsare topography and the tropospheric water vapour content. Tenerifeis a clear example of the problem that arises when there is an un-even topography in the area to be studied with InSAR (3715 m topheight in Teide volcano). Several differential interferograms displayconcentric fringes surrounding La Caldera de Las Canadas. Fig. 4(panel 4) displays one of these interferograms, which contains twoof these fringes. If these were misinterpreted as ground displace-ments, it would indicate that the centre of the island had risen 6cm between 1997 and 1998, which would have been noticed in theconcurrent field observations made on the island and, of course, inthe other interferograms. The other interferences that appear in thedifferential interferograms and that cannot be attributed to defor-mation or to topographical-type atmospheric errors have also beenassociated with atmospheric errors because they seem to be causedby the particular phase pattern of a particular image. Fig. 4 displaysthree differential interferograms that have in common the image of9 January 1998 and a similar pattern of interference in the westernpart of the island (visible when the coherence permits it), whichis assumed to be caused by the atmospheric components in the im-age. Again, if only these InSAR images were available for analysis,the Chıo deformation would have been masked by the atmosphericerrors. Based in our experience, slight deformations down to onecycle (like the one in Chıo) can be detected by an experienced eyein the middle of atmospheric interference as far a SAR multipleobservations are available over time.
C© 2005 RAS, GJI, 160, 33–45

38 J. Fernandez et al.
Figure 3. Differential interferogram of Tenerife, processed with 1993 July 20 and 2000 September 15 images: panel 1, Garachico deformation (three fringes);panel 2, Chıo deformation (one fringe); panel 3, cuttings/clippings of several differential interferograms of Tenerife, showing how the subsidence evolves intime. Above, Garachico deformation; below, Chıo deformation.
C© 2005 RAS, GJI, 160, 33–45

Detection of displacements in Tenerife using InSAR 39
Figure 4. Differential interferograms of Tenerife. Images in panels 1, 2 and 3 have in common the 1998 January 9 image, thus atmospheric effects in thisimage must cause the interference on the western part of the island (marked in white), the pattern being very similar in all four images. The image in panel 4shows fringes correlated with the topography and flat phase over Las Canadas Caldera.
5 G P S VA L I DAT I O N O F T H EO B S E RV E D S U B S I D E N C E
Considering both the results obtained from the theoretical studiesand from the experimental studies using the SAR technology, it wasdecided to establish and observe a GPS network of homogeneousdensity (Fernandez et al. 2003). The chief objective was to define anew system for the geodetic monitoring of deformation associatedwith volcanic activity on the island of Tenerife using both tech-niques, GPS and InSAR. A further basic objective was to validatethe deformations determined by InSAR and the GPS network wasdensified in the northwestern area of the island (Montana Negralava flow), to the south of Garachico, where deformation has beendetected using InSAR. We selected 17 vertices from the existingnetwork, with accurate coordinates determined by the REGCAN-95 geodetic system (Caturla 1996) plus the permanent station atSanta Cruz de Tenerife (TENE; Gonzalez-Matesanz & Dalda 2001;Fernandez et al. 2003). The geographical distribution of the generalnetwork vertices can be seen in Fig. 5. The results obtained fromGPS observations are described in detail by Fernandez et al. (2003,
2004). What follows is a summary with some discussion in relationto the results obtained using InSAR.
The data collected during the 2000 survey was processed usingBERNESE 4.2 software (Beutler et al. 2001) with precise ephemere-des. The global network and densification data were processedseparately. The results obtained are accurate to 1 cm in heightand several millimetres in horizontal coordinates. Comparing 2000and 1995 coordinates for all the stations, Fernandez et al. (2003)observe that the network and its densification have an averagesensitivity to vertical displacements of approximately 2 cm, withextreme values of 6 and 7 cm. There are no major differencesgreater than 3 cm and larger than twice σ , where σ is the meansquare error of the difference in ellipsoidal height, except at sta-tions Pto. de la Cruz, Retama, Pinar de Chio, Mozos and C747,of the fourth order, in all cases indicating a decrease in the alti-tude of the station. At the other stations, height concordance is verygood.
The height decrease in Pinar de Chıo station, 4.9 cm, is of the sameorder as obtained in the SAR observations in the Chıo zone. Thissubsidence is accompanied by a horizontal disent towards the west
C© 2005 RAS, GJI, 160, 33–45

40 J. Fernandez et al.
Figure 5. Global GPS network and densification (right lower corner) (after Fernandez et al. 2003).
of approximately 2 cm. Therefore, to begin with, the GPS resultsconfirm the SAR ones.
The subsidence values found at Puerto de la Cruz station areof greater magnitude, but is most likely a very local deformation.This is confirmed by the observation of several fractures in thebreakwater at the port where this station is located (Fernandez et al.2003). Radar interferometry does not provide information in thisvery small zone. Retama station is where the greatest subsidence,13 cm, is found, together with approximately 3 cm of southerlydisplacement in the 5 yr between both observations, but this stationis located in a zone where, as a result of the existence of densevegetation, the coherence is null, so no results have been obtainedusing InSAR. This is an example where GPS and SAR complementone another in monitoring deformations on the island. Mozos stationis also located in a zone of very low coherence, so interferometryresults are not available there either. The fourth-order station C747is located on the roof of a small water tank, the height of whichis more than likely to vary depending on the level of water in thetank. Therefore, as the variation in coordinates is not significant, itwas not used in the following campaigns (Fernandez et al. 2003,2004).
The results obtained in the deformation area located to the southof the town of Garachico were not definitive enough to confirm thedisplacements detected using InSAR. New GPS campaigns wereperformed in 2001 and 2002 (Fernandez et al. 2004). The compari-son of coordinates between 1995, 2000, 2001 and 2002 is shown inFig. 6. The comparison of the 2001 and 1995 coordinates at the Pinar
de Chıo station (Fernandez et al. 2004) confirmed the subsidenceresults obtained by InSAR. In addition, horizontal displacements ofaround 1 cm in the N–W direction are detected. The vertical defor-mation obtained upon comparing the values of 2000 and 2001 arenot significant, as was expected. The horizontal deformation resultsare significant again in the N–W direction. Comparing the 2002and 1995 coordinates shows the height values to be quite identical,with differences below precision level. Horizontal displacement isstill in the N–W direction, increasing in magnitude to the N anddecreasing to the W. If one compares 2002 to 2000, the horizontaldisplacement is still N–W, but compared with the results for 2001,the displacement is N–E. In short, vertical displacement at the Pinarde Chio station (see Fig. 6) indicates clear subsidence from 1995 to2000 (coinciding with InSAR results) and elevation from 2000 to2002.
At the Roque de Ucanca station, upon comparison of the differ-ent epochs, we observe a slight subsidence, though not significantabove the noise level. The horizontal components display a N–Wdisplacement, as in Pinar de Chıo. In the fourth-order pin C774, thevertical coordinate variations in the comparison of 2000, 2001 and2002 with respect to 1995 were not significant because the 1995coordinates were not very accurate. Comparison between 2000 and2001 results are not significant either, but comparing 2002 with 2000and 2001 values gives clearly significant subsidence. Comparing the2000 coordinates with 2001 and 2002 reveals horizontal displace-ment in the S–W direction. Comparing the 2002 and 2001 revealsN–W displacement.
C© 2005 RAS, GJI, 160, 33–45

Detection of displacements in Tenerife using InSAR 41
Figure 6. Horizontal and vertical displacement with errors. Vectors with error ellipses for horizontal motions and with error bars for vertical motions.Differences, given in centimetres, are computed by comparison of coordinates measured in 1995, 2000, 2001 and 2002 for the repeated stations of theDeformation Zones (DZs) micronetwork. For example, 00–95 indicates the differences between 2000 and 1995 coordinates. The equivalence between codes andnames for the stations where they are different is as follows: C151 = Riquer; C152 = Pinar de Chıo; C202 = Roque de Ucanca. (After Fernandez et al. 2004).
At stations CLV1 and CLV2, comparing the 2001 and 2000coordinates, the vertical coordinate differences are not signifi-cant (Fernandez et al. 2004). As a result of its disappearance,CLV2 was not observed in 2002. Comparing the 2002 coordi-
nates of CLV1 with the 2000 and 2001 values (see Fig. 5),we observe a clear and significant subsidence with clear hori-zontal displacement. Station Riquer shows subsidence and a N–W displacement. For further details about the GPS observation
C© 2005 RAS, GJI, 160, 33–45

42 J. Fernandez et al.
and results see Fernandez et al. (2003) and Fernandez et al.(2004).
In summary, in the areas where there is coherence and InSARcan be applicable, concordance between InSAR and GPS resultsis found. Also coordinate variations have been detected in areaswhere radar observation cannot be used for deformation monitor-ing as a result of very low coherence. We are talking about maxi-mum displacements between 1 to 2 cm per year during the period1992–2000 that can be detected using both observation techniquesin appropriate conditions. We have shown that, applied properly, thetwo techniques are complementary and should be combined in anymonitoring methodology that is to be efficient in detecting possibledeformations associated with volcanic reactivation on the island.Finally, the use of GPS technique will give us information aboutthe 3-D deformation field, not possible to obtain using only InSARtechniques.
6 D I S C U S S I O N A N DI N T E R P R E TAT I O N
One important goal of this work was the determination of the possi-ble cause or causes of the detected deformations. In addition, thesecauses might differ from one area to another. In a volcanic area suchas the island of Tenerife, subsidence can be triggered by differentnatural causes associated with volcanic activity. A first discussionmay be seen in Fernandez et al. (2003), although no one hypothesisis favoured over another. This paper addresses this issue more thor-oughly and seeks to ascertain whether the origin might be natural,in particular a magmatic reactivation process, or is related to humanactivity on the island.
The first possible natural cause linked to volcanic activity is com-paction of the lava. Both subsidence locations are in the area wherethe last eruptions on the island took place (NW–SE dorsal), so onemight hypothesize that they are the result of the compaction ofthe material expelled during such eruptions. Even though a morein-depth study of the area would help to discard it altogether, by cal-culation of the date when they began to occur (the interferogramsobtained show that the subsidence increased from 1992 to 2000, butthe exact start is not known as there are no SAR images prior to thatdate), this cause seems very unlikely to produce the observed defor-mation almost one century or more after the end of the eruptions.
Another possible cause of the detected subsidence could be thatthe magmatic chambers collapsed after they were emptied. However,this does not seem a serious candidate for two reasons. First, thefact that the magmatic intrusions in the ridge areas are dykes meansthat the magma rises directly from the mantle and there are not largechambers in which it can accumulate (Marinoni & Gudmundsson2000). Secondly, the eruptions took place more than one centuryago.
The last possible natural cause could be volcanic reactivation.Taking into account the type of volcanism described above (dykeintrusions), subsidence could be precursor of an eruption if the dykewas close to the surface (Yu et al. 2000). In such an event, therewould have been a certain amount of seismic activity in the zone,associated with the rise of magma, probably increasing with time.According to the figures provided by the IGN (Blanco, private com-munication, 2003), there has been no seismic activity in either of thetwo deformation areas from 1985 to 2003 March with a magnitudeof 2.5 or greater (the magnitude threshold of the seismic stations inthe island). Nor have the observations conducted in the area detectedany clear gas anomalies (Perez, private communication, 2002). Hadthere been an intrusion, particularly a shallow intrusion, in one orboth zones, one would expect these and other types of geodynamic
Figure 7. Decreasing underground water level, estimated for the pe-riod 1985–2000 in that part of the island including the deformation ar-eas. (Modified from Plano 16 from the Document no. 2 of the graphicaldocumentation of the Plan Hidrologico Insular de Tenerife, http://www.aguastenerife.org/sup.html)
manifestations to have occurred in the last years and this has notbeen the case.
Therefore, it seems one can discard the hypothesis that naturalcauses are associated with volcanic activity, although the deforma-tions detected should continue to be researched and observed on apermanent basis, in view of the volcanic nature of the island and thepotential risk.
We now consider the possible causes linked to human activity. Onthe island of Tenerife large amounts of groundwater are pumped outthrough galleries, boreholes and wells. The water supply in Tener-ife comes from underground water located in a general saturatedzone, which is extracted through horizontal tunnels (galleries) in-land and vertical boreholes and wells on the coast (Gobierno deCanarias, Cabildo Insular de Tenerife, 1989). It is worth noting thatthe Garachico deformation is in an area scattered with galleries andthat the area of the biggest deformation is located at the intersec-tion of several of them. The Chıo deformation is not intersected bygalleries, but several of them are very close to it. Moreover, bothlocations, as well as the Retama GPS station, where subsidenceof more than 10 cm was detected (Fernandez et al. 2003), are inthose areas of the island where the groundwater level has droppedthe most as a result of groundwater extraction, as shown in Fig. 7(Insular de Consejo/Aguas de Tenerife, 2002).
It is reasonable to consider that the decline in the groundwaterlevel might be at least partly to blame for the deformations de-scribed above. This hypothesis is supported by the fact that no ev-idence has been found for additional widespread activity to justifythe appearance of the different subsidence regions detected in largeareas scattered around the surface of the island. Nor should oneforget that clear examples of surface displacement associated withchanges in groundwater levels are being detected, using InSAR andother techniques, in many places around the world (e.g. Massonnetet al. 1997; Galloway et al. 1998; Amelung et al. 1999; Burgmannet al. 2000; Galloway et al. 2000; Hoffmann et al. 2001; Le Mouelicet al. 2002). Another reason to consider this hypothesis is the fact
C© 2005 RAS, GJI, 160, 33–45
Detection of displacements in Tenerife using InSAR 43
that, since 2000, there has been a clear increase in rainfall on theisland (Farrujia, private communication, 2002), as a result of whichgroundwater levels may have risen in some areas of the island. Thiswould be consistent with the observations at Pinar de Chıo station,where via GPS observation it was noted that, after the subsidencefrom 1995 to 2000 (coinciding with InSAR results), elevation in-creased from 2000 to 2002 (see Fig. 6).
In order to test this hypothesis, we interpreted the displacementsusing the model developed by Geertsma (1973) and used in similarproblems by different authors (e.g. Xu et al. 2001; Le Mouelic et al.2002). We will only consider the vertical component of the displace-ment in our study, which seeks to establish or discard whether thereis any connection between the two phenomena, the deformationsobserved in the period 1992–2000 and the extraction of groundwa-ter, and to try to model the observed displacement by InSAR. Herethe deformation will be considered, to first order, as subsidence. Themodel assumes that the reservoir is a circular disc of radius R andheight h buried parallel to the flat earth surface at depth D. The earthis treated as an elastic half-space with a Poisson’s ratio σ .
We want to note the following aspects:
(i) we consider here the possibility that the decline in the ground-water level can be related to the observed displacement, but we donot assume it is the only one origin for them;
(ii) the model is a simple one and does not reproduce totally thereal situation on Tenerife Island, therefore it is only a first approxi-mation;
(iii) our objective is to study if the hypothesis (i) looks reasonableafter the modelling results.
Thus the vertical component of the displacement of the surface uis (Geertsma 1973)
u = (2σ − 2)�h R
∫ ∞
0e−Dα J1(αR)J0(αr ) dα, (1)
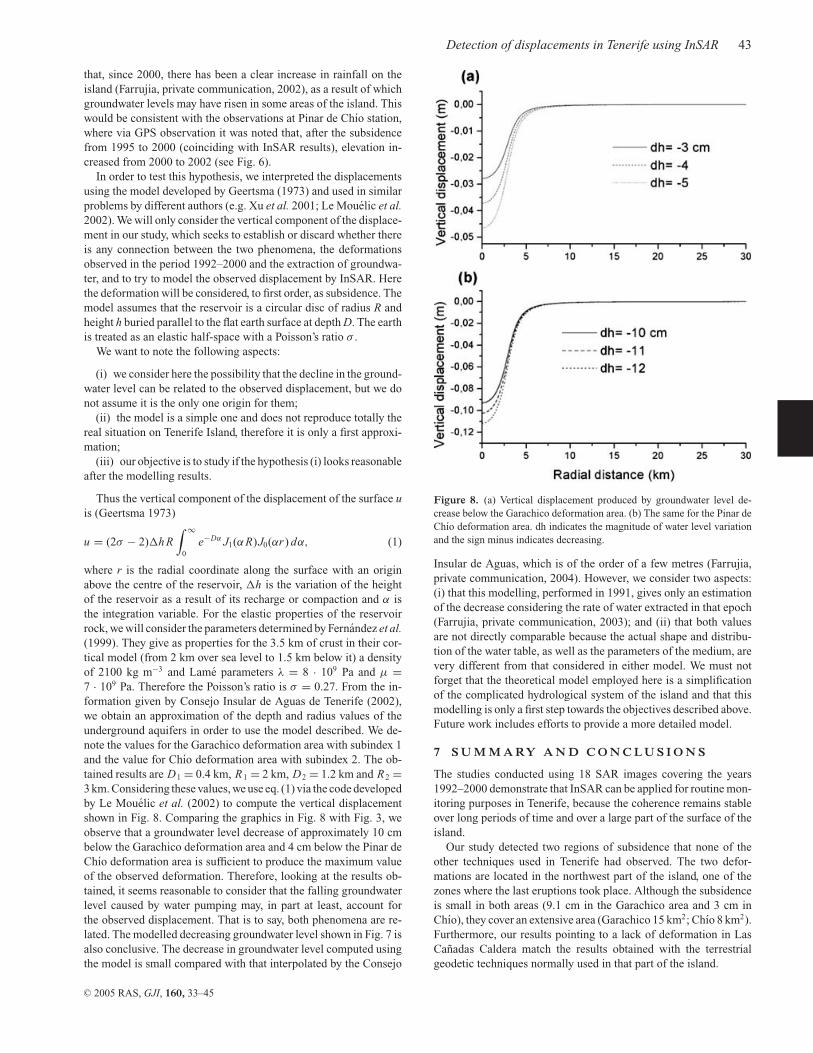
where r is the radial coordinate along the surface with an originabove the centre of the reservoir, �h is the variation of the heightof the reservoir as a result of its recharge or compaction and α isthe integration variable. For the elastic properties of the reservoirrock, we will consider the parameters determined by Fernandez et al.(1999). They give as properties for the 3.5 km of crust in their cor-tical model (from 2 km over sea level to 1.5 km below it) a densityof 2100 kg m−3 and Lame parameters λ = 8 · 109 Pa and µ =7 · 109 Pa. Therefore the Poisson’s ratio is σ = 0.27. From the in-formation given by Consejo Insular de Aguas de Tenerife (2002),we obtain an approximation of the depth and radius values of theunderground aquifers in order to use the model described. We de-note the values for the Garachico deformation area with subindex 1and the value for Chıo deformation area with subindex 2. The ob-tained results are D1 = 0.4 km, R1 = 2 km, D2 = 1.2 km and R2 =3 km. Considering these values, we use eq. (1) via the code developedby Le Mouelic et al. (2002) to compute the vertical displacementshown in Fig. 8. Comparing the graphics in Fig. 8 with Fig. 3, weobserve that a groundwater level decrease of approximately 10 cmbelow the Garachico deformation area and 4 cm below the Pinar deChıo deformation area is sufficient to produce the maximum valueof the observed deformation. Therefore, looking at the results ob-tained, it seems reasonable to consider that the falling groundwaterlevel caused by water pumping may, in part at least, account forthe observed displacement. That is to say, both phenomena are re-lated. The modelled decreasing groundwater level shown in Fig. 7 isalso conclusive. The decrease in groundwater level computed usingthe model is small compared with that interpolated by the Consejo
Figure 8. (a) Vertical displacement produced by groundwater level de-crease below the Garachico deformation area. (b) The same for the Pinar deChıo deformation area. dh indicates the magnitude of water level variationand the sign minus indicates decreasing.
Insular de Aguas, which is of the order of a few metres (Farrujia,private communication, 2004). However, we consider two aspects:(i) that this modelling, performed in 1991, gives only an estimationof the decrease considering the rate of water extracted in that epoch(Farrujia, private communication, 2003); and (ii) that both valuesare not directly comparable because the actual shape and distribu-tion of the water table, as well as the parameters of the medium, arevery different from that considered in either model. We must notforget that the theoretical model employed here is a simplificationof the complicated hydrological system of the island and that thismodelling is only a first step towards the objectives described above.Future work includes efforts to provide a more detailed model.
7 S U M M A RY A N D C O N C L U S I O N S
The studies conducted using 18 SAR images covering the years1992–2000 demonstrate that InSAR can be applied for routine mon-itoring purposes in Tenerife, because the coherence remains stableover long periods of time and over a large part of the surface of theisland.
Our study detected two regions of subsidence that none of theother techniques used in Tenerife had observed. The two defor-mations are located in the northwest part of the island, one of thezones where the last eruptions took place. Although the subsidenceis small in both areas (9.1 cm in the Garachico area and 3 cm inChıo), they cover an extensive area (Garachico 15 km2; Chıo 8 km2).Furthermore, our results pointing to a lack of deformation in LasCanadas Caldera match the results obtained with the terrestrialgeodetic techniques normally used in that part of the island.
C© 2005 RAS, GJI, 160, 33–45

44 J. Fernandez et al.
Atmospheric artefacts are present in the interferograms and phaseinterferences appear as a result of additional components associatedwith stratification resulting from large height variations. These didnot prevent us from detecting the deformations because we used alarge data archive with different interferograms covering the sametime span also enabling multiple time-series.
The N–E part of the island is harder to monitor with the ERSsatellites (which operate in the C band) as a result of the abundantvegetation. The best option at present time is to combine InSARobservation with another technique, GPS, in order to effectivelymonitor the entire island. We have defined a GPS network that coversthe whole island with densification in the deformation zone to thesouth of Garachico and a station in the middle of the Pinar de Chıodeformation zone (Fernandez et al., 2003). The whole of the newnetwork was observed in 2000 August, allowing us to validate thedeformation obtained in Chıo. The two techniques, InSAR and GPS,have been combined to define a new system for geodetic monitoringof possible displacements associated with volcanic reactivation. Thedensified GPS network covering the two deformation areas was re-observed in 2001 and 2002, allowing for the detection of a reboundin the Pinar de Chıo area and additional subsidence in the Garachicozone.
Our goal is to detect, with the combination of both techniques,GPS and InSAR, vertical displacements on the order of 1–2 cmyr−1, taking into account the results obtained using InSAR and GPSin the time period 1992–2000. We have shown that both techniquesare able to detect that magnitude of displacement. For the GPS cam-paigns, this is described by Fernandez et al. (2003, 2004). For radarinterferometry, the temporal sampling is related to the deformationrate, so that it is more useful to discuss the absolute deformation andnumber of interferograms. Practically, we could detect 1–1.5 cm af-ter 1 yr of continuous imaging over the same area (between 5 and10 images); e.g. this is in line with the detection of Chıo deformationafter 8 yr. GPS observations should give the 3-D deformation field,but for only a few points in the island (20 stations if we considerglobal GPS network and densification). The use of GPS allows forthe collection of deformation data in the parts of the island wherethere is no coherence and therefore InSAR is not applicable. In theareas where there is good coherence, InSAR should give us a muchbetter spatial resolution. This fact is really important if we wantto discriminate between deformation patterns produced by differentsources (e.g. water table level variation versus dyke intrusion). In thecase of volcanic reactivation, it would be necessary to include per-manent GPS observation in this network in order to give continuoustemporal observations.
A first attempt has been made to interpret the subsidence usinga simple theoretical model (Geertsma 1973) that can only be re-garded as a rough approximation to the real problem on the islandof Tenerife, as a result of both the type of reservoir and the mediumconsidered (homogeneous and without fractures). However, there isclearly a need to continue with this research, with further monitoringof the displacements in order to study their evolution, and furtherinterpretation, including the examination of an additional type ofgeophysical data (gravity, gases, etc), with detailed and up-to-dateinformation about the evolution of the groundwater, and the devel-opment of models that represent the characteristics of the islandmore accurately.
Finally, it must be stressed that this research is very important,not only for the study of displacements that might be associated, atleast in part, with the extraction of groundwater, but also because itunderscores that the volcanic monitoring system in the island mustbe capable of clearly distinguishing them from other displacements
on the surface of the island that might be linked to a future magmaticreactivation. Doing so entails having a technique with the highestpossible spatial resolution and sufficient precision in the geodeticmonitoring. InSAR is one such technique. If the C band is used inradar observation, InSAR would have to be combined, for example,with GPS, with a dense enough network of stations, in the NE partof the island, to overcome the coherence loss problem posed by thedense vegetation. The ideal solution would be to use InSAR in theL band, which could be used to obtain a displacement map (withlower sensitivity but vegetation independent), albeit with the currentlimitation of still not having the three components of deformation.In this case, a complementary GPS observation would not need tobe so dense. Furthermore, it is clear that measuring displacementsis only one part of an effective volcanic monitoring system, whichwill include other techniques such as gravimetry, seismology andgas observation, to name only a few.
A C K N O W L E D G M E N T S
This research has been supported by ESA-ESRIN (EuropeanSpace Research Institute) Contract No. 13661/99/I-DC DECIDE-VOLCANO and Ministerio de Ciencia y Tecnologıa (MCyT)projects AMB99-1015-C02 and REN2002-03450. The work of KFTis supported by Natural Sciences and Engineering Research Coun-cil (NSERC) Canada. We thank the Consejo Insular de Aguas deTenerife for information about underground water level variation.We thank S. Le Mouelic for giving us the code for theoretical com-putations, I. Farrujia and J. Coello for their useful comments andM. J. Blanco, Centro Geofısico de Canarias, IGN, Ministerio de Fo-mento, for the information about seismic activity in Canary Islands.We thank two anonymous reviewers for their useful comments.
R E F E R E N C E S
Ablay, G.J. & Keary, P., 2000. Gravity constrains on the structure and vol-canic evolution of Tenerife, Canary Islands, J. geophys. Res., 105, 5783–5796.
Ablay, G.J. & Martı, J., 2000. Structure, Stratigraphy, and evolution ofthe Pico Teide-Pico Viejo formation, Tenerife,Canary Islands, J. Volc.Geotherm. Res., 103, 175–208.
Ablay, G.J., Ernst, G.G.J., Martı, J. & Sparks, R.S.J., 1995. The -2 ka sub-plinian eruption of Montana Blanca, Tenerife. Bull. Volcanol., 57, 337–355.
Almendros, J. et al., 2000. A double seismic antenna experiment at Teidevolcano: existence of local seismicity and lack of evidences of volcanictremor, J. Volc. Geotherm. Res., 103, 439–462.
Alonso, J.J., Arana, V. & Martı, J., 1988. Las ignimbritas de Arico (Tenerife).Mecanismos de emision y emplazamiento, Rev. Soc. Geol. Esp, 1, 15–24.
Amelung, F., Galloway, D.L., Bell, J.W., Zebker, H.A. & Laczniak, R.J., 1999.Sensing the ups and downs of Las Vegas: InSAR reveals structural controlof land subsidence and aquifer-system deformation, Geology, 27(6), 483–486.
Arana, V., Camacho, A.G., Garcıa, A., Montesinos, F.G., Blanco, I., Vieira,R. & Felpeto, A., 2000a. Internal structure of Tenerife (Canary Islandas)based on gravity, aeromagnetic and volcanological data, J. Volc. Geotherm.Res., 103, 43–64.
Arana, V., Felpeto, A., Astız, M., Garcıa, A., Ortız, R. & Abella, R., 2000b.Zonation of the main volcanic hazards (lava flows and ash fall) in Tenerife,Canary Islands. A proposal for a survillance network, J. Volc. Geotherm.Res., 103, 377–391.
Arnoso, J., Fernandez, J., Vieira, R., Velez, E.J. & Venedikov, A.P., 2000.Results of tidal observations in Tenerife, Canary Islands, Mar. Terr. Bull.Inf., 132, 10 283–10 290.
Beutler, G. et al., 2001. Bernese GPS software version 4.2, AstronomicalInstitute, University of Berne, Switzerland, p. 515.
C© 2005 RAS, GJI, 160, 33–45
Detection of displacements in Tenerife using InSAR 45
Burgmann, R., Rosen, P.A. & Fielding, E.J., 2000. Synthetic Aperture RadarInterferometry to measure Earth’s Surface Topography and its Deforma-tion, Ann. Rev. Eath Planet. Sci., 28, 169–209.
Carracedo, J.C., Paterne, M., Guillou, H., Perez Torrado, F.J., Paris, R.,Rodriguez Badiola, E. & Hansen, A., 2003. Dataciones radiometricas(C14 y K/Ar) del. Teide y el rift noroeste, Tenerife, Islas Canarias, Estu-dios. Geol., 59, 15–29.
Carrasco, D., Fernandez, J., Romero, R., Martınez, A., Moreno, V. & Arana,V., 2000a. Operational volcano monitoring for decision support demostra-tion. In: SP-478, ESA, Fringe ‘99 Advancing ERS SAR Interferometry fromApplications towards Operations, p. 7, ed. H. Sawaya-Lacoste, ESA, Paris,France.
Carrasco, D., Fernandez, J., Romero, R., Arana, V., Martınez, A., Moreno, V.,Aparicio, A. & Paganini, M., 2000b. First results from operational volcanomonitoring in the Canary Islands. In: SP-461, ERS-ENVISAT Symposium,Gothenburg, Sweden, p. 6, ed. H. Sawaya-Lacoste, ESA, Paris, France.
Caturla, J.L., 1996. REGCAN95, Nueva Red Geodesica de las Islas Canarias,internal report, Instituto Geografico Nacional, Madrid, Spain.
CNIG, 2000. Catalogo de publicaciones cartograficas y servicios, Ministeriode Fomento, Madrid, Spain, p. 48.
Consejo Insular de Aguas de Tenerife, 2002. http://www.aguastenerife.org/sup.html
Dvorak, J.J. & Dzurisin, D., 1997. Volcano geodesy; the search for magmareservoirs and the formation of eruptive event, Rev. Geophys., 35, 343–384.
Fernandez, J., Carrasco, J.M., Rundle, J.B. & Arana, V., 1999. Geodetic meth-ods for detecting volcanic unrest. A theoretical approach, Bull. Volcanol.,60, 534–544.
Fernandez, J., Romero, R., Carrasco, D., Luzon, F. & Arana, V., 2002. InSARvolcano and seismic monitoring in Spain. Results for the period 1992–2000 and possible interpretations., Optics and Lasers in Engineering, 37,285–297.
Fernandez, J. et al., 2003. New geodetic monitoring system in the volcanicisland of Tenerife, Canaries, Spain. Combination of InSAR and GPS tech-niques, J. Volc. Geotherm. Res., 124(3–4), 241–253.
Fernandez, J., Gonzalez-Matesanz, F.J., Prieto, J.F., Staller, A., Rodrıguez-Velasco, G., Alonso-Medina, A. & Charco, M., 2004. GPS Monitoringin the N-W part of the Volcanic Island of Tenerife, Canaries, Spain.Strategy and results, Pure appl. Geophys., 161(7), 1359–1377, DOI:10.1007/s00024-004-2509-2.
Fiske, R.S. & Shepherd, J.B., 1990. Twelve years of ground-tilt measure-ments on the Souriere of St. Vicent, 1977–1989, Bull. Volcanol., 52, 227–241.
Galloway, D.L., Hudnut, K.W., Ingebritsen, S.E., Phillips, S.P., Peltzer, G.,Rogez, F. & Rosen, P.A., 1998. Detection of aquifer system compactionand land subsidence using interferometric synthetic aperture radar, An-telope Valley, Mojave Desert, California, Water Resour. Res., 34, 2573–2585.
Galloway, D.L., Jones, D.R. & Ingebritsen, S.E., 2000. Measuring land subsi-dence from space, fact sheet 051-00, US Dept. Int., US Geological Survey,Sacramento, CA, USA, p. 4.
Geertsma, J., 1973. Land subsidence above compacting oil and gas reser-voirs., J. Petrol. Tech., 734–744.
Gobierno de Canarias, Cabildo Insular de Tenerife, 1989. Plan hidrologicoInsular de Tenerife. Avance: bases para el planeamiento hidrogeologico,Ed. Cab. Insul. de Tenerife, Tenerife Spain, p. 133
Gonzalez, P., Lima, R.N., Salazar, J.M.L., Perez, N.M. & Hernandez, P.A.,2000. Surface degassing of HgO, H2S and C/S ratio levels from the summitcone of Teide volcano, Tenerife, Canary Islands (abstract), EOS, Trans.Am. geophys. Un., 81, Fall Meet. Suppl., F1318.
Gonzalez-Matesanz, J. & Dalda, A., 2001. El proyecto RECORD (Ra-diodifusion Espanola de Correcciones Diferenciales) del Instituto Ge-ografico Nacional. Topogr. Cartogr. XVIII, pp. 9–23, Instituto GeograficoNacional, Madrid, Spain.
Hanssen, R.F., 2001. Radar Interferometry: Data interpretation and er-ror analysis, Kluwer Academic Publishers, Dordrecht, the Netherlands,p. 308.
Hernandez, P., Perez, N., Salazar, J., Sato, M., Notsu, K. & Wakita, H.,2000. Soil gas CO2, CH4, and H2 distribution in and around Las Canadascaldera, Tenerife, Canary Islands, Spain., J. Volc. Geotherm. Res., 103,425–438.
Hoffmann, J., Zebker, H.A., Galloway, D.L. & Amelung, F., 2001. Seasonalsubsidence and rebound in Las Vegas Valley, Nevada, observed by syn-thetic radar interferometry., Water Resources Research, 37, 1551–1566.
Le Mouelic, S., Raucoules, D., Carnec, C. & King, C., 2002. A ground upliftin the city of Paris (France) detected by satellite radar interferometry,Geophys. Res. Lett., 29, 1853, doi:10.1029/2002GL015630.
Marinoni, L.B. & Gudmundsson, A., 2000. Dykes, faults and paleostressesin the Teno and Anaga massifs of Tenerife (Canary Islands), J. Volc.Geotherm. Res., 103, 83–103.
Martı, J., Mitjavila, J. & Arana, V., 1994. Stratigraphy, structure and geo-morphology of the Las Canadas Caldera (Tenerife, Canary Islands), Geol.Mag., 131, 715–727.
Martı, J. & Gudmundsson, A., 2000. The Las Canadas caldera (Tenerife,Canary Islands): an overlapping collapse caldera generated by magma-chamber migration, J. Volc. Geotherm. Res., 103, 161–173.
Martınez, A. & Moreno, V., 1997. EPSIE SAR Processing Environment.In: Proceedings of ESA Symposium on the use of ERS data in LatinAmerica, ed. T.-D. Guyenne, pp. 275–280, ESA, SP-407, Noordwijk,the Netherlands.
Massonnet, D., 1997. Satellite Radar Interferometry, Scientific American,276, 32–39.
Massonnet, D. & Feigl, K.L., 1995. Discrimination of geophysical phe-nomena in satellite radar interferograms, Geophys. Res. Lett., 22, 1537–1540.
Massonnet, D. & Feigl, K.L., 1998. Radar interferometry and its applicationto changes in the Earth’s surface, Rev. Geophys., 36, 441–500.
Massonnet, D., Holzer, T. & Vadon, H., 1997. Land subsidence caused bythe East Mesa Geothermal Field, California, observed using SAR inter-ferometry, Geophys. Res. Lett., 24, 901–904.
Okada, Y., 1985. Surface deformation due to shear and tensile faults in ahalf-space, Bull. seism. Soc. Am., 75, 1135–1154.
Puglisi, G. & Coltelli, M., 2001. SAR Interferometry applications on activevolcanoes: state of the art and perspectives for volcano monitoring, IlNuovo Cimento, 24C, 133–145.
Rosen, P.A., Hensley, S., Joughin, I.R., Li, F.K., Madsen, S.N., Rodriguez,E. & Goldstein, R.M., 2000. Synthetic Aperture Radar Interferometry,Proc. IEEE, 88, 333–382.
Salazar, J.M.L., Perez, N.M. & Hernandez, P.A., 2000. Secular variationsof soil CO2 flux levels at the summit cone of Teide volcano, Tenerife,Canary Islands, (abstract), EOS, Trans. Am. geophys. Un., 81, 48, FallMeet. Suppl., F1317.
Segall, P. & Davis, J.L., 1997. GPS applications for geodynamics and earth-quakes studies, Annu. Rev. Earth. Planet. Sci., 25, 301–336.
Sevilla, M.J. & Sanchez, F.J., 1996. Geodetic network for deformation mon-itoring in the Caldera of Teide. The European Laboratory Volcanoes. In:Proceedings of the second workshop European Commission, ed. R. Casaleet al. pp. 615–636.
Sevilla, M.J., Valbuena, J.L., Rodrıguez-Dıaz, G. & Vara, M.D., 1996. Tra-bajos altimetricos en la Caldera del Teide, Fısica de la Tierra, 8, 117–130.
Sigurdsson, H., Houghton, B., McNutt, S.R., Rymer, H. & Stix, J., (Eds.),2000. Encyclopedia of Volcanoes, Academic Press, San Diego, CA, USA.
Solana, M.C., 1998. Evaluacion de la peligrosidad volcanica en Tenerife apartir de la reconstruccion de cuatro erupciones historicas., PhD thesis,Universidad Complutense Madrid, Spain, p. 257.
Vieira, R., Toro, C. & Arana, V., 1986. Microgravimetric survey in theCaldera of Teide, Tenerife, Canary Islands, Tectonophysics, 130, 249–257.
Xu, H., Dvorkin, J. & Nur, A., 2001. Linking oil production to the surfacesubsidence from satellite radar interferometry, Geophys. Res. Lett., 28,1307–1310.
Yu, T.T., Fernandez, J., Tseng, C.L., Sevilla, M.J. & Arana, V., 2000. Sensi-tivity test of the geodetic network in Las Canadas Caldera, Tenerife, forvolcano monitoring, J. Volc. Geotherm. Res., 103, 393–407.
C© 2005 RAS, GJI, 160, 33–45