detection of atmospheric gaseous amines and amides by a high
TRANSCRIPT
1
Detection of atmospheric gaseous amines and amides by a high resolution 1
time-of-flight chemical ionization mass spectrometer with protonated 2
ethanol reagent ions 3
4 Lei Yao1, Ming-Yi Wang1, Xin-Ke Wang1, Yi-Jun Liu1,2, Hang-Fei Chen1, Jun Zheng3, Wei Nie4,5, 5
Ai-Jun Ding4,5, Fu-Hai Geng6, Dong-Fang Wang7, Jian-Min Chen1, Douglas R. Worsnop8, Lin Wang1,5* 6
7 1 Shanghai Key Laboratory of Atmospheric Particle Pollution and Prevention (LAP3), Department of 8
Environmental Science & Engineering, Fudan University, Shanghai 200433, China 9
2 now at Pratt school of engineering, Duke University, Durham, NC 27705,USA 10
3 Jiangsu Key Laboratory of Atmospheric Environment Monitoring and Pollution Control, Nanjing 11
University of Information Science & Technology, Nanjing 210044, China 12 4 Joint International Research Laboratory of Atmospheric and Earth System Sciences, School of 13
Atmospheric Science, Nanjing University, 210023, Nanjing, China 14
5 Collaborative Innovation Center of Climate Change, Nanjing, Jiangsu Province, China 15
6 Shanghai Meteorology Bureau, Shanghai 200135, China 16
7 Shanghai Environmental Monitoring Center, Shanghai 200030, China 17
8 Aerodyne Research, Billerica, MA 01821, USA 18
19
* Corresponding Author: L.W., email, [email protected]; phone, +86-21-65643568; fax, 20
+86-21-65642080. 21
22
23
24
25
26
27
28
29
30
31
32
33
34
35
36
37
Atmos. Chem. Phys. Discuss., doi:10.5194/acp-2016-484, 2016Manuscript under review for journal Atmos. Chem. Phys.Published: 22 June 2016c© Author(s) 2016. CC-BY 3.0 License.
2
Abstract 38
Amines and amides are important atmospheric organic-nitrogen compounds but high time 39
resolution, highly sensitive, and simultaneous ambient measurements of these species are rather 40
sparse. Here, we present the development of a high resolution time-of-flight chemical ionization mass 41
spectrometer (HR-ToF-CIMS) method utilizing protonated ethanol as reagent ions to simultaneously 42
detect atmospheric gaseous amines (C1 to C6) and amides (C1 to C6). This method possesses 43
sensitivities of 5.6-19.4 Hz pptv-1 for amines and 3.8-38.0 Hz pptv-1 for amides under total reagent ion 44
signals of ~0.32 MHz, and detection limits of 0.10-0.50 pptv for amines and 0.29-1.95 pptv for 45
amides at 3σ of the background signal for a 1-min integration time, respectively. Controlled 46
characterization in the laboratory indicates that relative humidity has significant influences on 47
detection of amines and amides, whereas the presence of organics has no obvious effects. Ambient 48
measurements of amines and amides utilizing this method were conducted from 25 July 2015 to 25 49
August 2015 in urban Shanghai, China. While the concentrations of amines ranged from a few pptv to 50
hundreds of pptv, concentrations of amides varied from tens of pptv to a few ppbv. Among the C1- to 51
C6-amines, the C2-amines were the dominant species with concentrations up to 130 pptv. For amides, 52
the C3-amides (up to 8.7 ppb) were the most abundant species. The diurnal profiles of amines and 53
amides suggest that in addition to the secondary formation of amides in the atmosphere, industrial 54
emissions could be important sources of amides in urban Shanghai. During the campaign, 55
photo-oxidation of amines and amides might be a main loss pathway for them in day time, and wet 56
deposition was also an important sink. 57
58
59
60
61
62
63
64
65
66
67
68
69
70
71
72
Atmos. Chem. Phys. Discuss., doi:10.5194/acp-2016-484, 2016Manuscript under review for journal Atmos. Chem. Phys.Published: 22 June 2016c© Author(s) 2016. CC-BY 3.0 License.
3
1 Introduction 73
Amines and amides are nitrogen-containing organic compounds widely observed in the 74
atmosphere (Ge et al., 2011). They are emitted from a variety of natural and anthropogenic sources 75
including agriculture, biomass burning, animal husbandry, cooking, synthetic leather, carbon capture, 76
and other industrial processes (Finlayson-Pitts and Pitts, 2000; Ge et al., 2011; Kim et al., 2004; Kuhn 77
et al., 2011; Nielsen et al., 2012; Zhu et al., 2013). In addition to the primary sources, amides can be 78
formed from the degradation processes of amines (Nielsen et al., 2012) and atmospheric accretion 79
reactions of organic acids with amines or ammonia (Barsanti and Pankow, 2006). 80
Once in the atmosphere, amines and amides can react with atmospheric oxidants (e.g., OH and 81
NO3 radicals, Cl atoms, and O3), and lead to gaseous degradation products and formation of secondary 82
organic aerosols (Barnes et al., 2010; Bunkan et al., 2016; El Dib and Chakir, 2007; Lee and Wexler, 83
2013; Malloy et al., 2009; Murphy et al., 2007; Nielsen et al., 2012). In addition, the basic nature of 84
amines certainly justifies their participation in atmospheric new particle formation and growth events 85
(Almeida et al., 2013; Erupe et al., 2011; Glasoe et al., 2015; Smith et al., 2010; Yu et al., 2012; 86
Zhang et al., 2012). Heterogeneous uptake of amines by acidic aerosols and displacement reactions of 87
ammonium ions by amines can significantly alter the physio-chemical properties of aerosol particles 88
(Qiu et al., 2011; Wang et al., 2010a; Wang et al., 2010b). 89
Atmospheric amines have been measured in different surroundings. Kieloaho et al. (2013) used 90
offline acid-impregnated fiberglass filter collection together with analysis by high performance liquid 91
chromatography electrospray ionization ion trap mass spectrometer, and reported that the highest 92
concentrations of C2-amines (ethylamine (EA) + dimethylamine (DMA)) and C3-amines (propylamine 93
(PA) + trimethylamine (TMA)) reached 157±20 pptv (parts per trillion by volume) and 102±61 pptv, 94
respectively, in boreal forests, southern Finland. Using a similar detection method, the mean 95
concentrations of C2-amines (EA+DMA), C3-amines (PA+TMA), butylamine (BA), diethylamine 96
(DEA) and triethylamine (TMA) were measured to be 23.6 pptv, 8.4 pptv, 0.3 pptv, 0.3 pptv, and 0.1 97
pptv, respectively, in urban air of Helsinki, Finland (Hellén et al., 2014). Detection of gaseous alkyl 98
amines were conducted in Toronto, Canada using an ambient ion monitor ion chromatography system, 99
and the concentrations of DMA, and TMA+DEA were both less than 2.7 ppt (VandenBoer et al. 2011). 100
Recently, online detection of atmospheric amines using chemical ionization mass spectrometer is 101
becoming the trend. Yu and Lee (2012) utilized a quadrupole chemical ionization mass spectrometer 102
Atmos. Chem. Phys. Discuss., doi:10.5194/acp-2016-484, 2016Manuscript under review for journal Atmos. Chem. Phys.Published: 22 June 2016c© Author(s) 2016. CC-BY 3.0 License.
4
(CIMS) with protonated ethanol and acetone ions as reagent ions to measure C2-amines (8±3 pptv) 103
and C3-amines (16±7 pptv) in Kent, Ohio. A similar method detected a few pptv to tens of pptv 104
C3-amines in Alabama forest (You et al., 2014). Sellegri et al. (2005) reported the mean concentration 105
of TMA and DMA were 59 pptv and 12.2 pptv, respectively, in Hyytiälä forest, with a 106
quadrupole-CIMS with hydronium ions as reagent ions. Measurements of amines in urban areas did 107
not show significant differences in terms of concentration. The average of total amines (C1-C3) was 108
7.2±7.4 pptv in Nanjing, China, as measured by a high resolution time-of-flight CIMS 109
(HR-ToF-CIMS) with hydronium ions as reagent ions (Zheng et al., 2015). Measurements by an 110
ambient pressure proton transfer mass spectrometer (AmPMS) in urban Atlanta showed that 111
trimethylamine (TMA) (or isomers or amide) was the most abundant amine-species and that the 112
concentration of DMA was ~3 pptv (Hanson et al., 2011). 113
To the best of our knowledge, gaseous amides were not previously measured in ambient air, 114
except for two studies that briefly described the detection of a few amides near the emission source. 115
Zhu et al. (2013) detected formamide (FA) (C1-amide) formed from degradation of 116
mono-ethanolamine in emissions from an industrial carbon capture facility, using proton transfer 117
reaction time-of-flight mass spectrometry (PTR-ToF-MS). Furthermore, up to 4350 pptv of 118
dimethylamide was observed near a municipal incinerator, waste collection center and sewage 119
treatment plant (Leach et al., 1999). 120
Given the important role of amines in atmospheric nucleation and other physio-chemical 121
processes, and the potential involvement of amides in a number of atmospheric processes, it is 122
necessary to develop high time resolution and highly sensitive detection techniques for measurements 123
of ambient amines and amides. Previous studies have proven CIMS to be a powerful instrument to 124
detect gaseous amines and amides in laboratory studies and field campaigns (Borduas et al., 2015; 125
Bunkan et al., 2016; Hanson et al., 2011; Sellegri et al., 2005; Yu and Lee, 2012; You et al., 2014; 126
Zheng et al., 2015). However, the detection method for ambient amides with much lower 127
concentrations than those in laboratory studies is still lacking. The popular usage of hydronium ions 128
as reagent ions (e.g. PTR-MS and AmPMS) potentially leads to the relative humidity (RH) 129
dependence of the background and ambient amine signals, adding uncertainties to measurement 130
results (Hanson et al., 2011; Zheng et al., 2015; Zhu et al., 2013). In addition, constrained by the mass 131
resolution of the quadrupole-detector mass spectrometer, it is difficult to distinguish protonated 132
Atmos. Chem. Phys. Discuss., doi:10.5194/acp-2016-484, 2016Manuscript under review for journal Atmos. Chem. Phys.Published: 22 June 2016c© Author(s) 2016. CC-BY 3.0 License.
5
amines and amides with an identical unit mass, which pre-excludes the possibility of simultaneous 133
measurements of amines and amides. For example, the m/z (mass to charge ratio) value of protonated 134
trimethylamine (C3H9N·H+, m/z 60.0808) and that of protonated acetamide (C2H5NO·H+, m/z 60.0444) 135
are very close. 136
In the present study, a HR-ToF-CIMS method utilizing protonated ethanol as reagent ions has 137
been developed to simultaneously detect atmospheric gaseous amines (C1 to C6) and amides (C1 to C6). 138
Protonated ethanol was selected as the reagent ions because the higher proton affinity of ethanol 139
(185.6 kcal mol-1) than that of water (165.2 kcal mol-1), as shown in Table 1, results in more 140
selectivity for detecting high proton affinity species (e.g. > 196 kcal mol-1 for amines and amides) 141
(Nowak, 2002; Yu and Lee, 2012; You et al., 2014). The influences of RH and organics on amine and 142
amide detection were characterized in the laboratory. Ambient measurements of amines and amides 143
utilizing this method were performed from 25 July 2015 to 25 August 2015 in urban Shanghai, China. 144
During the campaign, a Filter Inlet for Gases and AEROsols (FIGAERO) was interfaced to 145
HR-ToF-CIMS (Lopez-Hilfiker et al., 2014) but only results on gaseous C1-C6 amines and amides are 146
presented. The potential sources and sinks of amines and amides are discussed. 147
148
2 Experimental 149
2.1 Instrumentation 150
An Aerodyne HR-ToF-CIMS (Bertram et al., 2011) with protonated ethanol as reagent ions has 151
been deployed to detect gaseous amines (C1 to C6) and amides (C1 to C6). Protonated ethanol reagent 152
ions were generated by passing a pure air flow of 1 L min-1 (liter per minute) supplied by a zero air 153
generator (Aadco 737) through a Pyrex bubbler containing ethanol (≥ 96%, J.T.Baker) and then 154
through a 0.1 mCi 241Am radioactive source. A sample flow of 1.35 L min-1 was introduced into the 155
ion-molecular reaction (IMR) chamber where the sample flow and the reagent ion flow converge. The 156
pressures of the IMR chamber and the small-segmented quadrupole (SSQ) were regulated at ~100 157
mbar and ~2.8 mbar, respectively, to increase the instrument sensitivity. Under such conditions, the 158
ion-molecular reaction time was ~320 ms in the IMR. To minimize wall-loss of analytes on the inner 159
surface of IMR, the temperature of IMR was maintained at an elevated temperature (50°C). The data 160
of HR-ToF-CIMS was collected at 1 Hz time resolution. 161
Under dry conditions, the most abundant reagent ion was protonated ethanol dimer 162
Atmos. Chem. Phys. Discuss., doi:10.5194/acp-2016-484, 2016Manuscript under review for journal Atmos. Chem. Phys.Published: 22 June 2016c© Author(s) 2016. CC-BY 3.0 License.
6
((C2H5OH)2·H+, m/z 93.0910), with the next dominant ions being protonated ethanol monomer 163
( (C2H5OH)·H+, m/z 47.0491) and protonated ethanol trimer ((C2H5OH)3·H+, m/z 139.1329). The 164
presence of water led to formation of clusters of protonated ethanol with water (C2H5OH·H2O·H+) and 165
hydronium ions and their hydrates ((H2O)n·H+, n=1, 2 and 3). A typical mass spectrum under < 20% 166
RH is shown in Figure S1. The ratios of oxygen cation (O2+), the clusters of protonated ethanol with 167
water (C2H5OH·H2O·H+), and hydronium ions ((H2O)n·H+, n=1, 2 and 3) to the sum of (C2H5OH)·H+, 168
(C2H5OH)2·H+, and (C2H5OH)3·H+ were ~0.001, ~0.026, and ~0.011, respectively. 169
Amines and amides reacted dominantly with protonated ethanol ions through proton transfer 170
reactions. The ion-molecular reactions of amines (denoted as NR3, R=H or an alkyl group) and amides 171
(denoted as R’2NC(O)R, R’=H or an alkyl group) with protonated ethanol reagent ions can be showed 172
as the following (You et al., 2014; Yu and Lee, 2012): 173
(C2H5OH)n·H+ + NR3 (C2H5OH)j·NR3·H+ + (n-j)C2H5OH (R1) 174
(C2H5OH)n·H+ + R’2NC(O)R (C2H5OH)j·R’2NC(O)R·H++(n-j)C2H5OH (R2) 175
where n = 1, 2, and 3, and j = 0 and 1. 176
2.2 Calibration of amines and amides 177
Amines and amides were calibrated using permeation sources. Permeation tubes for amines 178
(methylamine (MA), dimethylamine (DMA), trimethylamine (TMA), and diethylamine (DEA)) were 179
purchased from VICI Inc. USA, whereas those for amides (formamide (FA), ≥ 99.5%, GC, Sigma 180
Aldrich; acetamide (AA), ≥ 99%, GC, Sigma Aldrich; and propanamide (PA), ≥ 96.5%, GC, Sigma 181
Aldrich) were home-made using 1/4 inch Teflon tubes with the ends sealed with Teflon blockers. The 182
permeation tube was placed in a U-shape glass tube with a diameter of 2.5 cm that was immersed in a 183
liquid bath with precise temperature regulation (Zheng et al., 2015). A high purity (≥99.999%) 184
nitrogen flow typically at 0.1 L min-1 was used as the carrier gas to carry the permeated compounds to 185
HR-ToF-CIMS for detection. 186
The concentration of an amine in the outflow of the permeation tube was referred to that as 187
determined by an acid-base titration method (Freshour et al., 2014). The high purity nitrogen flow 188
containing an amine standard was bubbled through a HCl solution (pH = ~4.5) with a small amount of 189
KCl (~5 mM) added to facilitate measurements of pH values. Reagents HCl (~37 wt% in water) and 190
KCl (≥ 99%) were of ACS reagents and purchased from Sigma Aldrich. The concentration of the 191
Atmos. Chem. Phys. Discuss., doi:10.5194/acp-2016-484, 2016Manuscript under review for journal Atmos. Chem. Phys.Published: 22 June 2016c© Author(s) 2016. CC-BY 3.0 License.
7
amine was derived according to variations of the pH values with titration time. The pH values were 192
averaged and recorded by a pH meter (340i, WTW, Germany) every 5 min. 193
In the case of amides, a permeated alkyl-amide was trapped in a HNO3 solution with a pH of 194
~2.5 that was diluted from reagent HNO3 (~70 wt% in water, ACS reagent, Sigma Aldrich). 195
Hydrolysis of the alkyl-amide occurred under acidic conditions leading to formation of NH4+ (Cox and 196
Yates, 1981). The concentration of NH4+ was quantified using Ion Chromatography (Metrohm 833, 197
Switzerland), and the permeation rate of the alkyl-amide was derived from the variation of NH4+ with 198
the time period of hydrolysis. 199
The total ethanol reagent ion signals during the laboratory calibration were typically ~0.32 MHz. 200
2.3 Influence of RH and organics 201
Experiments were performed to characterize the influence of RH and organics on the detection of 202
amines and amides. The schematics of our experimental setup are shown in Figure S2 (A for tests at 203
elevated RH and B for tests in presence of organics), where the tubes and valves are made of 204
polytetrafluoroethylene (PTFE) and perfluoroalkoxy (PFA) materials to minimize absorption of 205
amines/amides on the inner surface of tubes and valves. To examine the influence of RH, a pure air 206
flow was directed through a bubbler filled with 18.2 MΩcm deionized water, and then mixed with the 207
amine/amide flow of 0.1 L min-1 generated from the permeation sources. The examined RH ranged 208
from 4 % to 65%. 209
α-pinene, a typical biogenic organic compound, and p-xylene, a typical anthropogenic compound, 210
were chosen to examine the influence of organics on detection of amines and amides. The 211
amines/amide flow was mixed with organics for ~0.2 s before entering the IMR. During the 212
characterization, the air flow (15 L min-1) containing α-pinene or p-xylene with concentrations up to 213
hundreds of ppbv (parts per billion by volume) was initially mixed the amine/amide flow of 0.1 L 214
min-1 generated from the permeation sources. Then ozone and OH radicals were generated from an 215
O2/H2O flow of 2×10⁻³ L min-1 by turning on a Hg-lamp (Jelight model 600, USA). Photochemical 216
reactions of α-pinene or p-xylene occurred and a much more complex mixture of organics was 217
subsequently mixed with the amine/amide flow. 218
2.4 Field campaign in urban Shanghai 219
The ethanol HR-ToF-CIMS was deployed for a field campaign at the Fudan site (31° 17′ 54" N, 220
Atmos. Chem. Phys. Discuss., doi:10.5194/acp-2016-484, 2016Manuscript under review for journal Atmos. Chem. Phys.Published: 22 June 2016c© Author(s) 2016. CC-BY 3.0 License.

8
121° 30′ 05" E) on the campus of Fudan University from 25 July through 25 August, 2015. This 221
monitoring site is on the rooftop of a teaching building that is ~20 m above ground. About 100 m to 222
the north is the Middle Ring that is one of the main overhead highways in Shanghai. This site is also 223
influenced by local industrial and residential activities. Hence, the Fudan site is a representative urban 224
site (Ma et al., 2014; Wang et al., 2013a; Wang et al., 2016; Xiao et al., 2015). 225
The schematic of the ethanol HR-ToF-CIMS setup during the field campaign is shown in Figure 226
S3. Ambient air was drawn into a PTFE tubing with a length of 2 m and an inner diameter of 3/8 inch. 227
To minimize the wall-loss of amines and amides, a high sampling flow rate (15 L min-1) was adopted, 228
resulting in an inlet residence time of ~0.26 s. Also, the PTFE tubing was heated to 50 by heating 229
tapes. Because of the high concentrations of volatile organic compounds in the air of urban Shanghai, 230
reagent ion depletion occurred during the initial tests of measurements of ambient samples. Hence, the 231
ambient air was diluted with a high purity nitrogen flow with a dilution ratio of ~1:4.6. Under such 232
condition, variation of the total reagent ions ((C2H5OH)·H+, (C2H5OH)2·H+, and (C2H5OH)3·H
+) was 233
less than 10% between measurements of the background air and the ambient sample. The ethanol 234
reagent ion signals were typically around 0.35 MHz throughout the entire campaign. To take the 235
variation in total reagent ions between in laboratory calibration and during field measurements into 236
account, ambient concentrations of amines and amides were calculated according to 237
aminesoramides C ∑
∑ (1) 238
where C is a calibration coefficient obtained by dividing the total reagent ion signals in laboratory 239
calibration by the sensitivity of an amine or amide. As shown in equation (1), to minimize the effect of 240
the variation of reagent ions during field measurements, the ambient signals of an amine or amide 241
were normalized by the sum of ethanol clusters including protonated ethanol monomer, dimer, and 242
trimer. 243
During the campaign, a Filter Inlet for Gases and AEROsols (FIGAERO) (Lopez-Hilfiker et al., 244
2014) was attached to the HR-ToF-CIMS. FIGAERO-HRToF-CIMS offers two operation modes. 245
Direct gas sample analysis occurs with the HR-ToF-CIMS during simultaneous particle collection on 246
a PTFE filter via a separate dedicated port. Particle analysis occurs via evaporation from the filter 247
using temperature-programmed thermal desorption by heated ultra-high purity nitrogen upstream of 248
the HR-ToF-CIMS. A moveable filter housing automatically switches between the two modes. In our 249
Atmos. Chem. Phys. Discuss., doi:10.5194/acp-2016-484, 2016Manuscript under review for journal Atmos. Chem. Phys.Published: 22 June 2016c© Author(s) 2016. CC-BY 3.0 License.
9
study, measurements of ambient gaseous samples were conducted for 20 min every hour, followed by 250
analysis of particulate samples for 40 min. In this paper, we focus on measurements of gaseous 251
samples and present results on detection of gaseous amines and amides. 252
During the 20 min period for analysis of ambient gaseous samples, background measurements 253
were auto-performed for 5 min by a motor-driven three-way Teflon solenoid valve, utilizing a high 254
purity nitrogen flow as the background gas. Figure S4 shows typical background signals during an 255
ambient sampling period of 3 h. The average ambient background concentrations of amines (C1 to C6) 256
and amides (C1 to C6) throughout the field campaign are presented in Table 1. The inlet memory of 257
amines and amides were determined using an inlet spike approach. As shown in Figure S5, the signals 258
followed the sum of two decaying exponentials. The characteristic decaying times of two exponentials, 259
which are displacement of amines and amides inside the inlet by pumping and removing amines and 260
amides adsorbed on the inlet surface (Zheng et al., 2015), were 1.1 s and 8.5 s for TMA, and 1.4 s and 261
1.4 s for PA, respectively. These results demonstrate that a 5 min background sampling time is 262
sufficient to eliminate the inlet memory. 263
All HR-ToF-CIMS data were analyzed with Tofware (Aerodyne Research, Inc. and Tofwerk AG) 264
and Igor Pro (Wavemetrics) software. Concentrations of O3 were measured by an O3 analyzer (Model 265
49i, Thermo Scientific, USA). RH and temperature were measured by an automatic meteorological 266
station (CAWS600, Huayun, China) at the Fudan site. 267
Solar radiation intensity measured by a pyranometer (Kipp & Zonen CMP6, Netherlands) was 268
obtained from the Shanghai Pudong Environmental Monitoring Centre (31°14′ N, 121°32′ E, about 269
8.78 km from the Fudan site). Precipitation was recorded by a rainfall sensor (RainWise Inc., USA) 270
located at the Huangxing Park monitoring station (31°17′ N, 121°32′ E, about 2.95 km from the 271
Fudan site) of Shanghai Meteorology Bureau. 272
273
3 Results and Discussion 274
3.1 Performance of ethanol HR-ToF-CIMS in the laboratory 275
3.1.1 Sensitivities and detection limits 276
The permeation rates of amines and amides were determined adopting methods of acid-base 277
titration and hydrolysis of alkyl-amides in an acidic solution, respectively. A typical plot for 278
Atmos. Chem. Phys. Discuss., doi:10.5194/acp-2016-484, 2016Manuscript under review for journal Atmos. Chem. Phys.Published: 22 June 2016c© Author(s) 2016. CC-BY 3.0 License.
10
determination of the permeation rate of the DEA permeation tube is shown in Figure S6. Plots for FA 279
(C1-amide) and PA (an isomer of C3-amide) are used as examples for amides, as shown in Figure S7. 280
In summary, at 0, the permeation rates of MA, DMA, TMA, and DEA permeation tubes were 6.9 ± 281
0.7, 7.4 ± 0.2, 5.1 ± 0.8, and 12.7 ± 0.9 ng min-1, respectively. Permeation rates of home-made FA, 282
AA, and PA permeation tubes were 36.7 ± 2.4, 5.2 ± 0.5, and 29.1 ± 1.6 ng min-1, respectively, at 0. 283
The high purity nitrogen flow carrying the permeated amine/amide was then diluted with another 284
high purity nitrogen flow at different dilution ratios, and directed to HR-ToF-CIMS for detection 285
under dry conditions (RH = ~ 0%). Figure S8 shows the calibration curves of C1- to C4-amines and 286
C1- to C3-amides. The derived sensitivities were 5.6-19.4 Hz pptv-1 for amines and 3.8-38.0 Hz pptv-1 287
for amides with the total reagent ions of ~0.32 MHz, respectively. Also, the detection limits of amines 288
and amides were 0.10-0.50 pptv and 0.29-1.95 pptv at 3σ of the background signal for a 1-min 289
integration time, respectively. Sensitivities, calibration coefficients, and detection limits of the C1- to 290
C4-amines (MA, DMA, TMA, and DEA) and C1- to C3-amides (FA, AA, and PA), together with their 291
proton affinities, are summarized in Table 1. The detection limits of C1- to C3-amines in our study are 292
similar to those by Zheng et al. (2015) and You et al. (2014). The sensitivities of C1- to C4-amines are 293
slightly better than those reported in You et al. (2014) and Yu and Lee (2012). 294
3.1.2 Effects of RH and organics 295
The presence of high concentrations of water is believed to have an effect on the ion-molecular 296
reactions in IMR, given the proton transfer nature of our ion-molecular reactions and the high IMR 297
pressure (providing longer ion-molecular reaction time) in our study. The detection of constant 298
concentrations of amines and amides by HR-ToF-CIMS at various RH was characterized to evaluate 299
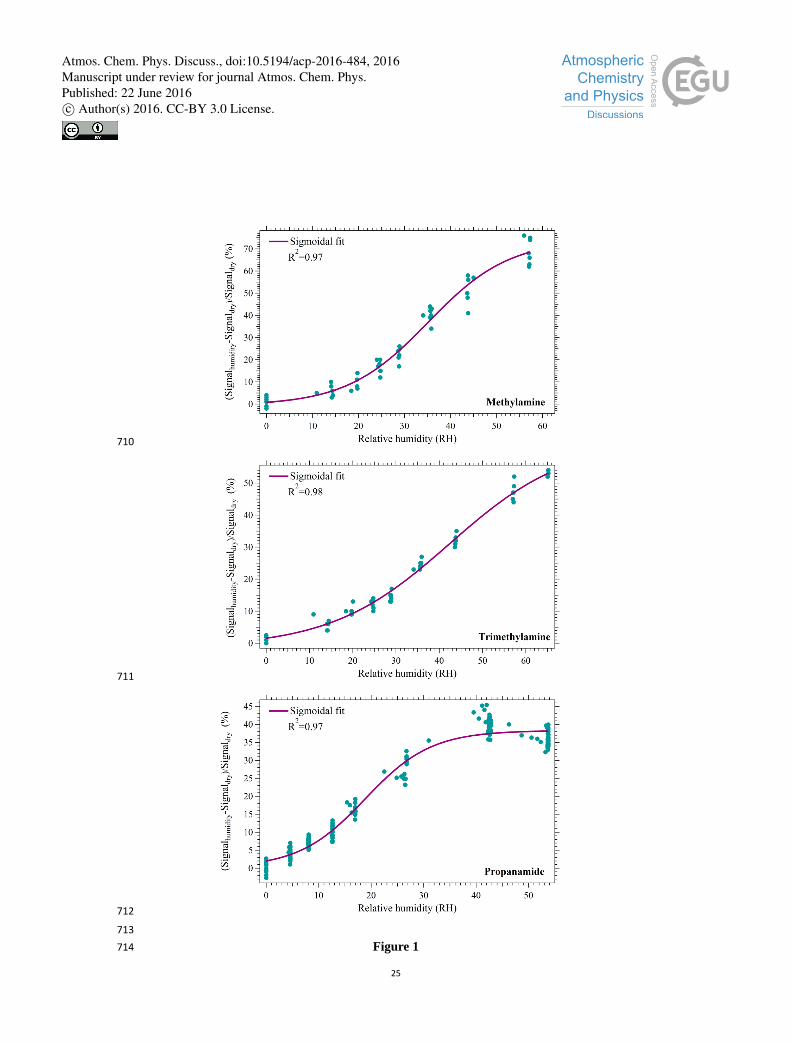
the influence of RH. Examined were MA (C1-amine) and TMA (C3-amine) under 0-65% RH at 23, 300
corresponding to 0-70% and 0-49% enhancement in the MS signal, respectively. In the case of amides, 301
the increase of the PA (C3-amide) signal was 0-38% under 0-55% RH. These results show that RH has 302
an obvious effect on the MS signals for amines and amides, which followed sigmoidal fits with the 303
R2≥0.97 in the examined RH range (Figure 1). 304
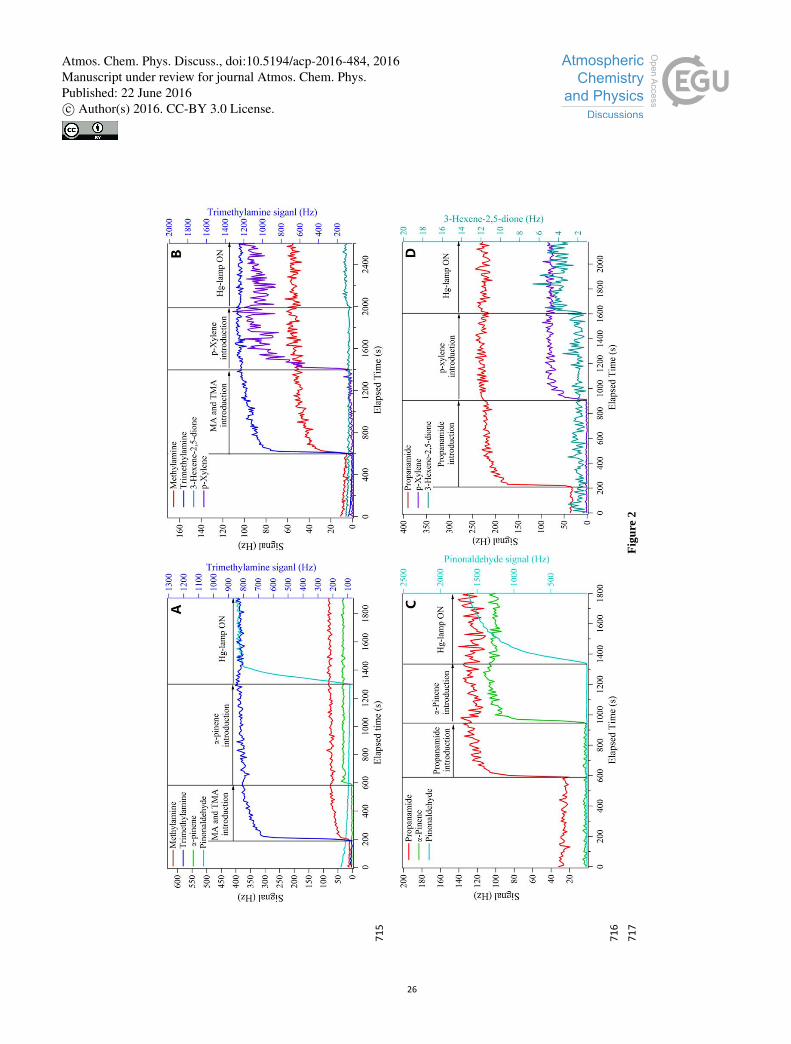
Figure 2 shows the effects of biogenic (α-pinene) and anthropogenic (p-xylene) compounds and 305
their photochemical reaction products on detection of amines (MA and TMA) and amide (PA) by our 306
HR-ToF-CIMS. After stable signals of amines/amide were established, introduction of α-pinene and 307
Atmos. Chem. Phys. Discuss., doi:10.5194/acp-2016-484, 2016Manuscript under review for journal Atmos. Chem. Phys.Published: 22 June 2016c© Author(s) 2016. CC-BY 3.0 License.
11
p-xylene, respectively, had little impact on detection of amines and amides. Initiation of 308
photochemical reactions of α-pinene and p-xylene upon turning on the Hg-lamp, as evidenced by 309
characteristic products of pinonaldehyde from α-pinene (Lee et al., 2006) and 3-hexene-2,5-dione 310
from p-xylene (Smith et al., 1999), respectively, did not have an obvious effect on detection of amines 311
and amides, either. 312
3.2 Detection of amines and amides in urban Shanghai 313
3.2.1 Identification of nitrogen-containing species 314
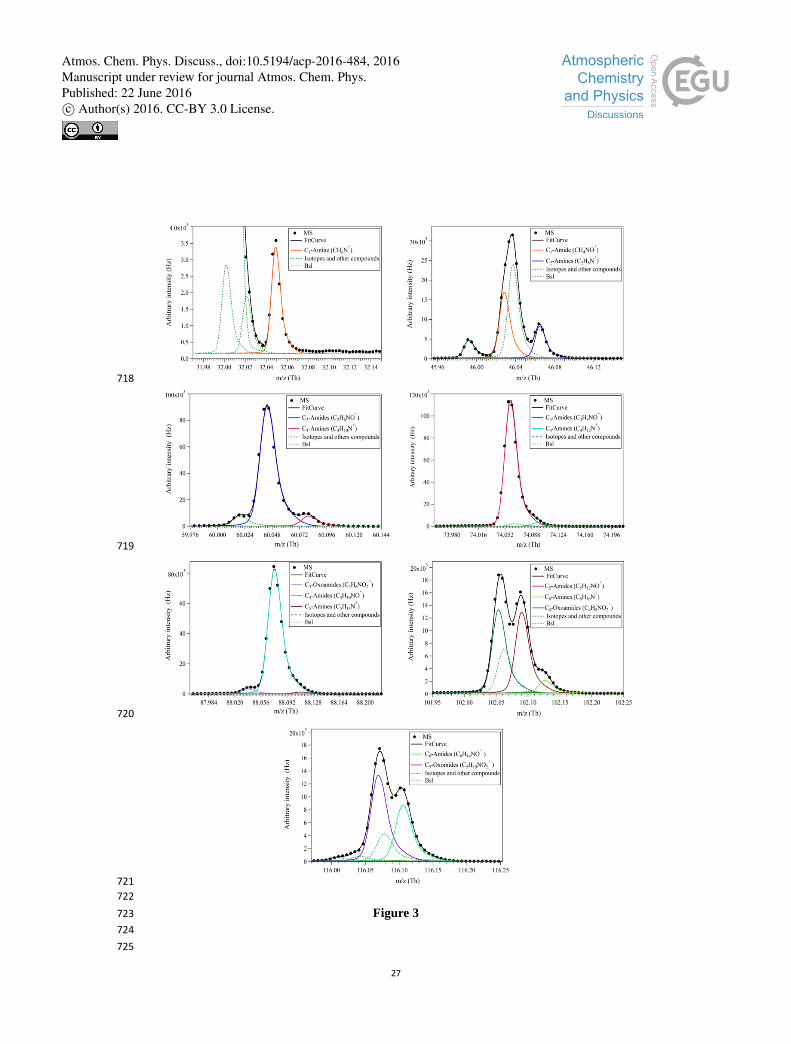
One major challenge during analysis of mass spectra from the field deployment of the ethanol 315
HR-ToF-CIMS is to distinguish amines and amides with very close m/z values in order to achieve 316
simultaneous measurements. Thanks to the high mass resolving power (R≥3500 in V-mode) of our 317
HR-ToF-CIMS, we are able to distinguish and identify the following protonated amines (CH5N·H+ 318
(m/z 32.0495), C2H7N·H+ (m/z 46.0651), C3H9N·H+ (m/z 60.0808), C4H11N·H+ (m/z 74.0964), 319
C5H13N·H+ (m/z 88.1121), and C6H15N·H+ (m/z 102.1277)), and amides (CH3NO·H+ (m/z 46.0287), 320
C2H5NO·H+ (m/z 60.0444), C3H7NO·H+ (m/z 74.0600), C4H9NO·H+ (m/z 88.0757), C5H11NO·H+ (m/z 321
102.0913), and C6H13NO·H+ (m/z 116.1069)), as well as a few oxomides (C3H5NO2·H+ (m/z 88.0393), 322
C4H7NO2·H+ (m/z 102.0550), and C5H7NO2·H+ (m/z 116.0760)), as shown by the single peak fitting 323
for each of them in Figure 3. The assignment of molecular formulas for these species is within a mass 324
tolerance of < 10 ppm. 325
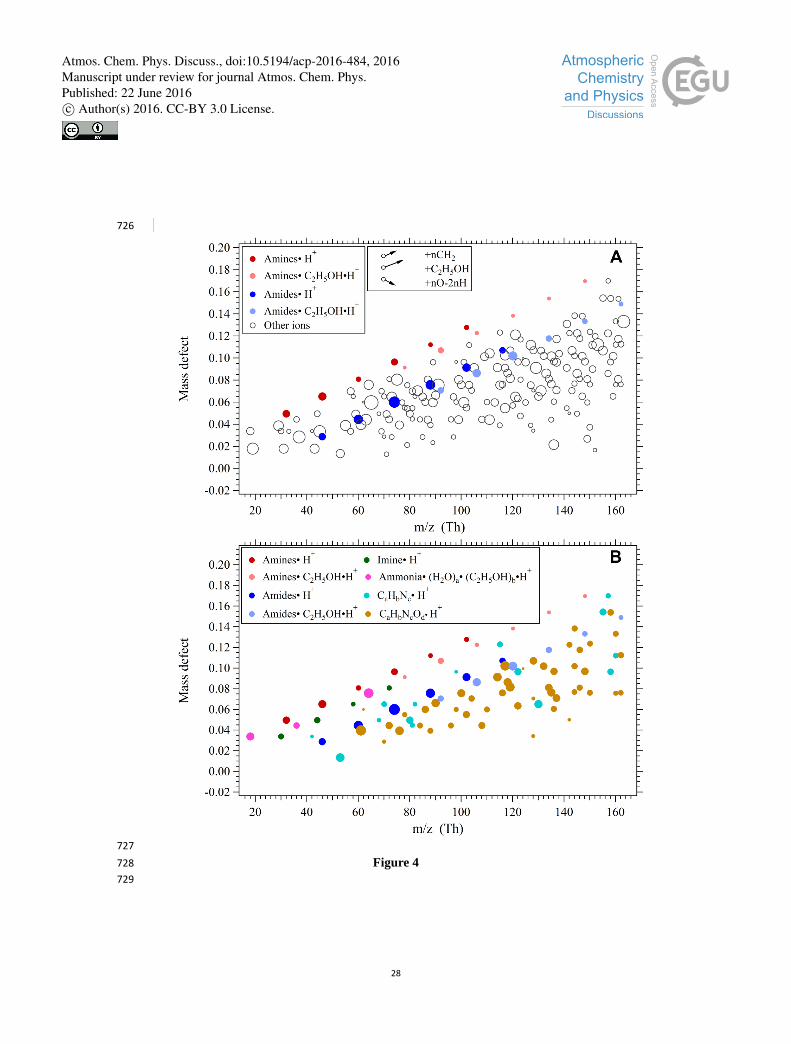
We further analyzed the entire mass spectra and assigned a molecular formula to 200 species 326
with m/z values less than 163 Th as listed in Table S1, which allows a mass defect plot for typical 327
15-min mass spectra in Figure 4A. In addition to the protonated C1 to C6-amines and amides, their 328
clusters with ethanol are evident, further confirming the identification of these species. A number of 329
gaseous amines have been previously detected in the ambient air utilizing quadrupole mass 330
spectrometer (Freshour et al., 2014; Hanson et al., 2011; Sellegri et al., 2005; You et al., 2014; Yu and 331
Lee, 2012). As suggested by Hanson et al. (2011), an amine and an amide with one less carbon might 332
both have high enough proton affinities and could be detected at the same unit m/z value by a 333
quadrupole mass spectrometer, leading to uncertainty in measuring the ambient amine. In this study, 334
C1- to C6-amines and C1- to C6-amides are, for the first time, systematically and simultaneously 335
detected in ambient air. 336
Atmos. Chem. Phys. Discuss., doi:10.5194/acp-2016-484, 2016Manuscript under review for journal Atmos. Chem. Phys.Published: 22 June 2016c© Author(s) 2016. CC-BY 3.0 License.
12
In addition to the protonated C1 to C6-amines and C1 to C6-amides and their clusters with ethanol, 337
we were able to detect many other nitrogen-containing species (e.g. ammonia). Among the 200 338
species with m/z less than 163 Th, there were 86 nitrogen-containing species (Figure 4B and Table S1). 339
Four imines (or enamines) including CH3N, C2H5N, C3H7N, and C4H9N were detected. These imines 340
(or enamines) could derive from photo-oxidation of amines (Nielsen et al., 2012). In addition, a 341
number of heterocyclic nitrogen-containing species including pyrrole, pyrroline, pyrrolidine, pyridine, 342
and pyrimidine were potentially detected (see Table S1). Apart from clusters of ammonia, C1- to 343
C6-amines, and C1- to C6-amides with water or ethanol, there were forty-eight CaHbNcOd species 344
representing 55.8 % of the total nitrogen-containing species. This suggests that more than half of the 345
nitrogen-containing species existed as oxygenated compounds in the atmosphere in urban Shanghai. 346
The rest 114 species with m/z less than 163 Th are mostly organics (see Table S1). Above 347
m/z=163 Th, numerous mass peaks were observed, which are likely organics and nitrogen-containing 348
species. These high-molecular-weight species are assumed to have a low volatility and may partition 349
between the gas phase and the particles. 350
3.2.2 Time profiles of amines and amides 351
During the field measurement, the average RH of the diluted gaseous samples was 15.8±3.5%. 352
According to our laboratory characterization, the MS signals of MA, TMA, and PA at 15.8% RH have 353
been in average enhanced by 10%, 9%, and 19%, respectively, from our calibration under dry 354
condition. Here, we use our sigmoidal fits to convert each of our ambient data points to the signal 355
under dry condition (RH = ~0%), and calculate the corresponding concentration. Since MA and TMA 356
behaved quite similarly at elevated RH, the sigmoidal fit for TMA is also applied to the C2-amines and 357
C4- to C6-amines. Also, the sigmoidal fit for PA is adopted for other amides. Since high purity 358
nitrogen (RH = ~0%) was used as the background sample during the ambient campaign, no 359
RH-dependent correction was made with background signals. 360
Assuming C1- to C4-amines have the same proton affinity as MA, DMA, TMA, and DEA, 361
respectively, the sensitivities of MA, DMA, TMA, and DEA were used to quantify C1- to C4-amines. 362
Since C5- to C6-amine standards are unavailable, the sensitivity of DEA by HR-ToF-CIMS was 363
adopted to quantify C5- to C6-amines. A similar approach was utilized to quantify C1- to C3-amides by 364
sensitivities of FA, AA, and PA, respectively. In addition, the sensitivity of PA was used to quantify 365
Atmos. Chem. Phys. Discuss., doi:10.5194/acp-2016-484, 2016Manuscript under review for journal Atmos. Chem. Phys.Published: 22 June 2016c© Author(s) 2016. CC-BY 3.0 License.
13
C4- to C6-amides. 366
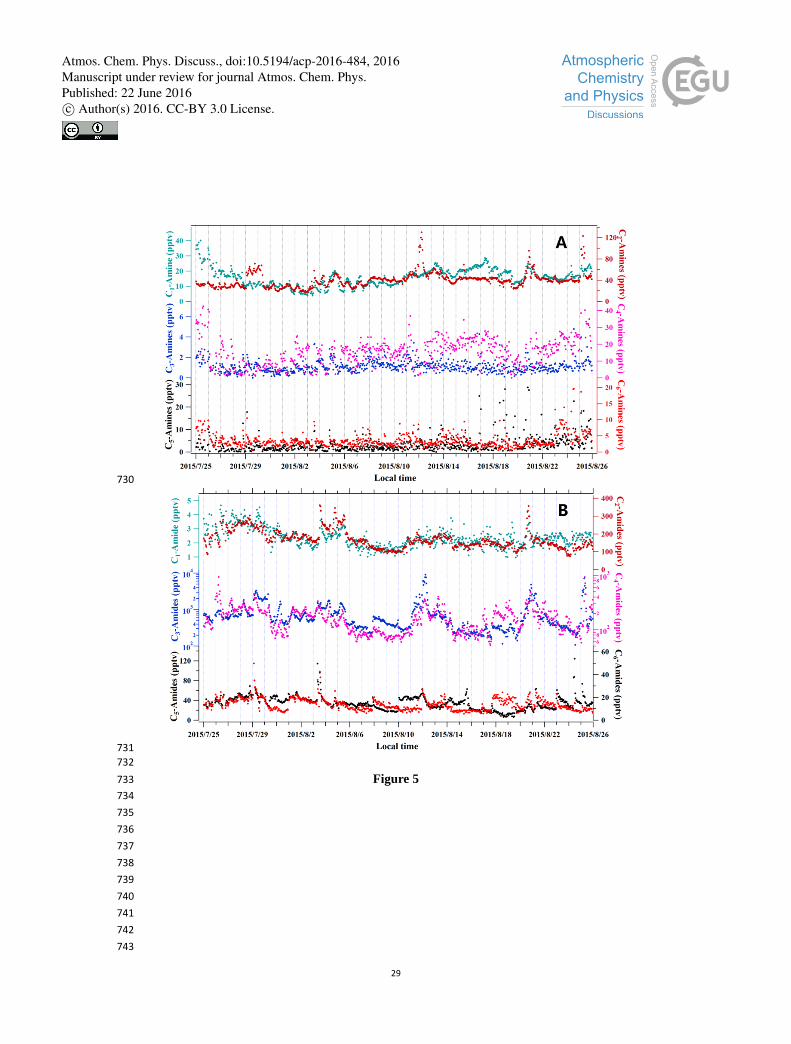
Figure 5 presents the time profiles for mixing ratios of C1- to C6-amines and C1- to C6-amides, 367
respectively, from 25 July to 25 August 2015 in urban Shanghai. Note that each date point in the 368
figure represents an average of 15-min measurements. Table 2 summarizes the mean concentrations of 369
C1- to C6-amines and C1- to C6-amides throughout the entire campaign, together with comparison of 370
amine and amide concentrations reported in previous field studies. 371
For C1- to C6-amines, the average concentrations (±σ) were 15.7±5.9 pptv, 40.0±14.3 pptv, 372
1.1±0.6 pptv, 15.4±7.9 pptv, 3.4±3.7 pptv, and 3.5±2.2 pptv, respectively. C1-amine, C2-amines, and 373
C4-amines were the dominant amine species in urban Shanghai. The concentrations of amines in 374
Shanghai are generally smaller than those in Hyytiälä, Finland (Hellén et al., 2014; Kieloaho et al., 375
2013; Sellegri et al., 2005), potentially hinting that sources for amines existed in the forest region of 376
Hyytiälä, Finland. Our C1- and C2-amines are generally more abundant than those in coastal, 377
continental, suburban, and urban areas (Freshour et al., 2014; Hanson et al., 2011; Kieloaho et al., 378
2013; Sellegri et al., 2005; You et al., 2014). However, our C3- to C6-amines are less, potentially 379
because we are able to distinguish an amine, an amide with one less carbon, and an oxoamide with 380
two less carbons (see Figure 3). 381
For C1- to C6-amides, the average concentrations (±σ) were 2.3±0.7 pptv, 169.2±51.5 pptv, 382
778.2±899.8 pptv, 167.8±97.0 pptv, 34.5±13.3 pptv, and 13.8±5.2 pptv, respectively. C2-amides, 383
C3-amides, and C4-amides were the most abundant amides in urban Shanghai during the campaign 384
and their concentrations were up to hundreds of pptv. Especially, the concentration of C3-amides 385
reached ~8700 pptv. Up to now, studies that report systematical identification and quantification of 386
amides in the ambient air are lacking. Leach et al. (1999) detected N,N-dimethylformamide (an isomer 387
of C3-amides) of 368-4357 pptv in a suburban area surrounded by municipal incinerator, waste 388
collection and processing center, and sewage treatment plant. In the ambient air, C1- to C6-amides may 389
derive from oxidation of C1- to C6-amines. N,N-dimethylformamide is a major product with a yield of 390
~40% from photolysis experiments of TMA under high NOx conditions (Nielsen et al, 2011). Also, the 391
yields of formamide (C1-amide) and methylforamide (C2-amide) from OH-initiated MA and DMA in 392
the presence of NOx are ~11% and ~13%, respectively (Nielsen et al, 2012). Comparison of the 393
abundance of amines and amides during the campaign, together with the yields of amides from 394
Atmos. Chem. Phys. Discuss., doi:10.5194/acp-2016-484, 2016Manuscript under review for journal Atmos. Chem. Phys.Published: 22 June 2016c© Author(s) 2016. CC-BY 3.0 License.
14
photo-oxidation of amines, suggests that the ambient C1- to C3-amines were insufficient to explain the 395
observed abundance of C1- to C3-amides. Therefore, in addition to secondary sources, C1- to 396
C6-amides likely were emitted from primary sources (e.g. industrial emissions). 397
Figure 6 shows a close examination on the temporal variations of C2-amines and C3-amides, 398
representatives of the observed amines and amides, together with that of rainfall between 20 August 399
2015 and 25 August 2015. The plots clearly reveal that the concentrations of C2-amines and 400
C3-amides on raining days were much lower than those without rain, and that C2-amines and 401
C3-amides rapidly went up after the rain. Previous studies reported that wet deposition is one of the 402
important sinks of amines (Cornell et al., 2003; Ge et al., 2011a, b; You et al., 2014). Our study further 403
indicates that wet deposition (or heterogeneous reactions) is also an important sink for amides. 404
3.2.3 Diurnal patterns 405
Figure 7 presents the averaged diurnal variations of C1- and C2-amines and C3- and C4-amides, 406
together with those of temperature, radiation, and ozone concentration during the campaign. Diurnal 407
patterns for amines and amides with less variation are exhibited in Figure S9. Mixing ratios of C1- and 408
C2-amines and C3- and C4-amides reached their peak values in the early morning (6:00~7:00am), and 409
then started to decline as the temperature increased. The mixing ratios were normally the lowest 410
during the day when the temperature rose to the top. The diurnal behavior of amines and amides can 411
be explained by the strong photochemical reactions of these species during the daytime (Barnes et al., 412
2010; Borduas et al., 2015; Nielsen et al., 2012), especially in summer, as evidenced by the negative 413
correlations between the mixing ratios and radiation (exponential fits with -0.0002≤ exponents ≤414
-0.0001), and between the mixing ratios and ozone (exponential fits with -0.003≤ exponents ≤415
-0.001), a tracer for photochemical activities. Also, nighttime chemistry of amines with NO3 radicals 416
could be active. In summer night time of Shanghai, the NO3 radical concentration could be up to 1010 417
radicals cm-3 (Wang et al., 2013b) and the reaction rates of amines with NO3 radicals are at the order 418
of 10-13 cm3 molecular-1s-1 (Nielsen et al., 2012). Hence, high mixing ratios of amines at nighttime 419
could be a secondary source of amides through reactions of amines with NO3 radicals. 420
In addition, an opposite tendency between the mixing ratios and the temperature (exponential fits 421
with -0.067≤ exponents ≤-0.049) is clearly evident in our study, which is in contrast to the positive 422
temperature dependence of C3-amines and C6-amines in previous studies (Hanson et al., 2011; You et 423
Atmos. Chem. Phys. Discuss., doi:10.5194/acp-2016-484, 2016Manuscript under review for journal Atmos. Chem. Phys.Published: 22 June 2016c© Author(s) 2016. CC-BY 3.0 License.
15
al., 2014; Yu and Lee, 2012). The positive temperature dependencies of C3-amines was explained by 424
deposition of amines onto soil or grass landscape at night and then partitioning back to the atmosphere 425
in the morning when the surface heats (Hanson et al., 2011; You et al., 2014). On the other hand, land 426
surface in Shanghai is mainly covered by bitumen and cement, on which the behavior of amines might 427
be different. 428
3.2.4 Source identification for C3-amides 429
Lagrangian dispersion model has been utilized to further understand the potential sources of 430
C3-amides. This Lagrangian modeling simulation is based on Hybrid Single-Particle Lagrangian 431
Integrated Trajectory (HYSPLIT) (Draxler and Hess, 1998; Stein et al., 2015) following the method 432
developed by Ding et al. (2013). Three-day backward retroplumes (100 m above the ground level) 433
from the Fudan sampling site are demonstrated for air masses with mixing ratios of C3-amides > 2670 434
pptv in Figure 8, and for air masses with 2650 pptv > mixing ratios of C3-amides > 1340 pptv in 435
Figure S10, respectively. The embedded 12 h retroplumes give a better view of the local zones 436
through which the air masses with high concentrations of C3-amides passed before their arrival to the 437
sampling site. Since the atmospheric lifetimes of N,N-dimethylformamide (an isomer of C3-amides) 438
and its potential precursor TMA (an isomer of C3-amines) in respect to reactions with OH radicals are 439
~3 h and ~10 h, respectively, using an 12 h-average OH radical concentration of 2×10⁶ radicals cm-3, 440
C3-amides were likely emitted or formed along the trajectory. As shown in Figure 8A-D, the air 441
plumes with high concentrations of C3-amides mainly originated from the sea and came from the 442
north of Shanghai. The air mass passed through predominantly industrial areas and cities after landing, 443
and Baoshan industrial zone (one of the main industrial zones in Shanghai) was right on its path during 444
the last 12 hours. Therefore, industrial emissions (or other anthropogenic emissions) might be 445
important sources of C3-amides. 446
Figure S10A-E presents another five cases with the next highest concentrations of C3-amide. The 447
air masses primarily came from southwest of the sampling site, and then passed through industrial 448
areas and cities before arrival, including Songjiang and Jinshan industrial zones (another two main 449
industrial zones in Shanghai) during the last 12 hours. These results also suggest that industrial 450
emissions or other anthropogenic activities might be important sources of C3-amides. 451
452
Atmos. Chem. Phys. Discuss., doi:10.5194/acp-2016-484, 2016Manuscript under review for journal Atmos. Chem. Phys.Published: 22 June 2016c© Author(s) 2016. CC-BY 3.0 License.
16
4 Conclusions 453
This paper presents laboratory characterization of an ethanol HR-ToF-CIMS method for 454
detection of amines and amides, and one month field deployment of the ethanol HR-ToF-CIMS in 455
urban Shanghai during summer 2015. Laboratory characterization indicates that our sensitivities for 456
amines (5.6-19.4 Hz pptv-1) and amides (3.8-38.0 Hz pptv-1) and detection limits for amines 457
(0.10-0.50 pptv) and amides (0.29-1.95 pptv at 3σ of the background signal for a 1-min integration 458
time), respectively, are slightly better than those in previous studies using CIMS methods (You et al., 459
2014; Yu and Lee, 2012). Correction of the mass signals of amines and amides are necessary at 460
elevated RH because of the significant RH dependence of detection of amines and amides as observed 461
in the laboratory. On the other hand, organics with high proton affinity are unlikely to pose an effect 462
on the detection of amines and amides as along as their concentrations will not lead to reagent ion 463
depletion. 464
High time resolution, highly sensitive and simultaneous measurements of amines (from a few 465
pptv to hundreds of pptv) and amides (from tens of pptv to a few ppbv) have been achieved during the 466
ambient campaign. Their diurnal profiles suggest that primary emissions could be important sources 467
of amides in urban Shanghai, in addition to the secondary formation processes, and that 468
photo-oxidation and wet deposition of amines and amides might be their main loss pathway. 469
86 nitrogen-containing species including amines and amides were identified with m/z less than 470
163 Th, 55.8% of which are oxygenated. This certainly indicates that the ethanol HR-ToF-CIMS 471
method potentially has a much wider implication in terms of measuring atmospheric 472
nitrogen-containing species. For example, imines (or enamines) and a number of heterocyclic 473
nitrogen-containing compounds (e.g. pyridine and quinoline) (see Table S1) were potentially detected 474
by this method. Berndt et al. (2014) reported that pyridine was able to enhance nucleation in 475
H2SO4/H2O system. Also, proton affinities of most of these heterocyclic nitrogen-containing 476
compounds are higher than that of ammonia, hence they potentially have the capacity to neutralize 477
atmospheric acidic species (e.g. H2SO4, HNO3 and organic acids) to contribute to secondary particle 478
formation and growth. 479
Nevertheless, the detection of amides in ambient air is consistent with the photochemical 480
chemistry that has been previously studied in the laboratory (Nielsen et al, 2012). Compared with 481
amines, acetamide has a very weak positive enhancement on nucleation capability of sulfuric acid 482
Atmos. Chem. Phys. Discuss., doi:10.5194/acp-2016-484, 2016Manuscript under review for journal Atmos. Chem. Phys.Published: 22 June 2016c© Author(s) 2016. CC-BY 3.0 License.
17
(Glasoe et al., 2015). On the other hand, the mixing ratios of amides were significantly higher than 483
those of amines in urban Shanghai during our measurements. Since the newly formed nano-particles 484
are likely highly acidic (Wang et al., 2010a), hydrolysis of amides will give rise to NH4+ in the particle, 485
in addition to those formed through direct neutralization between gaseous ammonia and particulate 486
sulfuric acid. Although significant progresses on the roles of ammonia and amines in the atmospheric 487
nucleation have been made (Almeida et al., 2013; Kürten et al., 2014) and it has been shown that 488
acetamide can only slightly enhance the nucleation rate of sulfuric acid (Glasoe et al., 2015), the exact 489
contribution of amides during atmospheric nucleation and subsequent growth events is yet to be 490
elucidated. 491
492
Acknowledgement 493
This study was financially supported by the National Natural Science Foundation of China (No. 494
21190053, 21222703, 21561130150, & 41575113), the Ministry of Science & Technology of China 495
(2012YQ220113-4), and the Cyrus Tang Foundation (No. CTF-FD2014001). LW thanks the Royal 496
Society-Newton Advanced Fellowship (NA140106). 497
Atmos. Chem. Phys. Discuss., doi:10.5194/acp-2016-484, 2016Manuscript under review for journal Atmos. Chem. Phys.Published: 22 June 2016c© Author(s) 2016. CC-BY 3.0 License.
18
References 498
Almeida, J., Schobesberger, S., Kürten, A., Ortega, I. K., Kupiainen-Määttä, O., Praplan, A. P., Adamov, A., 499
Amorim, A., Bianchi, F., Breitenlechner, M., David, A., Dommen, J., Donahue, N. M., Downard, A., 500
Dunne, E., Duplissy, J., Ehrhart, S., Flagan, R. C., Franchin, A., Guida, R., Hakala, J., Hansel, A., Heinritzi, 501
M., Henschel, H., Jokinen, T., Junninen, H., Kajos, M., Kangasluoma, J., Keskinen, H., Kupc, A., Kurtén, 502
T., Kvashin, A. N., Laaksonen, A., Lehtipalo, K., Leiminger, M., Leppä, J., Loukonen, V., Makhmutov, V., 503
Mathot, S., McGrath, M. J., Nieminen, T., Olenius, T., Onnela, A., Petäjä, T., Riccobono, F., Riipinen, I., 504
Rissanen, M., Rondo, L., Ruuskanen, T., Santos, F. D., Sarnela, N., Schallhart, S., Schnitzhofer, R., 505
Seinfeld, J. H., Simon, M., Sipilä, M., Stozhkov, Y., Stratmann, F., Tome, A., Tröstl, J., Tsagkogeorgas, G., 506
Vaattovaara, P., Viisanen, Y., Virtanen, A., Vrtala, A., Wagner, P. E., Weingartner, E., Wex, H., Williamson, 507
C., Wimmer, D., Ye, P., Yli-Juuti, T., Carslaw, K. S., Kulmala, M., Curtius, J., Baltensperger, U., Worsnop, 508
D. R., Vehkamäki, H., and Kirkby, J.: Molecular understanding of sulphuric acid-amine particle nucleation 509
in the atmosphere, Nature, 502, 359-363, 10.1038/nature12663, 2013. 510
Barnes, I., Solignac, G., Mellouki, A., and Becker, K. H.: Aspects of the Atmospheric Chemistry of Amides, 511
ChemPhysChem, 11, 3844-3857, 10.1002/cphc.201000374, 2010. 512
Barsanti, K. C., and Pankow, J. F.: Thermodynamics of the formation of atmospheric organic particulate matter 513
by accretion reactions - Part 3: Carboxylic and dicarboxylic acids, Atmos. Environ., 40, 6676-6686, 514
10.1016/j.atmosenv.2006.03.013 ,2006. 515
Bertram, T. H., Kimmel, J. R., Crisp, T. A., Ryder, O. S., Yatavelli, R. L. N., Thornton, J. A., Cubison, M. J., 516
Gonin, M., and Worsnop, D. R.: A field-deployable, chemical ionization time-of-flight mass spectrometer, 517
Atmos.Meas.Tech., 4, 1471-1479, 10.5194/amt-4-1471-2011, 2011. 518
Berndt, T., Sipilä, M., Stratmann, F., Petäjä, T., Vanhanen, J., Mikkilä, J., Patokoski, J., Taipale, R., Mauldin III, 519
R. L., and Kulmala, M.: Enhancement of atmospheric H2SO4/H2O nucleation: organic oxidation products 520
versus amines, Atmos. Chem. Phys., 14, 751–764, 10.5194/acp-14-751-2014, 2014. 521
Borduas, N., da Silva, G., Murphy, J. G., and Abbatt, J. P.: Experimental and theoretical understanding of the gas 522
phase oxidation of atmospheric amides with OH radicals: kinetics, products, and mechanisms, J. 523
Phys.Chem. A, 119, 4298-4308, 10.1021/jp503759f, 2015. 524
Bunkan, A. J. C., Mikoviny, T., Nielsen, C. J., and Wisthaler, A.: Experimental and theoretical study of the 525
OH-initiated photo-oxidation of formamide, J. Phys.Chem. A, 120, 1222-1230, 10.1021/acs.jpca.6b00032, 526
2016. 527
Cornell, S. E., Jickells, T. D., Cape, J. N., Rowland, A. P., and Duce, R. A.:Organics nitrogen deposition on land 528
and coastal environments: a review od methods and data, Atmos. Environ., 37, 2173-2191, 529
10.1016/S1352-2310(03)00133-X, 2003. 530
Cox, R. A., and Yates, K.: The hydrolyses of benzamides, methylbenzimidatium ions, and lactams in aqueous 531
sulfuric-acid - the excess acidity method in the determination of reaction-mechanisms, Can. J. Chem., 59, 532
2853-2863, Doi 10.1139/V81-414, 1981. 533
Draxler, R.R., and Hess,G.D.: An overview of the HYSPLIT_4 modeling system of trajectories, dispersion, and 534
deposition. Aust. Meteor. Mag., 47, 295-308,1998. 535
Ding, A. J., Wang, T., and Fu, C. B.: Transport characteristics and origins of carbon monoxide and ozone in 536
Hong Kong, South China, J. Geophys. Res. Atmos., 118, 9475-9488, 10.1002/jgrd.50714, 2013. 537
El Dib, G., and Chakir, A.: Temperature-dependence study of the gas-phase reactions of atmospheric NO3 538
radicals with a series of amides, Atmos. Environ., 41, 5887-5896, 10.1016/j.atmosenv.2007.03.038, 2007. 539
Erupe, M. E., Viggiano, A. A., and Lee, S. H.: The effect of trimethylamine on atmospheric nucleation involving 540
H2SO4, Atmos. Chem. Phys., 11, 4767-4775, 10.5194/acp-11-4767-2011, 2011. 541
Atmos. Chem. Phys. Discuss., doi:10.5194/acp-2016-484, 2016Manuscript under review for journal Atmos. Chem. Phys.Published: 22 June 2016c© Author(s) 2016. CC-BY 3.0 License.
19
Finlayson-Pitts, B. J., and Pitts, J. N.: Chemistry of the upper and lower atmosphere : theory, experiments, and 542
applications, Academic Press, San Diego, xxii, 969 p. pp., 2000. 543
Freshour, N. A., Carlson, K. K., Melka, Y. A., Hinz, S., Panta, B., and Hanson, D. R.: Amine permeation sources 544
characterized with acid neutralization and sensitivities of an amine mass spectrometer, Atmos. Meas. Tech., 545
7, 3611-3621, 10.5194/amt-7-3611-2014, 2014. 546
Glasoe, W. A., Volz, K., Panta, B., Freshour, N., Bachman, R., Hanson, D. R., McMurry, P. H., and Jen.C.: 547
Sulfuric acid nucleation : an experimental study of the effect of seven bases, J. Geophys. Res. Atmos., 120, 548
1933-1950, 10.1002/2014JD022730, 2015. 549
Ge, X., Wexler, A. S., and Clegg, S. L.: Atmospheric amines – Part I. A review, Atmos. Environ., 45, 524-546, 550
10.1016/j.atmosenv.2010.10.012, 2011. 551
Hanson, D. R., McMurry, P. H., Jiang, J., Tanner, D., and Huey, L. G.: Ambient Pressure Proton Transfer Mass 552
Spectrometry: Detection of Amines and Ammonia, Environ. Sci. Technol., 45, 8881-8888, 553
10.1021/es201819a, 2011. 554
Hellén, H., Kieloaho, A. J., and Hakola, H.: Gas-phase alkyl amines in urban air; comparison with a boreal 555
forest site and importance for local atmospheric chemistry, Atmos. Environ., 94, 192-197, 556
10.1016/j.atmosenv.2014.05.029, 2014. 557
Kieloaho, A.-J., Hellén, H., Hakola, H., Manninen, H. E., Nieminen, T., Kulmala, M., and Pihlatie, M.: 558
Gas-phase alkylamines in a boreal Scots pine forest air, Atmos. Environ., 80, 369-377, 559
10.1016/j.atmosenv.2013.08.019, 2013. 560
Kim, H. A., Kim, K., Heo, Y., Lee, S. H., and Choi, H. C.: Biological monitoring of workers exposed to 561
N,N-dimethylformamide in synthetic leather manufacturing factories in Korea, Int. Arch. Occup. Environ. 562
Health, 77, 108-112, 10.1007/s00420-003-0474-1, 2004. 563
Kuhn, U., Sintermann, J., Spirig, C., Jocher, M., Ammann, C., and Neftel, A.: Basic biogenic aerosol precursors: 564
Agricultural source attribution of volatile amines revised, Geophys. Res. Lett., 38, L16811, 565
doi:10.1029/2011GL047958 , 2011. 566
Kürten, A., Jokinen, T., Simon, M., Sipilä, M., Sarnela, N., Junninen, H., Adamov, A., Almeida, J., Amorim, A., 567
Bianchi, F., Breitenlechner, M., Dommen, J., Donahue, N. M., Duplissy, J., Ehrhart, S., Flagan, R. C., 568
Franchin, A., Hakala, J., Hansel, A., Heinritzi, M., Hutterli, M., Kangasluoma, J., Kirkby, J., Laaksonen, A., 569
Lehtipalo, K., Leiminger, M., Makhmutov, V., Mathot, S., Onnela, A., Petäjä, T., Praplan, A. P., Riccobono, 570
F., Rissanen, M. P., Rondo, L., Schobesberger, S., Seinfeld, J. H., Steiner, G., Tomé, A., Tröstl, J., Winkler, 571
P. M., Williamson, C., Wimmer, D., Ye, P., Baltensperger, U., Carslaw, K. S., Kulmala, M., Worsnop, D. R., 572
and Curtius, J.: Neutral molecular cluster formation of sulfuric acid-dimethylamine observed in real time 573
under atmospheric conditions, Proc.Natl.Acad.Sci., 111, 15019-15024, 10.1073/pnas.1404853111, 2014. 574
Leach, J., Blanch, A., and Bianchi, A. C.: Volatile organic compounds in an urban airborne environment adjacent 575
to a municipal incinerator, waste collection centre and sewage treatment plant, Atmos. Environ., 33, 576
4309-4325, Doi 10.1016/S1352-2310(99)00115-6, 1999. 577
Lee, A., Goldstein, A. H., Kroll, J. H., Ng, N. L., Varutbangkul, V., Flagan, R. C., and Seinfeld, J. H.: Gas-phase 578
products and secondary aerosol yields from the photooxidation of 16 different terpenes, J. Geophys. Res. 579
Atmos., 111, Artn D1730510.1029/2006jd007050, 2006. 580
Lee, D., and Wexler, A. S.: Atmospheric amines – Part III: Photochemistry and toxicity, Atmos. Environ., 71, 581
95-103, 10.1016/j.atmosenv.2013.01.058, 2013. 582
Lopez-Hilfiker, F. D., Mohr, C., Ehn, M., Rubach, F., Kleist, E., Wildt, J., Mentel, T. F., Lutz, A., Hallquist, M., 583
Worsnop, D., and Thornton, J. A.: A novel method for online analysis of gas and particle composition: 584
description and evaluation of a Filter Inlet for Gases and AEROsols (FIGAERO), Atmos.Meas.Tech., 7, 585
Atmos. Chem. Phys. Discuss., doi:10.5194/acp-2016-484, 2016Manuscript under review for journal Atmos. Chem. Phys.Published: 22 June 2016c© Author(s) 2016. CC-BY 3.0 License.
20
983-1001, 10.5194/amt-7-983-2014, 2014. 586
Ma, Y., Xu, X., Song, W., Geng, F., and Wang, L.: Seasonal and diurnal variations of particulate organosulfates 587
in urban Shanghai, China, Atmos. Environ., 85, 152-160, 10.1016/j.atmosenv.2013.12.017, 2014. 588
Malloy, Q. G. J., Qi, L., Warren, B., Cocker, D. R., Erupe, M. E., and Silva, P. J.: Secondary organic aerosol 589
formation from primary aliphatic amines with NO3 radical, Atmos. Chem. Phys., 9, 2051-2060, 2009. 590
Murphy, S. M., Sorooshian, A., Kroll, J. H., Ng, N. L., Chhabra, P., Tong, C., Surratt, J. D., Knipping, E., Flagan, 591
R. C., and Seinfeld, J. H.: Secondary aerosol formation from atmospheric reactions of aliphatic amines, 592
Atmos. Chem. Phys.,7, 2313-2337, 2007. 593
Nielsen, C. J., Herrmann, H., and Weller, C.: Atmospheric chemistry and environmental impact of the use of 594
amines in carbon capture and storage (CCS), Chem. Soc. Rev., 41, 6684-6704, 10.1039/c2cs35059a, 2012. 595
Nielsen, C. J., D’Anna, B., Karl, M., Aursnes, M., Boreave, A.,Bossi, R., Bunkan, A. J. C., Glasius, M., 596
Hallquist, M., Hansen,A.-M. K., Kristensen, K., Mikoviny, T., Maguta, M. M., Müller,M., Nguyen, Q., 597
Westerlund, J., Salo, K., Skov, H., Stenstrøm, Y.,and Wisthaler, A.: Atmospheric Degradation of Amines 598
(ADA), Norwegian Institute for Air Research, Kjeller, Norway, 2011. 599
Nowak, J. B.: Chemical ionization mass spectrometry technique for detection of dimethylsulfoxide and 600
ammonia, J. Geophys. Res. Atmos., 107, 10.1029/2001jd001058, 2002. 601
NIST: NIST Standard Reference Database Number 69, edited, National Institute for Standard Technology (NIST) 602
Chemistry Web Book, available at: http://webbook.nist.gov/chemistry/ (last access: 23 May 2016), 2016. 603
Qiu, C., Wang, L., Lal, V., Khalizov, A. F., and Zhang, R.: Heterogeneous reactions of alkylamines with 604
ammonium sulfate and ammonium bisulfate, Environ. Sci. Technol., 45, 4748-4755, 10.1021/es1043112, 605
2011. 606
Sellegri, K., Hanke, M., Umann, B., Arnold, F., and Kulmala, M.: Measurements of organic gases during aerosol 607
formation events in the boreal forest atmosphere during QUEST, Atmos. Chem. Phys., 5, 373-384, 2005. 608
Smith, D. F., Kleindienst, T. E., and McIver, C. D.: Primary product distributions from the reaction of OH with 609
m-, p-xylene, 1,2,4- and1,3,5-trimethylbenzene,J.Atmos.Chem.,34,339-364,Doi10.1023/A:1006277328628, 610
1999. 611
Smith, J. N., Barsanti, K. C., Friedli, H. R., Ehn, M., Kulmala, M., Collins, D. R., Scheckman, J. H., Williams, 612
B. J., and McMurry, P. H.: Observations of aminium salts in atmospheric nanoparticles and possible 613
climatic implications, Proc.Natl.Acad.Sci., 107, 6634-6639, 10.1073/pnas.0912127107, 2010. 614
Stein, A.F., Draxler, R.R, Rolph, G.D., Stunder, B.J.B., Cohen, M.D., and Ngan, F.: NOAA's HYSPLIT 615
atmospheric transport and dispersion modeling system, B. Am. Meteorol. Soc., 96, 2059-2077, 616
doi:10.1175/BAMS-D-14-00110.1, 2015. 617
VandenBoer, T. C., Petroff, A., Markovic, M. Z., and Murphy, J. G.: Size distribution of alkyl amines in 618
continental particulate matter and their online detection in the gas and particle phase, Atmos. Chem. Phys., 619
11, 4319–4332, 10.5194/acp-11-4319-2011, 2011. 620
Wang, L., Khalizov, A. F., Zheng, J., Xu, W., Ma, Y., Lal, V., and Zhang, R.: Atmospheric nanoparticles formed 621
from heterogeneous reactions of organics, Nat. Geosci., 3, 238-242, 10.1038/ngeo778, 2010a. 622
Wang, L., Lal, V., Khalizov, A. F., and Zhang, R. Y.: Heterogeneous Chemistry of Alkylamines with Sulfuric 623
Acid: Implications for Atmospheric Formation of Alkylaminium Sulfates, Environ. Sci. Technol., 44, 624
2461-2465, 10.1021/es9036868, 2010b. 625
Wang, L., Du, H., Chen, J., Zhang, M., Huang, X., Tan, H., Kong, L., and Geng, F.: Consecutive transport of 626
anthropogenic air masses and dust storm plume: Two case events at Shanghai, China, Atmos. Res., 127, 627
22-33, 10.1016/j.atmosres.2013.02.011, 2013a. 628
Wang, S., Shi, C., Zhou, B., Zhao, H., Wang, Z., Yang, S., and Chen, L.: Observation of NO3 radicals over 629
Atmos. Chem. Phys. Discuss., doi:10.5194/acp-2016-484, 2016Manuscript under review for journal Atmos. Chem. Phys.Published: 22 June 2016c© Author(s) 2016. CC-BY 3.0 License.
21
Shanghai, China, Atmos. Environ., 70, 401-409, 10.1016/j.atmosenv.2013.01.022, 2013b. 630
Wang, X. K., Rossignol, S., Ma, Y., Yao, L., Wang, M. Y., Chen, J. M., George, C., and Wang, L.: Molecular 631
characterization of atmospheric particulate organosulfates in three megacities at the middle and lower 632
reaches of the Yangtze River, Atmos. Chem. Phys., 16, 2285-2298, 10.5194/acp-16-2285-2016, 2016. 633
Xiao, S., Wang, M. Y., Yao, L., Kulmala, M., Zhou, B., Yang, X., Chen, J. M., Wang, D. F., Fu, Q. Y., Worsnop, 634
D. R., and Wang, L.: Strong atmospheric new particle formation in winter in urban Shanghai, China, Atmos. 635
Chem. Phys.,15, 1769-1781, 10.5194/acp-15-1769-2015, 2015. 636
You, Y., Kanawade, V. P., de Gouw, J. A., Guenther, A. B., Madronich, S., Sierra-Hernández, M. R., Lawler, M., 637
Smith, J. N., Takahama, S., Ruggeri, G., Koss, A., Olson, K., Baumann, K., Weber, R. J., Nenes, A., Guo, 638
H., Edgerton, E. S., Porcelli, L., Brune, W. H., Goldstein, A. H., and Lee, S. H.: Atmospheric amines and 639
ammonia measured with a chemical ionization mass spectrometer (CIMS), Atmos. Chem. Phys., 14, 640
12181-12194, 10.5194/acp-14-12181-2014, 2014. 641
Yu, H., and Lee, S.-H.: Chemical ionisation mass spectrometry for the measurement of atmospheric amines, 642
Environ. Chem., 9, 190, 10.1071/en12020, 2012. 643
Yu, H., McGraw, R., and Lee, S. H.: Effects of amines on formation of sub-3 nm particles and their subsequent 644
growth, Geophys. Res. Lett., 39, Artn L0280710.1029/2011gl050099, 2012. 645
Zhang, R., Khalizov, A., Wang, L., Hu, M., and Xu, W.: Nucleation and growth of nanoparticles in the 646
atmosphere, Chem. Rev., 112, 1957-2011, 10.1021/cr2001756, 2012. 647
Zheng, J., Ma, Y., Chen, M., Zhang, Q., Wang, L., Khalizov, A. F., Yao, L., Wang, Z., Wang, X., and Chen, L.: 648
Measurement of atmospheric amines and ammonia using the high resolution time-of-flight chemical 649
ionization mass spectrometry, Atmos. Environ., 102, 249-259, 10.1016/j.atmosenv.2014.12.002, 2015. 650
Zhu, L., Schade, G. W., and Nielsen, C. J.: Real-time monitoring of emissions from monoethanolamine-based 651
industrial scale carbon capture facilities, Environ. Sci. Technol., 47, 14306-14314, 10.1021/es4035045, 652
2013. 653
654
Atmos. Chem. Phys. Discuss., doi:10.5194/acp-2016-484, 2016Manuscript under review for journal Atmos. Chem. Phys.Published: 22 June 2016c© Author(s) 2016. CC-BY 3.0 License.
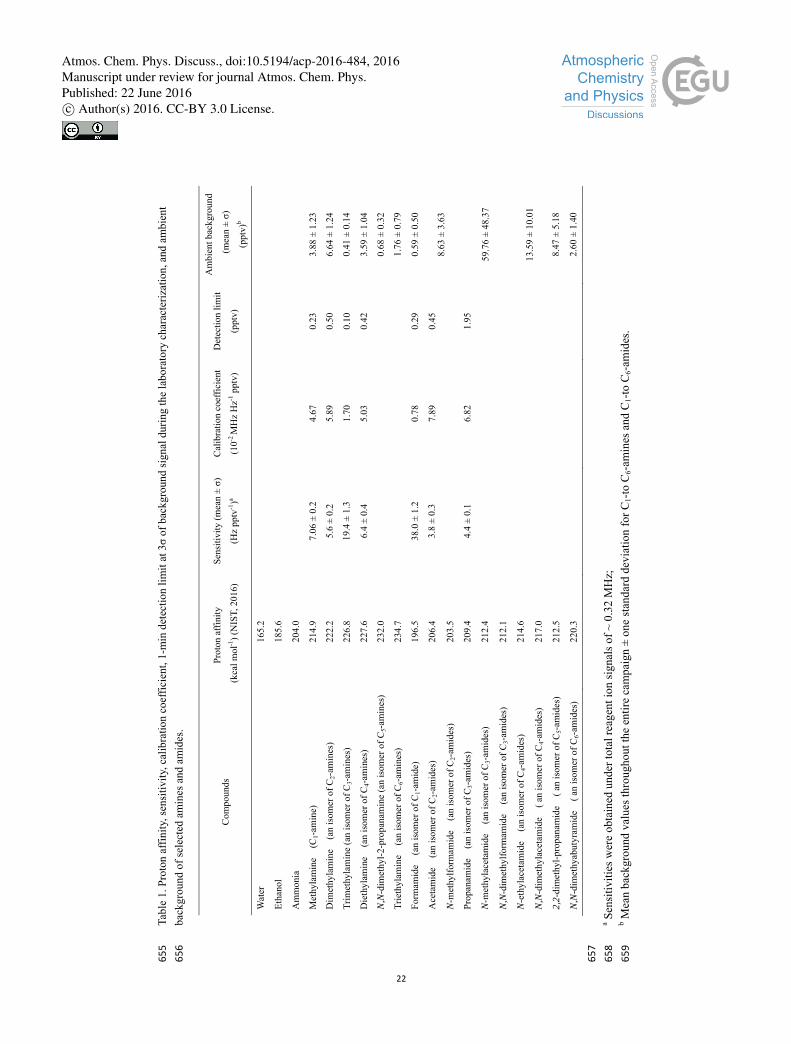
Ta
ble
1. P
roto
n af
fini
ty, s
ensi
tivi
ty, c
alib
rati
on c
oeff
icie
nt, 1
-min
det
ecti
on li
mit
at 3σ
of b
ackg
roun
d si
gnal
dur
ing
the
labo
rato
ry c
hara
cter
izat
ion,
and
am
bien
t 655
back
grou
nd o
f se
lect
ed a
min
es a
nd a
mid
es.
656
657
a Sen
siti
viti
es w
ere
obta
ined
und
er to
tal r
eage
nt io
n si
gnal
s of
~ 0
.32
MH
z;
658
b Mea
n ba
ckgr
ound
val
ues
thro
ugho
ut th
e en
tire
cam
paig
n ±
one
stan
dard
dev
iatio
n fo
r C
1-to
C6-
amin
es a
nd C
1-to
C6-
amid
es.
659
Com
poun
ds
Pro
ton
affi
nity
(kca
l mol
-1)
(NIS
T, 2
016)
Sen
siti
vity
(m
ean
± σ)
(Hz
pptv
-1)a
Cal
ibra
tion
coe
ffic
ient
(10-2
MH
z H
z-1 p
ptv)
Det
ecti
on li
mit
(ppt
v)
Am
bien
t bac
kgro
und
(m
ean
± σ)
(ppt
v)b
Wat
er
165.
2
Eth
anol
18
5.6
Am
mon
ia
204.
0
Met
hyla
min
e (
C1-
amin
e)
214.
9 7.
06 ±
0.2
4.
67
0.23
3.
88 ±
1.2
3
Dim
ethy
lam
ine
(an
isom
er o
f C
2-am
ines
) 22
2.2
5.6
± 0.
2 5.
89
0.50
6.
64 ±
1.2
4
Tri
met
hyla
min
e (a
n is
omer
of
C3-
amin
es)
226.
8 19
.4 ±
1.3
1.
70
0.10
0.
41 ±
0.1
4
Die
thyl
amin
e (
an is
omer
of
C4-
amin
es)
227.
6 6.
4 ±
0.4
5.03
0.
42
3.59
± 1
.04
N,N
-dim
ethy
l-2-
prop
anam
ine
(an
isom
er o
f C
5-am
ines
)23
2.0
0.
68 ±
0.3
2
Tri
ethy
lam
ine
(an
isom
er o
f C
6-am
ines
) 23
4.7
1.
76 ±
0.7
9
For
mam
ide
(an
isom
er o
f C
1-am
ide)
19
6.5
38.0
± 1
.2
0.78
0.
29
0.59
± 0
.50
Ace
tam
ide
(an
isom
er o
f C
2-am
ides
) 20
6.4
3.8
± 0.
3 7.
89
0.45
8.
63 ±
3.6
3 N
-met
hylf
orm
amid
e (
an is
omer
of
C2-
amid
es)
203.
5
Pro
pana
mid
e (
an is
omer
of
C3-
amid
es)
209.
4 4.
4 ±
0.1
6.82
1.
95
59.7
6 ±
48.3
7 N
-met
hyla
ceta
mid
e (
an is
omer
of
C3-
amid
es)
212.
4
N,N
-dim
ethy
lfor
mam
ide
(an
isom
er o
f C
3-am
ides
) 21
2.1
N-e
thyl
acet
amid
e (
an is
omer
of
C4-
amid
es)
214.
6
13.5
9 ±
10.0
1 N
,N-d
imet
hyla
ceta
mid
e (
an
isom
er o
f C
4-am
ides
) 21
7.0
2,2-
dim
ethy
l-pr
opan
amid
e (
an
isom
er o
f C
5-am
ides
)21
2.5
8.
47 ±
5.1
8
N,N
-dim
ethy
abut
yram
ide
( a
n is
omer
of
C6-
amid
es)
220.
3
2.60
± 1
.40
22
Atmos. Chem. Phys. Discuss., doi:10.5194/acp-2016-484, 2016Manuscript under review for journal Atmos. Chem. Phys.Published: 22 June 2016c© Author(s) 2016. CC-BY 3.0 License.
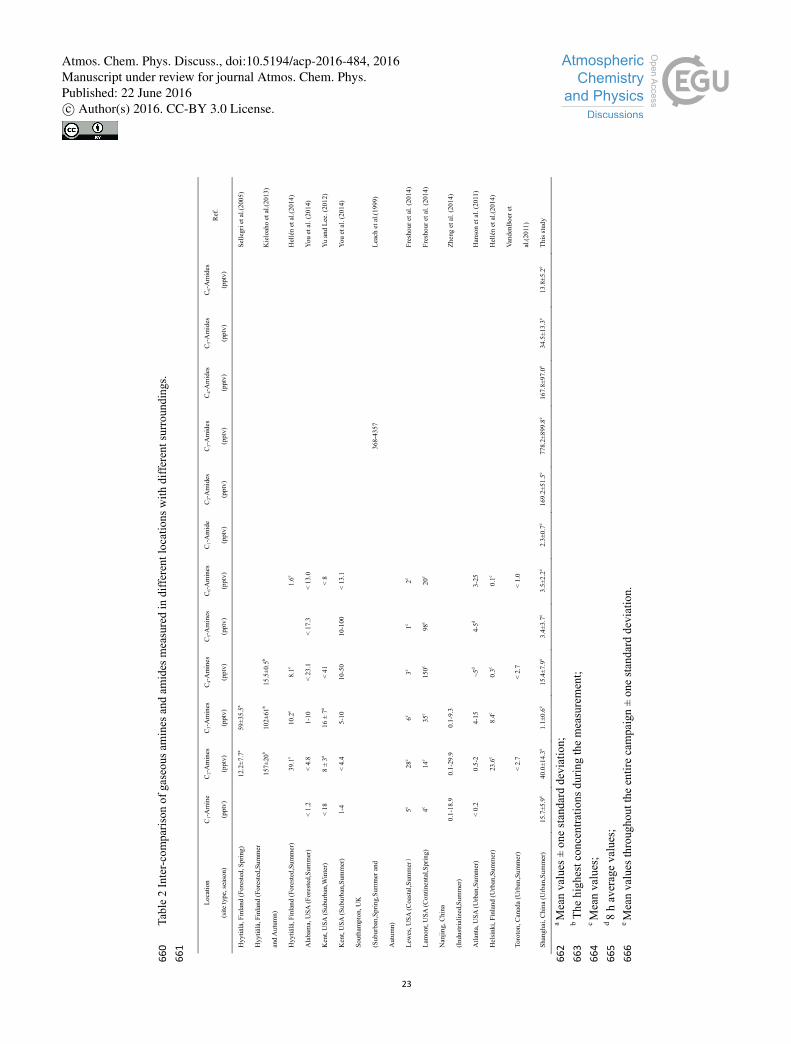
Tabl
e 2
Inte
r-co
mpa
riso
n of
gas
eous
am
ines
and
am
ides
mea
sure
d in
dif
fere
nt lo
cati
ons
wit
h di
ffer
ent s
urro
undi
ngs.
660
661
a M
ean
valu
es ±
one
sta
ndar
d de
viat
ion;
662
b The
hig
hest
con
cent
rati
ons
duri
ng th
e m
easu
rem
ent;
663
c M
ean
valu
es;
664
d 8
h av
erag
e va
lues
;
665
e M
ean
valu
es th
roug
hout
the
enti
re c
ampa
ign
± on
e st
anda
rd d
evia
tion
. 666
Loc
atio
n
(sit
e ty
pe, s
easo
n)
C1-
Am
ine
(ppt
v)
C2-
Am
ines
(ppt
v)
C3-
Am
ines
(ppt
v)
C4-
Am
ines
(ppt
v)
C5-
Am
ines
(ppt
v)
C6-
Am
ines
(ppt
v)
C1-
Am
ide
(ppt
v)
C2-
Am
ides
(ppt
v)
C3-
Am
ides
(ppt
v)
C4-
Am
ides
(ppt
v)
C5-
Am
ides
(ppt
v)
C6-
Am
ides
(ppt
v)
Ref
.
Hyy
tiäl
ä, F
inla
nd (
For
este
d, S
prin
g)
12
.2±7
.7a
59±3
5.5a
S
elle
gri e
t al.(
2005
)
Hyy
tiäl
ä, F
inla
nd (
For
este
d,S
umm
er
and
Aut
umn)
157±
20b
102±
61b
15.5
±0.5
b
K
ielo
aho
et a
l.(20
13)
Hyy
tiäl
ä, F
inla
nd (
For
este
d,S
umm
er)
39
.1c
10.2
c 8.
1c
1.6c
Hel
lén
et a
l.(20
14)
Ala
bam
a, U
SA
(F
ores
ted,
Sum
mer
) <
1.2
<
4.8
1-
10
< 2
3.1
< 1
7.3
< 1
3.0
You
et a
l. (2
014)
Ken
t, U
SA
(S
ubur
ban,
Win
ter)
<
18
8 ±
3a 16
± 7
a <
41
<
8
Yu
and
Lee
. (20
12)
Ken
t, U
SA
(S
ubur
ban,
Sum
mer
) 1-
4 <
4.4
5-
10
10-5
0 10
-100
<
13.
1
Y
ou e
t al.
(201
4)
Sou
tham
pton
, UK
(Sub
urba
n,S
prin
g,S
umm
er a
nd
Aut
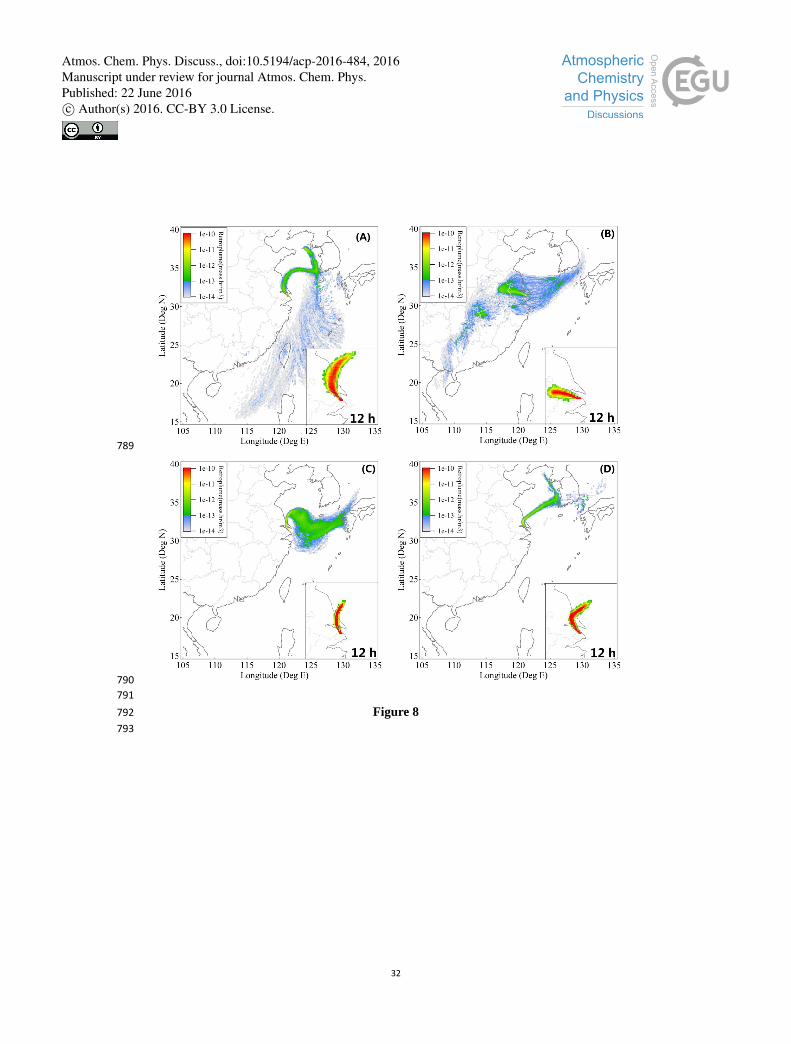
umn)
368-
4357
Lea
ch e
t al.(
1999
)
Lew
es, U
SA
(C
oast
al,S
umm
er)
5c
28c
6c 3c
1c 2c
Fre
shou
r et
al.
(201
4)
Lam
ont,
US
A (
Con
tine
ntal
,Spr
ing)
4c
14c
35c
150c
98c
20c
Fre
shou
r et
al.
(201
4)
Nan
jing
, Chi
na
(Ind
ustr
iali
zed,
Sum
mer
) 0.
1-18
.9
0.1-
29.9
0.
1-9.
3
Zhe
ng e
t al.
(201
4)
Atl
anta
, US
A (
Urb
an,S
umm
er)
< 0
.2
0.5-
2 4-
15
~5d
4-5d
3-25
H
anso
n et
al.
(201
1)
Hel
sink
i, F
inla
nd (
Urb
an,S
umm
er)
23
.6c
8.4c
0.3c
0.
1c
H
ellé
n et
al.(
2014
)
Toro
ton,
Can
ada
(Urb
an,S
umm
er)
<
2.7
< 2
.7
<
1.0
V
ande
nBoe
r et
al.(
2011
)
Sha
ngha
i, C
hina
(U
rban
,Sum
mer
) 15
.7±5
.9e
40.0
±14.
3e 1.
1±0.
6e 15
.4±7
.9e
3.4±
3.7e
3.5±
2.2e
2.3±
0.7e
169.
2±51
.5e
778.
2±89
9.8e
167.
8±97
.0e
34.5
±13.
3e 13
.8±5
.2e
Thi
s st
udy
23
Atmos. Chem. Phys. Discuss., doi:10.5194/acp-2016-484, 2016Manuscript under review for journal Atmos. Chem. Phys.Published: 22 June 2016c© Author(s) 2016. CC-BY 3.0 License.
24
Figure captions: 667
668
Figure 1. Influences of RH on the MS signals of methylamine (MA), trimethylamine (TMA), and 669
propanamide (PA). 670
671
Figure 2. Influences of organics on MS signals of methylamine (MA, panels A and B), 672
trimethylamine (TMA, panels A and B), and propanamide (PA, panels C and D). Note that the right 673
axis is used for the signal with an identical color, and other signals correspond to the left axis. 674
675
Figure 3. High-resolution single peak fitting for amines and amides. 676
677
Figure 4. Mass defect diagram for (A) protonated amines (C1-C6) and amides (C1-C6) and their 678
clusters with ethanol, together with other species with m/z less than 163 Th in the ambient sample; 679
and (B) all nitrogen-containing species with m/z less than 163 Th in the ambient sample. Circle 680
diameters are proportional to log10(count rates). 681
682
Figure 5. Time series of amines (panel A) and amides (panel B). Concentrations of amines and 683
amides are 15-min average values. 684
685
Figure 6. Time profiles of the rainfall, C2-amines and C3-amides. 686
687
Figure 7. The averaged diurnal profiles of C1- and C2-amines and C3- and C4-amides, together with 688
those of temperature, radiation, and ozone concentration during the campaign. 689
690
Figure 8. Three-day backward retroplumes (100 m above the ground level) from the sampling 691
location at (A) 05:00, 12 August 2015; (B) 21:00, 20 August 2015; (C) 06:00, 21 August 2015; and (D) 692
06:00, 25 August 2015. The embedded boxes show 12 h backward trajectories. 693
694
695
696
697
698
699
700
701
702
703
704
705
706
707
708
709
Atmos. Chem. Phys. Discuss., doi:10.5194/acp-2016-484, 2016Manuscript under review for journal Atmos. Chem. Phys.Published: 22 June 2016c© Author(s) 2016. CC-BY 3.0 License.
25
710
711
712
713
Figure 1 714
Atmos. Chem. Phys. Discuss., doi:10.5194/acp-2016-484, 2016Manuscript under review for journal Atmos. Chem. Phys.Published: 22 June 2016c© Author(s) 2016. CC-BY 3.0 License.
715
716
Fig
ure
2
717
26
Atmos. Chem. Phys. Discuss., doi:10.5194/acp-2016-484, 2016Manuscript under review for journal Atmos. Chem. Phys.Published: 22 June 2016c© Author(s) 2016. CC-BY 3.0 License.
27
718
719
720
721
722
Figure 3 723
724
725
Atmos. Chem. Phys. Discuss., doi:10.5194/acp-2016-484, 2016Manuscript under review for journal Atmos. Chem. Phys.Published: 22 June 2016c© Author(s) 2016. CC-BY 3.0 License.
28
726
727
Figure 4 728
729
Atmos. Chem. Phys. Discuss., doi:10.5194/acp-2016-484, 2016Manuscript under review for journal Atmos. Chem. Phys.Published: 22 June 2016c© Author(s) 2016. CC-BY 3.0 License.
29
730
731
732
Figure 5 733
734
735
736
737
738
739
740
741
742
743
Atmos. Chem. Phys. Discuss., doi:10.5194/acp-2016-484, 2016Manuscript under review for journal Atmos. Chem. Phys.Published: 22 June 2016c© Author(s) 2016. CC-BY 3.0 License.

30
744
Figure 6 745
746
747
748
749
750
751
752
753
754
755
756
757
758
759
760
761
762
763
764
765
766
767
768
769
770
771
772
Atmos. Chem. Phys. Discuss., doi:10.5194/acp-2016-484, 2016Manuscript under review for journal Atmos. Chem. Phys.Published: 22 June 2016c© Author(s) 2016. CC-BY 3.0 License.

31
773
774
775
776
777
778
779
780
781
782
783
784
Figure 7 785
786
787
788
Atmos. Chem. Phys. Discuss., doi:10.5194/acp-2016-484, 2016Manuscript under review for journal Atmos. Chem. Phys.Published: 22 June 2016c© Author(s) 2016. CC-BY 3.0 License.
32
789
790
791
Figure 8 792
793
Atmos. Chem. Phys. Discuss., doi:10.5194/acp-2016-484, 2016Manuscript under review for journal Atmos. Chem. Phys.Published: 22 June 2016c© Author(s) 2016. CC-BY 3.0 License.