detection of a_supervoid_aligned_with_the_cold_spot_of_the_cosmic_microwave_background
TRANSCRIPT

MNRAS 450, 288–294 (2015) doi:10.1093/mnras/stv488
Detection of a supervoid aligned with the cold spot of the cosmicmicrowave background
Istvan Szapudi,1‹ Andras Kovacs,2,3,4 Benjamin R. Granett,5 Zsolt Frei,2,3
Joseph Silk,6 Will Burgett,1 Shaun Cole,7 Peter W. Draper,7 Daniel J. Farrow,7
Nicholas Kaiser,1 Eugene A. Magnier,1 Nigel Metcalfe,7 Jeffrey S. Morgan,1
Paul Price,8 John Tonry1 and Richard Wainscoat11Institute for Astronomy, University of Hawaii 2680 Woodlawn Drive, Honolulu, HI 96822, USA2Institute of Physics, Eotvos Lorand University, Pazmany Peter setany 1/A, 1117 Budapest, Hungary3MTA-ELTE EIRSA ‘Lendulet’ Astrophysics Research Group, Pazmany Peter setany 1/A, 1117 Budapest, Hungary4Institut de Fısica d’Altes Energies, Universitat Autonoma de Barcelona, E-08193 Bellaterra (Barcelona), Spain5INAF OA Brera, Via E. Bianchi 46, I-23807 Merate, Italy6Department of Physics and Astronomy, The Johns Hopkins University, Baltimore, MD 21218, USA7Department of Physics, Durham University, South Road, Durham DH1 3LE, UK8Department of Astrophysical Sciences, Princeton University, Princeton, NJ 08544, USA
Accepted 2015 March 4. Received 2015 February 24; in original form 2014 May 6
ABSTRACTWe use the WISE-2MASS infrared galaxy catalogue matched with Pan-STARRS1 (PS1)galaxies to search for a supervoid in the direction of the cosmic microwave background(CMB) cold spot (CS). Our imaging catalogue has median redshift z � 0.14, and we obtainphotometric redshifts from PS1 optical colours to create a tomographic map of the galaxydistribution. The radial profile centred on the CS shows a large low-density region, extendingover tens of degrees. Motivated by previous CMB results, we test for underdensities withintwo angular radii, 5◦, and 15◦. The counts in photometric redshift bins show significantlylow densities at high detection significance, �5σ and �6σ , respectively, for the two fiducialradii. The line-of-sight position of the deepest region of the void is z � 0.15–0.25. Our data,combined with an earlier measurement by Granett, Szapudi & Neyrinck, are consistent with alarge Rvoid = (220 ± 50) h−1 Mpc supervoid with δm �−0.14 ± 0.04 centred at z= 0.22 ± 0.03.Such a supervoid, constituting at least a �3.3σ fluctuation in a Gaussian distribution of the �
cold dark matter model, is a plausible cause for the CS.
Key words: surveys – cosmic background radiation – cosmology: observations – large-scalestructure of Universe.
1 IN T RO D U C T I O N
The cold spot (CS) of the cosmic microwave background (CMB)is an exceptionally cold −70 µK area centred on (l, b) � (209◦,−57◦) Galactic coordinates. It was first detected in the WilkinsonMicrowave Anisotropy Probe (Bennett et al. 2013) maps at � 3σ
significance using wavelet filtering (Vielva et al. 2004; Cruz et al.2005). The CS is perhaps the most significant among the ‘anoma-lies’, potential departures from isotropic and/or Gaussian statistics,and all confirmed by Planck (Planck Collaboration XXIII 2014).Explanations of the CS range from statistical fluke through hithertoundiscovered physics, e.g. textures (Cruz et al. 2008; Vielva 2010),to the linear and non-linear ISW effect (Sachs & Wolfe 1967; Rees& Sciama 1968) from a �200 h−1 Mpc supervoid centred on the
� E-mail: [email protected]
CS (Inoue & Silk 2006, 2007; Inoue, Sakai & Tomita 2010). Thelatter would be readily detectable in large-scale structure surveysthus motivating several observational studies.
A low-density region approximately aligned with the CS was de-tected in a catalogue of radio galaxies (Rudnick, Brown & Williams2007), although its significance has been disputed (Smith & Huterer2010). A targeted redshift survey in the area (Bremer et al. 2010)found no evidence for a void in the redshift range of 0.35 < z < 1,while an imaging survey with photometric redshifts (Granett,Szapudi & Neyrinck 2010) excluded the presence of a large un-derdensity of δ � −0.3 between redshifts of 0.5 < z < 0.9 andfinding none at 0.3 < z < 0.5. Both of these surveys ran out ofvolume at low redshifts due to their small survey area, althoughthe data are consistent with the presence of a void at z < 0.3 withlow significance (Granett et al. 2010). In a shallow photometric red-shift catalogue constructed from the Two Micron All Sky Survey(2MASS; Skrutskie et al. 2006) and SuperCOSMOS (Hambly et al.
C© 2015 The AuthorsPublished by Oxford University Press on behalf of the Royal Astronomical Society
by guest on April 21, 2015
http://mnras.oxfordjournals.org/
Dow
nloaded from
PS1-WISE-2MASS void 289
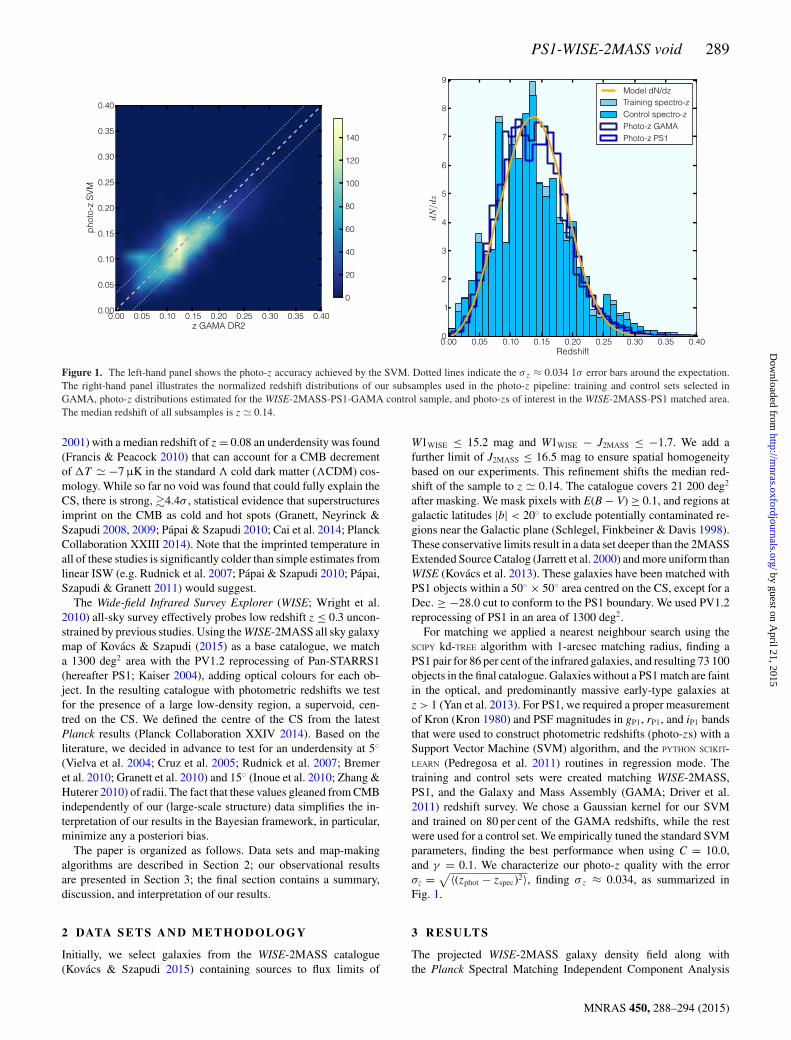
Figure 1. The left-hand panel shows the photo-z accuracy achieved by the SVM. Dotted lines indicate the σz ≈ 0.034 1σ error bars around the expectation.The right-hand panel illustrates the normalized redshift distributions of our subsamples used in the photo-z pipeline: training and control sets selected inGAMA, photo-z distributions estimated for the WISE-2MASS-PS1-GAMA control sample, and photo-zs of interest in the WISE-2MASS-PS1 matched area.The median redshift of all subsamples is z � 0.14.
2001) with a median redshift of z = 0.08 an underdensity was found(Francis & Peacock 2010) that can account for a CMB decrementof �T � −7 µK in the standard � cold dark matter (�CDM) cos-mology. While so far no void was found that could fully explain theCS, there is strong, �4.4σ , statistical evidence that superstructuresimprint on the CMB as cold and hot spots (Granett, Neyrinck &Szapudi 2008, 2009; Papai & Szapudi 2010; Cai et al. 2014; PlanckCollaboration XXIII 2014). Note that the imprinted temperature inall of these studies is significantly colder than simple estimates fromlinear ISW (e.g. Rudnick et al. 2007; Papai & Szapudi 2010; Papai,Szapudi & Granett 2011) would suggest.
The Wide-field Infrared Survey Explorer (WISE; Wright et al.2010) all-sky survey effectively probes low redshift z ≤ 0.3 uncon-strained by previous studies. Using the WISE-2MASS all sky galaxymap of Kovacs & Szapudi (2015) as a base catalogue, we matcha 1300 deg2 area with the PV1.2 reprocessing of Pan-STARRS1(hereafter PS1; Kaiser 2004), adding optical colours for each ob-ject. In the resulting catalogue with photometric redshifts we testfor the presence of a large low-density region, a supervoid, cen-tred on the CS. We defined the centre of the CS from the latestPlanck results (Planck Collaboration XXIV 2014). Based on theliterature, we decided in advance to test for an underdensity at 5◦
(Vielva et al. 2004; Cruz et al. 2005; Rudnick et al. 2007; Bremeret al. 2010; Granett et al. 2010) and 15◦ (Inoue et al. 2010; Zhang &Huterer 2010) of radii. The fact that these values gleaned from CMBindependently of our (large-scale structure) data simplifies the in-terpretation of our results in the Bayesian framework, in particular,minimize any a posteriori bias.
The paper is organized as follows. Data sets and map-makingalgorithms are described in Section 2; our observational resultsare presented in Section 3; the final section contains a summary,discussion, and interpretation of our results.
2 DATA SE T S A N D M E T H O D O L O G Y
Initially, we select galaxies from the WISE-2MASS catalogue(Kovacs & Szapudi 2015) containing sources to flux limits of
W1WISE ≤ 15.2 mag and W1WISE − J2MASS ≤ −1.7. We add afurther limit of J2MASS ≤ 16.5 mag to ensure spatial homogeneitybased on our experiments. This refinement shifts the median red-shift of the sample to z � 0.14. The catalogue covers 21 200 deg2
after masking. We mask pixels with E(B − V) ≥ 0.1, and regions atgalactic latitudes |b| < 20◦ to exclude potentially contaminated re-gions near the Galactic plane (Schlegel, Finkbeiner & Davis 1998).These conservative limits result in a data set deeper than the 2MASSExtended Source Catalog (Jarrett et al. 2000) and more uniform thanWISE (Kovacs et al. 2013). These galaxies have been matched withPS1 objects within a 50◦ × 50◦ area centred on the CS, except for aDec. ≥ −28.0 cut to conform to the PS1 boundary. We used PV1.2reprocessing of PS1 in an area of 1300 deg2.
For matching we applied a nearest neighbour search using theSCIPY kd-TREE algorithm with 1-arcsec matching radius, finding aPS1 pair for 86 per cent of the infrared galaxies, and resulting 73 100objects in the final catalogue. Galaxies without a PS1 match are faintin the optical, and predominantly massive early-type galaxies atz > 1 (Yan et al. 2013). For PS1, we required a proper measurementof Kron (Kron 1980) and PSF magnitudes in gP1, rP1, and iP1 bandsthat were used to construct photometric redshifts (photo-zs) with aSupport Vector Machine (SVM) algorithm, and the PYTHON SCIKIT-LEARN (Pedregosa et al. 2011) routines in regression mode. Thetraining and control sets were created matching WISE-2MASS,PS1, and the Galaxy and Mass Assembly (GAMA; Driver et al.2011) redshift survey. We chose a Gaussian kernel for our SVMand trained on 80 per cent of the GAMA redshifts, while the restwere used for a control set. We empirically tuned the standard SVMparameters, finding the best performance when using C = 10.0,and γ = 0.1. We characterize our photo-z quality with the errorσz = √〈(zphot − zspec)2〉, finding σ z ≈ 0.034, as summarized inFig. 1.
3 R ESULTS
The projected WISE-2MASS galaxy density field along withthe Planck Spectral Matching Independent Component Analysis
MNRAS 450, 288–294 (2015)
by guest on April 21, 2015
http://mnras.oxfordjournals.org/
Dow
nloaded from

290 I. Szapudi et al.
Figure 2. Gnomonic projections of the WISE-2MASS projected density map (left) and the Planck SMICA CMB map (right). Both maps were created atNside = 128 resolution. We applied a Gaussian smoothing of 10◦ (2◦) to the WISE-2MASS (Planck SMICA) map. White points indicate the centre of theimage, that is the centre of the CS as defined in Planck Collaboration XXIII (2014) results.
(SMICA) CMB map are shown in Fig. 2. We have found that themost prominent large-scale underdensity found in WISE-2MASS iswell aligned with the CS, although their sizes are different. Nextwe examine the radial statistics of this projected galaxy field, andapply photometric redshift techniques for a tomographic imagingof the region of interest. To avoid confusion, we will use the word‘significance’ to denote the significance of the detection of an un-derdensity, while ‘rarity’ will denote the probability (expressed inσ s) that the particular underdensity would appear in a cosmologicalrandom field.
3.1 Significance and rarity: 2D
We first study the CS region in projection, using the WISE-2MASSgalaxies only. We measure radial galaxy density profiles in ringsand discs centred on the CS in a bin size of 2.5◦, allowing identifi-cation of relatively small-scale structures. In Fig. 3, the dark shadedregion represents Poisson fluctuations in our measurement in rings,calculated from the total number of galaxies in a ring. Fig. 3 showsa significant depression of sources. The size of the underdensityis surprisingly large: it is detected up to ∼20◦ with high (�5σ )detection significance. In addition, the profile has ring-like over-density surrounding the CS region at large angular radii. This isconsistent with a supervoid surrounded by a gentle compensationthat converges to the average galaxy density at ∼50◦ (see e.g. Papaiet al. 2011). At our predetermined radii, 5◦ and 15◦, we have asignal-to-noise ratio S/N ∼ 12 for detecting the rings.
These results represent the detection significance of the under-density calculated from Poisson errors. To quantify the cosmic rarityof the structure, we estimated the error bars arise from cosmic vari-ance as well. Poisson fluctuations and cosmic variance errors arecompared in Fig. 3, corresponding to dark and light shaded regions.We created 10 000 Gaussian simulations of the projected galaxymap using the HEALPIX SYNFAST routine. As an input, we used a theo-retical angular power spectrum assuming flat �CDM cosmological
Figure 3. Radial galaxy density profile of the WISE-2MASS galaxy cata-logue, centred on the CS. The underdensity is detected out to tens of degreesin radius, consistent with an r ≈ 200 h−1 Mpc supervoid with δg � −0.2deepening in its centre. Note that the deeper central region is surrounded bya denser shell.
model, and the redshift distribution of the WISE-2MASS sources.With the full covariance information, we evaluated a χ2 statisticfor our radial density profile measurement compared to zero valuein each bin. We have found χ2 = 43.94 for 24 degrees-of-freedom(the number of radial bins), i.e. p = 0.007 or ∼3σ characterizingthe cosmic rarity of the supervoid in the (projected) concordance�CDM framework.
3.2 Significance: 3D
We use the WISE-2MASS-PS1 galaxy catalogue with photo-z infor-mation to constrain the position, size, and depth of supervoids. Wecount galaxies as a function of redshift in discs centred on the CS at
MNRAS 450, 288–294 (2015)
by guest on April 21, 2015
http://mnras.oxfordjournals.org/
Dow
nloaded from

PS1-WISE-2MASS void 291
Figure 4. Our measurements of the matter density in the line of sight using the �z = 0.07 photo-z bins we defined. We detected a significant depression in δm
in r = 5◦ and 15◦ test circles. We used our simple modelling tool to examine the effects of photo-z errors, and test the consistency of simple top-hat voids withour measurements. A data point by Granett et al (2010) accounts for the higher redshift part of the measurement. Dark blue (blue) stripes in error bars markthe contribution of Poisson (cosmic variance) fluctuations to the total error, while the additional part of the bars indicates the systematic effect of small surveycoverage. See text for details.
our fiducial angular radii, r = 5◦, and 15◦, and compare the resultsto the average redshift distribution of our sample. Since the latterdiscs are cut by the PS1 mask, we always use the available area,and compensate accordingly. We fit the observed redshift distribu-tion with a model dN/dz ∝ e−(z/z0)α zβ , estimating the parametersas z0 = 0.16, α = 3.1, and β = 1.9. The average redshift distributionwas obtained by counting all galaxies within our catalogue outsidethe 15◦ test circle, i.e. using 750 deg2, and errors of this measure-ment are propagated to our determination of the underdensity asfollows. Our photo-z bins were of width �z = 0.07, and we com-pared the galaxy counts inside the test circles to those of the controlarea. We added an extra bin from the measurement of Granett et al.(2010) centred at z = 0.4 in order to extend our analysis to higherredshifts in Fig. 4.
Assuming accurate knowledge of the average density, the detec-tion significance has Poisson statistics. However, given the fact thatour photo-z catalogue is less than a factor of 2 larger than the areaenclosed within the 15◦ radius, we include error corresponding tothe uncertainty of the average density due to Poisson and cosmicvariance, as well as systematic errors. We estimate each term usingsimulations and the data.
In order to create simulations of the density field, we first esti-mated the bias of the galaxy distribution. We modelled the angularpower spectrum of the WISE-2MASS galaxy density map usingthe PYTHON COSMOPY package,1 and performed a measurement usingSPICE (Szapudi, Prunet & Colombi 2001). We assumed concordanceflat �CDM cosmological model with a fiducial value for the ampli-
1 http://www.ifa.hawaii.edu/cosmopy/
Figure 5. Measurement of the angular power spectrum of the WISE-2MASS galaxies is presented along with the best-fitting theoretical modelfrom concordance �CDM cosmology, and a best-fitting model with biasbg = 1.41 ± 0.07. See text for details.
tude of fluctuations σ 8 = 0.8. Then we carried out a χ2-based max-imum likelihood parameter estimation, finding bg = 1.41 ± 0.07.The minimum value of χ2
min = 4.72 is an excellent fit for ν = 7degrees-of-freedom of our fitting procedure (8 bins in the angu-lar power spectrum shown in Fig. 5 and an amplitude parameter).This bias is comparable to earlier findings that measured the valueof bg for 2MASS selected galaxies (Rassat et al. 2007), despitethe additional uncertainty due to that of σ 8. Using the bias, we
MNRAS 450, 288–294 (2015)
by guest on April 21, 2015
http://mnras.oxfordjournals.org/
Dow
nloaded from

292 I. Szapudi et al.
generated Cgg galaxy angular power spectra with COSMOPY for thefive photo-z bins applying a sharp cut to the full redshift distribution.As before, we assumed the concordance flat �CDM cosmology. Wethen applied the same procedure as in Section 3.1 using SYNFAST forgenerating 1000 random HEALPIX simulations for each photo-z bin.
The cosmic variance affecting the average density from using asmall patch on the sky is characterized by estimating the varianceof differences in mean densities estimated in the PS1 area and infull sky. In addition, we estimated a systematic errors by comparingcosmic variance from simulations to the variance of the averagedensity of small patches measured in PS1 data. The extra variancecorresponds to systematic errors, and possibly to any (presumablysmall) inaccuracy of our concordance cosmology and bias models.The total error thus corresponds to the above three contributionsshown in Fig. 4. The procedure was repeated for each photo-z bins.We compared mean densities estimated in the part of the PS1 areaused for obtaining the average density, and those measured in R = 5◦
and 15◦ circles.Qualitatively, simulations at lower redshifts contain stronger fluc-
tuations on large scales, as the input power spectra contain higherpowers for low-�. This effect is reflected in the systematic and cos-mic variance error contributions we obtained, since the value ofthese corrections gradually decreases by ∼50 per cent from bin 1 tobin 5. See Fig. 4 for details.
Using the above determined error bars, we find S/N ∼ 5 and ∼6for the deepest underdensity bins for r = 5◦ and 15◦ characterizingour detection significance in 3D.
3.3 Top-hat supervoid model and rarity in 3D
To aid the interpretation of these results, we built toy models fromtop-hat voids in the z direction and modelled the smearing by thephoto-z errors. The initial top-hat with three parameters, redshift(zvoid), radius (Rvoid), and central depth (δm), was smoothed using thedistribution corresponding to the photometric redshift errors. Themodel redshift distribution was then multiplied with this smearedprofile.
The void model can be compared to observations using a χ2-based maximum likelihood parameter estimation. We focus on thelargest scale underdensity, therefore we only use the r = 15◦ data,and replace our last bin with the measurement of Granett et al.(2010). This gives n = 6 bins with k = 3 parameters, thus the de-grees of freedom are ν = n − k = 3. We find a χ2
15◦ = 7.74 for the nullhypothesis of no void. The best-fitting parameters with marginal-ized errors are zvoid = 0.22 ± 0.03, Rvoid = (220 ± 50) h−1 Mpc,and δm = −0.14 ± 0.04 with χ2
min = 3.55. Despite the simplic-ity of the toy model, the minimum chi-square indicates a goodfit, expecting χ2
min = ν ± √2ν. Nevertheless, more complexity is
revealed by these counts, as bins 2–3 of the r = 5◦ counts at red-shifts 0.10 ≤ z ≤ 0.15 evidence the deepening of the supervoidin the centre, or substructure. For accurate prediction of the effecton the CMB, the density field around the CS region, including anysubstructure needs to be mapped precisely. This is left for futurework, although we present a preliminary tomographic imaging ofthe region next. Nevertheless, using the above parameters and er-rors, we estimate that an underdensity is at least 3.3σ rare in a�CDM model with σ 8 � 0.8, integrating the power spectrum toobtain the variance at 220 h−1 Mpc and using Gaussian statistics forthe probability. To get a lower bound on the rarity of the void, weused the fit parameters within their 1σ range always in the sense toincrease the likelihood of the underdensity in �CDM; thus the voidwe detected appears to be fairly rare. Nevertheless, the top-hat is an
oversimplified toy model; thus the estimates based on it should betaken only as an initial attempt to interpret the detected supervoidin the concordance model framework.
3.4 Tomographic imaging
For three-dimensional impression of the galaxy distribution aroundthe CS, we created maps in three photo-z slices with a width ofz < 0.09, 0.11 < z < 0.14, and 0.17 < z < 0.22, and smoothed witha Gaussian at 2◦ scales. Then we overplot the Planck SMICA CMBmap as contours in Fig. 6. The deepest part of the void appears tobe close to the centre of the CS in the middle slice.
While photo-z errors do not allow a fine-grained interpretationof the results, we observe a complex structure of voids, possibly adeeper, smaller void nested in a larger, shallower supervoid, or thedeepening of a supervoid profile towards the middle. The foregroundoverdensity apparent in the first picture, especially the ‘filament’ onthe left-hand side running along the PS1 survey boundary furthercomplicates the picture. It is likely to be foreground, since it ismore significant in the shallowest slice, gradually fading out athigher z. These tomographic maps show a compensated surroundingoverdense shell around the supervoid at r � 15◦, which plausiblywould have fragmented into galaxy clusters visible in the projectedslices as several ‘hot spots’ surrounding the CS region. Note thatGurzadyan et al. (2014) use K-map statistics to Planck to show thatthe CS has a morphological structure similar to a void.
4 D I S C U S S I O N A N D C O N C L U S I O N S
Using our WISE-2MASS-PS1 data set, we detected a low-densityregion, or supervoid, centred on the CS region: at 5◦ and 15◦ radii ourdetection significances are 5σ and 6σ , respectively. We measuredthe galaxy density as a function of redshift at the two predeterminedradii. The galaxy underdensity is centred at z � 0.22 for 15◦, andeven deeper around z � 0.15 for 5◦. The counts are consistent witha supervoid of size Rvoid � 220 h−1 Mpc and average density δg �−0.2. It is noteworthy that this result is comparable to the local300 h−1 Mpc size underdensity claimed by Keenan et al. (2012)with δg � −0.3.
We estimated the true underdensity of the supervoid, by mod-elling the angular power spectrum of the WISE-2MASS galaxydensity map, finding bg = 1.41 ± 0.07. The resulting underdensityin the dark matter field, therefore, is δ = δg/bg � −0.14 ± 0.04assuming a linear bias relation. Given the uncertainties of our toymodel, we estimated that the supervoid we detected corresponds toa rare, at least 3.3σ , fluctuation in �CDM, although the 1σ rangeof our measurements is also consistent with a void very unlikelyin concordance models. This agrees very well with our estimatethat the underdensity found in the projected WISE-2MASS is a 3σ
fluctuation compared to simple Gaussian simulations. Let’s denotethe probability of finding a CS on the CMB with pCS, the probabil-ity of finding a void in LSS with pvoid, and finally the probabilityof them being in alignment by chance with pmatch. Let H1 be thehypothesis, that the two structures are random fluctuations, andtheir alignment is random, and H2 the hypothesis that the void isa random fluctuation causing the CS. The ratio of probabilities ispH2/pH1 = 1/(pCSpmatch). For instance, conservatively, if the align-ment is at the �2◦ level and the rarity of the CS is only �2σ , theratio still overwhelmingly favours H2. Thus chance alignment oftwo rare objects is not plausible, and a causal relation between theCS and the supervoid is more likely by a factor of at least �20 000.
MNRAS 450, 288–294 (2015)
by guest on April 21, 2015
http://mnras.oxfordjournals.org/
Dow
nloaded from

PS1-WISE-2MASS void 293
Figure 6. Tomographic view of the CS region in δm. The top panel appearsto show a foreground overdensity at the low redshift. A void is apparent at0.11 < z < 0.14 mostly inside the 5◦ central region of the CS. The largeunderdensity on the bottom panel at moderately higher redshifts may beslightly off centre with respect to the CS.
Using Rudnick et al. (2007), we estimate that the linear ISWeffect of this supervoid is of order −20 µK on the CMB. The effectmight be a factor or few higher if the size of the void is larger, if thecompensation is taken into account (Papai et al. 2011), and/or if non-linear and general relativistic effects are included (e.g. Inoue & Silk2006, 2007). Most recently, Finelli et al. (in preparation) attemptedto fit a non-linear LTB model (Garcia-Bellido & Haugbølle 2008)based on the projected profile in the WISE-2MASS catalogue, andfind an effect not much larger than our initial estimate.
Superstructures affect several cosmological observables, such asCMB power spectrum and two and three point correlation functions(Masina & Notari 2009a, 2010), CMB lensing (Das & Spergel 2009;Masina & Notari 2009b), 21 cm lensing (Kovetz & Kamionkowski2013), CMB polarization (Vielva et al. 2011), or cosmic radiodipole (Rubart, Bacon & Schwarz 2014), and even B-mode po-larization (BICEP2 Collaboration 2014). Furthermore, the otherCMB anomalies associated with large-angle correlations (Land &Magueijo 2005; Copi et al. 2006, 2013) should be revisited in lightof these findings.
Our results suggest the connection between the supervoid andthe CS, but further studies addressing the rarity of the observedsupervoid observationally would be needed to firmly establish it.This needs a larger photometric redshift data set that will reachbeyond 50◦ radius, such as PS1 with the second reprocessing thusimproved calibration, and Dark Energy Survey (The Dark EnergySurvey Collaboration 2005). As a first step, we smoothed the pro-jected WISE-2MASS map with a 25◦ Gaussian, finding only onevoid as significant as the one we discovered in the CS region. Thissecond void, to be followed up in future research and located near theconstellation Draco, is clearly visible in the shallow 2MASS mapsof Rassat, Starck & Dupe (2013), Francis & Peacock (2010) asa large underdensity, and in the corresponding reconstructed ISWmap of Rassat & Starck (2013) as a cold imprint. Therefore theDraco supervoid is likely to be closer thus smaller in physical size.More accurate photometric redshifts, possibly with novel methodssuch as that of Menard et al. (2013), will help us to constrain furtherthe morphology and the size of the supervoids, and a deeper dataset would constrain their extent redshift space. Any tension with�CDM, e.g. in the possible rarity of the observed supervoids, couldbe addressed in models of modified gravity, ordinarily screened inclusters, but resulting in an enhanced growth rate of voids as wellas an additional contribution to the ISW signal.
AC K N OW L E D G E M E N T S
IS acknowledges NASA grants NNX12AF83G andNNX10AD53G. AK and ZF acknowledge support from OTKAthrough grant no. 101666, and AK acknowledges support from theCampus Hungary fellowship programme, and the Severo Ochoafellowship programme. BRG acknowledges support from the Euro-pean Research Council Darklight ERC Advanced Research Grant(# 291521). We used HEALPIX (Gorski et al. 2005). The PS1 Surveyshave been made possible through contributions by the Institute forAstronomy, the University of Hawaii, the Pan-STARRS ProjectOffice, the Max-Planck Society and its participating institutes,the Max Planck Institute for Astronomy, Heidelberg and the MaxPlanck Institute for Extraterrestrial Physics, Garching, the JohnsHopkins University, Durham University, the University of Edin-burgh, the Queen’s University Belfast, the Harvard–SmithsonianCenter for Astrophysics, the Las Cumbres Observatory GlobalTelescope Network Incorporated, the National Central Univer-sity of Taiwan, the Space Telescope Science Institute, and the
MNRAS 450, 288–294 (2015)
by guest on April 21, 2015
http://mnras.oxfordjournals.org/
Dow
nloaded from

294 I. Szapudi et al.
National Aeronautics and Space Administration under Grant No.NNX08AR22G issued through the Planetary Science Divisionof the NASA Science Mission Directorate, the National ScienceFoundation Grant No. AST-1238877, the University of Maryland,and the Eotvos Lorand University (ELTE).
R E F E R E N C E S
Bennett C. L. et al., 2013, ApJS, 208, 20BICEP2 Collaboration, 2014, Phys. Rev. Lett., 112, 241101Bremer M. N., Silk J., Davies L. J. M., Lehnert M. D., 2010, MNRAS, 404,
L69Cai Y.-C., Neyrinck M. C., Szapudi I., Cole S., Frenk C. S., 2014, ApJ, 786,
110Copi C. J., Huterer D., Schwarz D. J., Starkman G. D., 2006, MNRAS, 367,
79Copi C. J., Huterer D., Schwarz D. J., Starkman G. D., 2013, preprint
(arXiv:e-prints)Cruz M., Martınez-Gonzalez E., Vielva P., Cayon L., 2005, MNRAS, 356,
29Cruz M., Martınez-Gonzalez E., Vielva P., Diego J. M., Hobson M., Turok
N., 2008, MNRAS, 390, 913Das S., Spergel D. N., 2009, Phys. Rev. D, 79, 043007Driver S. P. et al., 2011, MNRAS, 413, 971Francis C. L., Peacock J. A., 2010, MNRAS, 406, 14Garcia-Bellido J., Haugbølle T., 2008, J Cosmol. Astropart. Phys., 4, 3Gorski K. M., Hivon E., Banday A. J., Wandelt B. D., Hansen F. K., Reinecke
M., Bartelmann M., 2005, ApJ, 622, 759Granett B. R., Neyrinck M. C., Szapudi I., 2008, ApJ, 683, L99Granett B. R., Neyrinck M. C., Szapudi I., 2009, ApJ, 701, 414Granett B. R., Szapudi I., Neyrinck M. C., 2010, ApJ, 714, 825Gurzadyan V. G., Kashin A. L., Khachatryan H., Poghosian E., Sargsyan S.,
Yegorian G., 2014, A&A, 566, A135Hambly N. C. et al., 2001, MNRAS, 326, 1279Inoue K. T., Silk J., 2006, ApJ, 648, 23Inoue K. T., Silk J., 2007, ApJ, 664, 650Inoue K. T., Sakai N., Tomita K., 2010, ApJ, 724, 12Jarrett T. H., Chester T., Cutri R., Schneider S., Skrutskie M., Huchra J. P.,
2000, AJ, 119, 2498Kaiser N., 2004, Proc. SPIE Conf. Ser., SPIE, Bellingham
Keenan R. C., Barger A. J., Cowie L. L., Wang W.-H., Wold I., Trouille L.,2012, ApJ, 754, 131
Kovacs A., Szapudi I., 2015, MNRAS, 448, 1305Kovacs A., Szapudi I., Granett B. R., Frei Z., 2013, MNRAS, 431, L28Kovetz E. D., Kamionkowski M., 2013, Phys. Rev. Lett., 110, 171301Kron R. G., 1980, ApJS, 43, 305Land K., Magueijo J., 2005, Phys. Rev. Lett., 95, 071301Masina I., Notari A., 2009a, J Cosmol. Astropart. Phys., 2, 19Masina I., Notari A., 2009b, J Cosmol. Astropart. Phys., 7, 35Masina I., Notari A., 2010, J Cosmol. Astropart. Phys., 9, 28Menard B. et al., 2013, preprint (arXiv:e-prints)Papai P., Szapudi I., 2010, ApJ, 725, 2078Papai P., Szapudi I., Granett B. R., 2011, ApJ, 732, 27Pedregosa F. et al., 2011, J. Mach. Learn. Res., 12, 2825Planck Collaboration XXIII, 2014, A&A, 571, A23Planck Collaboration XXIV, 2014, A&A, 571, A24Rassat A., Starck J.-L., 2013, A&A, 557, L1Rassat A., Land K., Lahav O., Abdalla F. B., 2007, MNRAS, 377, 1085Rassat A., Starck J.-L., Dupe F.-X., 2013, A&A, 557, A32Rees M. J., Sciama D. W., 1968, Nature, 217, 511Rubart M., Bacon D., Schwarz D. J., 2014, A&A, 565, A111Rudnick L., Brown S., Williams L. R., 2007, ApJ, 671, 40Sachs R. K., Wolfe A. M., 1967, ApJ, 147, L73Schlegel D. J., Finkbeiner D. P., Davis M., 1998, ApJ, 500, 525Skrutskie M. F. et al., 2006, AJ, 131, 1163Smith K. M., Huterer D., 2010, MNRAS, 403, 2Szapudi I., Prunet S., Colombi S., 2001, ApJ, 561, L11The Dark Energy Survey Collaboration 2005, preprint (arXiv:e-prints)Vielva P., 2010, Adv. Astron., 2010, 592094Vielva P., Martınez-Gonzalez E., Barreiro R. B., Sanz J. L., Cayon L., 2004,
ApJ, 609, 22Vielva P., Martı Nez -Gonzalez E., Cruz M., Barreiro R. B., Tucci M., 2011,
MNRAS, 410, 33Wright E. L. et al., 2010, AJ, 140, 1868Yan L. et al., 2013, AJ, 145, 55Zhang R., Huterer D., 2010, Astropart. Phys., 33, 69
This paper has been typeset from a TEX/LATEX file prepared by the author.
MNRAS 450, 288–294 (2015)
by guest on April 21, 2015
http://mnras.oxfordjournals.org/
Dow
nloaded from