detection, characterization, and inhibition of fgfr...
TRANSCRIPT

Biology of Human Tumors
Detection, Characterization, and Inhibition ofFGFR–TACC Fusions in IDH Wild-type GliomaAnna Luisa Di Stefano1,2,3, Alessandra Fucci4, Veronique Frattini4, Marianne Labussiere1,KarimaMokhtari1,5,6, Pietro Zoppoli4,Yannick Marie1,7, Aurelie Bruno1, Blandine Boisselier1,Marine Giry1, Julien Savatovsky8, Mehdi Touat9, Hayat Belaid10, Aurelie Kamoun11,Ahmed Idbaih1,2, Caroline Houillier2, Feng R. Luo12, Jean-Charles Soria9,Josep Tabernero13, Marica Eoli14, Rosina Paterra14, Stephen Yip15, Kevin Petrecca16,Jennifer A. Chan17, Gaetano Finocchiaro14, Anna Lasorella4,18, Marc Sanson1,2,6, andAntonio Iavarone4,19
Abstract
Purpose: Oncogenic fusions consisting of fibroblast growthfactor receptor (FGFR) and TACC are present in a subgroup ofglioblastoma (GBM) and other human cancers and have beenproposed as new therapeutic targets. We analyzed frequency andmolecular features of FGFR–TACC fusions and explored thetherapeutic efficacy of inhibiting FGFR kinase in GBM and gradeII and III glioma.
Experimental Design: Overall, 795 gliomas (584 GBM, 85grades II and III with wild-type and 126 with IDH1/2 mutation)were screened for FGFR–TACC breakpoints and associatedmolec-ular profile.We also analyzed expressionof the FGFR3andTACC3components of the fusions. The effects of the specific FGFRinhibitor JNJ-42756493 for FGFR3–TACC3–positive gliomaweredetermined in preclinical experiments. Two patients withadvanced FGFR3–TACC3–positive GBM received JNJ-42756493and were assessed for therapeutic response.
Results: Three of 85 IDH1/2 wild-type (3.5%) but none of126 IDH1/2-mutant grade II and III gliomas harbored FGFR3–
TACC3 fusions. FGFR–TACC rearrangements were present in 17of 584 GBM (2.9%). FGFR3–TACC3 fusions were associatedwith strong and homogeneous FGFR3 immunostaining. Theyare mutually exclusive with IDH1/2 mutations and EGFRamplification, whereas they co-occur with CDK4 amplification.JNJ-42756493 inhibited growth of glioma cells harboringFGFR3–TACC3 in vitro and in vivo. The two patients withFGFR3–TACC3 rearrangements who received JNJ-42756493manifested clinical improvement with stable disease and minorresponse, respectively.
Conclusions: RT-PCR sequencing is a sensitive and specificmethod to identify FGFR–TACC–positive patients. FGFR3–TACC3 fusions are associated with uniform intratumor expres-sion of the fusion protein. The clinical response observed in theFGFR3–TACC3–positive patients treated with an FGFR inhibitorsupports clinical studies of FGFR inhibition in FGFR–TACC–positive patients. Clin Cancer Res; 21(14); 3307–17. �2015 AACR.
See related commentary by Ahluwalia and Rich, p. 3105
IntroductionThe history of successful targeted therapy of cancer largely
coincides with the inactivation of recurrent, oncogenic, andaddicting gene fusions in hematologic malignancies and recently
in some types of epithelial cancer (1, 2). Glioblastoma multi-forme (GBM) is among the most lethal forms of human cancer,and targeted therapies against common genetic alterationsin GBM have not changed the dismal outcome of the disease
1Sorbonne Universit�es UPMC Univ Paris 06, INSERM CNRS, U1127, UMR7225, ICM, Paris, France. 2AP-HP, Groupe Hospitalier Piti�e-Salpetri�ere,Service de Neurologie 2, Paris, France. 3Department of Brain andBehavioralSciences,UniversityofPavia,Pavia, Italy. 4Institute forCancerGenetics, Columbia University Medical Center, New York, New York.5AP-HP, Groupe Hospitalier Piti�e Salpetri�ere, Laboratoire de Neuro-pathologie R Escourolle, Paris, France. 6AP-HP Onconeuroth�eque,Groupe Hospitalier Piti�e-Salpetri�ere, Paris, France. 7Institut du Cerveauet de laMoelle �epini�ere (ICM), Plateforme deG�enotypage S�equencage,Paris, France. 8Fondation Ophtalmologique A. de Rothschild, Paris,France. 9Drug Development Department, Gustave Roussy Cancer Cen-ter, Paris, France. 10AP-HP, Groupe Hospitalier Piti�e Salpetri�ere, Depart-ment of Neurosurgery, Paris, France. 11ProgrammeCartes d'Identit�e desTumeurs (CIT), Ligue Nationale Contre Le Cancer, Paris, France. 12Jans-senPharmaceuticalCompaniesofJohnsonandJohnson,Titusville,NewJersey. 13Vall d'HebronUniversity Hospital andVall d'Hebron Institute ofOncology (VHIO), Universitat Aut�onoma de Barcelona, Barcelona,Spain. 14Fondazione I.R.C.C.S Istituto Neurologico C. Besta, Milan, Italy.15Department of Pathology and Laboratory Medicine, University ofBritish Columbia,Vancouver, Canada. 16Montreal Neurological InstituteandHospital,McGillUniversity,Montreal,Canada.17UniversityofCalgary,
Calgary, Canada. 18Department of Pediatrics and Pathology, ColumbiaUniversity Medical Center, New York, New York. 19Department of Neu-rology and Pathology, Columbia University Medical Center, New York,New York.
Note: Supplementary data for this article are available at Clinical CancerResearch Online (http://clincancerres.aacrjournals.org/).
A.L. Di Stefano and A. Fucci contributed equally to this article.
Corresponding Authors: Marc Sanson, Groupe Hospitalier Piti�e-Salpetri�ere, 47Boulevard de l'Hopital, Cedex 13, 75651 Paris, France. Phone: 33-142 160573; Fax:33-142-160375; E-mail: [email protected]; and Antonio Iavarone, Insti-tute for Cancer Genetics, Columbia University Medical Center, 1130 St. NicholasAvenue, 10032 New York. Phone: 1 212 851 5245; Fax: 1 212 851 5267; E-mail:[email protected]
doi: 10.1158/1078-0432.CCR-14-2199
�2015 American Association for Cancer Research.
ClinicalCancerResearch
www.aacrjournals.org 3307
Research. on September 15, 2018. © 2015 American Association for Cancerclincancerres.aacrjournals.org Downloaded from
Published OnlineFirst January 21, 2015; DOI: 10.1158/1078-0432.CCR-14-2199

(3, 4). Underlying biologic features, including infiltrative growthbehavior, intratumoral heterogeneity, and adaptive resistancemechanisms, coupled with the unique challenges of intracraniallocation present significant problems in its effectivemanagement.Despite surgery and chemoradiotherapy, most patients rapidlyrecur andno effective treatment options are available at that stage.Besides GBM, which features the highest grade of malignancyamong glioma (grade IV), lower grade gliomas, which includegrades II and III, are a heterogeneous group of tumors in whichspecific molecular features are associated with divergent clinicaloutcome. Themajority of grade II and III glioma (but only a smallsubgroup of GBM) harbor mutations in IDH genes (IDH1 orIDH2), which confer a more favorable clinical outcome. Con-versely, the absence of IDHmutations is associated with the worstprognosis (5).
We have recently identified FGFR–TACC gene fusions (mostlyFGFR3–TACC3 and rarely FGFR1–TACC1) as the first example ofhighly oncogenic and recurrent gene fusions in GBM. The FGFR–TACC fusions that have been identified so far include the tyrosinekinase (TK) domain of FGFR and the coiled-coil domain of TACCproteins, both necessary for the oncogenic function of FGFR–TACC fusions. We also tested tumor dependency on FGFR–TACCfusions in preclinical mouse models of FGFR–TACC glioma andobserved marked antitumor effects by FGFR inhibition (6). Afterour report, FGFR3–TACC3 fusions have been identified in pedi-atric and adult glioma, bladder carcinoma, squamous lung car-cinoma, and head and neck carcinoma, thus establishing FGFR–TACC fusions as one of the chromosomal translocation mostfrequently found across multiple types of human cancers (6–15).
From a mechanistic standpoint, we discovered the unexpectedcapacity of FGFR–TACC fusions to trigger aberrant chromosomesegregation during mitosis, thus initiating chromosome instabil-ity (CIN) and aneuploidy, 2 hallmarks of cancer.However, we stillhave an incomplete understanding of the full repertoire of thestructural variants of FGFR–TACC fusions occurring in GBM and
lower grade glioma. Furthermore, it remains unknown whetherFGFR–TACC fusions mark distinct grades of glioma and GBMsubtypes.
To date, 8 variants of the FGFR3–TACC3 fusion have beenreported that mostly differ for the breakpoint in the TACC3 gene(6–15). Because of the close proximity of FGFR3 and TACC3 (the2 genes map at a distance of 70 Kb on chromosome 4p16.3),detection of FGFR3–TACC3 rearrangements by FISH is not afeasible option with the currently available methods. Here, wereport a screening method for FGFR–TACC fusions that include aRT-PCR assay designed to identify the known and novel FGFR3–TACC3 fusion transcripts, followed by confirmation of the in-frame breakpoint by Sanger sequencing. Using this assay, we haveanalyzed a dataset of 584 GBM and 211 grade II and III gliomas.
A crucial question with fundamental clinical relevance for anynovel candidate target mutation is the frequency of the alterationin the cancer cell population, thus discriminating between aclonal or subclonal origin of the mutation. In fact, GBM ischaracterized by a formidable degree of subclonal heterogeneity,whereby neighboring cells display amplification and expressionof different receptor tyrosine kinase (RTK)-coding genes (16–19).This notion poses major therapeutic challenges for targeting anyindividual RTK will result, at best, in the eradication of a limitedtumor subclone. In this study, we determine that brain tumorsharboring FGFR–TACC fusions manifest strong and homoge-neous intratumor expression of the FGFR3 and TACC3 compo-nent invariably included in the fusion protein, when analyzed byimmunostaining. We also report a significant clinical benefitfollowing treatment with a specific inhibitor of FGFR-TK in 2patients with GBMwho harbored FGFR3–TACC3 rearrangement.
Materials and MethodsPatients and tissue samples
This study includes a cohort of 746 untreated patients withhistologic diagnosis of glioma from 5 institutions. Forty-ninerecurrent gliomas fromPiti�e-Salpetri�ereHospital and one recurrentglioma from the University of Calgary (Calgary, Canada) were alsoincluded. A summary of the patient cohort is provided in Table 1.
Tumor specimens, blood samples, and clinicopathologic infor-mationwere collected with informed consent and relevant ethicalboard approval in accordancewith the tenets of theDeclaration ofHelsinki. For the samples from the Piti�e-Salpetri�ere Hospital,clinical data and follow-up are available in the neuro-oncologydatabase (Onconeurotek, GH Piti�e-Salpetri�ere, Paris).
Two recurrent patients with GBM harboring FGFR3–TACC3were enrolled in the dose escalation part of JNJ-42756493 trial(NCT01962532) at the Gustave Roussy Institute (Paris, France).
Identification of fusion transcripts and analysis of genomicbreakpoints
Total RNA was extracted from frozen tissues using TRIzol(Invitrogen) according tomanufacturer instructions. Two to threehundred nanograms of total RNA was retrotranscribed with theMaxima First Strand cDNA Synthesis Kit (Thermo Scientific) orSuperScript II (Invitrogen). RT-PCR was performed using Accu-Prime Taq DNA Polymerase (Invitrogen). Primer pairs used forthe FGFR3–TACC3 fusions screening were: FGFR3ex12-FW: 50-CGTGAAGATGCTGAAAGACGATG-3 and TACC3ex14-RV: 50-AAACGCTTGAAGAGGTCGGAG; amplification conditions were94�C-3 minutes (94�C-30 seconds/61�C-30 seconds/68�C-1
Translational Relevance
This article reports an unbiased screening assay for FGFR–TACC fusions in glioma that overcomes the great variability ofvariants that are generated by FGFR–TACC chromosomaltranslocation in human cancer. FGFR–TACC fusions occur ingrade II and III glioma harboring wild-type IDH1 with fre-quency similar to glioblastoma (GBM), therefore providing aclue to the aggressive clinical behavior of this glioma subtype.The molecular characterization of fusion-positive gliomarevealed that FGFR–TACC is mutually exclusive with EGFRamplification but co-occurs with CDK4 amplification. FGFR–TACC –positive glioma displays strikingly uniform and strongexpression of the fusion protein at the single-cell level. Pre-clinical experiments with FGFR3–TACC3–positive gliomacells treated with the fibroblast growth factor receptor (FGFR)inhibitor JNJ-42756493 showed strong antitumor effects, andtreatment of two patients with recurrent GBM harboringFGFR3–TACC3 resulted in clinical improvement and radio-logic tumor reduction. These findings validate the treatmentwith FGFR inhibitors of patientswith gliomaharboring FGFR–TACC chromosomal translocations.
Di Stefano et al.
Clin Cancer Res; 21(14) July 15, 2015 Clinical Cancer Research3308
Research. on September 15, 2018. © 2015 American Association for Cancerclincancerres.aacrjournals.org Downloaded from
Published OnlineFirst January 21, 2015; DOI: 10.1158/1078-0432.CCR-14-2199

minute 40 seconds) for 35 cycles, 68�C-7 minutes. FGFR1–TACC1 fusions were amplified with FGFR1ex16-FW: 50-TGCC-TGTGGAGGAACTTTTCA-30 and TACC1ex13-RV: 50-CCCAAACT-CAGCAGCCTAAG-30 primers (94�C-30 seconds/60�C-30 sec-onds/68�C-1 minute 40 seconds for 35 cycles). PCR productswere subjected to Sanger sequencing.
FGFR3–TACC3 genomic breakpoints were analyzed in 6FGFR3–TACC3–positive samples, 5 of which from the Piti�e-Sal-petri�ere Hospital and 1 from Montreal Neurological Institute(Montreal, Canada). Three additional samples (MB-22, TCGA27-1835, and TCGA 06-6390) available from our previous study(6) were also included in the analysis. Fifty nanograms of gDNAwas used in the PCR reaction, performed with AccuprimeTaq Polymerase (Invitrogen) and PCR products were Sangersequenced.Primers used in genomicPCRweredesignedaccordingto the breakpoint sequence in the mRNA; the list of primers usedare: FGFR3ex17-FW50-TGGACCGTGTCCTTACCGT-30 (PCR sam-ples 3048, 4373, 4867, 4451, MB-22, OPK-14, 06-6390, 27-1835and sequencing sample 3048, 4373, 4867, 4451, MB-22, OPK14,06-6390, 27-1835); FGFR3ex16-FW 50-GGTCCTTTGGGGTCC-TGCT-30 (PCR and sequencing sample 3808); TACC3ex6-RV50-CCTCTTTCAGCTCCAAGGCA-30 (PCR and sequencing sam-ples PCR 4451 and OPK-14); TACC3ex8-RV 50-TCTACCAG-GACTGTCCCTCAG-30 (sequencing samples 3048 and 4373);TACC3ex9-RV 50-GGGAGTCTCATTTGCACCGT-30 (PCR samples3048,4373,4867 and sequencing sample 4867); TACC3ex10-RV50-CTGCATCCAGGTCCTTCTGG-30 (PCR and sequencing sam-ples MB-22 and 06-6390); TACC3ex11-RV 50-CCAGTTCCAG-GTTCTTCCCG-30 (sequencing samples 27-1837 and 3808); TAC-C3ex12-RV 50-CAACCTCTTCGAACCTGTCCA-30 (PCR andsequencing samples 27-1837 and 3808). PCR conditions were94�C-30 seconds/60�C-30 seconds/68�C-2minute 30 seconds for40 cycles. For amplifications performed with the primer TAC-C3ex9-RV, the program was 94�C-30 seconds/56�C-30 seconds/68�C-2 minute 30 seconds) for 40 cycles.
Quantitation of FGFR3 and TACC3 transcripts in GBMThe relative expression of FGFR3 and TACC3 regions included
in or excluded from the fusion transcript was assessed by qRT-PCR. Primer pairs with comparable efficiency of amplification
were identified, and efficiency was assessed using serial dilutionsof cDNA (20) prepared fromOAW28ovarian carcinoma cells thatcontain wild-type FGFR3 and TACC3 (21). Primers used are: N-terminal region of FGFR3, FGFR3-N: Forward 50-AAGACGATGC-CACTGACAAG-30, Reverse 50-CCCAGCAGGTTGATGATGTTTT-TG-30; C-terminal region of TACC3, TACC3-C: Forward 50-TCCTTCTCCGACCTCTTCAAGC-30, Reverse 50-TAATCCTCCA-CGCACTTCTTCAG-30. To amplify transcripts in regions excludedfrom FGFR3–TACC3 fusion, primers were designed in theC-terminal region of FGFR3, FGFR3-C: Forward 50-TACCTG-GACCTGTCGGCG-30, Reverse 50-TGGGCAAACACGGAGTCG-30 and N-terminal domain of TACC3, TACC3-N: Forward 50-CCACAGACGCACAGGATTCTAAGTC-30, Reverse 50-TGAGTTT-TCCAGTCCAAGGGTG-30. All reactions were performed in trip-licate and the data are reported as fold change � SD.
Immunofluorescence and immunohistochemistryFor immunofluorescent (IF) staining of FGFR3, 5-mmformalin-
fixed, paraffin-embedded (FFPE) sections were subjected to anti-gen retrieval with citrate buffer for 8 minutes. Primary antibodieswere: FGFR3-N (1:400, sc-13121, Santa Cruz Biotechnology),FGFR3-C (1:2000, sc-123, Santa Cruz Biotechnology), TACC3-N (1:600, ab134153, Abcam), and TACC3-C (1:300, NBP1-01032, Novus Biological). Secondary biotinylated antibodieswere used at 1:50,000 followed by streptavidin and TSA Cy3-conjugated. Nuclei were counterstained with 40,6-diamidino-2-phenylindole (DAPI). For immunohistochemical (IHC) analysisof FGFR3 expression, antigen retrieval was performed for 12minutes and FGFR-3 antibody (sc-13121, Santa Cruz Biotechnol-ogy) was diluted 1:500. Biotinylated anti-mouse antibody(1:30,000) and streptavidin were added before incubation withthe chromogen. Nuclei were counterstained with hematoxylin.
Molecular characterization of tumor samplesMutational status of IDH1, IDH2,TERTpromoter, aswell as the
methylation status of the MGMT promoter was analyzed in thePiti�e-Salpetri�ere cohort. Expression of IDH1-R132H mutant wasanalyzed by IHC in 500 cases as previously described (22). IDH1and IDH2 genemutationswere identified by Sanger sequencing in464 and 388 gliomas, respectively (5). IDH wild-type tumors are
Table 1. Frequency of FGFR3–TACC3 fusions in GBM and grade II–III glioma
Tumor sample source Cases (GBM), n Detected fusions, n
ImmunostainingFGFR3 positive/sampleanalyzed
Piti�e-Salpetri�ere Hospital 380 9 9/9Besta Neurological Institute 85 5 2/2University of Calgary 60 þ 1Ra 2 þ 1Ra 1/1 þ1/1Ra
Montreal Neurological Institute 51 1 —
University of British Columbia 8 0 —
Total 584 (100%)b 17 (2.9%)
Tumor sample source IDH status Cases (grades II–III), n Detected fusions, n
ImmunostainingFGFR3 positive/sampleanalyzed
Piti�e-Salpetri�ere Hospital IDH wt 85c (100%) 3 (3.5%) 3/3IDH1/IDH2 Mut 126 (100%) 0 (0%) 0
NOTE: Distribution of the FGFR3–TACC3 fusions in GBM (top) and lower grade glioma (bottom) samples stratified according to the institution of origin. The tablereports number of cases analyzed, number of tumors harboring FGFR3–TACC3 fusion transcripts, and results of FGFR3 immunostaining. Lower gradeglioma samplesare further classified according to IDH status (IDH1 and IDH2). The respective frequency of FGFR3–TACC3 in GBM, glioma grades II–III IDH wild type (wt), and IDHmutant (Mut) glioma is reported in parentheses.aR, recurrent GBM.bRecurrent GBM from the University of Calgary Dataset is not included in the total count of GBM.cTwenty-five cases of 85 are unknown for IDH2 status.
FGFR–TACC Identification and Inhibition in Glioma Patients
www.aacrjournals.org Clin Cancer Res; 21(14) July 15, 2015 3309
Research. on September 15, 2018. © 2015 American Association for Cancerclincancerres.aacrjournals.org Downloaded from
Published OnlineFirst January 21, 2015; DOI: 10.1158/1078-0432.CCR-14-2199
defined according to the absence of IDH1-R132H immunoposi-tivity and/or mutations in IDH1 and IDH2 genes. TERT promoterstatuswas determinedby the same technique in277 samples (23).Hypermethylation of the MGMT promoter was tested in 242samples by bisulfite pyrosequencing (24). The presence of EGFR-vIII was evaluated by RT-PCR in 118 samples using EGFR-FW 50-CTTCGGGGAGCAGCGATGCGAC-30 and EGFR-RV 50CTGTCC-ATCCAGAGG AGGAGTA-30 primers (25).
Copy number variations analyses have been performed on 192tissue samples using CGH arrays using BAC arrays (n ¼ 187),Agilent 4 � 180 K (n ¼ 2), Nimblegen 3 � 720 K (n ¼ 2), andAgilent 8 � 60 K (n ¼ 1). Results were normalized using controlDNA from matched blood samples as previously described (26).Additional analyses of 193 tumor specimens were performed bySNP array, using Illumina Omni (n ¼ 110), Illumina HumCore(n¼ 32), Illumina 370 K (n¼ 27), or Illumina 610 K (n¼ 24), aspreviously described (27). Array processing was outsourced toIntegragen. Raw copy numbers were estimated at each of the SNPand copy number markers. Biodiscovery property SNP-FASST2algorithmwas then used to segment copy number data. Segmentswere mapped to hg18 genome assembly (28). Copy numberalterations magnitudes called log-R ratio (LRR) were classifiedusing simple thresholds: deletion (x��1), loss (�1 < x��0.2),gain (0.2 � x <1), or amplification (x � 1) according to defaultNexus 7.5 software. For additional 56 gliomas, 10q loss wasassessed on tumor and blood DNA by microsatellite analysis,whereas amplification of EGFR,MDM2, and CDK4, and deletionof CDKN2A gene, were determined by qPCR, as previouslyreported (29, 30).
The molecular profiles obtained in Piti�e-Salpetri�ere datasetwere combined with those available in The Cancer Genome Atlas(TCGA) data portal. TCGA GBM segmented copy number vari-ation profile was downloaded from The UCSC Cancer GenomicsBrowser (31). Copy number variations (CNV) were measuredexperimentally using the Affymetrix Genome-Wide Human SNPArray 6.0 platform at the Broad TCGA genome characterizationcenter (32). Raw copy numbers were estimated at each of the SNPand copynumbermarkers. Circular binary segmentationwas thenused to segment the copy number data (28). Segments aremapped to hg18 genome assembly at Broad.
For CNV analysis of the regions across FGFR3 and TACC3 genes,we considered samples for which RNAseq and CNV data wereavailable or samples for which only CNV data were available andRT-PCR sequencing of FGFR3–TACC3 fusion hadbeen performed.Overall, 158 GBM (all with a wild-type IDH1 gene) satisfied thesecriteria. Among them,5harboredanFGFR3–TACC3 fusion,where-as 153 were FGFR—TACC–negative. The CNV magnitudes, calledLRR, were classified using the following thresholds: deletion(x <�1), loss (�1� x��0.2), gain (0.2� x� 1), or amplification(x > 1), according to the Atlas-TCGA (32). The analysis of thegenomic regions encompassing EGFR, MDM2, CDK4, CDKN2A,7p, 10q, according to hg18 genome assembly, was performed toevaluate their CNV. EGFRvIIImutation status was inferred accord-ing to Brennan and colleagues (32). The frequencies of the aberra-tions of these genes in FGFR3–TACC3–positive and -negativesamples were calculated and the obtained data were then com-bined with the Piti�e-Salpetri�ere Hospital dataset.
Statistical analysisDifferences in the distribution on categorical variables were
analyzed using the Fisher exact test. The P values were adjusted for
multiple testing according to Benjamini and Hochberg falsediscovery rate (FDR). A q value � 0.05 (2-sided) was consideredto be statistically significant.
Overall survival (OS) was defined as the time between thediagnosis and death or last follow-up. Patients who were stillalive at the last follow-up were considered as censored eventsin the analysis. Progression-free survival (PFS) was defined asthe time between the diagnosis and recurrence or last follow-up. Patients who were recurrence-free at the last follow-upwere considered as censored events in the analysis. Survivalcurves were calculated by the Kaplan–Meier method anddifferences between curves assessed using the log-rank test.A log-rank test P � 0.05 (2-sided) was considered to bestatistically significant.
Cell culture and cell growth assayGIC-1123 gliomaspheres were cultured in neurobasal medium
(Invitrogen) supplemented with B27, N2 (Invitrogen), EGF, andFGF2 (20 ng/mL, PeproTech). Mouse astrocytes Ink4A-Arf�/�
were cultured in DMEM supplemented with 10% FBS. Cells wereseeded at 1,000 cells per well in a 96-well plate and treated withJNJ-42756493 (Active Biochem, #A-1278). After 72 hours, cellviability was assessed using the MTT assay. Data are mean� SEMof 6 replicates. Experiments were performed 3 times.
Subcutaneous xenografts and drug treatmentGIC-1123 cells (5� 105) were injected subcutaneously in the
flank of athymic nude (nu/nu) mice (Charles River Laborato-ries). Mice carrying about 200 mm3 subcutaneous tumors wererandomized to receive 12 mg/kg JNJ-42756493 (Active Bio-chem, #A-1278) or dimethyl sulfoxide (DMSO) in 1% Tween80 by oral gavage. Tumor diameters were measured with caliperand tumor volumes estimated using the formula: 0.5 � length� width2. Data are mean � SD of 9 mice in each group. Micewere sacrificed when tumors in the control group reached themaximal size allowed by the IACUC Committee at ColumbiaUniversity (New York, NY).
MRI imaging and evaluation of clinical response to JNJ-42756493
Baseline and follow-up imaging assessments were performedon 1.5-Tesla MR imaging systems, including at least axial T1-weighted images before gadolinium injection, Axial or 3DFLAIR (fluid-attenuated inversion recovery), dynamic suscep-tibility contrast MR perfusion (0.1 mmol/kg of gadobutrol),axial and 3D T1-weighted images after gadolinium injection.Tumor response was assessed according to the RANO criteria(33). Contrast-enhancing lesion volume was assessed with thehelp of a semiautomated volumetry tool (SegmentiX), basedon shape detection and thresholding, with control and manualcorrection of edges when necessary. Because exclusion of cysticor necrotic portions of the lesion may be affected by operatorsubjectivity, we included them both for volumetric and axialmeasurements.
DSC (dynamic susceptibility contrast) perfusion datasets wereprocessedwith vendor's software suite (Neuroperfusion, Philips),including coregistration and rCBV (relative cerebral blood vol-ume) parametric maps generation with 3 different algorithms(Gamma-variate fitting, Arterial Input Function–based deconvo-lution and Model Free).
Di Stefano et al.
Clin Cancer Res; 21(14) July 15, 2015 Clinical Cancer Research3310
Research. on September 15, 2018. © 2015 American Association for Cancerclincancerres.aacrjournals.org Downloaded from
Published OnlineFirst January 21, 2015; DOI: 10.1158/1078-0432.CCR-14-2199
ResultsDetection of FGFR1–TACC1 and FGFR3–TACC3 fusions inGBMand grade II–III glioma
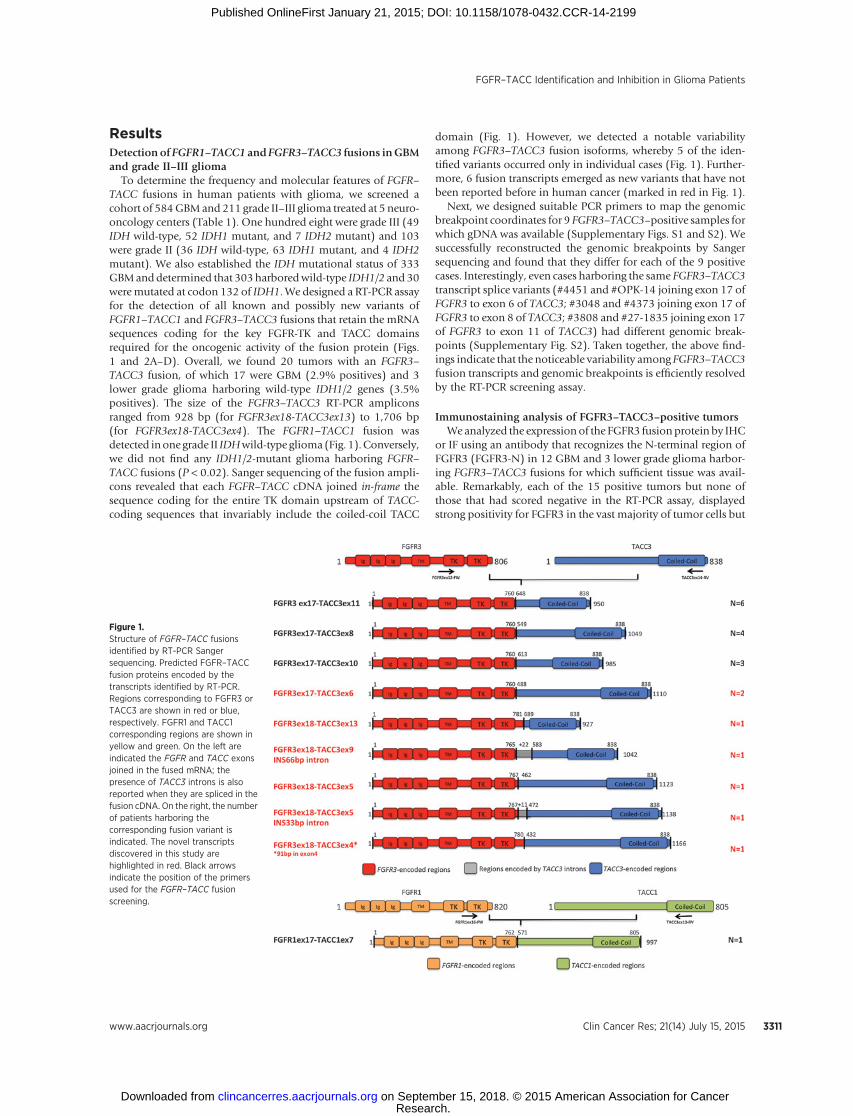
To determine the frequency and molecular features of FGFR–TACC fusions in human patients with glioma, we screened acohort of 584GBMand 211 grade II–III glioma treated at 5 neuro-oncology centers (Table 1). One hundred eight were grade III (49IDH wild-type, 52 IDH1 mutant, and 7 IDH2 mutant) and 103were grade II (36 IDH wild-type, 63 IDH1 mutant, and 4 IDH2mutant). We also established the IDH mutational status of 333GBManddetermined that 303harboredwild-type IDH1/2 and 30weremutated at codon 132 of IDH1. We designed a RT-PCR assayfor the detection of all known and possibly new variants ofFGFR1–TACC1 and FGFR3–TACC3 fusions that retain the mRNAsequences coding for the key FGFR-TK and TACC domainsrequired for the oncogenic activity of the fusion protein (Figs.1 and 2A–D). Overall, we found 20 tumors with an FGFR3–TACC3 fusion, of which 17 were GBM (2.9% positives) and 3lower grade glioma harboring wild-type IDH1/2 genes (3.5%positives). The size of the FGFR3–TACC3 RT-PCR ampliconsranged from 928 bp (for FGFR3ex18-TACC3ex13) to 1,706 bp(for FGFR3ex18-TACC3ex4). The FGFR1–TACC1 fusion wasdetected inone grade II IDHwild-type glioma (Fig. 1).Conversely,we did not find any IDH1/2-mutant glioma harboring FGFR–TACC fusions (P < 0.02). Sanger sequencing of the fusion ampli-cons revealed that each FGFR–TACC cDNA joined in-frame thesequence coding for the entire TK domain upstream of TACC-coding sequences that invariably include the coiled-coil TACC
domain (Fig. 1). However, we detected a notable variabilityamong FGFR3–TACC3 fusion isoforms, whereby 5 of the iden-tified variants occurred only in individual cases (Fig. 1). Further-more, 6 fusion transcripts emerged as new variants that have notbeen reported before in human cancer (marked in red in Fig. 1).
Next, we designed suitable PCR primers to map the genomicbreakpoint coordinates for 9 FGFR3–TACC3–positive samples forwhich gDNA was available (Supplementary Figs. S1 and S2). Wesuccessfully reconstructed the genomic breakpoints by Sangersequencing and found that they differ for each of the 9 positivecases. Interestingly, even cases harboring the same FGFR3–TACC3transcript splice variants (#4451 and #OPK-14 joining exon 17 ofFGFR3 to exon 6 of TACC3; #3048 and #4373 joining exon 17 ofFGFR3 to exon 8 of TACC3; #3808 and #27-1835 joining exon 17of FGFR3 to exon 11 of TACC3) had different genomic break-points (Supplementary Fig. S2). Taken together, the above find-ings indicate that the noticeable variability among FGFR3–TACC3fusion transcripts and genomic breakpoints is efficiently resolvedby the RT-PCR screening assay.
Immunostaining analysis of FGFR3–TACC3–positive tumorsWeanalyzed the expression of the FGFR3 fusionprotein by IHC
or IF using an antibody that recognizes the N-terminal region ofFGFR3 (FGFR3-N) in 12 GBM and 3 lower grade glioma harbor-ing FGFR3–TACC3 fusions for which sufficient tissue was avail-able. Remarkably, each of the 15 positive tumors but none ofthose that had scored negative in the RT-PCR assay, displayedstrong positivity for FGFR3 in the vast majority of tumor cells but
Figure 1.Structure of FGFR–TACC fusionsidentified by RT-PCR Sangersequencing. Predicted FGFR–TACCfusion proteins encoded by thetranscripts identified by RT-PCR.Regions corresponding to FGFR3 orTACC3 are shown in red or blue,respectively. FGFR1 and TACC1corresponding regions are shown inyellow and green. On the left areindicated the FGFR and TACC exonsjoined in the fused mRNA; thepresence of TACC3 introns is alsoreported when they are spliced in thefusion cDNA. On the right, the numberof patients harboring thecorresponding fusion variant isindicated. The novel transcriptsdiscovered in this study arehighlighted in red. Black arrowsindicate the position of the primersused for the FGFR–TACC fusionscreening.
FGFR–TACC Identification and Inhibition in Glioma Patients
www.aacrjournals.org Clin Cancer Res; 21(14) July 15, 2015 3311
Research. on September 15, 2018. © 2015 American Association for Cancerclincancerres.aacrjournals.org Downloaded from
Published OnlineFirst January 21, 2015; DOI: 10.1158/1078-0432.CCR-14-2199

not endothelial cells throughout the analyzed tumor section (Fig.2A–H). Notably, IF using an antibody that recognizes an epitopeat the C-terminus of TACC3, which is invariably retained withinFGFR3–TACC3 variants (TACC3-C), reproduced the stainingpattern of the FGFR3-N antibody in FGFR3–TACC3–positivetumors. Conversely, negative or very weak staining was obtainedin FGFR3–TACC3–positive tumors with antibodies recognizingthe regions of FGFR3 (FGFR3 C-terminal region, FGFR3-C) andTACC3 (TACC3 N-terminal region, TACC3-N) constantly exclud-ed from FGFR3–TACC3 fusion proteins (Supplementary Fig.S3A). Consistently, quantitative RT-PCR of GBM harboringFGFR3–TACC3 fusions showed that the expression of the N-terminal coding region of FGFR3 and the C-terminal codingregion of TACC3 (which are included in the fusion genes) ismarkedly higher than the expression of the C-terminal codingregion of FGFR3 and the N-terminal coding region of TACC3,which are excluded from the fusion transcripts (SupplementaryFig. S3B). We also analyzed one recurrent GBM from a patient
whose tumor had been found positive for FGFR3–TACC3 at theinitial diagnosis and who had recurred after concurrent radio-therapy and temozolomide treatment. The recurrent tumorretained the same FGFR3–TACC3 fusion gene and protein thatwas present in the untreated GBM as determined by RT-PCRsequencing and FGFR3 IF, respectively (Supplementary Fig.S4). Although this requires additional evaluation, the retaineduniform positivity for FGFR3 in this recurrent GBM suggests thattargeting the FGFR3–TACC3 fusion protein at relapse is a validtherapeutic strategy.
Clinical and molecular characteristics of glioma patients withFGFR3–TACC3 fusions
Clinical and molecular profiling data were available for 591patients, including 380GBM (9with FGFR3–TACC3 fusions) andall 211 lower grade glioma (3 with FGFR3–TACC3 fusions). Ofthese 12 patients, 5 are males and 7 females, aged 48 to 82 years(median ¼ 61 years). We sought to determine the molecular
Figure 2.Identification and immunostaining ofFGFR3–TACC3–positive tumors.Results from RT-PCR screening inrepresentative samples from the Piti�e-Salpetri�ere Hospital (A and C) and theBesta (B and D) datasets. M, DNAladder. Schematic representation ofthe FGFR3–TACC3 fusion transcriptsidentified in samples GBM-4620 (C)and GBM-021 (D). The junctionsequences on the mRNA and thereading frame at the breakpoint arereported. Representativemicrophotographs of hematoxylinand eosin (H&E) and FGFR3immunostaining in the FGFR3–TACC3–positive samples GBM-4620(E) and GBM-021 (F) and 2 FGFR3–TACC3–negative samples (GandH). a,H&E, 10� magnification; b, H&E,40� magnification; c, FGFR3,10� magnification; d, FGFR3,40� magnification.
Di Stefano et al.
Clin Cancer Res; 21(14) July 15, 2015 Clinical Cancer Research3312
Research. on September 15, 2018. © 2015 American Association for Cancerclincancerres.aacrjournals.org Downloaded from
Published OnlineFirst January 21, 2015; DOI: 10.1158/1078-0432.CCR-14-2199

profile of FGFR3–TACC3–positive glioma. Todo so,we combinedthe analysis of CNVs and somatic mutations of key GBM genes inour dataset with the SNP6.0 high-density genomic array analysisof 158 TCGA-derived GBM samples fully annotated for FGFR3–TACC3 fusion genes (the RNA-seq and/or RT-PCR analysis ofthese samples had revealed that 5 of them harbor FGFR3–TACC3fusions; ref. 6). Patients with FGFR3–TACC3 fusions displayedunique characteristics (Table 2). FGFR3–TACC3 fusions weremutually exclusive with EGFR amplification (0 of 16 vs. 166 of411; P¼ 0.0004, FDR q value corrected for multiple comparisons¼ 0.0012) and showed a clear trend against the presence of theEGFRvIII transcript variant (0 of 16 vs. 37 of 219; P ¼ 0.083).Conversely, CDK4 amplification was significantly more frequentin FGFR3–TACC3–positive tumors (7 of 16 vs. 41 of 408, P ¼0.0008; FDR q value ¼ 0.0024). A less significant association ofFGFR3–TACC3 fusions was also seen with amplification ofMDM2, which as CDK4, maps to chromosome 12q (4 of 16 vs.24 of 408, P ¼ 0.016; FDR q ¼ 0.048). We found no statisticalassociationbetween FGFR3–TACC3 fusions andother genetic andepigenetic alterations that commonly occur in gliomas harboringwild-type IDH genes (CDKN2A deletion, TERT promoter muta-tions, gain of chromosome 7p, loss of chromosome 10q, andmethylation of the MGMT promoter; Table 2). When comparedwith the IDH wild-type patient population of grade II and IIIglioma and GBM, there was no significant difference in PFS or OSbetween patients positive or negative for FGFR3–TACC3 (Sup-plementary Fig. S5A and S5B).
Finally, we sought to establish whether the CNV analysis of theFGFR3 andTACC3 genomic loci couldbeused topredict positivityfor FGFR3–TACC3 fusions. The analysis of high-density SNP6.0arrays of the 158 GBM samples from TCGA revealed that 10samples displayed different degrees of copy number gains encom-passing the entireFGFR3 andTACC3 loci (Supplementary Fig. S6).However, none of them harbored FGFR3–TACC3 fusions. Con-versely, the 5 FGFR3–TACC3–positive samples in the datasetharbor microamplification events involving only the exons of theFGFR3 gene that are included in the fusion breakpoint. Thisfinding suggests that any CNV survey that is less accurate thanhigh-density SNP arrays could fail to identify the genomic marksassociated with true FGFR3–TACC3–positive cases.
Preclinical and clinical relevance of targeting FGFR3–TACC3fusions
JNJ-42756493 is a potent, oral pan-FGFR tyrosine kinaseinhibitor with IC50 values in the low nanomolar range for allmembers of the FGFR family. It has demonstrated potent anti-
tumor activities in nonclinical models with FGFR aberrations,including squamous non–small cell lung cancer, gastric cancer,breast cancer, hepatocellular cancer, endometrial, and bladdercancers (34, 35). To ask whether JNJ-42756493 is effective intargeting specifically FGFR–TACC–positive cells, we treated withJNJ-42756493 mouse astrocytes expressing FGFR3–TACC3,FGFR3–TACC3 containing a mutation that inactivates the kinaseactivity of FGFR3 (FGFR3–TACC3-KD) or the empty vector. Wealso studied the effect of JNJ-42756493 on human glioma stemcells GIC-1123 that harbor the FGFR3–TACC3 gene fusion (6).These experiments revealed that both mouse astrocytes and GIC-1123 that express FGFR3–TACC3 but not cells expressing theKDmutant fusion or the empty vector are highly sensitive to FGFRinhibition by JNJ-42756493 with an IC50 of 3.03 and 1.55 nmol/L, respectively (Fig. 3A and B). Next, we tested whether oraltreatment with JNJ-42756493 of mice-bearing xenografts ofhuman GIC-1123 affects tumor growth. Mice were randomizedto receive vehicle or JNJ-42756493 (12 mg/kg). Mirroring the invitro results, JNJ-42756493 elicited a potent growth inhibition ofGIC-1123 tumor xenografts (Fig. 3C and D) with a statisticallysignificant tumor regression after 2 weeks (P value of the slopecalculated from the treatment starting point ¼ 0.04). The abovefindings provide a strong foundation for the treatment of patientswith GBM harboring FGFR–TACC rearrangements with JNJ-42756493.
Two patients with recurrent GBM harboring FGFR3–TACC3fusions were treated with JNJ-42756493 in a first-in-man phase Itrial. Patient 1, male aged 52 years, underwent partial surgicalresection of a right parietal GBM, followed by fractionated radio-therapy and concomitant temozolomide as first-line treatment(36). The RT-PCR sequencing analysis of the GBM specimenrevealed positivity for the FGFR3–TACC3 fusion (FGFR3-exon17-TACC3-exon 6, sample 4451, Supplementary Figs. S1 andS2) and the immunostaining using FGFR3 antibody on paraffin-embedded sections showed strong positivity in a large fraction oftumor cells (not shown). After 5 cycles of temozolomide, thepatient presented with dizziness and headache and brain MRIrevealed tumor progression (Fig. 4A). At this time, the patient wasenrolled in the JNJ-42756493 trial and received JNJ-42756493(12mg/d administered in cycles of 7 days followed by 7 days off-treatment). After 3 weeks, the patient reported a marked clinicalimprovement (complete regression of dizziness and headache).On MRI, the sum of product diameters (RANO criteria, Fig. 4B)and volumetry (Fig. 4C) measured without excluding cystic andnecrotic components showed disease stabilization. However, thetumor mass underwent significant decrease of the enhancing
Table 2. Molecular alterations in IDH wild-type glioma harboring FGFR3–TACC3 fusions
FGFR3–TACC3positive, n
% of FGFR3–TACC3positive
FGFR3–TACC3negative, n
% of FGFR3–TACC3negative
P (Fishertest) q (FDR)
EGFR amplification 0/16 0.0% 166/411 40.4% 4.E�04 0.0012CDK4 amplification 7/16 43.7% 41/408 10.0% 8.E�04 0.0024MDM2 amplification 4/16 25.0% 24/408 5.9% 0.016 0.048EGFRvIII 0/16 0.0% 37/219 16.9% 0.083 0.25CDKN2A deletion 4/16 25.0% 188/411 45.7% 0.13 0.39Chr. 7p gain 12/15 80.0% 242/374 64.7% 0.28 0.84Chr. 10q deletion 12/16 75.0% 253/420 60.2% 0.3 0.9TERT promoter mutation 9/11 81.8% 128/163 78.5% 0.8 1MGMT promoter hypermethylation 6/12 50.0% 73/160 45.6% 0.7 1
NOTE: The table reports the absolute number and frequency (percentage) of individual glioma-specific molecular alterations in tumors scoring positive or negativefor FGFR3–TACC3 fusions. The analysis is done on the Union dataset (TCGA and "Piti�e-Salpetri�ere Hospital" datasets, see Materials and Methods for details).Statistically significant associations are indicated in bold (Fisher exact test, q values adjusted with FDR).
FGFR–TACC Identification and Inhibition in Glioma Patients
www.aacrjournals.org Clin Cancer Res; 21(14) July 15, 2015 3313
Research. on September 15, 2018. © 2015 American Association for Cancerclincancerres.aacrjournals.org Downloaded from
Published OnlineFirst January 21, 2015; DOI: 10.1158/1078-0432.CCR-14-2199

parenchyma (�44%) with formation of a cystic portion in thecentral core (33). The objective responsewas further corroboratedby the marked reduction of the extent of tumor vascularityestimatedbyquantitative analysis of rCBV (relative cerebral bloodvolume) from dynamic susceptibility MR perfusion maps (37)(Fig. 4D). Stabilization lasted for 115 days. During JNJ-42756493treatment, mild and manageable toxicity was observed (grade Ihyperphosphatemia, asthenia, dysgueusia, dry mouth, keratitis,and grade II nail changes). After 4 months, tumor progressed onMRI locally both on T1 contrast-enhanced area and T2/FLAIRhypersignal. The patient was reoperated and subsequently treatedwith CCNU. He is still alive, but in progression after 21 monthsfrom diagnosis and 287 days from the start of the anti-FGFRtherapy.
Patient 2 is a 64-year-old woman, affected by left parietal GBM,diagnosed by stereotactic biopsy. The tumor was positive forFGFR3–TACC3 gene fusion by RT-PCR sequencing and showeddiffuse FGFR3 expression in most tumor cells (Fig. 2A, C and E,sample 4620). The patient received as first-line treatment fraction-ated radiotherapy and temozolomide according to the Stuppprotocol (36), but after 2 cycles of monthly temozolomide, shepresented with clinical deterioration including progressive head-aches, right homonymoushemianopsia, andmemory impairment.Brain MRI performed 3 and 4 months after the completion ofconcomitant chemoradiotherapy revealed tumor progression with
increase of the left parietal mass and the appearance of a smallcontralateral lesion (Fig. 4E). The patient was thus enrolled in theJNJ-42756493 trial (12 mg/d administered in cycles of 7 daysfollowed by 7 days off-treatment) and showed clinical improve-ment after 4weeks (regression of headaches, visual field defect, andmemory impairment). Best responsewasobservedafter 104daysoftreatment with a 22% reduction of tumor size according to theRANO criteria (Fig. 4F) and 28% according to volumetry (Fig. 4G).Grade I hyperphosphatemia, nail changes, and mucositis wereobserved. Clinical status remained stable until disease progressionoccurring 134 days after the start of the anti-FGFR therapy. Thepatient is still alive and is receiving a third-line chemotherapy withnitrosoureas and bevacizumab.
DiscussionFGFR–TACC fusions are potent oncogenic events that when
present in brain tumor cells confer sensitivity to FGFR inhibitors(6). Since our original identification of recurrent FGFR–TACCfusions in GBM, small subgroups of patients harboring FGFR–TACC translocations have been identified in several other tumortypes (7–15). Here, we report an unbiased RT-PCR-sequencinganalysis for the identification of all possible functional FGFR–TACC fusion transcripts. The screening of a large glioma datasetfrom multiple institutions not only confirmed that FGFR–TACC
Figure 3.Preclinical evaluation of FGFR3–TACC3 inhibition by JNJ-42756493. A,mouse astrocytes expressing FGFR3–TACC3 (F3T3), FGFR3–TACC3-KD(F3T3-KD), or the empty vector(Vector) were treated with theindicated concentration of JNJ-42756493. Cell viability wasdetermined by the MTT assay. Errorbars show mean � SEM (n ¼ 6). B,survival analysis of GIC-1123 treatedwith JNJ-42756493. C, the FGFR-TKinhibitor JNJ-42756493 suppressestumor growth of subcutaneous tumorsgenerated by GIC-1123. After tumorestablishment (arrow), mice weretreated with vehicle or JNJ-42756493(12 mg/kg) for 14 days. Values aremean tumor volumes� SD (n¼ 9miceper group). P value of the slopecalculated from the treatment startingpoint (arrow) is 0.04. D, photographshowing tumors dissected fromvehicle or JNJ-42756493–treatedmice after 2 weeks of treatment.
Di Stefano et al.
Clin Cancer Res; 21(14) July 15, 2015 Clinical Cancer Research3314
Research. on September 15, 2018. © 2015 American Association for Cancerclincancerres.aacrjournals.org Downloaded from
Published OnlineFirst January 21, 2015; DOI: 10.1158/1078-0432.CCR-14-2199

rearrangements occur in about 3% of human GBM but alsorevealed that FGFR–TACC fusions are present in the subgroupof IDH wild-type lower grade glioma (grades II–III) with preva-lence similar to that ofGBM. IDHwild-type grade II and III gliomahave a significantly worse clinical outcome than the IDH-mutantglioma and manifests molecular and clinical features that resem-ble GBM (5). Our finding that FGFR–TACC fusions occur in IDHwild-type but not in IDH-mutant glioma provides an importantclue for the molecular characterization of this glioma subtype.Furthermore, the clustering of such potent oncogenic events inIDH wild-type glioma underscores the particularly aggressivenature of this group of glioma. While we showed that FGFR–TACC fusions cluster within the poor clinical outcome subgroupof IDHwild-type glioma, these translocations donot seem to carryprognostic value within the IDH wild-type subgroup of patientswith glioma. However, the sample size of patients harboringFGFR–TACC fusions is too small to draw definitive conclusionswith respect to the impact on survival, and larger studies will benecessary to clarify the prognostic role of FGFR–TACC fusions inIDH wild-type glioma.
Besides mutual exclusivity between IDH1 mutations andFGFR–TACC fusions, our results showed that patients withFGFR3–TACC3 rearrangements lack EGFR amplification andEGFRvIII but are significantly enriched for amplification of CDK4(and MDM2 to a lesser extent). Knowledge of these molecularcharacteristics will help select those patients who most likelyharbor FGFR–TACC rearrangements and design combinatorialtargeted therapies that might be more effective in the FGFR–TACC–positive glioma subgroup.
The molecular screen uncovered 6 new FGFR3–TACC3 fusionevents. Together with the previously identified variants, othersand we have reported 12 distinct isoforms of FGFR3–TACC3,thus revealing a remarkable variability of FGFR3–TACC3 tran-scripts in human cancer (see Supplementary Table S1 summa-rizing the structure of all the FGFR–TACC variants identified todate). The structural heterogeneity of FGFR3–TACC3 fusions isyet more pronounced at the genomic level, whereby each fusionevent harbors distinct genomic breakpoints, even for identicalfusion transcripts. This finding underscores the notion thattargeted genomic analyses are unlikely to be suitableapproaches for the molecular diagnosis of FGFR3–TACC3 pos-itivity. Conversely, the unbiased identification of FGFR3–TACC3–positive tumors with the RT-PCR sequencing assayreported here overcomes the limitations of screening only forpreviously identified FGFR3–TACC3 fusions and provides asimple molecular diagnostic assay.
Rather than displaying uniform amplifications of the FGFR3and TACC3 genomic loci, FGFR3–TACC3–positive samples har-bor small, intragenic microamplification events typically encom-passing only the exons of the FGFR3 and TACC3 genes included inthe breakpoint (6). This finding is consistent with the notion thata "fusion breakpoint principle" sustains the CNVs of driver genefusions such as FGFR3–TACC3 in which local CNVs target exclu-sively the breakpoint region (38). We note that such small andirregular CNVs may easily go undetected from CNV analysesperformed using platforms less-sensitive than the high-densitySNP6.0 genomic arrays. Furthermore, the notion that FGFR3–TACC3-negative GBMmay harbor uniform amplifications across
Figure 4.Baseline and posttreatment MRI of patients treated with JNJ-42756493. Patient 1 (A–D). A, post-gadolinium T1-weighted images show the target lesion on the rightparietal lobe. The interval (days) from the beginning of follow-up is indicated above each MRI. B, analysis of sum of product diameters (SPD) before andduring the anti-FGFR treatment (RANO criteria). C, analysis of tumor volume (cm3) before and during the anti-FGFR treatment. During anti-FGFR treatment, astabilization of the tumor was observed according to RANO criteria and volumetry. D, perfusion images at baseline and after 20 days of anti-FGFR treatment.rCBV post-gadolinium T1-weighted images with color overlay of rCBV are shown. Patient 2 (E–G). E, two different MRI slice levels of superior and middlepart of the lesion are presented. F, analysis of SPD before and during the anti-FGFR treatment. During the anti-FGFR treatment, a reduction of 22% of tumor sizewas observed. G, volumetric evaluation showed a 28% tumor reduction. Vertical red arrow indicates the start of anti-FGFR treatment (baseline).
FGFR–TACC Identification and Inhibition in Glioma Patients
www.aacrjournals.org Clin Cancer Res; 21(14) July 15, 2015 3315
Research. on September 15, 2018. © 2015 American Association for Cancerclincancerres.aacrjournals.org Downloaded from
Published OnlineFirst January 21, 2015; DOI: 10.1158/1078-0432.CCR-14-2199

the FGFR3 and TACC3 loci argues against the standard analysis ofFGFR3 and/or TACC3 CNVs as a method for the selection ofFGFR3–TACC3–positive tumors.
There is a growing body of evidence supporting the notion thatGBM is a markedly heterogeneous tumor. The formidable degreeof intratumor heterogeneity of GBM is a potential cause of failureof targeted therapies in these tumors. In particular, the intratumorheterogeneity of GBM has previously been recognized in light ofthe mosaic expression of the RTK genes EGFR, PDGFRA, andMETby neighboring cells (16–19). Thus, in the majority of GBM,amplification or overexpression of individual RTK genes arepresent in a subclonal fraction of tumor cells and co-exist withamplification/expression of other RTK-coding genes within thetumormass. Therefore, it was essential to determinewhether suchheterogeneity was also present in gliomas harboring FGFR–TACCtranslocations. The immunostaining of FGFR3–TACC3–positivetumors revealed that positive specimens manifest strong anduniform expression of the fusion protein, which is also retainedafter recurrence. This behavior is reminiscent of other driverchromosome translocations (BCR-ABL, EML4-ALK) and is com-patible with the glioma-initiating functions of FGFR–TACCfusions (6). It is also the scenario expected for a driver oncogenewhose activity remains essential for tumor maintenance regard-less of secondary genetic alterations that occur during tumorprogression.
The strong antitumor effects obtained with JNJ-42756493 inglioma cells harboring FGFR3–TACC3 fusions have built acompelling rationale for the treatment of patients with gliomapositive for FGFR–TACC rearrangements. JNJ-42756493 is anoral ATP-competitive pan-FGFR selective inhibitor that inhibitstyrosine phosphorylation of activated FGFR at nanomolarconcentrations (34, 35). The enrollment of 2 patients withrecurrent FGFR3–TACC3–positive GBM in a phase I trial withJNJ-42756493 showed that this treatment has tolerable toxicityand clear antitumor activity, thus validating FGFR–TACC as atherapeutic target. Therefore, targeted inhibition of FGFR-TK inpreselected IDH wild-type FGFR–TACC–positive glioma mayprovide clinical benefits for patients with recurrent glioma whocurrently lack valuable therapeutic options. In conclusion, wehave shown the importance and feasibility of prospectivegenotyping for FGFR–TACC fusions in patients with gliomaand provided a preliminary evidence of clinical response thatwarrants the investigation of the sensitivity of gliomas harbor-ing FGFR–TACC rearrangements to FGFR kinase inhibition inclinical trials.
Disclosure of Potential Conflicts of InterestJ. Savatovsky reports receiving speakers bureau honoraria from Bayer and
Philips Healthcare. J.-C. Soria and J. Tabernero are consultant/advisory boardmembers for Johnson & Johnson. No potential conflicts of interest weredisclosed by the other authors.
Authors' ContributionsConception and design:A.L. Di Stefano,M. Labussiere, A. Lasorella,M. Sanson,A. IavaroneDevelopment of methodology: A. Fucci, J.-C. Soria, A. LasorellaAcquisition of data (provided animals, acquired and managed patients,provided facilities, etc.): A.L. Di Stefano, A. Fucci, V. Frattini, M. Labussiere,K. Mokhtari, Y. Marie, A. Bruno, B. Boisselier, M. Giry, J. Savatovsky, M. Touat,H. Belaid, A. Idbaih, C. Houillier, F.R. Luo, J. Tabernero, S. Yip, K. Petrecca,J.A. Chan, G. Finocchiaro, A. Lasorella, M. Sanson, M. EoliAnalysis and interpretation of data (e.g., statistical analysis, biostatistics,computational analysis): A.L. Di Stefano, A. Fucci, V. Frattini, M. Labussiere,P. Zoppoli, B. Boisselier, J. Savatovsky, A. Kamoun, J.-C. Soria, A. Lasorella,M. Sanson, A. IavaroneWriting, review, and/or revision of the manuscript: A.L. Di Stefano, A. Fucci,P. Zoppoli, M. Touat, F.R. Luo, J.-C. Soria, J. Tabernero, G. Finocchiaro,A. Lasorella, M. Sanson, A. IavaroneAdministrative, technical, or material support (i.e., reporting or organizingdata, constructing databases): A.L. Di Stefano, M. Labussiere, M. Giry,R. Paterra, A. LasorellaStudy supervision: A. Lasorella, M. Sanson, A. IavaroneOther (histologic diagnosis and immunochemical analysis of the tumoralsamples): K. Mokhtari
Grant SupportThis work was supported by National Cancer Institute grants R01CA101644
and R01CA131126 (to A. Lasorella) and R01CA178546 (to A. Iavarone),National Institute of Neurological Disorders and Stroke R01NS061776 (toA. Iavarone), and a grant from The Chemotherapy Foundation (to A. Iavarone),the French national program Cartes d'Identit�e des Tumeurs (CIT) (http://cit.ligue-cancer.net/; to M. Sanson), the Association pour la Recherche sur lesTumeurs c�er�ebrales (ARTC; to M. Sanson). The research leading to these resultsreceived funding from the program "Investissements d'avenir" ANR-10-IAIHU-06. A. Fucci is supported by a fellowship from the Italian Ministry of Welfare/Provincia di Benevento. V. Frattini is supported by a fellowship from theAmerican Brain Tumor Association (ABTA). A.L. Di Stefano was supported bythe Fondation ICM and PRIN 2010–2011, 2010ZESJWN_008. S. Yip is sup-ported by the mentored scientist award from the Vancouver Coastal HealthResearch Institute (VCHRI). Banking and distribution of brain tumor samplesfrom UBC is made possible by generous financial support of BrainCare BC.
The costs of publication of this articlewere defrayed inpart by the payment ofpage charges. This article must therefore be hereby marked advertisement inaccordance with 18 U.S.C. Section 1734 solely to indicate this fact.
Received August 22, 2014; revised December 16, 2014; accepted January 4,2015; published OnlineFirst January 21, 2015.
References1. Medves S, Demoulin JB. Tyrosine kinase gene fusions in cancer: translating
mechanisms into targeted therapies. J Cell Mol Med 2012;16:237–48.2. Mitelman F, Johansson B,Mertens F. The impact of translocations and gene
fusions on cancer causation. Nat Rev Cancer 2007;7:233–45.3. Weathers SP, Gilbert MR. Advances in treating glioblastoma. F1000Prime
Rep 2014;6:46.4. Omuro A, DeAngelis LM. Glioblastoma and other malignant gliomas: a
clinical review. JAMA 2013;310:1842–50.5. Sanson M, Marie Y, Paris S, Idbaih A, Laffaire J, Ducray F, et al. Isocitrate
dehydrogenase 1 codon 132 mutation is an important prognostic bio-marker in gliomas. J Clin Oncol 2009;27:4150–4.
6. Singh D, Chan JM, Zoppoli P, Niola F, Sullivan R, Castano A, et al.Transforming fusions of FGFR and TACC genes in human glioblastoma.Science 2012;337:1231–5.
7. Cancer Genome Atlas Research N. Comprehensive molecular characteri-zation of urothelial bladder carcinoma. Nature 2014;507:315–22.
8. Majewski IJ, Mittempergher L, Davidson NM, Bosma A, Willems SM,Horlings HM, et al. Identification of recurrent FGFR3 fusion genes inlung cancer through kinome-centred RNA sequencing. J Pathol 2013;230:270–6.
9. Parker BC, Annala MJ, Cogdell DE, Granberg KJ, Sun Y, Ji P, et al. Thetumorigenic FGFR3-TACC3 gene fusion escapes miR-99a regulation inglioblastoma. J Clin Invest 2013;123:855–65.
10. Wang R, Wang L, Li Y, HuH, Shen L, Shen X, et al. FGFR1/3 tyrosine kinasefusions define a unique molecular subtype of non-small cell lung cancer.Clin Cancer Res 2014;20:4107–14.
11. Williams SV, Hurst CD, Knowles MA. Oncogenic FGFR3 gene fusions inbladder cancer. Hum Mol Genet 2013;22:795–803.
Clin Cancer Res; 21(14) July 15, 2015 Clinical Cancer Research3316
Di Stefano et al.
Research. on September 15, 2018. © 2015 American Association for Cancerclincancerres.aacrjournals.org Downloaded from
Published OnlineFirst January 21, 2015; DOI: 10.1158/1078-0432.CCR-14-2199

12. Wu YM, Su F, Kalyana-Sundaram S, Khazanov N, Ateeq B, Cao X, et al.Identification of targetable FGFR gene fusions in diverse cancers. CancerDiscov 2013;3:636–47.
13. Zhang J, Wu G,Miller CP, Tatevossian RG, Dalton JD, Tang B, et al. Whole-genome sequencing identifies genetic alterations in pediatric low-gradegliomas. Nat Genet 2013;45:602–12.
14. Capelletti M, Dodge ME, Ercan D, Hammerman PS, Park SI, Kim J, et al.Identification of recurrent FGFR3-TACC3 fusion oncogenes from lungadenocarcinoma. Clin Cancer Res 2014;20:6551–8.
15. Stransky N, Cerami E, Schalm S, Kim JL, Lengauer C. The landscape ofkinase fusions in cancer. Nat Commun 2014;5:4846.
16. Inda MM, Bonavia R, Mukasa A, Narita Y, Sah DW, Vandenberg S, et al.Tumor heterogeneity is an active process maintained by a mutant EGFR-induced cytokine circuit in glioblastoma. Genes Dev 2010;24:1731–45.
17. SnuderlM, Fazlollahi L, Le LP,NittaM, Zhelyazkova BH,DavidsonCJ, et al.Mosaic amplification of multiple receptor tyrosine kinase genes in glio-blastoma. Cancer Cell 2011;20:810–7.
18. Ene CI, Fine HA. Many tumors in one: a daunting therapeutic prospect.Cancer Cell 2011;20:695–7.
19. Sottoriva A, Spiteri I, Piccirillo SG, Touloumis A, Collins VP, Marioni JC,et al. Intratumor heterogeneity in human glioblastoma reflects cancerevolutionary dynamics. Proc Natl Acad Sci U S A 2013;110:4009–14.
20. Kindich R, Florl AR, Jung V, Engers R, Muller M, Schulz WA, et al.Application of a modified real-time PCR technique for relative gene copynumber quantification to the determination of the relationship betweenNKX3.1 loss andMYCgain in prostate cancer. ClinChem2005;51:649–52.
21. Bulusu KC, Tym JE, Coker EA, Schierz AC, Al-Lazikani B. canSAR: updatedcancer research and drug discovery knowledgebase. Nucleic Acids Res2014;42:D1040–7.
22. Reyes-Botero G, Giry M, Mokhtari K, Labussiere M, Idbaih A, Delattre JY,et al. Molecular analysis of diffuse intrinsic brainstem gliomas in adults.J Neurooncol 2014;116:405–11.
23. Labussi�ere M, Boisselier B, Mokhtari K, Di Stefano AL, Rahimian A,Rossetto M, et al. Combined analysis of TERT, EGFR and IDH status definedistinct prognostic glioblastoma classes. Neurology 2014;83:1200–6.
24. Quillien V, Lavenu A, Karayan-Tapon L, Carpentier C, Labussiere M,Lesimple T, et al. Comparative assessment of 5 methods (methylation-specific polymerase chain reaction, MethyLight, pyrosequencing, methyl-ation-sensitive high-resolution melting, and immunohistochemistry) toanalyze O6-methylguanine-DNA-methyltranferase in a series of 100 glio-blastoma patients. Cancer 2012;118:4201–11.
25. Idbaih A, Aimard J, Boisselier B,Marie Y, Paris S, Criniere E, et al. Epidermalgrowth factor receptor extracellular domain mutations in primary glio-blastoma. Neuropathol Appl Neurobiol 2009;35:208–13.
26. Idbaih A,Marie Y, Lucchesi C, PierronG,Manie E, Raynal V, et al. BAC arrayCGHdistinguishesmutually exclusive alterations that define clinicogeneticsubtypes of gliomas. Int J Cancer 2008;122:1778–86.
27. Gonzalez-Aguilar A, Idbaih A, Boisselier B, Habbita N, Rossetto M,Laurenge A, et al. Recurrent mutations of MYD88 and TBL1XR1 inprimary central nervous system lymphomas. Clin Cancer Res 2012;18:5203–11.
28. Olshen AB, Venkatraman ES, Lucito R, Wigler M. Circular binary segmen-tation for the analysis of array-based DNA copy number data. Biostatistics2004;5:557–72.
29. Hoang-Xuan K, He J, Huguet S, Mokhtari K, Marie Y, Kujas M, et al.Molecular heterogeneity of oligodendrogliomas suggests alternative path-ways in tumor progression. Neurology 2001;57:1278–81.
30. Houillier C, Lejeune J, Benouaich-Amiel A, Laigle-Donadey F, Criniere E,Mokhtari K, et al. Prognostic impact ofmolecularmarkers in a series of 220primary glioblastomas. Cancer 2006;106:2218–23.
31. GoldmanM, Craft B, Swatloski T, Ellrott K, ClineM, DiekhansM, et al. TheUCSC cancer genomics browser: update 2013. Nucleic Acids Res 2013;41:D949–54.
32. Brennan CW, Verhaak RG, McKenna A, Campos B, Noushmehr H, SalamaSR, et al. The somatic genomic landscape of glioblastoma. Cell 2013;155:462–77.
33. Wen PY,MacdonaldDR, ReardonDA,Cloughesy TF, Sorensen AG,GalanisE, et al. Updated response assessment criteria for high-grade gliomas:response assessment in neuro-oncology working group. J Clin Oncol2010;28:1963–72.
34. Bahleda R, Dienstmann R, Adamo B, Gazzah A, Infante JR, Zhong B, et al.Phase 1 study of JNJ-42756493, a pan-fibroblast growth factor receptor(FGFR) inhibitor, in patients with advanced solid tumors. J Clin Oncol2014;32:suppl; abstr 2501.
35. Squires M, Ward G, Saxty G, Berdini V, Cleasby A, King P, et al. Potent,selective inhibitors of fibroblast growth factor receptor define fibroblastgrowth factor dependence in preclinical cancer models. Mol Cancer Ther2011;10:1542–52.
36. Stupp R, Mason WP, van den Bent MJ, Weller M, Fisher B, Taphoorn MJ,et al. Radiotherapy plus concomitant and adjuvant temozolomide forglioblastoma. N Engl J Med 2005;352:987–96.
37. Law M, Yang S, Babb JS, Knopp EA, Golfinos JG, Zagzag D, et al. Com-parison of cerebral blood volume and vascular permeability from dynamicsusceptibility contrast-enhanced perfusionMR imaging with glioma grade.AJNR Am J Neuroradiol 2004;25:746–55.
38. Wang XS, Prensner JR, Chen G, Cao Q, Han B, Dhanasekaran SM, et al. Anintegrative approach to reveal driver gene fusions from paired-endsequencing data in cancer. Nat Biotechnol 2009;27:1005–11.
www.aacrjournals.org Clin Cancer Res; 21(14) July 15, 2015 3317
FGFR–TACC Identification and Inhibition in Glioma Patients
Research. on September 15, 2018. © 2015 American Association for Cancerclincancerres.aacrjournals.org Downloaded from
Published OnlineFirst January 21, 2015; DOI: 10.1158/1078-0432.CCR-14-2199
2015;21:3307-3317. Published OnlineFirst January 21, 2015.Clin Cancer Res Anna Luisa Di Stefano, Alessandra Fucci, Veronique Frattini, et al. in IDH Wild-type Glioma
TACC Fusions−Detection, Characterization, and Inhibition of FGFR
Updated version
10.1158/1078-0432.CCR-14-2199doi:
Access the most recent version of this article at:
Material
Supplementary
http://clincancerres.aacrjournals.org/content/suppl/2015/01/22/1078-0432.CCR-14-2199.DC1
Access the most recent supplemental material at:
Cited articles
http://clincancerres.aacrjournals.org/content/21/14/3307.full#ref-list-1
This article cites 37 articles, 12 of which you can access for free at:
Citing articles
http://clincancerres.aacrjournals.org/content/21/14/3307.full#related-urls
This article has been cited by 4 HighWire-hosted articles. Access the articles at:
E-mail alerts related to this article or journal.Sign up to receive free email-alerts
Subscriptions
Reprints and
To order reprints of this article or to subscribe to the journal, contact the AACR Publications Department at
Permissions
Rightslink site. Click on "Request Permissions" which will take you to the Copyright Clearance Center's (CCC)
.http://clincancerres.aacrjournals.org/content/21/14/3307To request permission to re-use all or part of this article, use this link
Research. on September 15, 2018. © 2015 American Association for Cancerclincancerres.aacrjournals.org Downloaded from
Published OnlineFirst January 21, 2015; DOI: 10.1158/1078-0432.CCR-14-2199