detection and quantitation of tetracycline antibiotics in
TRANSCRIPT
Western Kentucky UniversityTopSCHOLAR®
Masters Theses & Specialist Projects Graduate School
Spring 2017
Detection and Quantitation of TetracyclineAntibiotics in Agricultural Swine WastesAli Jamal Abdulrheemwku, [email protected]
Follow this and additional works at: http://digitalcommons.wku.edu/theses
Part of the Environmental Chemistry Commons, Meat Science Commons, and the MicrobiologyCommons
This Thesis is brought to you for free and open access by TopSCHOLAR®. It has been accepted for inclusion in Masters Theses & Specialist Projects byan authorized administrator of TopSCHOLAR®. For more information, please contact [email protected].
Recommended CitationAbdulrheem, Ali Jamal, "Detection and Quantitation of Tetracycline Antibiotics in Agricultural Swine Wastes" (2017). Masters Theses& Specialist Projects. Paper 1931.http://digitalcommons.wku.edu/theses/1931

DETECTION AND QUANTITATION OF TETRACYCLINE ANTIBIOTICS IN AGRICULTURAL SWINE WASTES
A Thesis Presented to
The Faculty of the Department of Chemistry Western Kentucky University
Bowling Green, Kentucky
In Partial Fulfillment Of the Requirements for the Degree
Master of Science
By
Ali Jamal Abdulrheem
May 2017
DETECTION AND QUANTITATION OF TETRACYCLINE ANTIBIOTICS INAGRICULTURAL SWINE WASTES
Dr. Eric Conte, Thesis Chair
Dr. Stuart Burris
Dr. John Loughrin
Dean, Graduate School Date

In loving memory of my grandmother, Baheeja “O’da”
One of the best teachers I have ever had
iv
ACKNOWLEDGMENTS
My deep gratitude goes first to my research advisor, Dr. Eric Conte. Your
supervision and direction with this project has taught me so much and has made
it utterly enjoyable. I am forever grateful.
To my thesis committee members, Dr. Stuart Burris and Dr. John Loughrin. I
am thankful for your time and your guidance during the journey of the program
here at Western Kentucky University.
To Haley Smith and Alicia Pesterfield, many thanks for being there whenever I
needed anything behind the scenes. The road of the journey is smoother because
of your aide and assistance.
To Pauline Norris and the Advanced Materials Institute. I am indebted for all
you have taught me and all the time you spent training me on the instruments.
To my friends and colleagues that I have made during my journey: Elnaz Jalali,
Melanie Campbell, Dheyaa Al-Karawi, Christopher Fullington, and Courtney
Cruse. I am forever beholden for your friendship and your help over the expedition
of the program.
To my sisters, Sarah and Narjes, and my brother, Ahmad. I value your
encouragement, inspiration, and friendship.
And finally, to my wonderful parents, Jamal and Elham, for their continuous
support and devotion. You have my upmost appreciation and love for everything
you have offered me.
Thank you, everyone.

v
TABLE OF CONTENTS
List of Figures ...................................................................................................... vii
List of Tables ........................................................................................................ ix
Abstract ................................................................................................................ x
1 Introduction ..................................................................................................... 1
1.1 Background ........................................................................................ 1
1.2 Governmental Regulations ................................................................. 3
1.3 Tetracycline Class Antibiotics ............................................................. 5
1.4 Solid Phase Extraction (SPE) ............................................................. 9
1.5 High Performance Liquid Chromatography (HPLC) ......................... 11
1.6 Proposed Research.......................................................................... 15
2 Experimental ................................................................................................. 16
2.1 Selection of Samples ........................................................................ 16
2.2 High Performance Liquid Chromatography (HPLC) ......................... 16
2.2.1 Photodiode Array (PDA) ................................................ 16
2.2.2 Mass Spectrometry (MS) ............................................... 17
2.3 Solid Phase Extraction (SPE) Cartridge Performance ...................... 19
2.4 Live Sample Preparation .................................................................. 22
2.5 Oxytetracycline extraction from hog feed ......................................... 23
3 Results .......................................................................................................... 24
3.1 HPLC-PDA Method Development .................................................... 24
3.1.1 Biphenyl Column ............................................................ 24
3.1.2 C18 Column ................................................................... 26
vi
TABLE OF CONTENTS (continued)
3.2 HPLC-MS Method Development with a C18 Column ....................... 28
3.3 Cartridge Performance with Non-Complex Matrix ............................ 34
3.4 Calibration Curves ............................................................................ 37
3.5 Waste Samples Analysis .................................................................. 40
3.6 Oxytetracycline in Hog Feed ............................................................ 45
4 Conclusion .................................................................................................... 46
5 Bibliography .................................................................................................. 48

vii
LIST OF FIGURES
Figure 1 Antibiotic Resistant Bacteria replication .......................................... 4
Figure 2 The structure of 6-deoxy-6-demethyltetracycline ............................ 6
Figure 3 The three pKa sites of tetracyclines ................................................. 8
Figure 4a Chemical structure of tetracycline ................................................... 8
Figure 4b Chemical structure of oxytetracycline .............................................. 8
Figure 4c Chemical structure of chlortetracycline ........................................... 8
Figure 5 Phases of solid phase extraction (SPE) ........................................ 10
Figure 6 Diagram of liquid chromatography ................................................ 12
Figure 7 How peaks are created ................................................................. 13
Figure 8 Electrospray ionization (ESI) process ........................................... 14
Figure 9 The weak polymeric sorbent found in the SPE cartridges ............. 19
Figure 10 SPE vacuum box ........................................................................... 20
Figure 11 Standard mix chromatogram using a biphenyl column .................. 25
Figure 12 Standard mix chromatogram using a C18 column ........................ 27
Figure 13 Standard mix chromatogram using the HPLC-MS (C18) .............. 29
Figure 14 Mass Spectra of the three antibiotics ............................................ 30
Figure 15 Oxytetracycline’s filtered chromatogram at m/z 461 ...................... 33
Figure 16 Tetracycline’s filtered chromatogram at m/z 445 ........................... 33
Figure 17 Chlortetracycline’s filtered chromatogram at m/z 479 ................... 33
Figure 18 Percent recovered from the cartridge (cumulative) ....................... 35
Figure 19 Percent recovered from the cartridge (per elution) ........................ 35
Figure 20 HPLC-PDA calibration curve of oxytetracycline ............................ 38
Figure 21 HPLC-PDA calibration curve of tetracycline .................................. 38
Figure 22 HPLC-PDA calibration curve of chlortetracycline .......................... 38
Figure 23 HPLC-MS calibration curve of oxytetracycline .............................. 39
Figure 24 HPLC-MS calibration curve of tetracycline .................................... 39
Figure 25 HPLC-MS calibration curve of chlortetracycline ............................ 39

viii
LIST OF FIGURES (continued)
Figure 26 Percent recovery of tetracyclines in a swine waste matrix ............ 41
Figure 27 Native digester waste elution ........................................................ 43
Figure 28 Native digester waste elution with internal standard ..................... 44

ix
LIST OF TABLES
Table 1 Selected bacteria classes and their functions ................................. 2
Table 2 List of tetracyclines and their characteristics ................................... 7
Table 3 The pKa values of selected tetracycline molecules ......................... 9
Table 4 HPLC-MS Parameter settings used for a full scan mode .............. 18
Table 5 HPLC-PDA parameters used with the biphenyl column ................ 24
Table 6 HPLC-PDA parameters used with the C18 column ....................... 26
Table 7 HPLC-MS pump settings ............................................................... 29
Table 8 Daughter ions of the tetracyclines ................................................. 31
Table 9 Percent recovered from the cartridge per 2-mL elution ................. 34
Table 10 Percent mass recovery using different solutions ........................... 36
Table 11 Limit of detection of the tetracyclines on the HPLC-PDA .............. 37
Table 12 Concentrations of tetracyclines before and after digestion ............ 44

x
DETECTION AND QUANTITATION OF TETRACYCLINE ANTIBIOTICS IN AGRICULTURAL SWINE WASTES
Ali Abdulrheem May 2017 53 Pages
Directed by: Dr. Eric Conte, Dr. Stuart Burris, and Dr. John Loughrin
Department of Chemistry Western Kentucky University
The spread of tetracyclines through agricultural systems is causing the present
bacteria to develop antibiotic resistance. The spread of this bacteria, as well as the
tetracycline antibiotics in the environment is dangerous because these antibiotics
pose health hazards for humans. The overuse of antibiotics, which are added to
livestock feed, results in the antibiotics being released into the environment via
animal feces. In this research, we have attempted to design an analytical method
to isolate antibiotics from agricultural wastes with subsequent detection using liquid
chromatography and mass spectrometry (LC-MS). The antibiotics investigated in
this study were tetracycline, chlortetracycline, and oxytetracycline.
The analytical procedure involves mixing the agricultural samples with an
organic solvent, such as methanol, which solubilizes these antibiotics. Next,
samples are centrifuged to remove solid particulates. A polymeric weak cation
cartridge was used to concentrate and separate the antibiotics from the unwanted
organic chemical compounds found in the samples. The antibiotics were released
with methanol with small amounts of acid and then detected and quantified using
LC-MS and high performance liquid chromatography with a photodiode array
detector (HPLC-PDA).
1
1 Introduction
1.1 Background
The outcome of having antibiotics as additives in livestock feed is a topic of
great importance. Antibiotics are introduced into the diet of livestock through their
feed to accelerate the growth rate. The use of antibiotics in the livestock is
beneficial to the industry, because the antibiotics contributes to the suppression of
nutrient competing bacteria that live in the livestock's intestines. Because the
competing bacteria population is depressed, the probiotics population increases.
Probiotics promote a healthy digestive tract and boost the immune system. Some
antibiotics also help the thinning of the intestinal wall which maximizes the
absorption of the nutrients to the animal itself [1]. A large percentage of the
antibiotics is not metabolized and thus excreted from the livestock through urine
and fecal matter [2].
However, the overuse of antibiotics leads bacteria to develop antibiotic
resistance. The bacteria that developed antibiotics resistance survives and divides
into two daughter cells with the exact DNA containing the gene for antibiotic
resistance. On the other hand, the spread of un-metabolized antibiotics into the
environment may cause untargeted bacteria to develop antibiotic resistance.
An efficient way to manage livestock's waste is to use an anaerobic digester.
Different types of bacteria are used to break down complex organic matter into
liquefied soluble organic compounds such as alcohols. Acid-forming bacteria
convert the soluble organic compounds into simple organic acids. Finally,
2
methane-forming bacteria converts the simple organic acids to methane and
carbon dioxide [3]. Carbon dioxide and methane are among the main gasses
produced. Methane is used as a fuel to generate electrical energy in most cases.
The sludge produced in this process is further modified by composting and
used as a fertilizer for crops. Traces of antibiotics and antibiotic-resistant bacteria
have the possibility of subsequently residing in the fertilizer and then further onto
the crops that are produced by farms. Contaminated water can also contain the
resistant bacteria that can be released as low-odor effluent into the environment
[3]. Sludge, contaminated water, and gasses are the outcomes of these anaerobic
digesters.
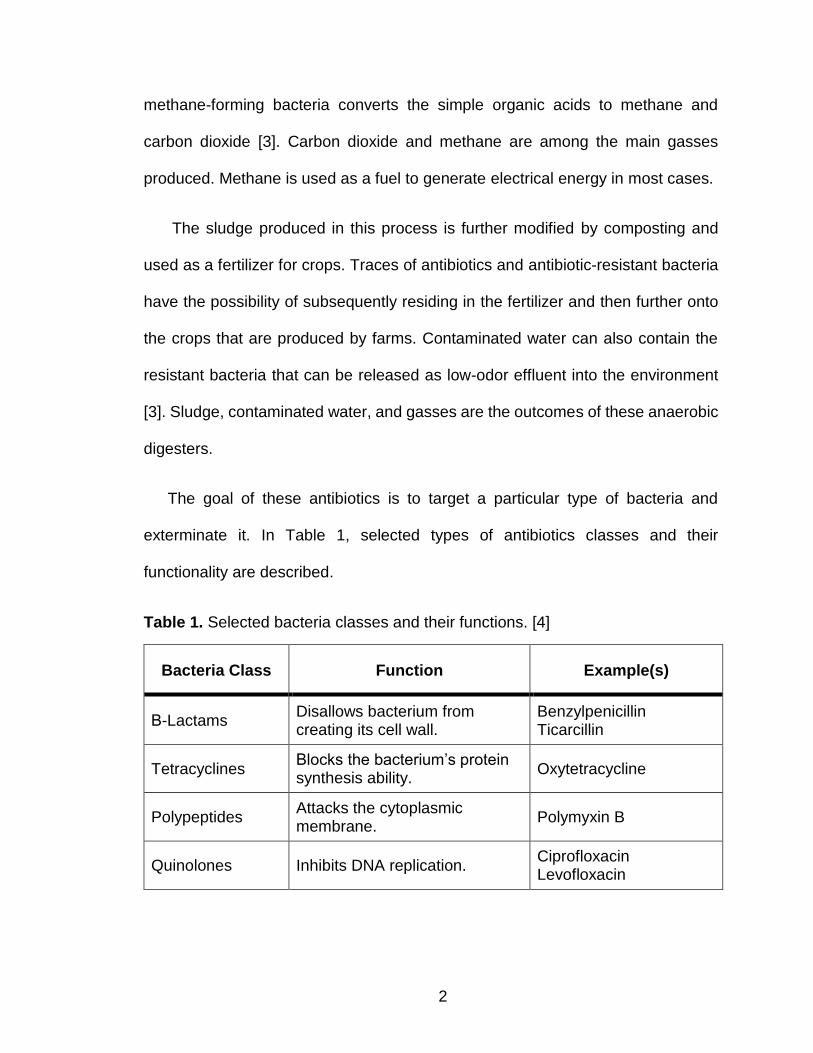
The goal of these antibiotics is to target a particular type of bacteria and
exterminate it. In Table 1, selected types of antibiotics classes and their
functionality are described.
Table 1. Selected bacteria classes and their functions. [4]
Bacteria Class Function Example(s)
Β-Lactams Disallows bacterium from creating its cell wall.
Benzylpenicillin Ticarcillin
Tetracyclines Blocks the bacterium’s protein synthesis ability.
Oxytetracycline
Polypeptides Attacks the cytoplasmic membrane.
Polymyxin B
Quinolones Inhibits DNA replication. Ciprofloxacin Levofloxacin
3
Some of the antibiotics used are ionophores, which are drugs that are not used
for human medication. Ionophores transport ions across lipid membranes in cells.
The resistance resulting against ionophores commonly does not affect humans.
However, scientists at the United States Department of Agriculture (USDA) and
Cornell University concluded in a study about “monensin, one of the most
commonly used ionophores in cattle production in the U.S. [This study]
demonstrated that the use of monensin in cattle feed and the selection of
monensin-resistant bacteria lead to a 32-fold increase in resistance to bacitracin,
which is used in human medicine.” [5]
These resistant bacteria can be exterminated if the consumable meat is cooked
at a high temperature. Hence, the consumption of undercooked meat poses a risk
to human health because it introduces antibiotic resistant bacteria to the body. The
resistant bacteria can also be transported to humans from crops containing
fertilizers made from fecal matter of animals that have been fed antibiotic-
containing feed. Crops irrigated with water containing animal feces will also
transfer those antibiotic resistant bacteria to the crop and onwards to humans [6].
1.2 Governmental Regulations
The increasing concern about the spread of antibiotic resistant bacteria
amongst the population caused the Food and Drug Administration (FDA) to
introduce regulations to control the spread. Over 50% of the antibiotics produced
in the United States are used for agricultural purposes [7]. Antibiotics have been
used in feed for over four decades. Their use has brought controversy and

4
regulations ever since. These policies weight the benefits of using antibiotics to
animals, humans, the economy, and pharmaceutical companies.
The Federal Food, Drug, and Cosmetic Act (FFD&C Act) are set of laws
enforced by the Food and Drug Administration (FDA) to direct the safety of food,
drugs, and cosmetics. The laws propose to limit the amount of additives to the feed
added by farmers to deaccelerate the rate of development of resistance. The
officials from the USDA, FDA, and Center for Disease Control (CDC) testified
before Congress that the routine of use of antibiotics has a declining effectiveness
over time [8]. The FDA officials stated that they need to attend to two issues when
evaluating and passing regulations. First, the amounts of antibiotic resistant
bacteria existing in the animal’s intestines. The second is the amount of bacteria
found in humans that are harmful to humans. The correlation between the two data
factors will help the regulators to formulate new laws. Figure 1 shows the means
of resistant bacterial mutation. The use of the antibiotics will affect the bacteria
population to repress, because the most sensitive (least resistant) will be
eliminated [2].
Figure 1. The development of antibiotic resistant bacteria populations. [9]

5
The approach to enforcing any regulation by the FDA requires attending to two
main issues. First, evaluating the type of pathogenic bacteria involved and whether
they are harmful to humans, animals or both. Second, the FDA also states that the
enforcement of a regulation must be achieved by looking at the overall situation
rather than focusing on a specific issue.
The FDA has indicated that they need to study the issues closely before
enforcing additional laws. Other governmental organizations and departments are
performing research that will result in certain best-practices regarding the
processing of meat production and feed additives.
1.3 Tetracycline Class Antibiotics
Tetracyclines were discovered in 1945 as a natural product of Streptomyces
genus actinobacteria, which are found in soils, by Benjamin Minge Duggar. It was
first prescribed in 1948. The first tetracycline antibiotic to be discovered was
chlortetracycline [10].
Tetracyclines exterminate bacteria by inhibiting a chemical reaction
responsible for synthesis of proteins that works by binding to the 30S ribosome of
the bacteria. This prevents the attachment of the aminoacyl tRNA to the RNA-
ribosome complex; disallowing the bacteria from synthesizing proteins that are
essential for its survival [11].

6
Bacteria develop antibiotic resistance by modifying their DNA through
spontaneous mutations. Once the bacterium cell develops the mutation, the
targeted protein will prevent the antibiotic from binding because of the new gene
expression developed. The antibiotic resistant bacteria can share genetic
information with other bacteria, transfer its mutation on to other bacteria, and
spread it over the entire population of bacteria. The antibiotics resistant bacteria
can also spread the resistance by binary fission replicating its DNA into two
daughter bacteria cells [12].
Tetracyclines are a class of antibiotics that are characterized by their four
adjacent cyclic rings. The simplest of the tetracyclines, 6-deoxy-6-
demethyltetracycline, is shown in Figure 2. It also represents the backbone
structure of every tetracycline.
Figure 2. The structure of 6-deoxy-6-demethyltetracycline.
7
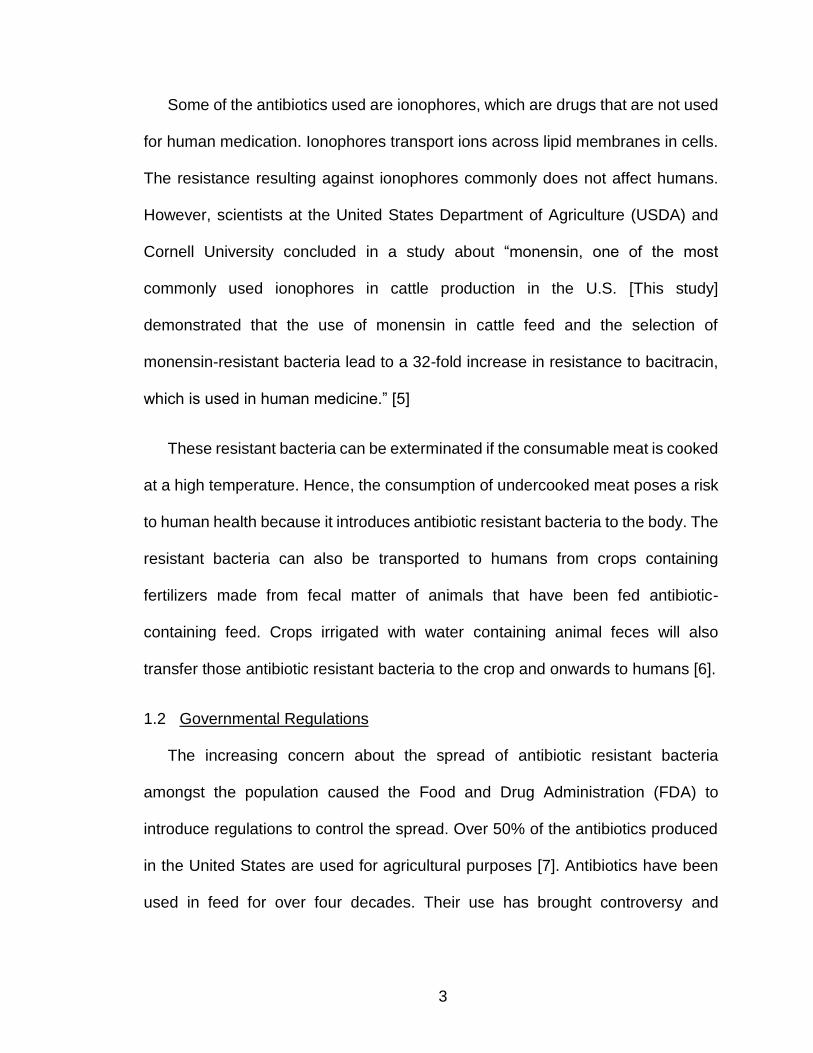
Tetracyclines can treat many bacterial infections by oral intake in humans.
Tetracyclines are known to treat respiratory tract infections (Haemophilius
influnzae, Streptococcus pnemoniae, or Klebsiella), acne, the plague (Yersinia
pestis), syphilis, and many other bacterial infections [13]. In Table 2, the different
types of tetracyclines and their status in the medical field are listed.
Table 2. List of Tetracyclines and their characteristics [14].
Tetracyclines have three active pKa sites. As shown in Figure 3, sites 1, 2, and
3 have different pKa’s. Site 1 is a conjugated trione system, which is acidic in
nature, with a pKa range from 2.8 to 3.4. The second site is a conjugated enone
system which is slightly basic with a pKa range of 7.2 to 7.8. Site 1 is a strong
alkaline (diethyl amine group) with a pKa range from 9.1 to 9.7. [15]. The
combination of the three pKa values of each antibiotic characterizes the specific
antibiotic from the tetracycline family. The different pKa values are different from
Chemical name Generic name Trade name Year
Discovered Therapeutic
administration
7-Chlortetracycline Chlortetracycline Aureomycin 1948 Oral
5-Hydroxytetracycline Oxytetracycline Terramycin 1948 Oral and parenteral
Tetracycline Tetracycline Achromycin 1953 Oral
6-Demethyl-7-chlortetracycline Demethylchlortetracycline Declomycin 1957 Oral
2-N-Pyrrolidinomethyltetracycline Rolitetracycline Reverin 1958 Oral
2-N-Lysinomethyltetracycline Limecycline Tetralysal 1961 Oral and parenteral
N-Methylol-7-chlortetracycline Clomocycline Megaclor 1963 Oral
6-Methylene-5-hydroxytetracycline Methacycline Rondomycin 1965 Oral
6-Deoxy-5-hydroxytetracycline Doxycycline Vibramycin 1967 Oral and parenteral
7-Dimethylamino-6-demethyl-6-deoxytetracycline
Minocycline Minocin 1972 Oral and parenteral
9-(t-butylglycylamido)-minocycline Tertiary-butylglycylamidominocycline
Tigilcycline 1993 [Parenteral]
8
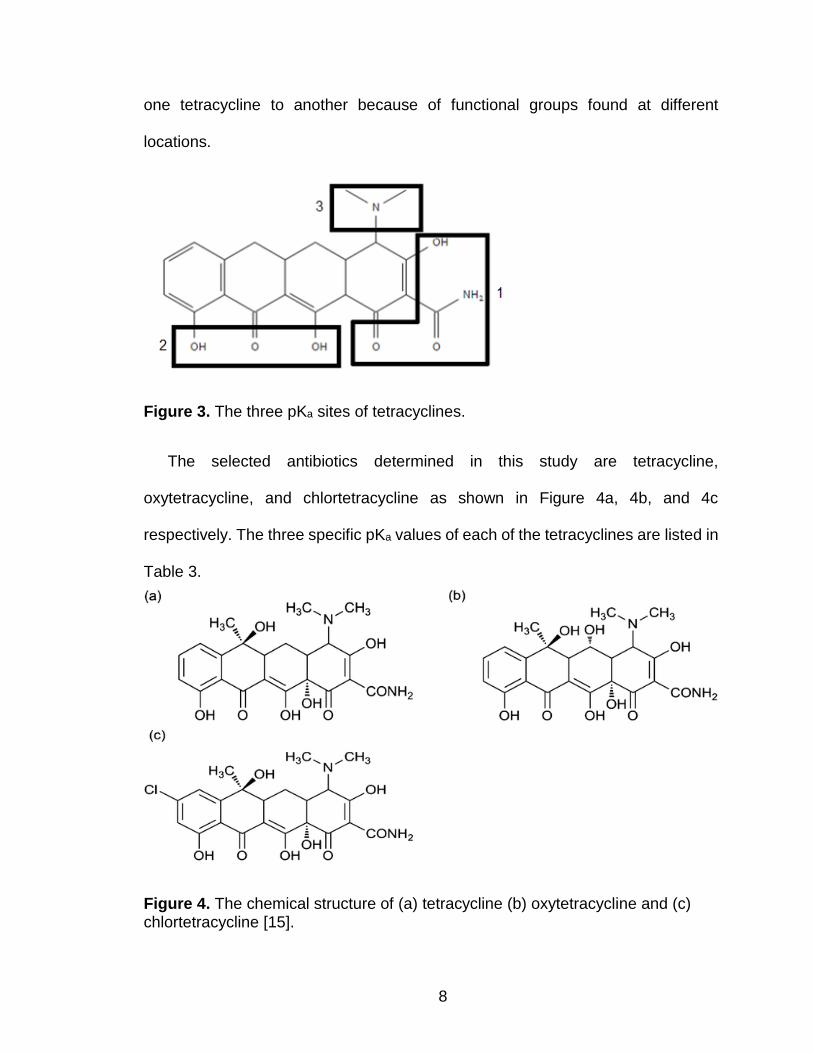
one tetracycline to another because of functional groups found at different
locations.
Figure 3. The three pKa sites of tetracyclines.
The selected antibiotics determined in this study are tetracycline,
oxytetracycline, and chlortetracycline as shown in Figure 4a, 4b, and 4c
respectively. The three specific pKa values of each of the tetracyclines are listed in
Table 3.
Figure 4. The chemical structure of (a) tetracycline (b) oxytetracycline and (c) chlortetracycline [15].
9
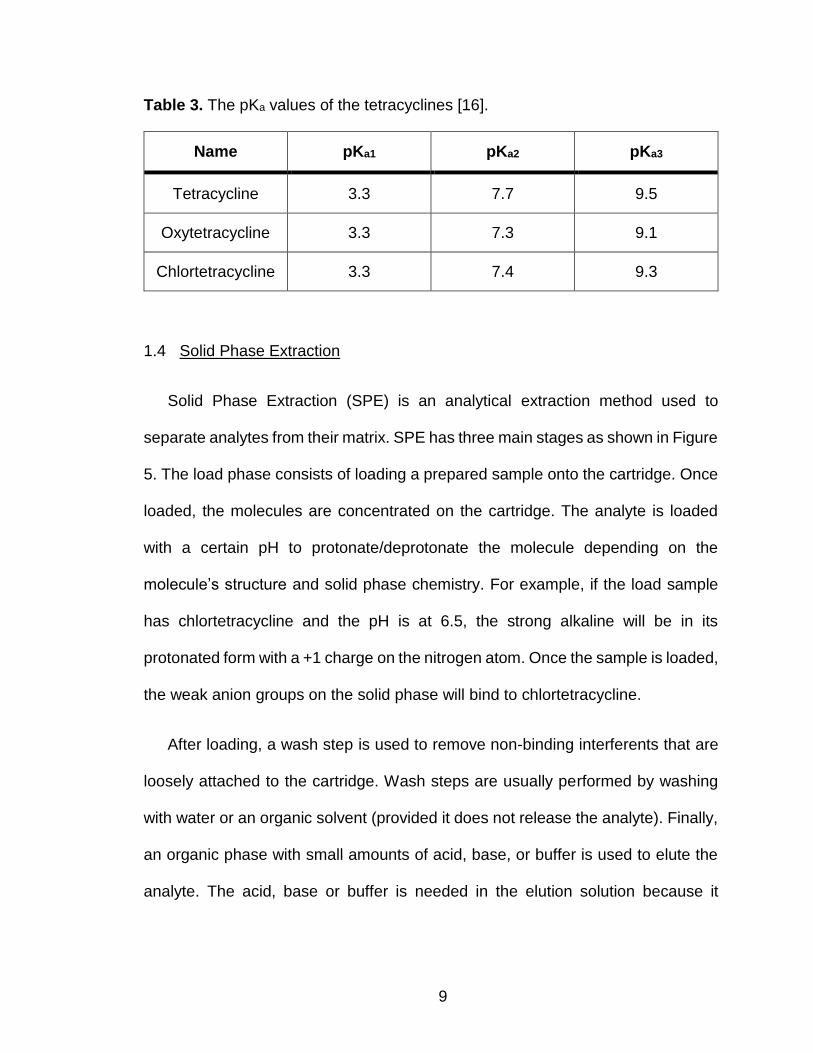
Table 3. The pKa values of the tetracyclines [16].
1.4 Solid Phase Extraction
Solid Phase Extraction (SPE) is an analytical extraction method used to
separate analytes from their matrix. SPE has three main stages as shown in Figure
5. The load phase consists of loading a prepared sample onto the cartridge. Once
loaded, the molecules are concentrated on the cartridge. The analyte is loaded
with a certain pH to protonate/deprotonate the molecule depending on the
molecule’s structure and solid phase chemistry. For example, if the load sample
has chlortetracycline and the pH is at 6.5, the strong alkaline will be in its
protonated form with a +1 charge on the nitrogen atom. Once the sample is loaded,
the weak anion groups on the solid phase will bind to chlortetracycline.
After loading, a wash step is used to remove non-binding interferents that are
loosely attached to the cartridge. Wash steps are usually performed by washing
with water or an organic solvent (provided it does not release the analyte). Finally,
an organic phase with small amounts of acid, base, or buffer is used to elute the
analyte. The acid, base or buffer is needed in the elution solution because it
Name pKa1 pKa2 pKa3
Tetracycline 3.3 7.7 9.5
Oxytetracycline 3.3 7.3 9.1
Chlortetracycline 3.3 7.4 9.3

10
releases the analyte(s) off the weak ion phase by substituting the
hydroxide/hydronium ion allowing the weaker analyte to be released.
Figure 5. Phases of Solid Phase Extractions (SPE) [17].
A typical process has three stages: load, wash, and elution. Elution is the most
critical stage. The elution stage contains the analytes of interest with minimal
interferents. Both, the load stage and the wash stage, can be analyzed to track the
release of the analytes.
An optimum SPE procedure would release the unwanted interferents during
the wash phase. This means that after the wash stage, the only molecules left on
the cartridge are the analytes. The goal is to release all the analytes at a high
recovery rate in the elution stage. Spiking the samples with a known concentration
of standards before loading the samples onto the cartridge is helpful because the

11
results are used to calculate the percentage of the analytes recovered from the
cartridge.
1.5 High Performance Liquid Chromatography
High performance liquid chromatography (HPLC) functions by separating
molecules and then detecting them. Liquid chromatography has two main
components. The first component is the stationary phase. A column houses the
stationary phase used in HPLC. There are many different types of columns; they
come in various lengths, material, and sizes. The stationary phase is responsible
for separating the injected molecules as it interacts with the molecule at a
molecular level. For example, the silica-based stationary phase octadecyl carbon
chain (C18) can interact with a molecule through a series of chemical interactions
such as ionic bonding, hydrogen bonding or hydrophobic interactions. Different
sites on the molecule have different interactions with the stationary phase. Once
separated, the analytes travel to the detector and read by a read-out device (i.e.
monitor, printer, etc.). The C18 stationary phase is used in the column for reversed-
phase HPLC, where the stationary phase is less polar than the mobile phase.
The mobile phase usually consists of two solvents, aqueous and organic. The
volume of mobile phase that is pumped through the system over an amount of time
is known as flow rate that is expressed in milliliters/microliters per minute. The
percentage of aqueous and the organic solvents flowing through the system can
have two scenarios. If the percentage of aqueous and organic solvent are
constant, then the method is known as an isocratic method. If the percentage of
12
both phases are changing over time, then the method is known as a gradient
method. Gradient methods are used to separate a wide range of molecules with
different polarities. Gradient methods typically start at a low organic phase and
then gradually increase the organic phase. For example, Oxytetracycline is
released with smaller amounts of organic phase while Chlortetracycline requires
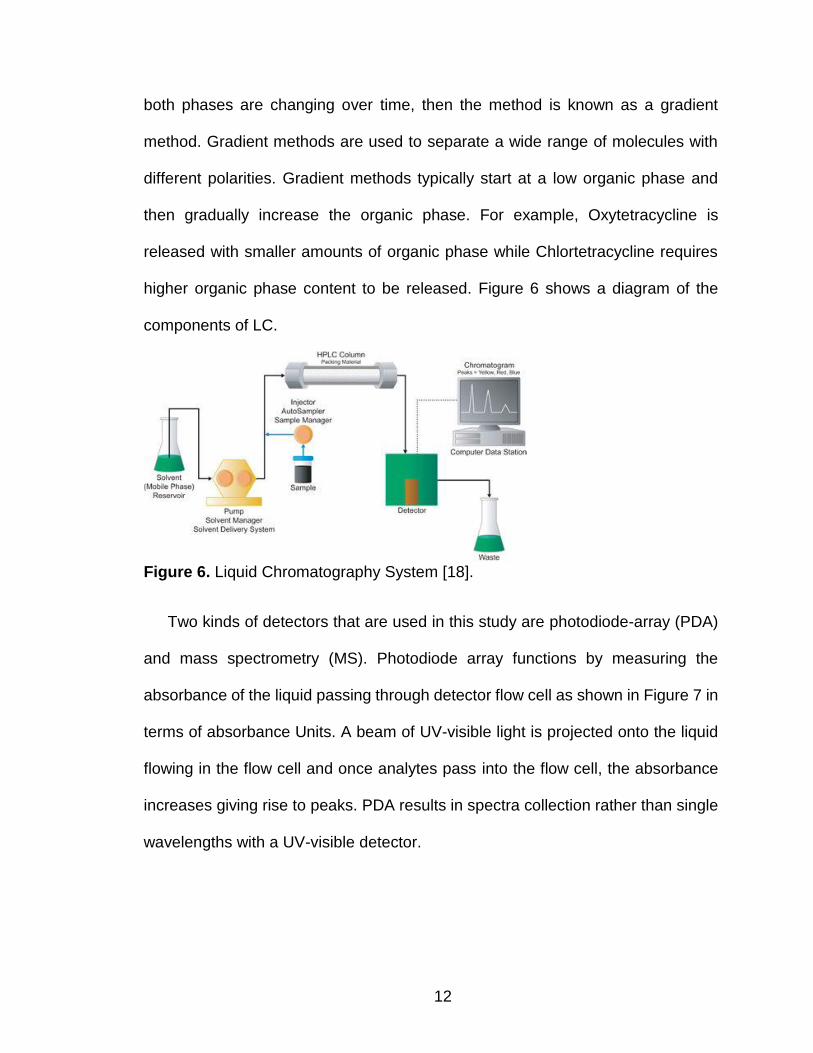
higher organic phase content to be released. Figure 6 shows a diagram of the
components of LC.
Figure 6. Liquid Chromatography System [18].
Two kinds of detectors that are used in this study are photodiode-array (PDA)
and mass spectrometry (MS). Photodiode array functions by measuring the
absorbance of the liquid passing through detector flow cell as shown in Figure 7 in
terms of absorbance Units. A beam of UV-visible light is projected onto the liquid
flowing in the flow cell and once analytes pass into the flow cell, the absorbance
increases giving rise to peaks. PDA results in spectra collection rather than single
wavelengths with a UV-visible detector.

13
Figure 7. How peaks are created [18].
As the concentration increases, the peak signal increases. The time it takes
the analyte to pass through the column is known as the retention time. The
retention time can be matched to its standard to analyze data qualitatively. An MS
can provide more qualitative analysis than a PDA.
An electrospray ionization (ESI) is part of MS that is responsible for charging
molecules before entering the detector. A high voltage is applied to the solvent
carrying the analyte; which then emits a jet of droplets. The droplets then gradually
evaporate, making the molecules more charged until the droplet reaches Raleigh’s
limit (the maximum charge a droplet could carry). After the droplet reaches
Rayleigh’s limit, the analytes are released from the droplet and charged. The
charged analytes enter a vacuum where they pass through an ion selector. An ESI
process is presented in Figure 8.

14
Figure 8. Electrospray Ionization (ESI) Process [19].
MS can quantify the amount of ions with a specific mass-to-charge ratio (m/z).
If the mass of a molecule is known, then the m/z can be inferred. For example,
the mass of tetracycline is 444.435 amu. Once tetracycline is charged with one
proton from the acidic mobile phase and through ESI, its mass becomes 445.435
and its charge becomes +1, meaning that the m/z is approximately 445. A
chromatogram specified only to m/z of 445 can be extracted from the full scan
chromatogram by filtering out all other masses out except for 445, which
therefore provides qualitative information for tetracycline. This is a major
advantage of MS over PDA, the detection of analytes with specific masses.
15
1.6 Proposed Research
The purpose of this project is to develop an extraction method and detect
tetracyclines in different types of agricultural waste. The conducted research
focused on the amounts of antibiotics that are hazardous to humans found in
agricultural waste samples from a regional selected farm. This study tracks
antibiotics and their metabolites that are found in different wastes. An analytical
method has been developed to extract and determine tetracyclines from different
matrices of swine and agricultural wastes using HPLC-MS and HPLC-PDA. The
goal of the project is also to compare the concentrations of the tetracyclines found
in the swine waste to the amounts of tetracyclines found in anaerobic digester
waste.
16
2 Experimental
2.1 Selection of Samples
The USDA has provided the samples from a selected farm located in Kentucky.
The swine waste samples were collected from a lagoon that collects swine manure
and urine from the farm. Digester samples are collected from an anaerobic digester
collected from a digester owned and operated by the USDA for research purposes.
2.2 High Performance Liquid Chromatography
2.2.1 Photodiode Array
A method that separates all peaks in one chromatogram must be developed
for the standard mixture of the three tetracyclines. For example, tetracyclines and
chlortetracycline standards have degradation peaks, even in fresh standards,
while oxytetracycline has only one peak. The HPLC-PDA system used in this
project is made by Waters®-2996. It consists of a binary pump, an autosampler,
and a PDA detector. The default wavelength used by the PDA detector is 254 nm
because benzene-containing substances absorb well at that wavelength. The λ-
max value of each of the analytes can be extracted from the spectra of the three
tetracyclines. Each tetracycline will have a λ-max value. The λ-max value gives the
optimum absorbance when running a chromatogram that result in better sensitivity.
The use of different mobile phases (i.e. methanol, acetonitrile, etc.) can achieve
different degrees of separations. Modifiers (i.e. formic acid, oxalic acid, etc.) can
be added to adjust the pH of the mobile phase, which can result in better peak

17
shapes and resolution. The flow rate also affects the chromatography because
higher flow rates generate more pressure resulting in smaller retention times.
Two stationary phases have been used for this research. The first column is a
Kinetex® Biphenyl LC Column from Phenomenex. The second stationary phase
used for analysis is a Kinetex® C18 LC Column from Phenomenex. Each column
will require a specific method because each of the stationary phase interacts
differently with the analytes. For example, the C18 has less interaction with
tetracyclines than biphenyl. Biphenyl might interact more with the tetracyclines
because it possesses two benzene rings that have more electron density due to
the π-bonds. The π-bonds interact with non-covalently with metals (ionic or
neutral), anions, or another π-bond system.
2.2.2 High Performance Liquid Chromatography (Mass Spectrometry)
HPLC-MS has the ability to extract individual chromatograms with specific m/z
values. An HPLC-MS provides the m/z values in each scan. The HPLC-MS used
is an Agilent®-500 system that consists of an autosampler, two solvent pumps,
and a mass spectrometer. The method for the HPLC-PDA can be similar; however,
it requires a unique method. This is because the retention times on each of the
systems can differ. The column used with the HPLC-MS is a Kinetex® C18 LC
Column from Phenomenex.
A full scan can be run because a standard contains three tetracyclines only and
no other contaminants. An MS/MS scan is extremely helpful because it can filter
out all the contaminants by collecting m/z product ions values. The m/z precursor
18
ion values for oxytetracycline, tetracycline and chlortetracycline are 461, 445, and
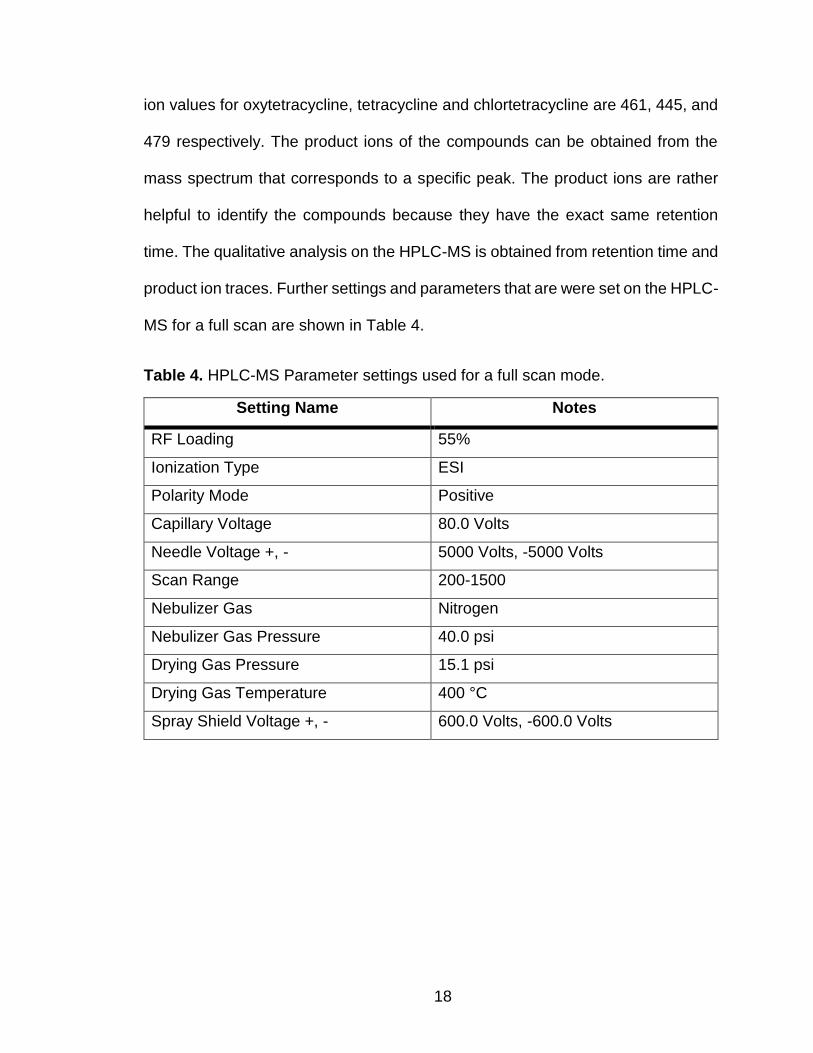
479 respectively. The product ions of the compounds can be obtained from the
mass spectrum that corresponds to a specific peak. The product ions are rather
helpful to identify the compounds because they have the exact same retention
time. The qualitative analysis on the HPLC-MS is obtained from retention time and
product ion traces. Further settings and parameters that are were set on the HPLC-
MS for a full scan are shown in Table 4.
Table 4. HPLC-MS Parameter settings used for a full scan mode.
Setting Name Notes
RF Loading 55%
Ionization Type ESI
Polarity Mode Positive
Capillary Voltage 80.0 Volts
Needle Voltage +, - 5000 Volts, -5000 Volts
Scan Range 200-1500
Nebulizer Gas Nitrogen
Nebulizer Gas Pressure 40.0 psi
Drying Gas Pressure 15.1 psi
Drying Gas Temperature 400 °C
Spray Shield Voltage +, - 600.0 Volts, -600.0 Volts

19
2.3 SPE Cartridge Performance
Polymeric weak cation SPE cartridges were used throughout this research
study. They were purchased from Phenomenex® under the name of X-CW, Weak
Cation Mixed Mode Phase. The cartridge contained 500 mg of a polymer base that
binds to basic compounds with pKa’s higher than 8 [20]. In Figure 9, the chemical
structure of the sorbent is shown. The carboxylic acid group on the sorbent acts
as a weak cation exchanger when equilibrated in water as the hydrogen from the
hydroxyl (on the carboxylic acid group) dissociates and the oxygen becomes
negatively charged allowing weak cationic exchange. The hydroxyl group provides
binding to non-polar sites through hydrophobic effects.
Figure 9. The weak polymeric sorbent found in the SPE cartridge [20].
In the first stage of developing a method, SPE is tested on the antibiotics in a
non-complex matrix, such as water. Standards were prepared at a wide range of
concentrations ranging from 175 ppm to 1 ppt. The sample is spiked with
tetracyclines at 0.4 ppm/mL of eluent. For example, if tetracycline standard is at a
concentration of 500 ppm, 150 µL of the standard is spiked into 10 mL water and
25 mL methanol, resulting in a concentration of 2.13 ppm. The elution would
concentrate the tetracyclines to 2.13 ppm, when the final volume is 5 mL. After
analysis, the concentration of tetracycline will be 2.13 ppm if 100% of the
tetracycline is released in the elution phase.

20
After the three tetracyclines are added to 20 mL of water, the pH of the sample
is adjusted to 6.5 using formic acid and ammonium hydroxide to either raise or
lower the pH. Because 6.5 is above the pKa of two out of the three sites on the
tetracyclines, the tetracyclines will bind to the sorbent from the strong alkaline
(dimethylamine group) site.
The SPE cartridge was placed on a vacuum box apparatus that is connected
to a pump with a pressure gauge. A vial is placed inside the box to collect the
samples of each phase. The SPE Cartridge is first activated and conditioned by
adding 5 mL of pure Methanol followed by 5 mL deionized water. The pressure for
condition can go up to 10 inches Hg. The sample is then loaded on the cartridge
with a flow rate of 2 mL/minute by adjusting the pressure to approximately 2 inches
Hg. The SPE set-up is shown in Figure 10.
Figure 10. SPE Vacuum Box with attached cartridges [21].
21
Although no contaminants are found in the deionized sample, the washes
were applied to this experiment to test whether the tetracyclines are released in
any of the wash phases. The test includes two wash phases, aqueous and organic.
The aqueous wash phase is 10% methanol in 90% deionized water (v/v). Ten mL
of 10% methanol in 90% deionized water is added to remove any soluble
contaminants at a flow rate of 3 mL/minute. Water is more viscous and has less
compressibility than methanol, which means that more pressure must be applied
to push water through the cartridge in this phase. The second wash phase is pure
methanol. The pressure is decreased to 2 inches Hg and 3 mL of pure methanol
is used to wash any organic contaminants.
Excess solvents are removed by increasing the pressure to 10 inches Hg and
allowing air flow through the cartridge for 20 minutes in preparation for the final
step of SPE. To evaluate the best type of solution to be used for the elution phase,
a series of acids and bases were prepared in methanol and used to evaluate the
percent recoveries of the tetracyclines. The four tests include 2% formic acid in
methanol, 5% ammonium hydroxide in methanol, 95% methanol in 0.04 M citric
acid, and 10% formic acid in methanol. 10 mL of each is used to release the
antibiotics from the cartridge.
A rotary evaporator is used to dry the eluent. The remaining analytes in the vial
are re-suspended in 5 mL of pure methanol and vortex mixed for one minute. The
sample is syringe-filtered with a 0.22-micron nylon filter and placed into an HPLC
vial to be analyzed by the HPLC-PDA.
22
2.4 Live Sample Preparation
There are several steps that must be taken before loading the sample for SPE
to ensure the binding of the analytes to the sorbent in the cartridge. For the digester
waste, 15 mL is mixed with 20 mL of pure methanol in a 45-mL centrifuge tube.
For swine waste, 5 mL is added with 30 mL of methanol. The samples are
sonicated for 20 minutes to release the tetracyclines. The solid particulates are
removed by centrifugation at a speed of 4,500 rpm for 10 minutes. The pH of the
sample is adjusted with 10% formic acid in water to 6.5 in preparation for loading
on the cartridge.
A duplicate sample must be prepared with a standard spike of 2 ppm of each
antibiotic for the goal of calculating percent recovery. The standard in methanol is
added before mixing the sample. This step is necessary to track the amounts of
tetracyclines that are released in the SPE procedure. This can be accomplished
by calculating the difference between the peaks of a spiked and a native (not
spiked) sample. The difference is the amount released from what has been spiked.
For example, if the concentration of chlortetracycline in a native swine sample is 1
ppm, and the recovery from the cartridge is only 50%, it is assumed that the
concentration of chlortetracycline is 2 ppm in the elution phase.
The elution phase sample is spiked with oxytetracycline. A control with the
same concentration of the internal standard is injected and analyzed. For example,
if chlortetracycline’s concentration is below the limit of detection, spike can be
added to the injection sample and the difference between the concentrations can

23
be regarded as the actual concentration of the injected sample. Post-elution spikes
are also useful to locate the peak of an analyte on a chromatogram.
2.5 Oxytetracycline Extraction from Hog Feed
Hog feed containing oxytetracycline was purchased for analysis. The label
stated that the concentration of oxytetracycline is 50 g/ton (55.1 ppm). 25.0 grams
of the feed is weighed and grinded. The solids are mixed with 200 mL methanol
and is mixed on the shaker for 25 minutes. The solids are then filtered out because
oxytetracycline was dissolved in methanol. The sample was then rotovapped until
all the methanol is evaporated. 50 mL of hexane is added followed by 50 mL of
methanol to separate polar and non-polar compounds found in the feed. A liquid-
liquid extraction is performed using a separatory funnel. Methanol is the aqueous
phase with the higher density while hexane is the organic phase with the lower
density.
The aqueous phase was extracted and underwent SPE. The analytes were
eluted with 5 mL of 10% formic acid in methanol. The eluent is placed in an HPLC
vial and placed in the auto sampler for HPLC-PDA analysis. A sample with an
internal standard is added to locate the peak because the sample can be extremely
complex due to the presence of impurities.
24
3 Results
3.1 HPLC-PDA Method Development
3.1.1 Biphenyl Column
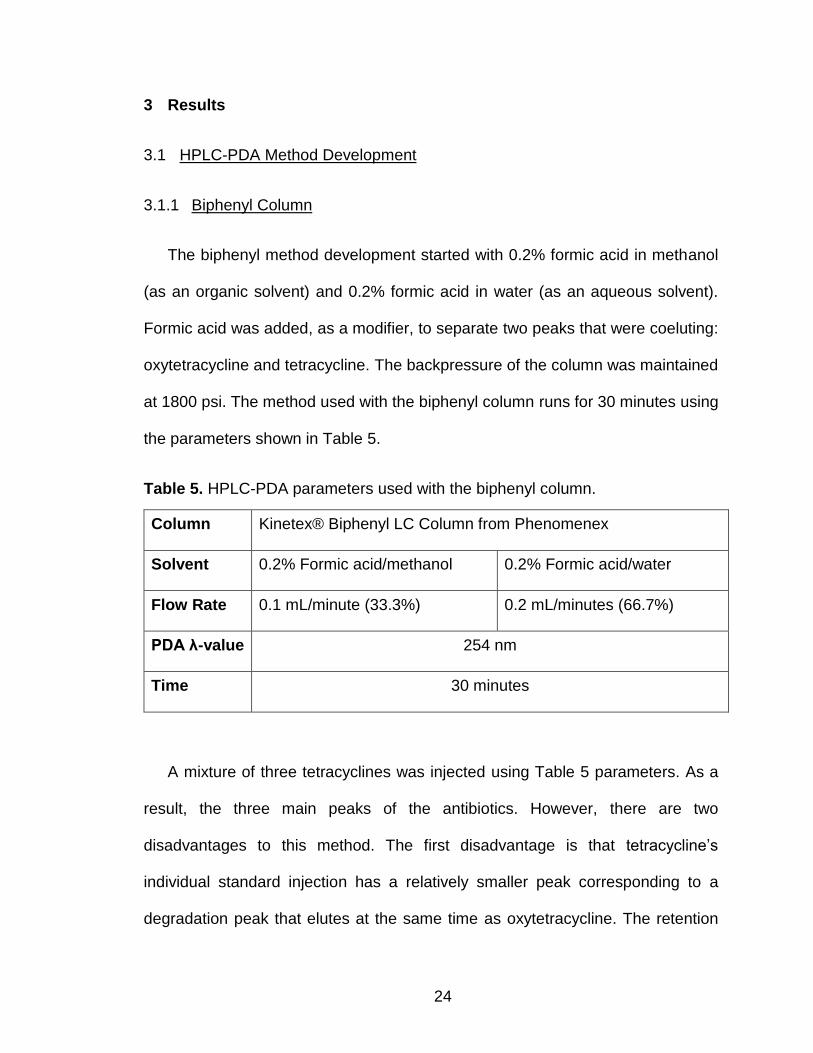
The biphenyl method development started with 0.2% formic acid in methanol
(as an organic solvent) and 0.2% formic acid in water (as an aqueous solvent).
Formic acid was added, as a modifier, to separate two peaks that were coeluting:
oxytetracycline and tetracycline. The backpressure of the column was maintained
at 1800 psi. The method used with the biphenyl column runs for 30 minutes using
the parameters shown in Table 5.
Table 5. HPLC-PDA parameters used with the biphenyl column.
A mixture of three tetracyclines was injected using Table 5 parameters. As a
result, the three main peaks of the antibiotics. However, there are two
disadvantages to this method. The first disadvantage is that tetracycline’s
individual standard injection has a relatively smaller peak corresponding to a
degradation peak that elutes at the same time as oxytetracycline. The retention
Column Kinetex® Biphenyl LC Column from Phenomenex
Solvent 0.2% Formic acid/methanol 0.2% Formic acid/water
Flow Rate 0.1 mL/minute (33.3%) 0.2 mL/minutes (66.7%)
PDA λ-value 254 nm
Time 30 minutes

25
times for oxytetracycline, tetracycline and chlortetracycline are 4.6 minutes, 6.0
minutes, and 19.1 minutes respectively using this method. The chromatogram of
the standard mix is presented in Figure 11.
Figure 11. Standard mix chromatogram using a biphenyl column.
The peaks of tetracycline and oxytetracycline earlier in the chromatogram have
a narrow base and are very symmetrical. Chlortetracycline’s peak is symmetrical;
however, its base is wider relative to the other peaks. Chlortetracycline requires a
higher organic flow to produce a sharper peak. Although, this method was used
earlier in the research study, another method had to be developed to produce
better resolution for chlortetracycline, tetracycline’s degradation product (4-epi-
tetracycline), and chlortetracycline’s degradation product (4-epi-chlortetracycline).
Oxytetracycline
Tetracycline
Chortetracycline Degradation
Chlortetracycline
-0.002
0.003
0.008
0.013
0.018
0 5 10 15 20 25 30
Absorb
ance U
nits (
AU
)
Time (minutes)
26
The use of acetonitrile as an organic mobile phase is helpful because
acetonitrile produced sharper peaks. However, acetonitrile has a higher elution
power than methanol. For example, 10% acetonitrile method can elute caffeine
earlier than 25% methanol [22]. Acetonitrile was chosen as an organic mobile
phase using the biphenyl column but it was not successful because peaks were
coeluting which lead to the switching of the column to a C18 column.
3.1.2 C18 Column
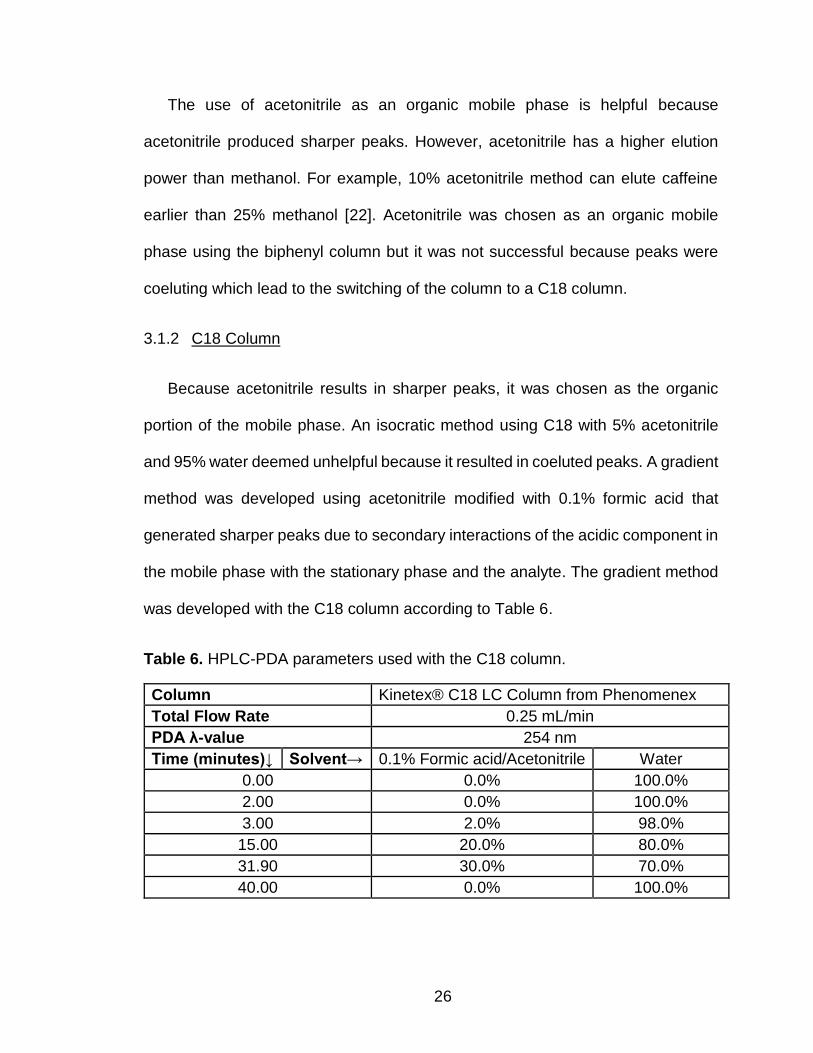
Because acetonitrile results in sharper peaks, it was chosen as the organic
portion of the mobile phase. An isocratic method using C18 with 5% acetonitrile
and 95% water deemed unhelpful because it resulted in coeluted peaks. A gradient
method was developed using acetonitrile modified with 0.1% formic acid that
generated sharper peaks due to secondary interactions of the acidic component in
the mobile phase with the stationary phase and the analyte. The gradient method
was developed with the C18 column according to Table 6.
Table 6. HPLC-PDA parameters used with the C18 column.
Column Kinetex® C18 LC Column from Phenomenex
Total Flow Rate 0.25 mL/min
PDA λ-value 254 nm
Time (minutes)↓ Solvent→ 0.1% Formic acid/Acetonitrile Water
0.00 0.0% 100.0%
2.00 0.0% 100.0%
3.00 2.0% 98.0%
15.00 20.0% 80.0%
31.90 30.0% 70.0%
40.00 0.0% 100.0%

27
This gradient method could separate all the analytes and produce sharper
peaks compared to the biphenyl column. The chromatogram produced by this
method is shown in Figure 12.
Figure 12. Standard mix chromatogram using a C18 column.
Overall, the peaks are sharper on the C18 column compared to the biphenyl
column. Chlortetracycline has a narrower base and its degradation peak is more
quantifiable than it was with an isocratic method. This method uses a slower flow
rate due to the existence of a high aqueous environment, which can increase the
back pressure in the column resulting in a shorter lifetime for the column. A typical
back pressure for this method is approximately 1400 psi. One disadvantage of this
Tetracycline's Degradation
Oxytetracycline
Tetracycline
Chlortetracycline's Degradation
Chlortetraycline
-0.002
0.018
0.038
0.058
0.078
0.098
0.118
0 5 10 15 20 25 30 35 40
Absorb
ance U
nits (
AU
)
Time (minutes)
28
method is the lengthiness of this test compared to the biphenyl method: 40 minutes
on the C18 column versus 30 minutes on the biphenyl column.
3.2 HPLC-MS Method Development with a C18 Column
The HPLC-MS is more complex than an HPLC-PDA because an HPLC-MS has
more parameters that need to be adjusted for method development from one
method to another. The advantage of the HPLC-MS method is three-fold: the test
time for each injection is 11 minutes, the MS can identify the unique m/z ratio of
each peak, and the precursor ion of each of the analytes can be flittered out of the
chromatogram from a full scan. Another advantage is the MS/MS setting on the
HPLC-MS. This allows the detection of a certain m/z value and will ignore other
m/z values that are not of analytical interest. MS/MS also applies amplitude voltage
towards the selected precursor ion to produce the daughter ions by collision. The
daughter ions are fragments created by electrospray ionization. This fragmentation
increases the selectivity.
Because the HPLC-MS and HPLC-PDA have different pumps and lines, the
method is transferable from one instrument to another and thus, a method was
developed on the HPLC-MS that mimics previous methods using the C18 column.
The gradient starts at a high aqueous content at a flow rate of 0.20 mL/minute and
then a gradual increase of the organic phase is applied. The pump settings for the
HPLC-MS using the C18 column are shown in Table 7.

29
Table 7. HPLC-MS pump settings used with the C18 column.
Although in the resulting chromatogram (Figure 13) two out of the five peaks
coelute (tetracycline’s degradation peak and oxytetracycline), we can quantify by
filtering out each respective precursor ions trace chromatograms. The masses of
the degradation peaks of tetracycline and chlortetracycline are 445 and 479
respectively. The full scan chromatogram is shown in Figure 13.
Figure 13. Standard mix chromatogram using the HPLC-MS (C18).
Total Flow Rate 0.20 mL/min
Solvent → 0.1% Formic acid/acetonitrile 0.1% Formic acid/water
Time (min) ↓
0.00 10.0% 90.0%
5.00 30.0% 70.0%
8.10 50.0% 50.0%
11.00 10.0% 90.0%
Oxytetracycline
Tetracycline
Chlortetraycline's Degradation
Chlortetracycline
0
1
2
3
4
5
6
7
8
9
0 1 2 3 4 5 6 7 8 9
×10
6C
ounts
(A
rbitra
ty U
nits)
Time (minutes)
30
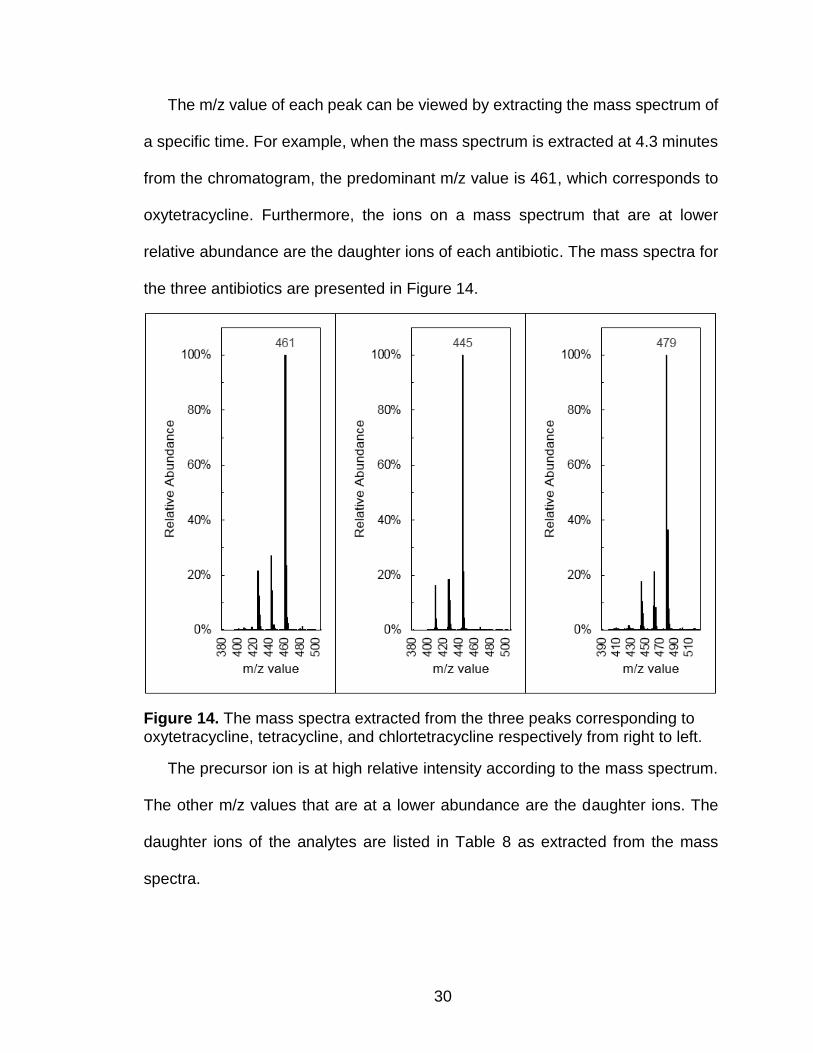
The m/z value of each peak can be viewed by extracting the mass spectrum of
a specific time. For example, when the mass spectrum is extracted at 4.3 minutes
from the chromatogram, the predominant m/z value is 461, which corresponds to
oxytetracycline. Furthermore, the ions on a mass spectrum that are at lower
relative abundance are the daughter ions of each antibiotic. The mass spectra for
the three antibiotics are presented in Figure 14.
Figure 14. The mass spectra extracted from the three peaks corresponding to oxytetracycline, tetracycline, and chlortetracycline respectively from right to left.
The precursor ion is at high relative intensity according to the mass spectrum.
The other m/z values that are at a lower abundance are the daughter ions. The
daughter ions of the analytes are listed in Table 8 as extracted from the mass
spectra.

31
Table 8. The daughter ions of each of the parent ions of the tetracyclines.
The daughter ions have an m/z value of the original molecule minus the
loss of a specific group. For example, tetracycline’s first daughter ion is 427. 18
amu’s are lost (from 445) which is a strong indication that dehydration occurred
via the fragmenting a hydroxyl group and a hydrogen (total mass of H2O is 18
amu).
An MS/MS run can prove useful for samples that contain many of
contaminants. The MS/MS scan has the same settings as a full scan but with an
additional set of parameters: the ion range detection and the amplitude voltage.
The amplitude voltage was set low for all the parent ions to decrease the
fragmentation of the analyte. The amplitude voltage for the three ions was set at
0.02 volts. The range of the product ion search for each of the analytes was set 10
m/z values below the smaller daughter ion and 10 m/z values above the bigger
daughter ion m/z value of the daughter ion. For example, oxytetracycline’s product
ion settings ranged from 416 to 453.
Although MS/MS is not necessary because the precursor ion chromatogram
can be extracted from a full scan, it is helpful to run an MS/MS scan as
Analyte Parent Ion (m/z) Daughter Ions (m/z)
Oxytetracycline 461 443, 426
Tetracycline 445 427, 410
Chlortetracycline 479 444, 462

32
confirmation. The three factors that confirm the existence of the antibiotic in a
sample are as follows: 1.) The MS/MS scan (or the filtered scan) has a peak
matching the m/z value that of the standard. 2.) The retention time of the analyte
in the sample, must match that of the standard. 3.) The daughter ion filters must
show smaller peaks with the same retention time of the standard peak. The filtered
scan of a specific parent ion can be extracted from the full scan chromatogram.
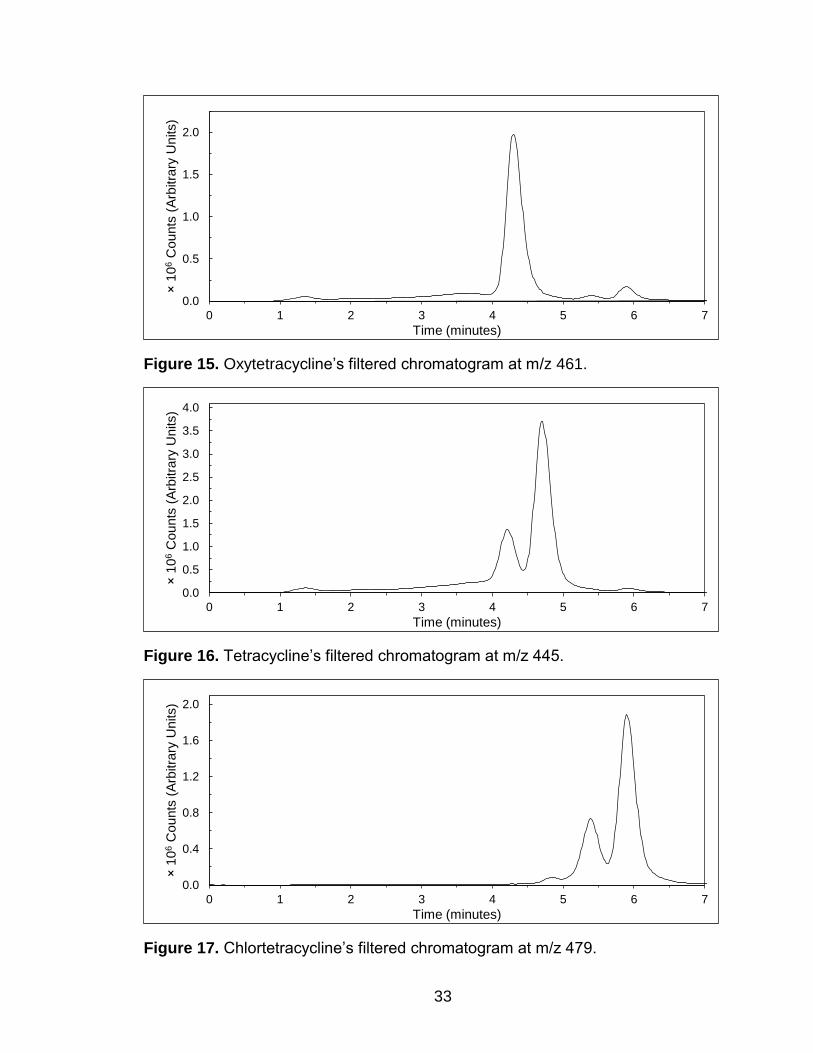
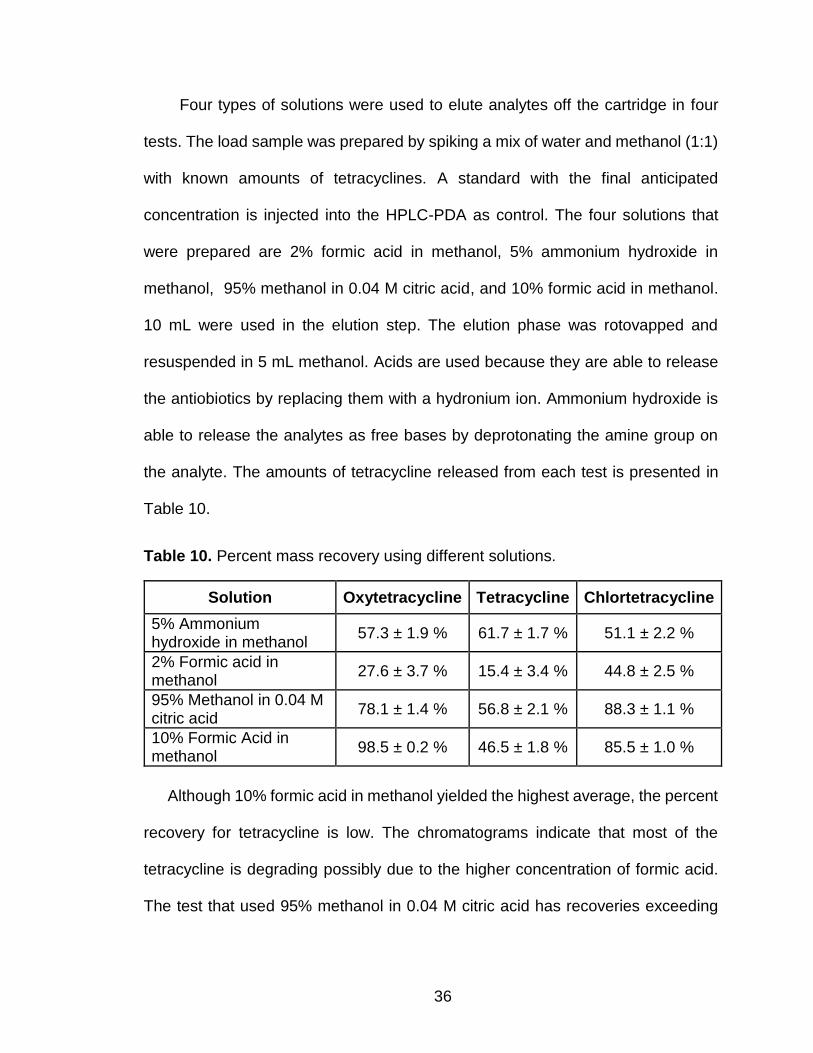
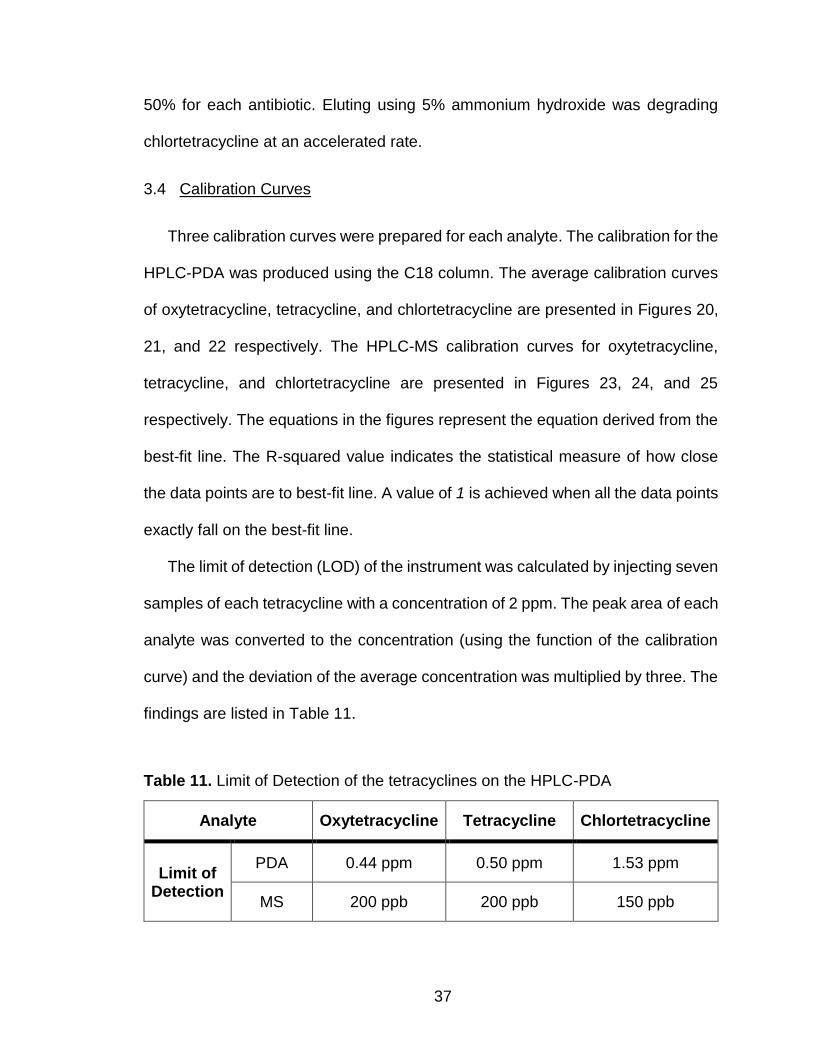
Figure 15, 16, and 17 present 461, 445, and 479 (corresponding to oxytetracycline,
tetracycline, and chlortetracycline respectively) filtered precursor ions
chromatograms extracted from a full scan chromatogram of a mixture standard.
33
Figure 15. Oxytetracycline’s filtered chromatogram at m/z 461.
Figure 16. Tetracycline’s filtered chromatogram at m/z 445.
Figure 17. Chlortetracycline’s filtered chromatogram at m/z 479.
0.0
0.5
1.0
1.5
2.0
0 1 2 3 4 5 6 7
×10
6C
ounts
(A
rbitra
ry U
nits)
Time (minutes)
0.0
0.4
0.8
1.2
1.6
2.0
0 1 2 3 4 5 6 7
×10
6C
ounts
(A
rbitra
ry U
nits)
Time (minutes)
0.0
0.5
1.0
1.5
2.0
2.5
3.0
3.5
4.0
0 1 2 3 4 5 6 7
×10
6C
ounts
(A
rbitra
ry U
nits)
Time (minutes)

34
3.3 Cartridge Performance with Non-Complex Matrix
Fractional elution was used to determine the elution sequence of the antibiotics.
Ten elutions of two-mL 2% formic acid in water were collected and each was
analyzed to track the release of the antibiotics. Table 9 shows the percentage of
the antibiotics released from each elution cumulatively. The amount released of
the total mass from a given elution is shown in the parenthesis.
Table 9. Percent recovered from the cartridge per 2-mL elution.
Oxytetracycline is released first. The hydroxyl group on the antibiotic is
responsible for creating a more electronegative site on the molecule resulting in its
solubility increase due to the increased hydrogen-bonding interactions between
the hydroxyl group and the solvent. Tetracycline and chlortetracycline have very
similar behavior. The release of the antibiotics can be transcribed into a graph
showing how the tetracyclines can be released in an orderly fashion as presented
in Figure 18.
Elution # Oxytetracycline Tetracycline Chlortetracycline
1 0.2% (0.2%) 0.0% (0.0%) 0.0% (0.0%)
2 11.7% (11.5%) 0.0% (0.0%) 0.0% (0.0%)
3 72.7% (61.0%) 2.3% (2.3%) 0.0% (0.0%)
4 95.7% (23.0%) 7.9% (5.6%) 8.0% (8.0%)
5 98.1% (2.4%) 37.6% (29.7%) 41.5% (33.5%)
6 98.5% (0.4%) 68.7% (31.1%) 72.9% (31.4%)
7 98.9% (0.4%) 86.7% (18.0%) 88.7% (15.8%)
8 99.2% (0.3%) 93.5% (6.8%) 94.4% (5.7%)
9 99.6% (0.4%) 96.8% (3.3%) 97.2% (2.8%)
10 99.8% (0.2%) 97.0% (0.2%) 97.5% (0.3%)

35
Figure 18. Percent recovered from the cartridge (cumulative)
Because the matrix that was used in the percent recovery experiment is only
water, more complex matrices act differently because they do not act like water.
For example, extracting antibiotics from a cleaner matrix might yield higher
recoveries than extracting antibiotics from swine waste matrix. The total percent
mass released per elution was derived from each elution. The function of the plot
shown in Figure 19 resembles that of an HPLC chromatogram, indicating that the
SPE cartridge elutes the analytes the same way that of an HPLC column.
Figure 19. Percent recovered from the cartridge (per elution).
0%
20%
40%
60%
80%
100%
0 1 2 3 4 5 6 7 8 9 10
Perc
ent
Recovery
(to
tal)
Fractional Elution Number
Oxytetracycline Tetracycline Chlortetracycline
0%
10%
20%
30%
40%
50%
60%
70%
0 2 4 6 8 10Perc
ent
Recovery
(per
Elu
tion)
Fractional Elution Number
Oxytetracycline Tetracycline Chlortetracycline
36
Four types of solutions were used to elute analytes off the cartridge in four
tests. The load sample was prepared by spiking a mix of water and methanol (1:1)
with known amounts of tetracyclines. A standard with the final anticipated
concentration is injected into the HPLC-PDA as control. The four solutions that
were prepared are 2% formic acid in methanol, 5% ammonium hydroxide in
methanol, 95% methanol in 0.04 M citric acid, and 10% formic acid in methanol.
10 mL were used in the elution step. The elution phase was rotovapped and
resuspended in 5 mL methanol. Acids are used because they are able to release
the antiobiotics by replacing them with a hydronium ion. Ammonium hydroxide is
able to release the analytes as free bases by deprotonating the amine group on
the analyte. The amounts of tetracycline released from each test is presented in
Table 10.
Table 10. Percent mass recovery using different solutions.
Although 10% formic acid in methanol yielded the highest average, the percent
recovery for tetracycline is low. The chromatograms indicate that most of the
tetracycline is degrading possibly due to the higher concentration of formic acid.
The test that used 95% methanol in 0.04 M citric acid has recoveries exceeding
Solution Oxytetracycline Tetracycline Chlortetracycline
5% Ammonium hydroxide in methanol
57.3 ± 1.9 % 61.7 ± 1.7 % 51.1 ± 2.2 %
2% Formic acid in methanol
27.6 ± 3.7 % 15.4 ± 3.4 % 44.8 ± 2.5 %
95% Methanol in 0.04 M citric acid
78.1 ± 1.4 % 56.8 ± 2.1 % 88.3 ± 1.1 %
10% Formic Acid in methanol
98.5 ± 0.2 % 46.5 ± 1.8 % 85.5 ± 1.0 %
37
50% for each antibiotic. Eluting using 5% ammonium hydroxide was degrading
chlortetracycline at an accelerated rate.
3.4 Calibration Curves
Three calibration curves were prepared for each analyte. The calibration for the
HPLC-PDA was produced using the C18 column. The average calibration curves
of oxytetracycline, tetracycline, and chlortetracycline are presented in Figures 20,
21, and 22 respectively. The HPLC-MS calibration curves for oxytetracycline,
tetracycline, and chlortetracycline are presented in Figures 23, 24, and 25
respectively. The equations in the figures represent the equation derived from the
best-fit line. The R-squared value indicates the statistical measure of how close
the data points are to best-fit line. A value of 1 is achieved when all the data points
exactly fall on the best-fit line.
The limit of detection (LOD) of the instrument was calculated by injecting seven
samples of each tetracycline with a concentration of 2 ppm. The peak area of each
analyte was converted to the concentration (using the function of the calibration
curve) and the deviation of the average concentration was multiplied by three. The
findings are listed in Table 11.
Table 11. Limit of Detection of the tetracyclines on the HPLC-PDA
Analyte Oxytetracycline Tetracycline Chlortetracycline
Limit of Detection
PDA 0.44 ppm 0.50 ppm 1.53 ppm
MS 200 ppb 200 ppb 150 ppb

38
Figure 20. HPLC-PDA calibration curve of oxytetracycline.
Figure 21. HPLC-PDA calibration curve of tetracycline.
Figure 22. HPLC-PDA calibration curve of chlortetracycline.
y = 0.0802x - 0.2117R² = 0.9919
0
1
2
3
4
5
6
7
8
9
10
0 20 40 60 80 100
Are
a (
×10
6µ
V s
ec)
Concnetration (ppm)
y = 0.0701x - 0.3237R² = 0.9976
0
1
2
3
4
5
6
7
0 20 40 60 80 100
Are
a (
×10
6µ
V s
ec)
Concnetration (ppm)
y = 0.0656x - 0.1562R² = 0.9973
0
1
2
3
4
5
6
7
0 20 40 60 80 100
Are
a (
×10
6µ
V s
ec)
Concnetration (ppm)

39
Figure 23. HPLC-MS calibration curve of oxytetracycline.
Figure 24. HPLC-MS calibration curve of tetracycline.
Figure 25. HPLC-MS calibration curve of chlortetracycline.
y = 2.5672x - 0.2659R² = 0.9994
0
2
4
6
8
10
12
14
16
18
20
0 1 2 3 4 5 6 7 8
×10
5C
ounts
(A
rbitra
ry U
nits)
Concecntration (ppm)
y = 2.3264x - 0.1858R² = 0.9977
0
2
4
6
8
10
12
14
16
18
0 1 2 3 4 5 6 7 8
×10
5C
ounts
(A
rbitra
ry U
nits)
Concecntration (ppm)
y = 7.7568x + 1.0882R² = 0.9984
0
10
20
30
40
50
60
0 1 2 3 4 5 6 7 8
×10
5C
ounts
(A
rbitra
ry U
nits)
Concecntration (ppm)

40
3.5 Waste Sample Analysis
Because analysis using HPLC-PDA cannot qualitatively confirm that the
antibiotics are present in the sample, this experiment was performed to analyze
the percent recovery of the analytes in swine waste matrix only; it does not
anticipate the presence of the antibiotics in the swine waste sample.
Swine waste contains contaminants and solid particulates that must be
removed before it can be analyzed. Recovering tetracyclines is more complex in
the swine waste matrix. Two samples were prepared undergoing the same
procedure of extraction. However, the second sample was prepared by spiking it
with tetracyclines with known concentrations.
1.0 mL of swine waste was mixed with 3 mL of pure methanol, vortex mixed for
two minutes, and centrifuged at 4,500 rpm for 10 minutes to remove solid
particulates and contaminants. The supernatant was extracted and separated from
the solids.
The amounts of oxytetracycline, tetracycline, and chlortetracycline spiked into
the matrix of swine waste were 148.5 mg, 78.0 mg, and 129.8 mg respectively.
The final elution volume was five-mL that results the concentration of
oxytetracycline, tetracycline, and oxytetracycline to be 29.7 ppm, 15.6 ppm, and
26.0 ppm if 100% of the tetracyclines were recovered in the five mL elution phase.
A standard with the previously mentioned concentration was injected in the HPLC-
PDA as a control.

41
Both samples underwent SPE simultaneously using the same method. The
elution solvent used in this experiment was 10% formic acid in methanol. Figure
26 presents the percent recovered of the antibiotics from the swine waste.
Figure 26. Percent recovery of tetracyclines in a swine waste matrix.
The difference between the area of the specific tetracycline peak of the spiked
elution and the native elution was divided by the control standard to calculate the
percent recovery in the swine matrix. The resulting recoveries for oxytetracycline,
tetracycline, and chlortetracycline were 99.2 ± 0.4 %, 35.5 ± 2.7%, and 77.6 ± 1.2%
respectively. The deviation is lower when the recovery was higher and vice versa.
The high percentage of formic acid accelerates the degradation of tetracycline in
the samples. Thus, the recovery of tetracycline is not specifically low because it is
retaining to the cartridge but possibly because it is degrading faster when it was
being eluted with the 10% formic acid in methanol solution.
0%
20%
40%
60%
80%
100%
Oxytetracycline Tetracycline Chlortetracycline
Perc
ent
Recovery
42
A native swine sample was analyzed with the HPLC-MS for qualitative results.
Tetracycline and chlortetracycline have been detected qualitatively on the HPLC-
MS system. Oxytetracycline was not detected. Chlortetracycline is detected at a
higher relative concentration than tetracycline. A 10 ppm control standard mix was
injected into the HPLC-MS and the peak area was compared to the peaks found
in the native swine waste sample. The use of more swine waste may confirm the
existence of oxytetracycline but it might possibly contaminate the MS system.
Digester waste obtained had a cleaner matrix than the swine waste matrix. The
waste was mostly composed of liquid and very little solids. The matrix underwent
standard SPE. The elution solution used in the digester waste analysis composed
of two elution tests. The first elution used five mL of 10% formic acid in methanol.
The cartridge was then dried to remove excess solvents. Five mL of 10%
ammonium hydroxide was used to re-elute what was left on the cartridge. Both
samples were rotovapped, reconstituted in (five mL) pure methanol, and combined
for analysis.
Using the HPLC-PDA to analyze the digester waste samples, the peaks that
appear on the HPLC-PDA have approximately 95% smaller area than that of the
swine waste. When they were analyzed in an HPLC-MS, the peaks in the swine
waste and the digester waste corresponded to m/z values of 453 and 475. The
feed of the swine was analyzed and a sample underwent SPE and both m/z values
are present indicating that these compounds transferred from the feed to the swine
waste. Although the peaks have not corresponded to the analytes, this finding

43
suggests the reduction in the amounts of contaminants in the anaerobic digester
waste.
Using the HPLC-MS to qualitatively detect tetracyclines, it was found that the
concentration of oxytetracycline in the sample was below the limit of detection. A
possibility of its presence at a much lower concentration is probable. However, it
is not detectable unless the sample size is increased. On the other hand,
chlortetracycline’s peak was present and it was detected using the HPLC-MS but
at lower concentration than chlortetracycline in swine waste. The sample was
injected with an internal standard to calculate the concentration of
chlortetracycline. Chlortetracycline (m/z 479) retains at 8 minutes (Figure 27).
Chlortetracycline is added to the sample as a spike with a final concentration of 1
ppm, which resulted in the increase of chlortetracycline’s peak area (Figure 28).
Figure 27. MS Chromatogram of native digester waste elution.
Chlortetracycline
0
0.5
1
1.5
2
2.5
3
3.5
4
0 1 2 3 4 5 6 7 8 9 10
×10
4C
ounts
(A
rbitra
ty U
nits)
Time (minutes)
44
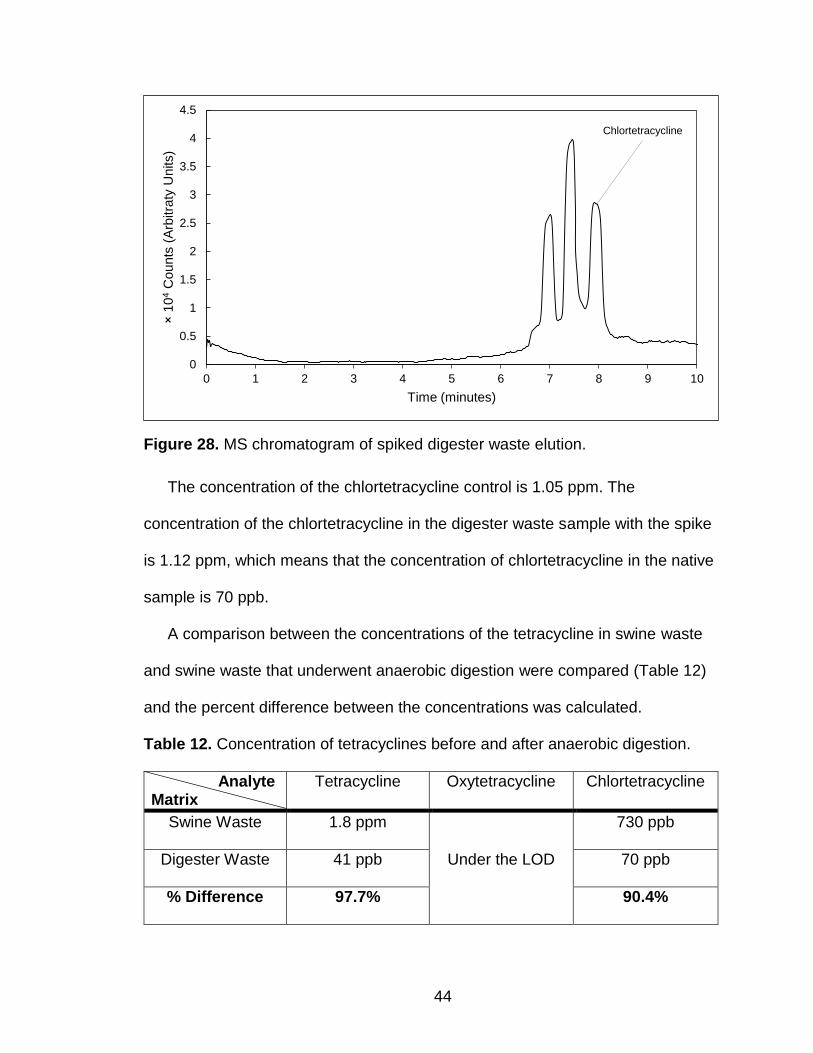
Figure 28. MS chromatogram of spiked digester waste elution.
The concentration of the chlortetracycline control is 1.05 ppm. The
concentration of the chlortetracycline in the digester waste sample with the spike
is 1.12 ppm, which means that the concentration of chlortetracycline in the native
sample is 70 ppb.
A comparison between the concentrations of the tetracycline in swine waste
and swine waste that underwent anaerobic digestion were compared (Table 12)
and the percent difference between the concentrations was calculated.
Table 12. Concentration of tetracyclines before and after anaerobic digestion.
Analyte Matrix
Tetracycline Oxytetracycline Chlortetracycline
Swine Waste 1.8 ppm
Under the LOD
730 ppb
Digester Waste 41 ppb 70 ppb
% Difference 97.7% 90.4%
Chlortetracycline
0
0.5
1
1.5
2
2.5
3
3.5
4
4.5
0 1 2 3 4 5 6 7 8 9 10
×10
4C
ounts
(A
rbitra
ty U
nits)
Time (minutes)
45
3.6 Oxytetracycline in Hog Feed
The goal of this experiment is to be able to trace oxytetracycline in the feed. 25
grams of the feed was used because 25 grams would yield 50 ppm of
oxytetracycline in 5 mL if 100% of the oxytetracycline is released from the SPE
cartridge. The extractions had a very dark brown hue due to the amounts of
compounds concentrated in 5 mL (from 25 g). 10% formic acid in methanol was
used. The chromatogram does not show oxytetracycline. A spike was added to
locate oxytetracycline in the chromatogram. The chromatogram of the elution
indicates that oxytetracycline is under the detection limit (under 0.44 ppm). This is
an indication that oxytetracycline is binding to the cartridge and has not been
released because less than 1% has been released. The amounts of contaminants
and other molecules found in the feed play a major role in binding the analyte to
the cartridge.
The same sample was injected into the HPLC-MS. The peaks that were found
in both, swine waste and digester waste samples are present in the feed. Those
compounds correspond to 453 and 475.
46
4 Conclusion
In conclusion, the SPE method was mostly successful in extracting the
antibiotics if they were present in the swine waste samples. The selection of a
solution to elute the analytes off the cartridges depends on several factors. If
tetracycline, then eluting with 10% formic acid in methanol deemed most useful
because it released over 77% of both chlortetracycline and tetracycline. If
tetracycline is in the sample, then eluting with 95% methanol in 0.04 M citric acid
is estimated to be useful because it does not react or degrade the antibiotics at a
high rate. Using 2% formic acid in methanol is not useful as the recoveries are
lower than 50% (for all tetracyclines) which resulted in higher deviation in the
results.
The detection of the tetracyclines was not successful using HPLC-PDA due to
the amount of contaminants in the swine samples. If the tetracyclines were
present, they were coeluting with contaminants which made their detection not
confirmable. This is due to the relatively high concentration of the contaminants
compared to the concentration of the tetracyclines. HPLC-MS is capable of
detecting and confirming their presence. An HPLC-PDA can be deemed useful if
the tetracyclines can be further purified by releasing as much contaminants as
possible.
Although, the extractions are more complex in more contaminated matrices,
the extractions were overall successful, as they have detected the existence of
chlortetracycline in both the swine waste sample and the anaerobic digester

47
sample. In addition, it was confirmed that the swine waste contains tetracycline.
Oxytetracycline was not detected in either the swine waste or the digester waste.
Preliminary results indicate that the concentration of detected antibiotics in swine
waste is higher than that in the digester waste. If this is the case, digester waste
can spread antibiotics and can contribute to spreading antibiotic resistance, but it
may be safer to digest waste to break down the tetracyclines and reduce the
spread of the antibiotics and antibiotic resistant bacteria into the environment.

48
5 Bibliography
1. Jones, N. Tetracyclines in Swine Waste. WKU Top Scholar.
2. Antibiotics: If This Doesn’t Convince You, Nothing Will. GRACE
Communications Foundation.
3. Anaerobic Digestion: Biogas Production and Odor Reduction from Manure.
Penn State Extensions.
4. Shrestha, T. Classes of Antibiotics and their Properties. My Scientific Blog -
Research and Articles.
5. Houlihan, A. J. (2003) The susceptibility of ionophore-resistant Clostridium
aminophilum-F to other antibiotics. Journal of Antimicrobial Chemotherapy
52, 623–628.
6. Antibiotic Resistance Questions and Answers. Get Smart: Know When
Antibiotics Work. Centers for Disease Control and Prevention.
7. Mellon M, Benbrook C, Benbrook K L (2001). Hogging It: Estimates of
Antimicrobial Abuse in Livestock.
8. Testimony - Antibiotic Resistance and the Use of Antibiotics in Animal
Agriculture https://www.fda.gov/NewsEvents/Testimony/ucm219015.htm
(accessed Feb 23, 2017).
9. Antibiotic resistance: Are we heading back to pre-penicillin era? SQ Online.
University of California San Diego.
10. Klajn, R. Tetracycline - Molecule of the Month. Tetracycline - Molecule of the
Month.

49
Bibliography (continued)
11. Tetracycline - Antimicrobial properties. University of Bristol.
12. How bacteria become resistant. How bacteria become resistant. Australian
Broadcasting Corporation.
13. Tetracycline Monograph for Professionals. Drugs.com.
14. Chopra, I., and Roberts, M. (2001) Tetracycline Antibiotics: Mode of Action,
Applications, Molecular Biology, and Epidemiology of Bacterial Resistance.
Microbiology and Molecular Biology Reviews 65, 232–260.
15. Li, Z., Xu, K., Liang, B., and Li, Y. (2013) Determination of trace tetracyclines
in surface water by aluminum hydroxide coprecipitation coupled with high-
performance liquid chromatography. Analytical Methods 5, 3516.
16. Ravinsankar, P. Tetracyclines. in® Slide Share.
17. Harvey, D. (2016, December 24) Classifying Separation Techniques.
Chemistry LibreTexts.
18. How Does High Performance Liquid Chromatography Work? Waters: The
Science of What's Possible.
19. Gates, P. High Performance Liquid Chromatography Mass Spectrometry
(HPLC/MS). Bristol University - School of Chemistry.
20. X-CW, Weak Cation Mixed Mode Phase Detail. Strata-X. Phenomenex.
21. Laboratory Supplies & Lab Equipment - Centrifuges, Lab Apparatus, Lab
Glass, pH Meters, Labware, Medical Supplies & More. Labplanet Blog.
22. Differences Between Using Acetonitrile and Methanol for Reverse Phase
Chromatography. SHIMADZU (Shimadzu Corporation).
50
Bibliography (continued)
23. Higgins, S. A., Welsh, A., Orellana, L. H., Konstantinidis, K. T., Chee-Sanford,
J. C., Sanford, R. A., Schadt, C. W., and Löffler, F. E. (2016) Detection and
Diversity of Fungal Nitric Oxide Reductase Genes (p450nor) in Agricultural
Soils. Applied and Environmental Microbiology Appl. Environ. Microbiol. 82,
2919–2928.
24. Petrović, M., Hernando, M. D., Díaz-Cruz, M. S., and Barceló, D. (2005)
Liquid chromatography–tandem mass spectrometry for the analysis of
pharmaceutical residues in environmental samples: a review. Journal of
Chromatography A 1067, 1–14.
25. Till, A. E. (2003) Comment on “Pharmaceuticals, Hormones, and Other
Organic Wastewater Contaminants in U.S. Streams, 1999−2000: A National
Reconnaissance.” Environmental Science & Technology Environ. Sci.
Technol. 37, 1052–1053.
26. Zhang, G., Liu, X., Sun, K., Zhao, Y., and Lin, C. (2010) Sorption of
tetracycline to sediments and soils: assessing the roles of pH, the presence
of cadmium and properties of sediments and soils. Frontiers of Environmental
Science & Engineering in China 4, 421–429.
27. Sun, J., Li, L., Liu, B., Xia, J., Liao, X., and Liu, Y. (2014) Development of
aminoglycoside and β-lactamase resistance among intestinal microbiota of
swine treated with lincomycin, chlortetracycline, and amoxicillin. Front.
Microbiol. Frontiers in Microbiology 5.

51
Bibliography (continued)
28. Wang, X., Pan, H., Gu, J., Qian, X., Gao, H., and Qin, Q. (2016) Effects of
oxytetracycline on archaeal community, and tetracycline resistance genes in
anaerobic co-digestion of pig manure and wheat straw. Environmental
Technology 37, 3177–3185.
29. Wang, H.-X., Zhou, Y., and Jiang, Q.-W. (2012) Simultaneous Analysis of
Nine Estrogens in Milk Powder with Ultra Performance Liquid
Chromatography Coupled Quadrupole Time-of-Flight Mass Spectrometry.
Chinese Journal of Analytical Chemistry (Chinese Version) 39, 1323–1328.
30. Tsai, W.-H., Huang, T.-C., Huang, J.-J., Hsue, Y.-H., and Chuang, H.-Y.
(2009) Dispersive solid-phase microextraction method for sample extraction
in the analysis of four tetracyclines in water and milk samples by high-
performance liquid chromatography with diode-array detection. Journal of
Chromatography A 1216, 2263–2269.
31. Burch, D. G. (2014) Effects of tetracycline and zinc on selection of methicillin-
resistant Staphylococcus aureus (MRSA) sequence type 398 in pigs
(Moodley et al., 2011). Veterinary Microbiology 173, 398–400.
32. Hu, X., Pan, J., Hu, Y., Huo, Y., and Li, G. (2008) Preparation and evaluation
of solid-phase microextraction fiber based on molecularly imprinted polymers
for trace analysis of tetracyclines in complicated samples. Journal of
Chromatography A 1188, 97–107.
52
Bibliography (continued)
33. Wang, J., Xiong, L., Zhang, H., Wang, L., Jin, J., and Chen, J. (2014)
Simultaneous determination of benzotriazoles and benzothiazole in surface
water by solid phase extraction and high performance liquid chromatography.
Chinese Journal of Chromatography 31, 139–142.
34. Lacroix, J.-M., and Walker, C. B. (1995) Detection and Incidence of the
Tetracycline Resistance Determinant tet (M) in the Microflora Associated with
Adult Periodontitis. Journal of Periodontology 66, 102–108.
35. Becic, E., Imamovic, B., Dedic, M., and Sober, M. (2014) SPE extraction and
TLC identification of Tetracycline and Fluoroquinolone in Surface Water.
Bulletin of the Chemists and Technologists of Bosnia and Herzegovina.
36. Spietelun, A., Pilarczyk, M., Kloskowski, A., and Namieśnik, J. (2010) Current
trends in solid-phase microextraction (SPME) fibre coatings. Chemical
Society Reviews 39, 4524.
37. Barkovskii, A., Manoylov, K., and Bridges, C. (2012) Positive and negative
election towards tetracycline resistance genes in manure treatment lagoons.
Journal of Applied Microbiology 112, 907–919.
38. Li, L., Sun, J., Liu, B., Zhao, D., Ma, J., Deng, H., Li, X., Hu, F., Liao, X., and
Liu, Y. (2013) Quantification of lincomycin resistance genes associated with
lincomycin residues in waters and soils adjacent to representative swine
farms in China. Front. Microbiol. Frontiers in Microbiology 4.
53
Bibliography (continued)
39. Chee-Sanford, J. C., Aminov, R. I., Krapac, I. J., Garrigues-Jeanjean, N., and
Mackie, R. I. (2001) Occurrence and Diversity of Tetracycline Resistance
Genes in Lagoons and Groundwater Underlying Two Swine Production
Facilities. Applied and Environmental Microbiology 67, 1494–1502.
40. Storteboom, H., Arabi, M., Davis, J. G., Crimi, B., and Pruden, A. (2010)
Tracking Antibiotic Resistance Genes in the South Platte River Basin Using
Molecular Signatures of Urban, Agricultural, And Pristine Sources.
Environmental Science & Technology Environ. Sci. Technol. 44, 7397–7404.