detecting postmenopausal osteoporosis by using pixel
TRANSCRIPT

University of ConnecticutOpenCommons@UConn
SoDM Masters Theses School of Dental Medicine
June 2002
Detecting Postmenopausal Osteoporosis by UsingPixel Intensity of Digital Panoramic ImagesRa'ed Al-Sadhan
Follow this and additional works at: https://opencommons.uconn.edu/sodm_masters
Recommended CitationAl-Sadhan, Ra'ed, "Detecting Postmenopausal Osteoporosis by Using Pixel Intensity of Digital Panoramic Images" (2002). SoDMMasters Theses. 13.https://opencommons.uconn.edu/sodm_masters/13

DETECTING POSTMENOPAUSAL OSTEOPOROSIS BYUSING PIXEL INTENSITY OF DIGITAL PANORAMIC
IMAGES
Ra’ed A1-Sadhan
B.D.S., King Saud University, 1996
A Thesis
Submitted in Partial Fulfillment for the
Requirements for Degree of
Master of Dental Sciences
at the
University of Connecticut
2002

APPROVAL PAGE
Master of Dental Sciences Thesis
DETECTING POSTMENOPAUSAL OSTEOPOROSIS BY USING PIXELINTENSITY OF DIGITAL PANORAMIC IMAGES
Presented by
Ra’ed A1-Sadhan, B.D.S.
Major AdvisorAlan G. Lurie
Associate Advisor
Associate Advisor
JJo,nne Srnth.
Ann Cowan
University of Connecticut
2002

Acknowledgement
I am grateful to Almighty God for giving me strength to complete this project and
for giving me the opportunity to work with such tremendous people who supported me all
the way.
To my mother and father, your tender care and constant encouragement helped
make this project a reality.
To Doctor Alan Lurie, I thank you for inspiring and challenging me to accomplish
this task. Your insight and encouragement throughout the entire study process provided
me with a memorable experience that I’ll carry with me throughout life.
To Doctor Jo-Ann Smith, your attention to detail, your critical analysis of the
scientific process, your passion for excellence, your creative insight into interpreting the
epidemiological data as well as your technical help in preparing this manuscript, made
this project possible.
To Doctor Ann Cowan, thank you for your enthusiastic support during all phases
of my research. Your research skills in analyzing digital images have helped me a great
deal. Thanks so much.
To Doctor Kamal Shoukri for his help in designing and conducting this study.
To Doctor Suliman A1 Emran, Dean of the Collage of Dentistry, King Saud
University, thank you for believing in me and giving me the time and support I needed to
do my postgraduate studies.
I am grateful to Doctor Lawrence Raisz, Director of the General Clinical
Research Center at the University of Connecticut Health Center for the tremendous
iii

support that you gave me throughout this research process. I deeply appreciate your
guidance, financial support and wisdom throughout the entire research process.
I am also grateful to the American Academy of Oral and Maxillofacial Radiology
for awarding me the Albert G. Richards Graduate Student Research Grant for the year
2000 which helped in funding this research project.
To Ms. Susan Kirchhof, the Clinical Supervisor of the Oral and Maxillofacial
Radiology clinic and to all the faculty and staff in department, and to the staff of the
Claude Pepper Older Americans Independence Center at the University of Connecticut
Health Center, thank you for the unhindered use of your clinics. Without this, my project
would not have been possible.
To Christine Ohannessian, thank you very much for your enthusiastic support for
my project. I am deeply indebted to you for your guidance and statistical expertise. Thank
yOU.
iv

Table of Contents
Page
Acknowledgement iii
Table of Contents
List of Tables vi
List of Figures vii
Introduction
Materials and methods
Results 13
Discussion 15
Tables 20
Figures 29
References 32

List of Tables
Table Page
TABLE 1. Descriptive statistics of subjects. 20
TABEL 2. Correlation between aluminum balls pixel intensity values. 21
TABEL 3. Pixel intensity descriptive statistics. 22
TABEL 4. Correlation between mandibular pixel intensity values and othervariables in the osteoporotic group.
23
TABEL 5. Correlation between mandibular pixel intensity values and othervariables in the osteopenic group.
24
TABEL 6. Correlation coefficient between mandibular pixel intensity valuesand other variables in the normal group.
25
TABEL 7. Correlation between mandibular pixel intensity values and othervariables in osteoporotic subjects not on HRT and with at least 4teeth in occlusion.
26
TABEL 8. Correlation between mandibular pixel intensity values and othervariables in osteopenic subjects not on HRT and with at least 4teeth in occlusion.
27
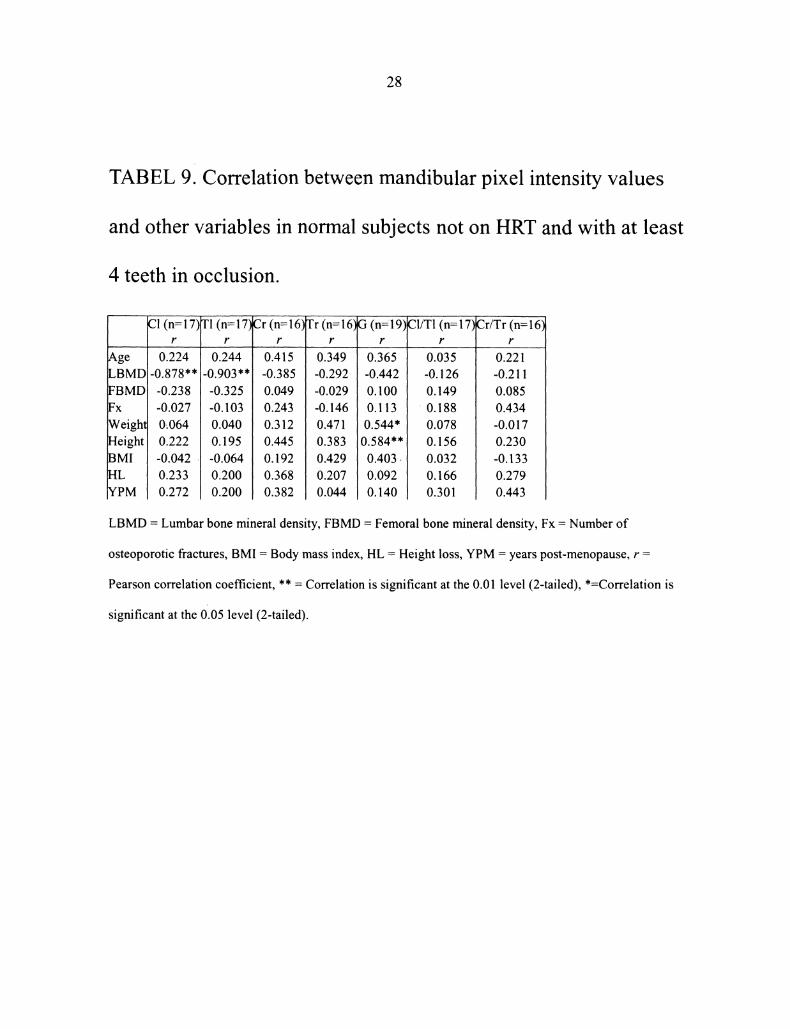
TABEL 9. Correlation between mandibular pixel intensity values and othervariables in normal subjects not on HRT and with at least 4 teethin occlusion.
28
vi

List of Figures
Figure Page
FIGURE 1. Relationship between BMD T-score and fracture risk. 29
FIGURE 2. Position of the aluminum balls. 30
FIGURE 3. Pixel intensity measurement sites. 31
vii


Introduction
The term "osteoporosis" is derived from the classical Greek word "osteon"
meaning bone, "poros" meaning a small passage or pore, and "osis" meaning condition
The term is descriptive of the changes in bone tissue found in this generalized skeletal
disease. The modem definition of osteoporosis is "a skeletal disorder characterized by
compromised bone strength predisposing to increased risk of fracture ’’2.
Many terms have been used to describe the radiographic sign of diminished bone
density, such as "osteoporosis", "demineralization", "undermineralization",
"deossification", and "osteopenia’’3. The WHO has suggested that the terms osteoporosis
and osteopenia should be used to describe specific losses ofbone density below the
normal age sex-matched population. However, the terms are still widely used without
these precise definitions. For example "osteopenia" (meaning poverty of bone) is
commonly used as.an acceptable, nonspecific, gross descriptive term for generalized or
regional rarefaction of the skeleton. The radiographic finding of generalized loss of bone
density (osteopenia) is not specific and in fact can be seen in various conditions like
senile osteoporosis, postmenopausal osteoporosis, diabetes mellitus, hyperparathyrodism,
metastatic diseases, and in steroid therapy patients4.
Osteoporosis associated with postmenopausal or senile states represent the most
common metabolic bone disorder. It usually begins around the fifth decade in women and
the sixth decade in men as gradual loss of skeletal mass which amounts to approximately
3-10% per decade 3, the loss is much greater in women than in men. This process appears
to be influenced by many factors such as genetic determinants, size of the skeleton

achieved during growth and development, level of activity and exercise, nutritional
status, and, importantly, gonadal hormones, particularly estrogen in women.
Primary osteoporosis can be classified on the basis of clinical features and
fracture pattems in to two types5"
Type I (postmenopausal) osteoporosis is identified by gradual loss of skeletal
mass and a fracture pattern involving vertebral bodies (crash fracture) and, frequently, the
distal radius (Colles’ fracture). Patient in this group are generally women within 20 years
after menopause: This fracture pattern appears to be the result of excessive loss of
trabecular bone, which may be three times the bone loss seen in normal women.
Type II (senile) osteoporosis is identified by gradual loss of skeletal mass and
fractures involving mainly the hip and vertebrae, although fractures may also occur at
other sites. Patients with senile osteoporosis include both men and women over 75 years
of age. A proportionate loss ofboth cortical and trabecular bone is believed to be
responsible for this fracture pattern.
In recent years, the widespread availability of bone densitometry systems has led
to working definitions of osteoporosis that are increasingly based on measurements of
bone mineral density (BMD). In particular, in 1994 a World Health Organization (WHO)
study group recommended a definition of osteoporosis that was based on a BMD
measurement of the spine, hip, or forearm expressed in SD units called T-scores 6, 7. The
WHO report also proposed creating an intermediate category characterized by low bone
mass between the normal and osteoporotic states and referred to as "osteopenia". The T-
score is calculated by taking the difference between a patient’s measured BMD and the

mean BMD of healthy young adults, matched for gender and ethnic group, and
expressing the difference relative to the young adult population SD"
T-score Measured BMD young adult mean BMD/young adult SD.
Therefore, a T-score result indicates the difference between the patient’s BMD and the
ideal peak bone mass achieved by a young adult. The WHO definitions of osteoporosis
and osteopenia are based on T-score values such that an individual with a T-score <-2.5
at the spine, hip, or forearm is classified as having osteoporosis; a T-score between -2.5
and -1 is classified as osteopenia; and a T-score >-1 is regarded as healthy. A fourth
category of"established osteoporosis" was also proposed to denote osteoporosis as
defined above but in the presence of one or more documented fragility fractures, usually
of the wrist, spine, or hip. The WHO study group definitions of osteoporosis, osteopenia,
and healthy are intended only to identify patients with high, intermediate, and low risk of
fracture, respectively (Figure 1).
Osteoporosis is a major public health threat for 28 million Americans, 80% of
whom are women. In the U.S. today, 4-6 million women already have osteoporosis and
13-17 million more have low bone mass, placing them at increased risk for this disease.
One out of every two women and one in eight men over 50 will have an osteoporosis-
related fracture in their lifetime. More than 2 million American men suffer from
osteoporosis, and millions more are at risk. Each year, 80,000 men suffer a hip fracture
and one-third of these men die within a year. Osteoporosis is responsible for more than
1.5 million fractures annually, including 300,000 hip fractures, and approximately
700,000 vertebral fractures, 250,000 wrist fractures, and more than 300,000 fractures at
other sites. Estimated national direct expenditures (hospitals and nursing homes) for

osteoporosis and related fractures is $14 billion each years. This figure is expected to
rise to between $30 and $ 40 billion by the year 2020 . Of these costs, about two thirds
are attributable to hip fractures. In addition to incumng greater costs, hip fractures also
cause greater morbidity and mortality than other types of fractures, one quarter of hip-
fracture patients die within a year after their fracture 12, and survivors frequently suffer
sustained disability and loss of independence 13.
Early detection ofbone loss may identify people at an increased risk for
osteoporotic fractures and enable them to take preventative measures. Studies suggest
that bone mineral density (BMD) is the single most important determinant ofbone
fragility 14, 15. Several methods have been developed for evaluating BMD, including
quantitative computed tomography (QCT), single and dual-photon absorptiometry (SPA
and DPA), neutron activated analysis, dual energy x-ray absorptiometry (DXA) and
Ultrasound.
Over the past decade, DXA has established itself as the most widely used method
of measuring BMD because of its advantages of high precision, short scan times and
stable calibration in clinical use 16. The principle of dual energy x-ray absorptiometry
measurements is based on the fact that radiation of distinct energies is attenuated by
tissues to different extents. In both soft tissue and bone, a low energy beam is attenuated
to a greater degree than a high energy beam. Contrast in attenuation between bone and
soft tissue is greater for the low energy beam than forthe high energy beam. By entering
both attenuation profiles into an equation system, an attenuation profile of the bony
components can be calculated. The use of an x-ray system rather than a radionuclide
source results in shorter scan time, lower radiation dose, greater accuracy and precision,

higher resolution, and the lack of radionuclide decay. Additional technical improvements,
such as intemal calibration, have helped to improve DXA accuracy and precision further.
The usual central skeletal locations for DXA measurements are the lumbar spine,
proximal femur, and total body.
Densitometry is currently recommended for high-risk populations (thin, small-
boned Caucasian or Asian postmenopausal females with family history of osteoporosis)’
but this test is relatively expensive, not readily available, and the risk factors are not
reliable in identifying the population with low bone density or predict the likelihood of an
osteoporotic fracture. There is a need for altemative, simpler-measurements for
widespread screening 17.
It has been suggested that there may be a relationship between mandibular
osteopenia and osteoporosis of the remaining skeletonls-2. If this is indeed the case, then
the widely used dental imaging modalities may have a role in detecting bone loss in the
mandibles of postmenopausal women receiving panoramic or intraoral periapical
radiographic examinations for dental care.
Previous studies comparing mandibular bone density and quality with that in
other bones in vivo have used a variety of assessment methods. These can be divided into
radiographic measurements of cortical thickness using the panoramic mandibular index
22, radiographic densitometry 23-25, DPA 20, DXA 21, and QCT ofmandible 18, 19. Homer
found strong correlations between DXA measurements ofmandibular body of healthy
edentulous females and lumbar spine, femoral neck, and forearm 21. Klemetti et al 18. 9
reported significant correlations between mandibular BMD measured by QCT and
lumbar spine and femoral neck BMD measured by DXA. White et al 26 developed a filter

to extract the skeletal patterns of trabecular jawbone and found altered patters in the
maxillas and mandibles of osteoporotic subjects. On the other hand, techniques using
subjective or objective assessments of dental radiographs 27-29 have given only weak, or
no correlations with skeletal bone density measurements. Mohajery et la 27 did not find
any significant correlation between optical densitometereric measurements of mandibular
ramus and DPA of lumbar spine. Kribbs et al 23-25 and Law et al 30 have used
densitometric evaluations of intraoral radiographs, measured on films or on digital
images of scanned films, in conjunction with SPA of the radius and DPA and QCT of the
lumbar spine. In these studies there were significant correlations between mandibular and
skeletal bone densities. In both of these studies mandibular bone densities were measured
in the crest of the alveolar ridge in the interdental bone between premolars and molars in
dentate patients. This region in addition to being subjected to odontogenic infections is
under high occlusal stresses. This could lead to false positive or false negative bone
density measurements. A panoramic radiograph has a larger area of coverage and
densitometric measurements can be obtained at the basal bone, inferior to the mental
foramen or at the inferior cortical border of the mandible, away from the crest of the
ridge.
Dental radiographs are often the only images available to examine a patient’s
bone quality. Dentists may be the first health team members to observe changes in the
bone density since they use periodic radiograph to diagnose, plan treatment, and monitor
progress of oral and maxillofacial diseases. Maxillofacial panoramic radiographs are
commonly used for this purpose. In addition to imaging both dental arches they show on
a single view a broad range of the lower facial skeleton without superimposing the fight
side on the left. The radiation dose is relatively low and the examination is relatively
convenient to the patient. They are the initial examination of choice for edentulous
patients 31. Thus, panoramic images are potentially useful in the early detection of
osteoporosis in a large population of patients.
Recently, a new version ofpanoramic machines was introduced in the market; the
Planmeca digital panoramic system, the DIMAX, uses 4 charge-coupled device (CCD)
sensors to detect x-ray instead of conventional radiographic films. It has a pixel matrix of
1024 X 64 (total, 65,536) with a pixel size of 134 X 33.5 um. There is automatic
exposure compensation on 4096 gray levels (12 bit).The resulting panoramic images have
sufficient spatial resolution (3.7 lp/mm). A radiation dose saving of60% over
conventional film-screen panoramic systems is claimed 32.
A digital image is composed of an array of small, squire or rectangular areas
known as pixels (picture elements) to which a numeric value is assigned (pixel intensity).
In digital radiographic images, pixel intensity (PI) is a measure of the black6ess or
whiteness of a pixel, in an 8 bit gray scale image, zero represents total blackness (totally
radiolucent) and 255 represents total whiteness (totally radiopaque).
This study will evaluate the relation between pixel intensity values of mandibular
trabecular and cortical basal bone and DXA measurements of lumber spine and femoral
neck in osteoporotic and controlled groups using morphometric analysis of images
acquired using a contemporary diagnostic imaging tool.
The aim of this study is to compare the digital panoramic pixel intensity values of
trabecular and cortical mandibular bone to dual energy x-ray absorptiometry
measurements of the lumber spine and femoral neck.

Null Hypothesis"
There are no differences in pixel intensity of mandibular trabecular and cortical
bones as measured from digital panoramic images and dual energy x-ray absorptiometry
measurements of lumber spine or femoral neck in postmenopausal, dentulous women
with and without postmenopausal osteoporosis.

Materials and methods
Forty five postmenopausal females, 50 to 80 years of age (mean 63.9 years) were
recruited from patients who presented for general dental care at the Screening Clinic,
School of Dental Medicine, University of Connecticut Health Center, Farmington,
Connecticut, between June and September, 2001. The study was conducted according to
guidelines established by the Institutional Review Board (IRB) at the University of
Connecticut Health Center (IRB Reference # 01-125). An informed consent was obtained
from all patients.
Inclusion criteria were: female, above the age of 50 years, with minimum of all
four upper and lower central, incisors and one mandibular canine present.
Subjects with medical conditions affecting bone density other than osteoporosis
(e.g. chronic hepatic or renal failure, hyperparathyroidism, or cancer) or subjects who
could not stand still for 1 minute (time required to position and expose the panoramic
image) were excluded.
Patients were interviewed to collect data on age, age at menopause or
ovariectomy, hight loss since youth, medical conditions, medications, and history of
recent osteoporotic fractures. A fracture is considered to be an osteoporotic fracture when
it occures in the elderly following minimal trauma: no more severe than that resulting
from falling from a standing height 33, 34
A Planmeca Proline PM 2002 CC (Planmeca USA Inc., Addison, IL) digital
panoramic unit was used in this study. To test the consistency of the machine, five
aluminum balls of different diameter (7.94mm, 6.35mm, 4.76mm, 3.175mm, and
2.38mm) were fixed with utility wax to the base of the left lateral head positioner with

10
the smallest ball toward the midline and the largest ball away from it. When the image is
acquired, the balls are seen as 5 circular areas of varying radiopacity in the lower left
comer of the panoramic image just under the angle of the mandible. The average pixel
intensity values of these areas were compared in 33 digital panoramic images.
Panoramic imaging was performed on the same day the patient was screened at
the Oral and Maxillofacial Radiology Clinic, University of Connecticut Health Center,
Farmington, Connecticut. The images were acquired at 64 kV and 6 mA by the same
operator. Just before exposure, the lateral head positioners were removed from the x-ray
machine to eliminate density interferences by plastic. Two oral and maxillofacial
radiologists reviewed the images to insure they were of acceptable diagnostic quality.
Images were stored as 12 bit uncompressed Tagged Image File Format (TIFF).
Pixel intensity measurements were made at five sites in each side of the
panoramic radiographs (Fig. 1):
Cortical region (Cr): Average imensity of a circular region in the inferior
cortical border of the mandible under the canine. The radius of the region
was equal to the thickness of the inferior cortical border of the mandible in
that area.
Trabecular region (Tr): Average intensity of a circular region, of matching
size to Cr, of trabecular bone under the canine, half the way between the
apex of the canine and inner cortical plate of the inferior border of the
mandible.
Trabecular line (T1)" Average intensity along a line from the inner cortical
plate of the inferior border of the mandible to the inferior margin of the

11
mental foramen perpendicular to the longest posterioanterior dimension of
the mental foramen.
Cortical line (C1)" Average intensity along a line from the inferior cortical
border of the mandible to the inner cortical plate of the inferior border of
the mandible, perpendicular the longest posterioanterior dimension of the
mental foramen and immediately below T1.
Gonion line (G): Average intensity along a line from the outer cortical
plate of the mandible to the inner cortical plate of the inferior border of the
mandible in the region of the gonion.
The ratio of C1 to T1 (C1/T1) and the ratio of Cr to Tr (Cr/Tr) were also calculated
for each side.
If the canine is missing in the measurement site or an impacted tooth, hyoid bone,
or cervical spine shadow was superimposed over the measurement site, the measurement
was treated as missing data.
Pixel intensity measurements were made with MetaMorph 4.5r6 software
(Universal Imaging Corp., Downingtown, PA).
Within a week of the panoramic examination, patients received lumber spine and
femoral neck DXA examinations at the Claude Pepper Older Americans Independence
Cemer at the University of Connecticut Health Center, Farmington, Connecticut using a
Lunar DPX-IQ bone densitometry unit (GE Medical Systems. Madison, WI) operated by
a certified nuclear medicine technologist.
A certified clinical densitometrist at the Claude Pepper Center reviewed and
interpreted the DXA results. Patients were divided into one of three categories, normal,

12
osteopenia and osteoporosis, by the lower DXA result of the femoral neck or lumbar
spine. Osteoporosis was determined if DXA measurement of the femoral neck or lumber
spine was less than that of a young adult reference population by two or more standard
deviations (young adult T-score<-2). Osteopenia was determined if the bone density of
the femoral neck or lumber spine was less than that of a young adult reference population
by less than two standard deviations but not more than one standard deviation (-1 >
young adult T-score >-2). A diagnosis of normal bone mineral density was made if the
bone density of the femoral neck or lumber spine was less than that of a young adult
reference population by not more than 1 standard deviation (young adult T-score>-1).
Lumbar bone mineral density values were not used if the DXA demonstrated
significant distortion related to degenerative joint disease, or scoliosis that did not allow
for an accurate BMD measurement.
Weights, heights and body mass indices (BMI) of patients were mesured at the
same visit as the DXA was aquired.
Pearson correlation coefficients (r) was used to correlate variables with normal
(parametric) distribution (skewness<2). Spearman’s rank correlation coefficient () was
used to correlate variables with non-normal (non-parametric) distribution (skewness>2).
SPSS 8.0 software was used for statistical analysis (SPSS Inc., Chicago, Illinois).
Results
Of the 45 females recruited for the study, 43 completed the study. Five of the 43
patients (11.6%) were osteoporotic, 20 patients (46.5%) were osteopenic and 18 had
normal BMD (41.7%). All osteoporotic subjects were Caucasian. Except for three
African American females, all the osteopenic subjects were Caucasian, and there was one
Hispanic female in the normal group and the rest were also Caucasian. Thirty to 40 % of
subjects in all groups were on hormonal replacement therapy (HRT); two in the
osteoporotic group, six in the osteopenic group, and eight subjects in the normal group
were on HRT. There were no significant differences between the groups in age, weight,
height or state of dentition. Tables gives summarized descriptive statistics of these three
groups.
The pixel intensity values of the aluminum balls correlated very well (Table 2).
Only the two larger balls (7.94mm and 6.35mm) were used because of superimposition of
the hyoid bone or mandible over the other three balls.
Two sites in the osteoporotic group (out of 50 sites), eighteen sites in the
osteopenic group (out of 182 sites), and sixteen sites in the normal group (out of 164
sites) were discarded because the canine was absent on that side or because of
superimposition of impacted teeth, hyoid bone or cervical spine images over these
measurement sites. Table2 summarizes the pixel intensity values for the three groups.
There were no significant differences between fight and left mandibular pixel
intensity measurements (g 0.66, p<0.01).
In the osteopenic group, there were significant positive correlations between the
BMI and C1/T1 (r =0.5) and between height loss and Cr/Tr (r =0.5). There was a negative
13

14
correlation between height loss and G (r =0.5).There was no other significant correlation
between the rest of the mandibular pixel intensity measurements and age, lumbar BMD,
femoral BMD, number of osteoporotic fractures, weight, height, body mass index, height
loss, or years post-menopause in all the groups (Tables3, 4, and 5).
In osteoporotic subjects not taking hormonal replacement therapy (HRT) and with
at least four teeth in occlusion, there were positive correlations between weight
and Cr (r 0.969) and between BMI and C1/TI (r =0.976). There was a negative
correlation between height loss and C1/T1 (r 0.962) and between the number of
years since menopause and Cr/Tr (r =-0.998). However, these correlations were
observed in six sites measured in the three patients in this group (Table 6). In
osteopenic subjects not on HRT and with at least four teeth in occlusion, there
were negative correlations between LBMD and G (r =-0.643), height and C1/T1 (r
=-0.659), and between height loss and G (r =-0.699) (Table 7). In normal subjects
not on HRT and with four or more teeth in occlusion, there were negative
correlations between LBMD and G (r =-0.878) and between LBMD and (r
0.903) and positive correlation between height and G (r =0.584). No significant
correlations were observed in mandibular pixel intensity and the other variables
(Table 8).

Discussion
The results of this study suggest that women with mild-to-moderate osteoporosis
cannot be differentiated from women with normal bone mineral density on the basis of
mandibular radiographic pixel intensity, contrary to results found in the studies Kribbs et
al 23-25 and Law et al 30. Many factors could be responsible for these findings, including
patient population, patient selection criteria, experimental technique, nature of the
disease, nature of the bone, and the sample size.
The population of this study was chosen from walk-in females in a typical dental
school screening clinic. Subjects were not selected on the basis of documented negative
or positive results ofDXA bone densitometry of femur and lumbar spine or on the basis
of vertebral compression fractures. Consequently, most of the subjects in this study had
normal BMD or had early bone loss. This selection procedure might have excluded
subjects who ar.e physically impaired as the result of the osteoporosis and who might not
frequent such dental school screening clinics. On the other hand, this sample represents
the target population who might benefit from the diagnostic modality under investigation.
Selecting patients on the basis of self reported osteoporotic fractures, a complication that
occurs in a relatively advanced stage of the disease, may not be appropriate since such
fractures are not likely to be seen in early stages of osteoporosis.
A weakness of this study is its use of a patient .questioner to establish fracture
history. It has been shown that in retrospective studies, about one-sixth of recalls of
fractures are incorrect 35. In addition, many vertebral compression fractures go
undetected. A more accurate fracture diagnosis (such as medical history review or lateral
spine film) may have improved this study.
15

16
A limitation of this study was that only radiographs of dentate subjects were
evaluated. This may have resulted in the exclusion of osteoporotic individuals, who
usually have significantly less number of teeth 23, and who may have had lower pixel
intensity values. The purpose of requiting a minimum of all four upper and lower central
incisors and at least one mandibular canine was to use these teeth as landmarks to
position the subjects in the panoramic unit and to serve as reference points to identify
mandibular pixel intensity measurement sites.
The pixe! intensity measurement technique used in this study may not have been
sensitive, enough to detect early bone loss in edentulous subjects. This method was
chosen because it used readily available equipment and a widely used examination and;
thus, if the results had been positive, this technique could have been useful to dentists. In
retrospect, it was found that there are many technical problems that decrease the potential
usefulness of the digital panoramic imaging technique. There was no location for the
measurement ofpixel intensity in the mandibular ramus that would not be affected by
ghost images of the opposite side of the mandible or airway shadow. With the Planmeca
Proline machine, the additional potential problem of patient head rotation occurs because
of the necessity of removing the lateral head positioners to avoid superimposition of their
image. This would be less of a problem with other machines with head holders that
project from _the top of the machine.
The results of this investigation demonstrated that there was no significant
relationship between mandibular bone pixel intensity as measured on digital panoramic
radiographs and other variables used for skeletal osteoporosis diagnosis or evaluation of
fracture risk in our study subjects. This agrees with the findings of Mohajery et al 27 who

17
also used panoramic radiographs and demonstrated the negative correlation between
mandibular panoramic density measurements and skeletal osteopenia. The lack of
significant correlation between panoramic pixel intensity and skeletal BMD
measurements could be accounted for by the nature of the panoramic radiograph, with its
inherently less-sharp image, wide variability in density, and ghost images. These
limitations ofpanoramic radiography may also have contributed to differences in results
between this study and the studies by Kribbs et al 23-25 and Law et al 30 who measured
mandibular pixel intensity on periapical radiographs, which have higher resolution and no
superimpositions.
This study showed correlations of skeletal bone measurements with each other,
but interestingly, the densities of these bones did not correlated with the densities of the
mandibles. A number of different factors could be responsible for this finding. The
trabecular-to-cortical bone ratio varies in different parts of the skeleton. Mazess 36
speculated that trabecular bone has greater response to osteoporosis because of greater
blood supply and the proximity of a greater surface area of trabecular bone to the bone
marrow. Differences in load beating between bones also accounts for differences in
mineral content 37. The hip. and the spinal column bear the greatest amount of weight of
any bones in the skeleton, while the mandible is subject to quite different mechanical
forces. Moreover, there were two completely different techniques involved in the
measurement of skeletal and mandibular bone, which may not necessarily be expected to
agree and diagnostic discordance could be expected. Vrney et al have shown that the
diagnosis of osteoporosis and osteopenia in postmenopausal women is dependant on site-
specific analysis38.

18
Because of the small sample size, it could be argued that the null hypothesis of no
difference between osteoporotic and normal patients could not be rejected simply because
of inadequate statistical power. However, the slight difference in mean pixel intensities in
these groups, combined with the wide variability, suggests that the differences would not
have been clinically significant even if they had been statistically significant. Kribbs et al
25 also noted considerable overlap on all bone measurements between normal and
osteoporotic women, even though their study did identify some statistically significant
differences.
E.ven though osteoporosis starts from and has greater effect on trabecular bone
than cortical bone, the cortical layer at the angle of the mandible (Gonion) seems to be an
interesting landmark because the area is independent of the teeth and can be easily
measured and quantified even in edentulous patients. This region has been found to be
useful in the evaluation of osteodystrophy in patients with end stage renal diseases 39, 40
Benson et al 22 have also described a panoramic mandibular index to measure the cortical
thickness in the region of the mental foramen. No correlations between mandibular
cortical bone pixel intensity at Gonion and DXA measurements of the lumbar spine and
femoral neck were observed in this study. It was noted however that the radiographic
density of the mandibular angle was sensitive to slight variations in head position and to
the angle between the Frankfort plane and the floor. Many of the elderly patients have
some degree of scoliosis that result in superimposition of the cervical spine shadow over
the mandibular Gonion. Bollen et al suggested that the measured entity is a projection of
the bony ridge related to the insertion of the masseter and medial ptregoid muscles. Thus
the effect of osteoporosis on the cortical bone at the gonial angle may be obscured 41.

19
One area of future research would be to look at the thickness of cortical layers
longitudinally to see whether early signs of osteoporosis could be detected. Longitudinal
studies of mandibular bone density may also be more fruitful than cross-sectional studies
in the evaluation of the role of dental radiography in assessing patients for osteoporosis.
CONCLUSION
Postmenopausal women with mild-to-moderate osteoporosis could not be
differentiated from those without disease on the basis of radiographic pixel intensities of
mandibular trabecular and cortical bone as measured on digital panoramic radiographs.

Tables
TABEL 1. Descriptive statistics of subjects.
Age (years)
LBMD (g/cm2)
L T-score
FBMD (g/cm2)
i T_score
Fx
Weight (Kg)
Height (m)
BMI (Kg/m:)
HL (cm)
YPM (years)
cc
Missing
Alln=43
63 +7.8(50-79)
1.113 +0.185(0.732-1.725)
-0.553 +1.522(-3.6-4.4)
0.881 +0.112(0.605-1.196)
-0.818 +0.934(-3.1-1.8)0 +1(0-3)
74.67 +14.42(39.6-114.1)1.6 +0.06(1.49-1.77)
29.14 +5.4316.419-41.961)
2.4 +2.3(0-10.2)15 +/-10
(0-47)11 +/-4
(0-]4)4 +/-3
(2-15)
Osteoporoticn=5
63 +/-11.8
(52-79)0.888 +/-0.138
(0.732-1.047)
0.741 +/-0.124
(0.605-0.944)
1 +/-1
(0-3)74.3 +/-27.5
(39.6-114.1)1.62 +/-0.07
(1.54-1.72)28.13 +/-9.6
(16.42-41.96)2.2 +/-1.9
(0-4.4)14 +/-12
(0-26)12 +1.67(10-14)3 +/-1
(2-4)
Osteopenicn=20
64 6.5+/-
(50-72)1.05 +/-0.088
(0.97-1.3)
0.85 +/-0.06
(0.75-0.98)
0 +/-1
(0-2)71.8 +/-11.18
(51.7-94.2)1.6 +/-0.62
(1.52-1.77)28 +/-4.66
(19.66-35.42)2.6 +/-2.6
(0-10.2)15 +/-9
(0-28)10 +/-5
(0-14)5 +/-4
(2-15)
Normaln=18
63 +/-8
(51-77)1.247 +/-0.181
(1.02-1.73)0.577 +/-1.448
(-1-4.4)0.959 +/-0.1
(0.87-1.2)-0.17 +/-0.828
(-0.9-1.8)0 +/-1
(0-2)78 +/-13.2
(52-107.3)1.59 +/-0.05
(1.49-1.69)30.74 +/-4.7
(23.49-40.44)2.3 +/-2
(0-6.3)15 +/-11
(0-47)12 +/-4
(0-14)3 +/-1
(2-7)
LBMD Lumbar bone mineral density, L T-score Lumbar T-score, FBMD Femoral bone mineral
density, F T-score Femoral T-score, Fx Number of osteoporotic fractures, BMI Body mass index, HL
Height loss, YPM years post-menopause, Occ Number of teeth in occlusion, Missing Number of
missing teeth.
20

21
Table 2. Correlation between aluminum balls pixel intensity
values.
Large ball PI3319.1 +685n=33
Small ball PI3225.3 +/-674n=33
=0.855’*
** Correlation is significant at the 0.01 level (2-tailed)
22
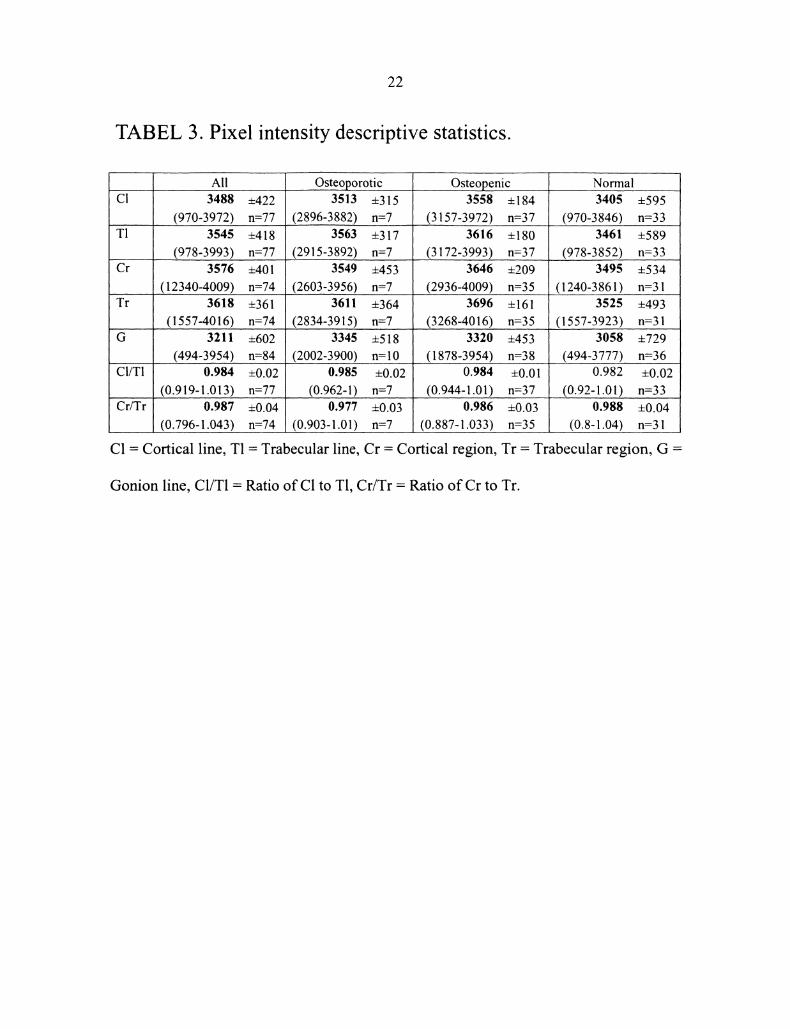
TABEL 3. Pixel intensity descriptive statistics.
AllCI 3488 +/-422
(970-3972) n=77T1 3545 +/-418
(978-3993) n=77Cr 3576 +/-401
(12340-4009) n=74T" 3618 +/-361
(1557-4016) n=74G 3211 +602
(494-3954) n=84CI/T1
Cr/Tr
0.984 +/-0.02
(0.919-1.013) n=770.987 +/-0.04
(0.796-1.043) n=74
Osteoporotic3513 +315
(2896...-3882) n=73563 +317
(2915-3892) n=73549 +453
(2603-3956) n=73611 +364
(2834-3915) n=73345 +518
(2002-3900) n=100.985 +/-0.02
(0.962-1) n=70.977 +0.03
(0.903-1.01) n=7
Osteopenic3558 +/-184
(3157-3972) n=373616 +/-180
(3172-3993) n=373646 +/-209
(2936-4009) n=353696 +/-161
(3268-4016) n=353320 +/-453
(1878-3954) n=380.984 +/-0.01
(0.944-1.01) n=370.986 +/-0.03
(0.887-1.033) n=35
Normal3405 +595
(970-3846) n=333461 +/-589
(978-3852) n=333495 +534
(1240-3861) n-313525 +493
(1557-3923) n=313058 +729
(494-3777) n-360.982 +/-0.02
(0.92-1.01) n=330.988 +0.04
(0.8-1.04) n=31
C1 Cortical line, T1 Trabecular line, Cr Cortical region, Tr Trabecular region, G
Gonion line, C1/T1 Ratio of C1 to T1, Cr/Tr Ratio of Cr to Tr.

23
TABEL 4. Correlation between mandibular pixel intensity valuesand other variables in the osteoporotic group.
Age
LBMD
CI (n=9)
-0.43
Weight
Height
T1 (n=9)r
Cr (n= 10) Tr (n- O) G (n=lo) CI/TI (n= o)r
-0.38
0.19
Cr/Tr (n O)r
0.27 0.24 0.07 0.07
FBMD 6.4 O.3 0.4 0.33 -0.12 0.52 0.47Fx -0.42 -0.33 -0.51 -0.57 -0.38 -0.5 -0.55
0.46 0.39 0.45 0.43 0.17 0.52
0.14 0.16 0.04 0.32
BMI 0.45 0.38 0.47 6.4HL -0.07 0.01 -0.04 -0.55 0.04
YPM -0.48 -0.42 -0.53 -0.44 -0.68 -0.33 0.5
LBMD Lumbar bone mineral density, FBMD FemOral bone mineral density, Fx Number of
osteoporotic fractures, BMI Body mass index, HL Height loss, YPM years post-menopause, rPearson correlation coefficient, Spearman’s rank correlation coefficient, ** Correlation is significantat the 0.01 level (2-tailed), *=Correlation is significant at the 0.05 level (2-tailed).

24
TABEL 5. Correlation between mandibular pixel intensity values
and other variables in the osteopenic group.
AgeLBMD
C1 (n=37)
0.227-0.02
FBMD -0.253Fx -0.392*
0.1510.005
_..WeightHeightBMI 0.133HL 0.306YPM -0.042
TI (n=37)r
0.239
Cr (n=35)
0.222
Tr (n=35)
0.127
G (n=38)
0.015-0.367*
CI/T1 (n=37)
-0.009
Cr/Tr (n--35)
0.286-0.073 -0.104 -0.224 0.173 0.14-0.285 -0.22 -0.045 0.026 0.07 -0.41 *
-0.315 -0.142 -0.147 -0.338* -0.31 -0.0610.048 0.16 0.124 0.304 0.354" 0.1530.11 0.244 0.36* 0.173 -0.351" -0.063
-0.011 0.055 -0.038 0.188 0.487** 0.1920.238 0.178 -0.071 -0.5** 0.266 0.5**0.012 -0.005 -0.075 -0.119 -0.182 0.156
LBMD Lumbar bone mineral density, FBMD Femoral bone mineral density, Fx Number ofosteoporotic fractures, BMI Body mass index, HL Height loss, YPM years post-menopause, rPearson correlation coefficient, ** Correlation is significant at the 0.01 level (2-tailed), *=Correlation issignificant at the 0.05 level (2-tailed).

25
TABLE 6. Correlation coefficient between mandibular pixel
intensity values and other variables in the normal group.
Age
CI (n=33)
0.36LBMD -0.23FBMD -0.23FxWeightHeightBMI
0.260.260.21
HL 0.39*YPM 0.14
T1 (n=33) Cr (n=31)
0.34-0.35 0.01-0.33 -0.03
0.18-0.090.26
0.14 0.240.25 0.44*0.09 0.09
Tr (n=31)
0.3
G (n=36)
0.25
CI/TI (n=33) Cr/Tr (n=31
0.15 0.130.29-0.08 -0.34* 0.08
-0.09 -0.2 0.18 0.14-0.3 -0.13 -0.03 0.170.230.22
0.13 0.330.230.27
0.10.18
0.25 0.13 0.32 0.070.3 0.21 0.32 0.35-0.05 0.04 0.12 0.2
LBMD Lumbar bone mineral density, FBMD Femoral bone mineral density, Fx Number ofosteoporotic fractures, BMI Body mass index, HL Height loss, YPM years post-menopause,Spearman’s rank correlation coefficient, ** Correlation is significant at the 0.01 level (2-tailed),*=Correlation is significant at the 0.05 level (2-tailed).
26
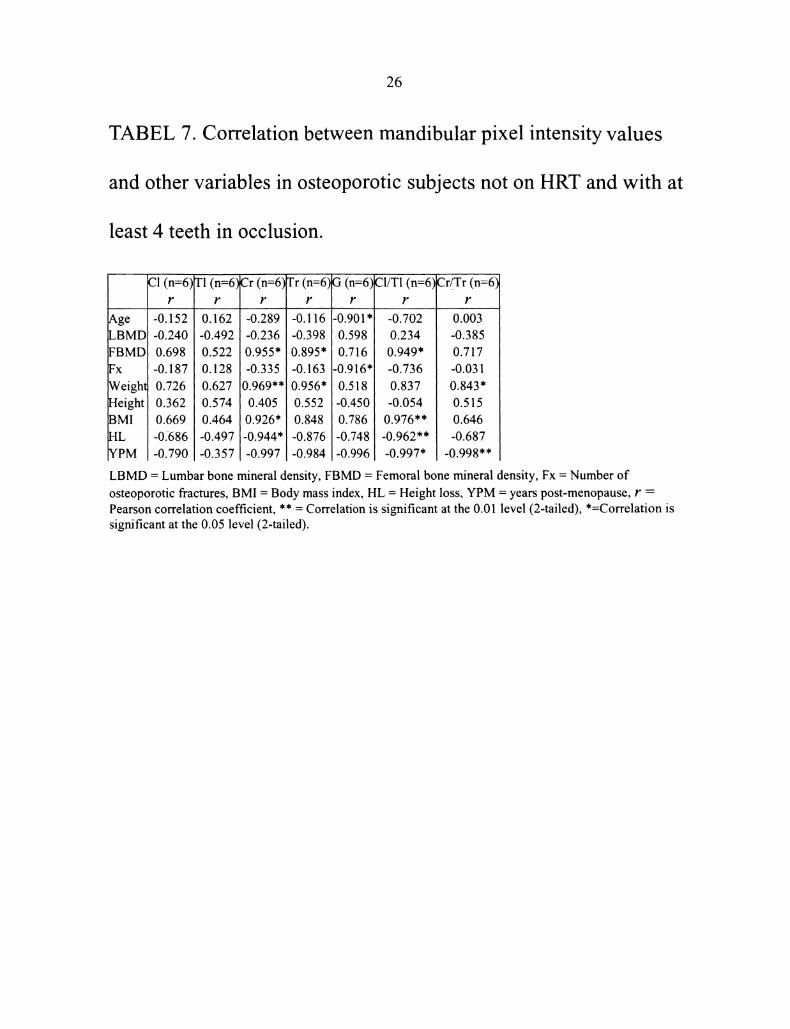
TABEL 7. Correlation between mandibular pixel intensity values
and other variables in osteoporotic subjects not on HRT and with at
least 4 teeth in occlusion.
AgeLBMDFBMDFxWeightHeightBMIHLYPM
C1 (n=6)
-0.152-0.2400.698-0.187:0.7260.3620.669-0.686-0.790
1"1 (n=6)
0.162-0.4920.5220.1280.6270.5740.464-0.497-0.357
Cr (n=6)
-0.289-0.2360.955*-0.3350.969**]0.4050.926"-0.944"-0.997
Tr (n=6)
-0.116-0.3980.895*-0.1630.956*0.5520.848-0.876-0.984
G (n=6)
-0.901"O.5980.716-0.916"0.518-O.45O0.786-0.748-0.996
C1/TI (n=6)
-0.7020.2340.949*-0.7360.837-0.0540.976**-0.962**-0.997*
Cr/.Tr (n=6)
0.003-0.3850.717-0.0310.843*0.5150.646-0.687
-0.998**
LBMD Lumbar bone mineral density, FBMD Femoral bone mineral density, Fx Number of
osteoporotic fractures, BMI Body mass index, HL Height loss, YPM years post-menopause, rPearson correlation coefficient, ** Correlation is significant at the 0.01 level (2-tailed), *=Correlation issignificant at the 0.05 level (2-tailed).

27
TABEL 8. Correlation between mandibular pixel intensity values
and other variables in osteopenic subjects not on HRT and with at
least 4 teeth in occlusion.
C1 TI Cr Tr CI/TI Cr/Tr(n=16) (n=16) (n=14) (n=14)G(n=17)(n=16) (n=14)
r r r r r r,ge 0.564* 01571* 01366 0.274 0,143 -0.066 0.41LBMD -0.038 -0.112 -0.214 -0.396 -0.643** 0.367 -0.06FBMD -0.25l -0.226 -0.154 0.055 -0.233 -0.115 -0.29Fx -0.242 -0.212 -0.172 -0.276 -0.100 -0.107 -0.05Weight 0.429 0.385 0.383 0.303 0.245 0.171 0.25Height 0.005 0.143 0.273 0.315 0.357 -0.659** 0.13BMI 0.367 0.270 0.242 0.152 0.061 0.432 0.2HL 0.356 0.298 0.093 -0.038 -0.699** 0.251 0.49YPM 0.448 0.436 0.314 0.181 0.092 0.065 0.42
LBMD Lumbar bone mineral density, FBMD Femoral bone mineral density, Fx Number ofosteoporotic fractures, BMI Body mass index, HL Height loss, YPM years post-menopause, rPearson correlation coefficient, Spearman’s rank correlation coefficient, ** Correlation is significantat the 0.01 level (2-tailed), *=Correlation is significant at the 0.05 level (2-tailed).
28
TABEL 9. Correlation between mandibular pixel intensity values
and other variables in normal subjects not on HRT and with at least
4 teeth in occlusion.
(n:- 17)Age | 0.224LBMDI-0.878.*FBMDI -0.238Fx -0.027
Weigh 0064Height 0.222BMI -0.042HL 10.233YPM 0.272
T1 (n-- 17)
0.244-0.903**-0.325-0.1030.0400.195-0.0640.2000.200
Cr (n=16)
0.415-0.3850.0490.2430.3120.4450.1920.3680.382
Tr (n= 16)G (n=l 9)r r
0.349 ’0.365-0.292!-0.442-0.029 0.100
-0.146!0.1130.471 0.544*0.383 10.584"*0.429 0.403.0.207 0.0920.044 0.140
CI/T1 (n= 17)
0.O35-0.1260.1490.1880.0780.1560.0320.1660.301
Cr/Tr (n= 16)
0.221-0.2110.0850.434-0.0170.230-0.1330.2790.443
LBMD Lumbar bone mineral density, FBMD Femoral bone mineral density, Fx Number of
osteoporotic fractures, BMI Body mass index, HL Height loss, YPM years post-menopause, r
Pearson correlation coefficient, ** Correlation is significant at the 0.01 level (2-tailed), *=Correlation is
significant at the 0.05 level (2-tailed).

Figures
FIGURE 1. Relationship between BMD T-score and fracture risk.
20
v 16
4
0
T--I
-score
29

30
FIGURE 2. Position of the aluminum balls.

31
FIGURE 3" Pixel intensity measurement sites.
tal foramen
Cr Cortical region, Tr Trabecular region, C1 Cortical line, T1 Trabecular line andG=Gonion line.

References
lo Stedman T. Stedman’s Medical Dictionary. 26th ed. Baltimore, MD: Williams &Wilkins; 1995.NIH. Osteoporosis prevention, diagnosis, and therapy.; Mar 27-29, 2000, 2000;United States.Genant HK. Radiography of acute and chronic osteopenia. Med Times.1982;110:69-77.Vogler JB, Kim JH. Metabolic and endocrine diseases of the skeleton. In: DixonAK, ed. Grainger and Allison’s Diagnostic Radiology A Textbook ofMedicalImaging. Vol 3. fourth ed. London: Churchill Livingstone; 2001:1925-1965.Riggs BL, Melton LJI. Evidence of two distinct syndromes of involutionalosteoporosis. Am JMed. 1983 ;75:899-901.WHO. WHO Technical Report Series 843. Assessment offracture risk and itsapplication to screeningforpostmenopausal osteoporosis. Geneva, Switzerland:World Health Organization; 1994.Kanis JA, Melton LJ, Christiansen C, Johnston CC, Khaltaev N. The diagnosis ofosteoporosis. JBone Miner Res. 1994;9:1137-1141.Looker AC, Orwoll ES, Johnston CJ, et al. Prevalence of low femoral bonedensity in older U.S. adults from NHANES III. JBone Miner Res.1997;12(11):1761-1768.ORBD-NRC N. Osteoporosis Overview. 10/2000. Available at:http://www.osteo.org/docs/107.464686389.html. Accessed January 15, 2002.Ray NF, Chan JK, Thamer M, Melton LJ. Medical expenditures for the treatmentof osteoporotic fractures in the United States in 1995" report from the NationalOsteop0rosis Foundation. JBone Miner Res. 1997; 12:24-35.Chrischilles E, Shireman T, Wallace R. Costs and health effects of osteoporoticfractures. Bone. 1994; 15:377-386.Jacobsen SJ, Goldberg J, Miles TP. Race and sex differences in mortalityfollowing fracture of the hip. Am JPublic Health. 1992;82:1147-1150.Koval KJ, Skovron.ML, Ahanonoff GB, Meadows SE, Zuckerman JD.Ambulatory ability after hip fracture: a prospective study in geriatric patients.Clin Orthop. 1995;310:150-159.Grampp S, Jergas M, Gluer CC, Lang P, Brastow P, Genant HK. Radiologicdiagnosis of osteoporosis. Current methods and perspectives. Radiol Clin NorthAm. 1993;31(5):1133-1145.Fogelman I, Blake GM. Different approaches to bone densitometry. JNucl Med.Dec 2000;41 (12):2015-2025.Smith J, Shoukri K. Diagnosis of osteoporosis. Clinicl Cornerstone.2000;2(6):22-33.Raisz LG. The osteoporosis revolution. Ann Intern Med. 1997;126(6)’458-462.Klemetti E, Vainio P, Lassila V, Alhava E. Cortical bone mineral density in themandible and osteoporosis status in postmenopausal women. Scand J Dent Res.1993;101 (4):219-223.
32

33
Klemetti E, Vainio P, Lassila V, Alhava E. Trabecular bone mineral density ofmandible and alveolar height in postmenopausal women. Scand JDent Res.1993;101 (3): 166-170.von Wowem N, Stoltze K. Comparative bone morphometric analysis ofmandibles and 2nd metacarpals. Scand JDent Res. 1979;87(5):358-364.Homer K, Devlin H, Alsop CW, Hodgkinson IM, Adams JE. Mandibular bonemineral density as a predictor of skeletal osteoporosis. Br JRadiol.1996;69(827): 1019-. 1025.Benson BW, Prihoda TJ, Glass BJ. Variations in adult cortical bone mass asmeasured by a panoramic mandibular index. Oral Surg Oral Med Oral Pathol.Mar 1991;71(3):349-356.Kribbs PJ, Smith DE, Chesnut CH, 3rd. Oral findings in osteoporosis. Part II:Relationship between residual ridge and alveolar bone resorption and generalizedskeletal osteopenia. JProsthet Dent. 1983 ;50(5):719-724.Kribbs PJ, Chesnut CH, 3rd, Ott SM, Kilcoyne RF. Relationships betweenmandibular and skeletal bone in an osteoporotic population. JProsthet Dent. Dec1989;62(6):703-707.Kribbs PJ, Chesnut CH, 3rd, Ott SM, Kilcoyne RF. Relationslips betweenmandibular and skeletal bone in a population of normal women. JProsthet Dent.1990;63(1):86-89.White SC, Rudolph DJ. Alterations of the trabecular pattern of the jaws inpatients with osteoporosis. Oral Surg Oral Med Oral Pathol Oral Radiol Endod.1999;88(5):628-635.Mohajery M, Brooks SL. Oral radiographs in the detection of early signs ofosteoporosis. Oral Surg Oral Med Oral Pathol. 1992;73(1): 112-117.Klemetti E, Kolmakov S, Heiskanen P, Vainio P, Lassila V. Panoramicmandibular index and bone mineral densities in postmenopausal women. OralSurg Oral Med Oral Pathol. Jun 1993 ;75(6):774-779.Klemetti E, Kolmakov S, Kroger H. Pantomography in assessment of theosteoporosis risk group. Scand JDent Res. 1994; 102(1)’68-72.Law AN, Bollen AM, Chen SK. Detecting osteoporosis using dental radiographs"a comparison of four methods. JAm Dent Assoc. 1996; 127(12): 1734-1742.DHHS U. The selection ofpatientsfor x-ray examinations: dental radiographicexamination. Vol HHS Publication FDA 88-8273. Rockville, MD" U.S.Department of Health and Human Services; 1987.Farman AG, Farman TT. Extraoral and panoramic systems. Dent Clin North Am.Apr 2000;44(2):257-272, v-vi.Cummings SR, Kelsey JL, Nevitt MC, O’Dowd KJ. Epidemiology of osteoporosisand osteoporotic fractures. Epidemiol Rev. 1985;7:178-208.Knowelden J, Buhr AJ, Dunbar O. Incidence of fractures in persons over 35 yearsof age: a report to the MRC working party on fractures in the elderly. Br JPrevSoc Med. 1964;18:130-141.Cummings SR. Epidemiologic studies of osteoporotic fractures" methodologicissues. Calcif Tissue Int. 1991 ;49 Suppl:S 15-20.Mazess RB. Noninvasive methodsfor quantitating trabecular bone. New Yourk:Grune and Stratton; 1983.

34
Lieberman D. Osteoporosis. St. Louis: Mosby-Year book, Inc; 1983.Vamey LF, Parker RA, Parker RA, Vincelette A, Greenspan SL. Classification ofosteoporosis and osteopenia in postmenopausal women is dependent on site-specific analysis. J Clin Densitom. 1999/11/05 1999;2(3):275-283.Bras J, van Ooij CP, Abraham-Inpijn L, Wilmink JM, Kusen GJ. Radiographicinterpretation of the mandibular angular cortex: a diagnostic tool in metabolicbone loss. Part II. Renal osteodystrophy. Oral Surg Oral Med Oral Pathol. Jun1982;53(6):647-650.Bras J, van Ooij CP, Abraham-Inpijn L, Kusen GJ, Wilmink JM. Radiographicinterpretation of the mandibular angular cortex: A diagnostic tool in metabolicbone loss. Part I. Normal state. Oral Surg Oral Med Oral Pathol. May1982;53(5):541-545.Bollen AM, Taguchi A, Hujoel PP, Hollender LG. Case-control study on self-reported osteoporotic fractures and mandibular cortical bone. Oral Surg Oral MedOral Pathol Oral Radiol Endod. 2000;90(4):518-524.