detecting mobility patterns with stationary bluetooth
TRANSCRIPT
1 Introduction
Comprehensive knowledge about the mobility patterns of a city’s population is important for both industry and science research. It is of particular interest for the advertising industry for determining performance values of posters and billboards. Movement profiles of subgroups in traffic can therefore be a valuable data input.
The data used to evaluate outdoor advertising is usually sourced in studies in which test groups are interviewed about their mobility behaviour or tracked by special GPS sensors. Those studies are generally associated with very high costs. For this reason most of the studies span only a short period of time and cover a small amount of participants. Alternatively, a large amount of mobility data can be derived from nationwide sensors, such as the mobile phone network. This is often problematic because of legal issues and can require a large effort to acquire the datasets.
Local sensor networks using Bluetooth or Wi-Fi can be a good and comparably low-cost alternative. This approach commonly places stationary Bluetooth and/or Wi-Fi sensors at geographically distributed positions, for example covering important places in a city. The sensors are capable of recording Bluetooth- and Wi-Fi signals sent by other (mobile) devices in their local surroundings. Those devices can be smartphones, headsets of passing pedestrians and vehicles. The Bluetooth sensors are connected via a mobile phone network to a central analysis server that collects all sensor readings.
As a proof of concept, we have established a network of Bluetooth sensors in an area of the city of Bonn, Germany in July and August 2014. The sensors were installed in outdoor advertising billboards. The placement was preceded by intense talks and negotiations about security and privacy aspects of the project since those billboards are located in public spaces. In the following sections we show the potential that is hidden in this sensor data, especially when it comes down to deriving mobility criteria like movement patterns.
So far, only a few works exist on experiences collecting Bluetooth data over a whole city. Mainly the data is gained on greater events like festivals, sport events or in closed areas like airports and shopping centres [1,2,4,5,10,12,]. We extend this previous work like Versichele et al in [13] by setting up a decentralized sensor network in a big city in Germany and focus on new approaches for detecting mobility patterns via Fourier analysis. Thus we want to answer the question – is the acquired data valid for a realistic representation of traffic activity and movement patterns? Can this data be used on the one side as an input for agent based traffic simulation and on the other side be used by the advertising industry [3]. The remainder of this paper is structured as follows: section 2 - describes the measurement scenario, methods as well as the data acquisition process. Section 3 - describes the data, the data aggregation, and the analysis for commuter detection. Section 4 - summarizes our lessons learned.
Detecting Mobility Patterns with Stationary Bluetooth Sensors:
A real-world Case Study Marc Mueller
Fraunhofer IAIS Schloss Birlinghoven
Sankt Augustin, Germany [email protected]
Daniel Schulz Fraunhofer IAIS
Schloss Birlinghoven Sankt Augustin, Germany
Michael Mock Fraunhofer IAIS
Schloss Birlinghoven Sankt Augustin, Germany
Dirk Hecker Fraunhofer IAIS
Schloss Birlinghoven Sankt Augustin, Germany
Abstract
A Bluetooth sensor network was built up in the city of Bonn to measure Bluetooth MAC-addresses. The results of the acquired data are separated on a macro level and mobility patterns. We have collected nearly 5 million data points from 14 distinct stationary sensors over a period of 1 month and recognized over 85.000 unique devices. We show that the data is sufficiently dense to detect commuter patterns based on a Fourier analysis. In addition, we discuss limitations found in the dataset and present lessons learned. Keywords: Bluetooth tracking, Fourier Transformation, mobility patterns, geo-sensor network, data-acquisition
AGILE 2015 – Lisbon, June 9-12, 2015
2 Scenario and methods
The objective of our approach is to use a reliable sensor system based on a single-board computer that is able to collect Bluetooth data autonomously and sends the data to a server via a mobile phone network. Furthermore, the system must have a maintenance interface that is secured with a public key infrastructure. This is especially important when it comes to sensor placements in public spaces since the data has to be protected from illegal external access. In addition, various reliability and availability mechanisms are implemented in order to receive continuous sensor data. For example, a disconnection of the UMTS stick has to be intercepted, and after a reconnection the sensor has to send the incurred data to the server. The whole process has to run autonomously since the sensor’s accessibility is limited once it is installed within the billboard.
2.1 Acquiring data
The Bluetooth USB-dongle of the sensors receives the Bluetooth data during their „Inquiry State“. The received signals are converted to a readable format, recorded in a text file and periodically transferred to a server. The complete process is presented in Figure 1. The recording progress consists of three parts. First the sensor receives the Bluetooth signal and passes the acquired data to the second part. This second part pre-processes the measured data using a Java application and shell scripts running on the sensor. In this part the formatting, anonymizing, logging and transmitting of the data records are solved. The third part is the receiving of the formatted data records, saving them on an external server and storing the data until it is transmitted to an internal server.
Figure 1: Data acquiring process
2.2 Sensor Placement
A network of Bluetooth sensors was established in the street network of the city of Bonn. The dependence on a permanent power supply restricted the potential positions. Cooperating with a German outdoor
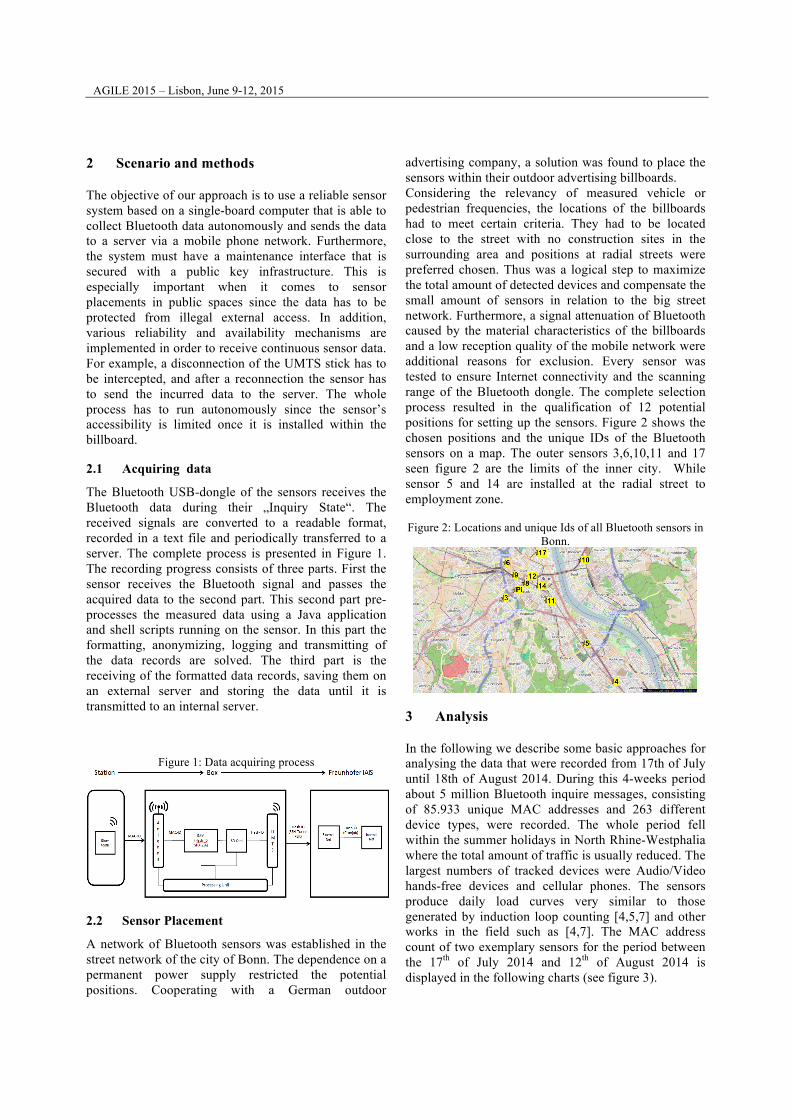
advertising company, a solution was found to place the sensors within their outdoor advertising billboards. Considering the relevancy of measured vehicle or pedestrian frequencies, the locations of the billboards had to meet certain criteria. They had to be located close to the street with no construction sites in the surrounding area and positions at radial streets were preferred chosen. Thus was a logical step to maximize the total amount of detected devices and compensate the small amount of sensors in relation to the big street network. Furthermore, a signal attenuation of Bluetooth caused by the material characteristics of the billboards and a low reception quality of the mobile network were additional reasons for exclusion. Every sensor was tested to ensure Internet connectivity and the scanning range of the Bluetooth dongle. The complete selection process resulted in the qualification of 12 potential positions for setting up the sensors. Figure 2 shows the chosen positions and the unique IDs of the Bluetooth sensors on a map. The outer sensors 3,6,10,11 and 17 seen figure 2 are the limits of the inner city. While sensor 5 and 14 are installed at the radial street to employment zone.
Figure 2: Locations and unique Ids of all Bluetooth sensors in
Bonn.
3 Analysis
In the following we describe some basic approaches for analysing the data that were recorded from 17th of July until 18th of August 2014. During this 4-weeks period about 5 million Bluetooth inquire messages, consisting of 85.933 unique MAC addresses and 263 different device types, were recorded. The whole period fell within the summer holidays in North Rhine-Westphalia where the total amount of traffic is usually reduced. The largest numbers of tracked devices were Audio/Video hands-free devices and cellular phones. The sensors produce daily load curves very similar to those generated by induction loop counting [4,5,7] and other works in the field such as [4,7]. The MAC address count of two exemplary sensors for the period between the 17th of July 2014 and 12th of August 2014 is displayed in the following charts (see figure 3).

AGILE 2015 – Lisbon, June 9-12, 2015
Figure 3: Daily load curve of two sensors for weekdays and the weekend
Here the numbers of MAC-addresses were summed up for each sensor. Additional validation data was available from a similar Bluetooth dataset, collected in the city of Cologne in the first half of 2013 for about 6 months. Both cities are about 20km apart. The sensors in Cologne were placed on high-frequented streets such as sensor_10 and sensor_6 in Bonn. Further, for the Cologne dataset induction loop measurements exists. Thus we were able to validate the plausibility of Bluetooth measurements. The daily load curves of the induction loop strongly correlates with the daily load curve of the Bluetooth dataset. The ratio between Bluetooth and induction loops is about 7-10%. It has been shown in previous work that this is sufficient to represent a realistic amount of people and vehicles [1,4,5,3].
For data aggregation every record of a scanned device at a sensor is saved as a separate dataset with it’s "first seen" and "last seen" record, respectively. In this way each dataset represents a certain time span of a Bluetooth device at a sensor. The raw data is then aggregated depending on dwelling times. Till this point we used an algorithm similar to the one used in [10]. One further part of this process was to define a stay of a MAC-address. A stay is the time that a person or vehicle with an active Bluetooth device lasts at a sensor. Because of the signal attenuation of Bluetooth caused by the material characteristics of the billboards, a threshold was defined. Thus it was necessary to identify the length of an inquiry scan at each sensor. This was accompanied by finding the median duration of the next appearance of the same MAC-address at sensor. This duration time lies between 11 seconds and 40 seconds. Afterwards the determined appearance was used to aggregate the raw dataset. Finally, aggregated datasets are formed if the temporal difference of two consecutive datasets in the raw data ("last seen" of the prior and "first seen" of the latter) is less than the determined threshold of a sensor. This helped us to reduce the nearly five million raw datasets to about
340.000 aggregated datasets that are used in the following analysis. Since an individual person in a city is not continuously moving, the duration of a regular working day would be another interesting threshold to segment the behaviour of a MAC-address (which stands for a person). This leads to the question: what is the distribution of another appearance in the sensor network? A first approach was to have a closer look at the daily load curves and point out the increase of activity in the graph. In figure 3 we clearly see that the amount of “activity” increases at 7 am and decreases between 7 pm and 8 pm. Hence the first conclusion would be to declare the time out of home for approx. 12 hours, from home to work and back. To find a more precise definition of the time out of home, the data set was grouped hourly by the next appearance of MAC-address in the sensor network. This hourly aggregation of hourly recurrent MAC-addresses results in figure 4 and will form the basis for further analyses. Figure 4: Recurrent MAC-addresses at all sensors for Cologne
and Bonn
Figure 4 shows that at 9-hours and 15-hours a peak of recurrent MAC-addresses exists. The 15-hour peak has the highest amount of MAC-addresses and defines the length of time outside home. The query was applied to the Cologne dataset and to the Bonn dataset. The y-axis shows the percentage of recurrent MAC-addresses after a specific time. The x-axis shows the time when a MAC-address has its next appearance in the network.
3.1 Commuter detection
A closer look to the graph in figure 4 shows a distinct distribution over a period of time and the predictability of mobility. We would like to highlight the local extremes in the graph in figure 4 especially the recurrent of MAC-addresses after 24-hours and 168-hours (one week). Furthermore many people pass a sensor again after exactly two days, three days, etc. - so
AGILE 2015 – Lisbon, June 9-12, 2015
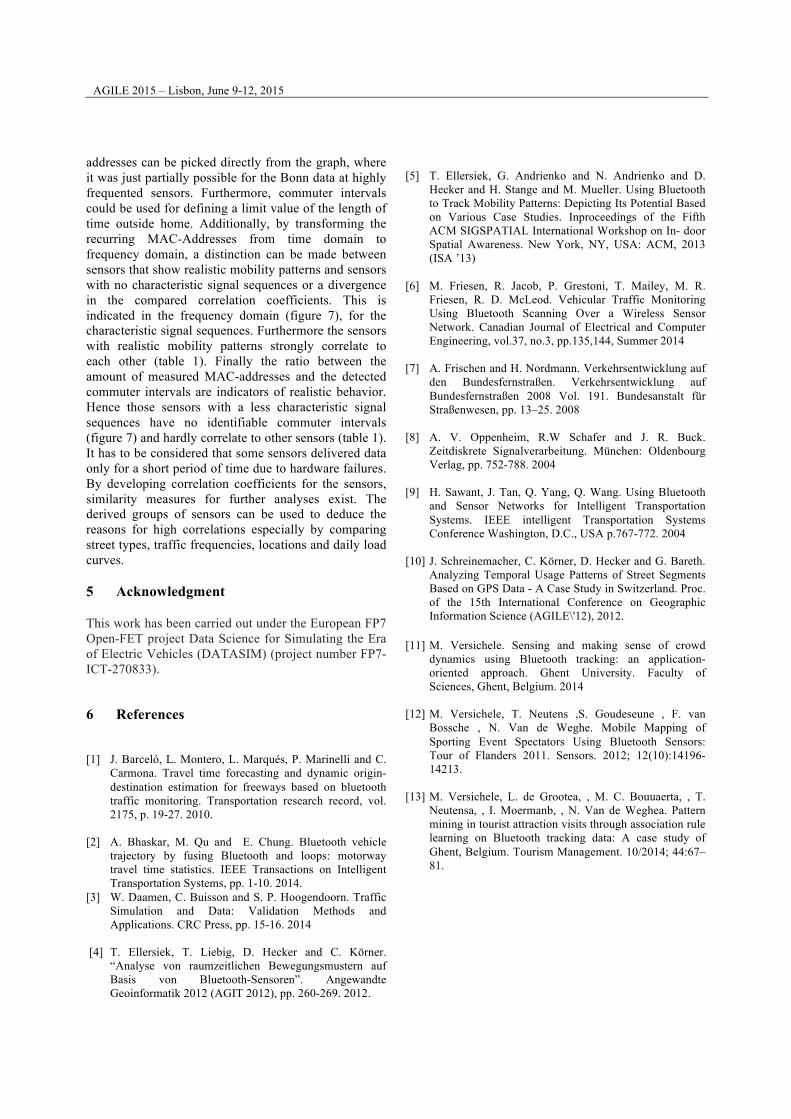
it seems that they pass a location after a given time interval. This periodic behaviour is interpreted as a commuter interval. For a better overview about the commuter interval, the time series is transformed to the frequency domain. Because of discrete time values we used a DFT (discrete Fourier transformation) shown in equation 1 [8]. The DFT was applied to the signals of Bonn and Cologne, with about 676 hourly samples, referred to the one-month measuring period. The resulting characteristics are shown in figure 5 for Cologne validation data and Bonn. Both patterns show similar characteristics on the y-axis the amplitude of the hourly period is represented in dB and on the y-axis the frequency is represented in 1/hour. 𝑇!" = 𝑌!"#!$%! ,measurement period 𝑁 = 𝑌!"#!$%! , samples
𝐹!" = 1𝑇!"
, sampling rate
𝑓 𝑡 = 𝑌!"#!$%! 𝑡 , with 𝑡 = 0: 1:𝑇!"
𝑚 =𝑘2 , k is even m=
𝑘 − 12
,k is odd
𝑊!!!" = 𝑒!!
!!! !!" = 𝑒
!!!!!!!"
= 𝑊!!"
𝐹 𝑁 = 𝑓 2𝑚 𝑊!!"
!!!!
!!!
+ 𝑓 2𝑚 + 1 𝑊!(!!!!)!
!!!!
!!!
𝐹 𝑁 = 𝑓 2𝑚 𝑊!!
!"
!!!!
!!!
+𝑊!!" 𝑓 2𝑚 + 1 𝑊!
!
!"
!!!!
!!!
𝐹 𝑁 = 𝐺 𝑛 +𝑊!"!! 𝐻 𝑛 , with G as even and H as odd
𝑁 = 0: 676 ,𝑌!"#!$%! = 𝑡𝑖𝑚𝑒 𝑠𝑒𝑟𝑖𝑒𝑠 𝑜𝑓 𝑎 𝑠𝑒𝑛𝑠𝑜𝑟 𝐹 0 = 𝐺 0 +𝑊!"!
! 𝐻 0 ⋮ 𝐹 676 = 𝐺 337 +𝑊!"!
!!"𝐻 0 = 𝐺 337 +𝑊!"!!!" 𝐻 337
(1)
Figure 5: recurrent MAC-addresses at all sensors for Cologne and Bonn transformed to the frequency domain
The first peak of the pattern lies at 1/24-hours. This means, that those signals reappear after a 24-hour interval. The next interesting peaks are at 12-hours and 8-hours. These are interpreted as the length of time outside home, in contrast to the time series where the length of time outside home was interpreted at 9-hours respectively 15-hours. Based on this result a new threshold for the time out of home is found. In adjustment with the daily load curves in figure 3 and from [5,9], the 12-hour interval shows the best daily mobility time from home to work and back. For description of a single sensor we will have a closer look to the recurrent behaviour of MAC-addresses at each sensor.
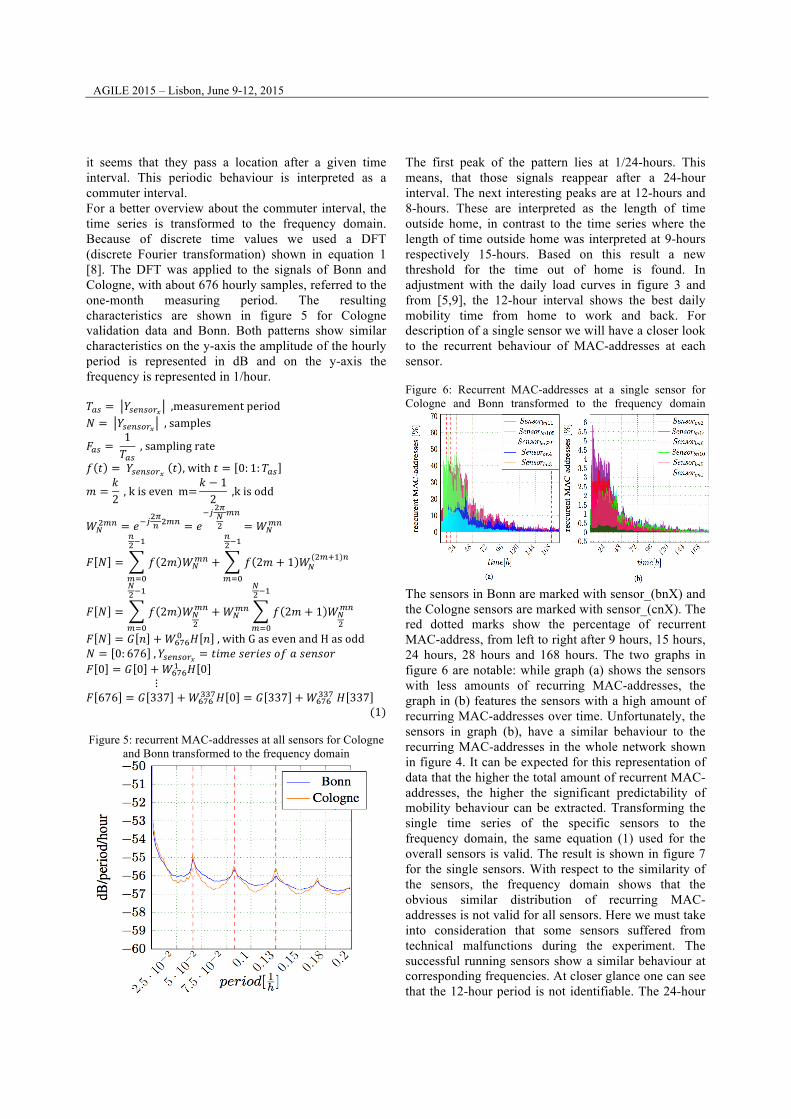
Figure 6: Recurrent MAC-addresses at a single sensor for Cologne and Bonn transformed to the frequency domain
The sensors in Bonn are marked with sensor_(bnX) and the Cologne sensors are marked with sensor_(cnX). The red dotted marks show the percentage of recurrent MAC-address, from left to right after 9 hours, 15 hours, 24 hours, 28 hours and 168 hours. The two graphs in figure 6 are notable: while graph (a) shows the sensors with less amounts of recurring MAC-addresses, the graph in (b) features the sensors with a high amount of recurring MAC-addresses over time. Unfortunately, the sensors in graph (b), have a similar behaviour to the recurring MAC-addresses in the whole network shown in figure 4. It can be expected for this representation of data that the higher the total amount of recurrent MAC-addresses, the higher the significant predictability of mobility behaviour can be extracted. Transforming the single time series of the specific sensors to the frequency domain, the same equation (1) used for the overall sensors is valid. The result is shown in figure 7 for the single sensors. With respect to the similarity of the sensors, the frequency domain shows that the obvious similar distribution of recurring MAC-addresses is not valid for all sensors. Here we must take into consideration that some sensors suffered from technical malfunctions during the experiment. The successful running sensors show a similar behaviour at corresponding frequencies. At closer glance one can see that the 12-hour period is not identifiable. The 24-hour

AGILE 2015 – Lisbon, June 9-12, 2015
pattern can be seen, however the 8-hour period is only still partially observable. As already mentioned, this can be seen for the highly frequented sensors on radial streets such as sensor_cn1, sensor_cn2, sensor_cn4, sensor_cn6, sensor_bn9 and sensor_cn11.
Figure 7: recurrent MAC-addresses at single sensors for Cologne and Bonn transformed to the frequency domain
3.2 Similarity
For the advertising industries a differentiation of locations is especially interesting. In figure 6 a daily commuter percentage of 13% < 60% can be observed. The sensors in figure 6 (b) clearly show a minor percentage of the commuters, 0.5% < 4.8%. It should be noted that sensors in figure 6 (a) comprise a small amount of total number of measured MAC-addresses. As a similarity measure to compare the sensors, a covariance matrix is built. The function for the correlation coefficients of the time series is shown in equation 2. The coefficients are quantification factors to detect the similarity of sensors.
𝑃!" =𝐶𝑂𝑉 𝑌!𝑌!𝜎 𝑌! 𝜎 𝑌!
, Y is a time series value, σ Y is variance
(2) To find the major similarities among all sensors, the observed time series of the recurrent MAC-addresses is cut at 183 hours. This was a compromise to cover up most of the sensors. The threshold at 183 hours has to be used, because till this point the best quality of the derived recurrent MAC-addresses occurs. Afterwards the time series is transferred to a covariance matrix. The following analysis is focused on the similarity of the time series leading to a classification of the sensor locations. The result is shown in table 1. The dark grey shaded elements of the matrix are all coefficients with a correlation of two series >90%, grey shaded shows all correlation >80%<90% and the light grey elements all correlation >70%<80%. All series with a correlation >90% have a similar characteristic in the frequency
domain. Table 1 shows that the measurement time has an essential meaning for this analysis. The underlying measurements for about four weeks were only sufficient to detect commuter behaviour for one week. Also the precision of the detection depends on the total amount of measured MAC-addresses. This becomes particularly observable through the calculated correlation coefficient of the overall series from the Cologne and Bonn dataset, which is exactly one. The elements of the correlation matrix can be used as a feature for deeper analyses. A first approach would be a segmentation of the time series based on daily load curves. In this way a classification can succeed for sensors and street types. Table 1: covariance matrix of the sensors
Se
nsor_cn1
Sensor_cn2
Sensor_b
nPI1
Sensor_b
n9
Sensor_b
n6
Sensor_b
n4
Sensor_b
n3
Sensor_b
n11
Sensor_b
n14
Sensor_b
n10
Sensor_cn1 1 0.98 0 0.9 0.97 0.75 0.79 0.37 0.76 0.99 Sensor_cn2 0.98 1 0.11 0.96 0.98 0.84 0.89 0.52 0.77 0.99 Sensor_bnPI1 0 0.11 1 0.33 0.22 0.27 0.44 0.63 0.5 0.1 Sensor_bn9 0.9 0.96 0.33 1 0.96 0.91 0.96 0.72 0.83 0.95 Sensor_bn6 0.97 0.98 0.22 0.96 1 0.8 0.87 0.52 0.88 0.99 Sensor_bn4 0.75 0.84 0.27 0.91 0.8 1 0.93 0.83 0.63 0.81 Sensor_bn3 0.79 0.89 0.44 0.96 0.87 0.93 1 0.83 0.73 0.85 Sensor_bn11 0.37 0.52 0.63 0.72 0.52 0.83 0.83 1 0.52 0.48 Sensor_bn14 0.76 0.77 0.5 0.83 0.88 0.63 0.73 0.52 1 0.82 Sensor_bn10 0.99 0.99 0.1 0.95 0.99 0.81 0.85 0.48 0.82 1
4 Conclusions and lessons learned
As a result of the observation and initial basic analysis of the collected data we have showed that a Bluetooth sensor network in an area of a city is suitable to detect mobility patterns of commuters. The data is valid for other measurements as seen from the previous experiments. The acquired daily load curves resemble a plausible result and support the data quality as in [2,4,5,7,12]. However, the choice of the Bluetooth dongle and the sensor positioning are crucial. The results from measurements collected with different dongles clarified this. A more powerful industry dongle with a higher send/receive energy consumption recognized about 52.618 devices and a customized dongle about 37.181. They were both placed at the same position and had the same range to the street. The results show that a solid sensor network can be constructed even with limited resources. The collected datasets allow for validation of agent based simulation systems by using them as training data for a simulator. Signal analyses display regularities in the data for recurring MAC-addresses. The time of measurement has to be extended to improve the result quality as seen in the signal course in the frequency range measured for the Cologne data. Frequencies for recurring MAC-
AGILE 2015 – Lisbon, June 9-12, 2015
addresses can be picked directly from the graph, where it was just partially possible for the Bonn data at highly frequented sensors. Furthermore, commuter intervals could be used for defining a limit value of the length of time outside home. Additionally, by transforming the recurring MAC-Addresses from time domain to frequency domain, a distinction can be made between sensors that show realistic mobility patterns and sensors with no characteristic signal sequences or a divergence in the compared correlation coefficients. This is indicated in the frequency domain (figure 7), for the characteristic signal sequences. Furthermore the sensors with realistic mobility patterns strongly correlate to each other (table 1). Finally the ratio between the amount of measured MAC-addresses and the detected commuter intervals are indicators of realistic behavior. Hence those sensors with a less characteristic signal sequences have no identifiable commuter intervals (figure 7) and hardly correlate to other sensors (table 1). It has to be considered that some sensors delivered data only for a short period of time due to hardware failures. By developing correlation coefficients for the sensors, similarity measures for further analyses exist. The derived groups of sensors can be used to deduce the reasons for high correlations especially by comparing street types, traffic frequencies, locations and daily load curves. 5 Acknowledgment
This work has been carried out under the European FP7 Open-FET project Data Science for Simulating the Era of Electric Vehicles (DATASIM) (project number FP7-ICT-270833).
6 References
[1] J. Barceló, L. Montero, L. Marqués, P. Marinelli and C.
Carmona. Travel time forecasting and dynamic origin-destination estimation for freeways based on bluetooth traffic monitoring. Transportation research record, vol. 2175, p. 19-27. 2010.
[2] A. Bhaskar, M. Qu and E. Chung. Bluetooth vehicle
trajectory by fusing Bluetooth and loops: motorway travel time statistics. IEEE Transactions on Intelligent Transportation Systems, pp. 1-10. 2014.
[3] W. Daamen, C. Buisson and S. P. Hoogendoorn. Traffic Simulation and Data: Validation Methods and Applications. CRC Press, pp. 15-16. 2014
[4] T. Ellersiek, T. Liebig, D. Hecker and C. Körner.
“Analyse von raumzeitlichen Bewegungsmustern auf Basis von Bluetooth-Sensoren”. Angewandte Geoinformatik 2012 (AGIT 2012), pp. 260-269. 2012.
[5] T. Ellersiek, G. Andrienko and N. Andrienko and D.
Hecker and H. Stange and M. Mueller. Using Bluetooth to Track Mobility Patterns: Depicting Its Potential Based on Various Case Studies. Inproceedings of the Fifth ACM SIGSPATIAL International Workshop on In- door Spatial Awareness. New York, NY, USA: ACM, 2013 (ISA ’13)
[6] M. Friesen, R. Jacob, P. Grestoni, T. Mailey, M. R.
Friesen, R. D. McLeod. Vehicular Traffic Monitoring Using Bluetooth Scanning Over a Wireless Sensor Network. Canadian Journal of Electrical and Computer Engineering, vol.37, no.3, pp.135,144, Summer 2014
[7] A. Frischen and H. Nordmann. Verkehrsentwicklung auf
den Bundesfernstraßen. Verkehrsentwicklung auf Bundesfernstraßen 2008 Vol. 191. Bundesanstalt für Straßenwesen, pp. 13–25. 2008
[8] A. V. Oppenheim, R.W Schafer and J. R. Buck.
Zeitdiskrete Signalverarbeitung. München: Oldenbourg Verlag, pp. 752-788. 2004
[9] H. Sawant, J. Tan, Q. Yang, Q. Wang. Using Bluetooth
and Sensor Networks for Intelligent Transportation Systems. IEEE intelligent Transportation Systems Conference Washington, D.C., USA p.767-772. 2004
[10] J. Schreinemacher, C. Körner, D. Hecker and G. Bareth.
Analyzing Temporal Usage Patterns of Street Segments Based on GPS Data - A Case Study in Switzerland. Proc. of the 15th International Conference on Geographic Information Science (AGILE\'12), 2012.
[11] M. Versichele. Sensing and making sense of crowd
dynamics using Bluetooth tracking: an application-oriented approach. Ghent University. Faculty of Sciences, Ghent, Belgium. 2014
[12] M. Versichele, T. Neutens ,S. Goudeseune , F. van
Bossche , N. Van de Weghe. Mobile Mapping of Sporting Event Spectators Using Bluetooth Sensors: Tour of Flanders 2011. Sensors. 2012; 12(10):14196-14213.
[13] M. Versichele, L. de Grootea, , M. C. Bouuaerta, , T.
Neutensa, , I. Moermanb, , N. Van de Weghea. Pattern mining in tourist attraction visits through association rule learning on Bluetooth tracking data: A case study of Ghent, Belgium. Tourism Management. 10/2014; 44:67–81.