detecting food adulterants using the concepts of machine ... · detecting food adulterants using...
TRANSCRIPT

Detecting food adulterants using the concepts of machine learning
Anjana. M. P Student, 2nd year, Department of Information Technology, LICET
Pradeepa. K Student, 2nd year, Department of Information Technology, LICET
Abstract -Food adulteration is a process in which the quality of food products is degraded by the addition or substitution of certain chemicals which are injurious for human health. It not only includes the intentional addition or substitution of the ingredient but also the contamination during the period of growth, storage and distribution of food products. Adulteration has become a big business. We belong to a land where our ancestors taught that “food is medicine.” But the reality is that the fruits and vegetables that we consume today no more have vitamins and minerals in them rather they are injected and polished with poisonous chemicals. Adulterants in adulterated food have resulted in a number of diseases and premature deaths. This paper focuses on the detection of adulterated food products using the techniques of image processing using the techniques of image processing using the methods of machine learning like open CV and matplotlib.
Index Terms: Machine Learning, Open CV, Matplotlib and Adulteration detection.
I. INTRODUCTION
[1]In a recent report, the Public Health Foundation of India attributed 80 percent of all premature deaths in contaminated food and water. Food adulteration in India starts from the field itself where fertilizers and pesticides are overused. But pesticide residues are not the only problem. Fruits and vegetables once contained vitamins and minerals in them. But now they are filled with poisonous chemicals like endo-sulphite which spoil our health. [2]Chemicals like carbide used for quick ripening of fruits faster have created a number of health hazards.
[3]The following are a few health hazards due to adulterated food products
Mineral oil may be added to edible oil and fats and can cause cancers.
Lead chromate added to turmeric powder and spices can cause anemia, paralysis, brain damage and abortions.
Lead added to water, natural and processed food can lead to lead poisoning. Lead poisoning causes foot drop, insomnia, constipation, anemia, and mental retardation.
Cobalt added to water and liquors and can cause cardiac damage. Copper, tin, and zinc can cause colic, vomiting and diarrhea.
Mercury in mercury fungicide treated grains, or mercury-contaminated fish can cause brain damage, paralysis, and death.
Non-permitted color or permitted food color like metal yellow, beyond the safe limit in colored food can cause allergies, hyperactivity, liver damage, infertility, anemia, cancer and birth defects.
II.RELATED WORK
(a) Surface Enhanced Raman Spectroscopy:
[5]Surface-enhanced Raman spectroscopy (SERS) is an advanced Raman technique that enhances the vibrational spectrum of molecules adsorbed on or in the vicinity of metal particles and/or surfaces. Because of its readiness, sensitivity, and minimum sample preparation requirements, SERS is being considered as a powerful technique for food inspection. Ocean Optics gold and silver SERS substrates enable us to make, repeatable SERS measurements for the identification and quantification of SERS-active analytes. Typical applications include precision screening of food ingredients for controlled additives such as melamine and pesticides.
International Journal of Applied Engineering Research ISSN 0973-4562 Volume 14, Number 5, 2019 (Special Issue) © Research India Publications. http://www.ripublication.com
Page 25 of 31

(b) Detection Using Neural Networks:
[6]Due to the high cost of saffron, adulteration sometimes occurs in the local market. In this study, the aroma fingerprints of saffron, saffron with yellow styles, safflower, and dyed corn stigma were detected by an electronic nose system. The features of the obtained signals from electronic nose system were extracted and used for data analysis. In this work, principal component analysis was used and the results were confirmed by back propagation artificial neural networks. The results revealed that the system can recognize the saffron adulteration satisfactorily. As a conclusion, it was found that the electronic nose could provide good separation of the saffron and adulterated one (safflower and other adulteration) as 100 and 86.87% classification accuracy, respectively, by means of artificial neural networks. The electronic nose was able to differentiate non-adulterated and adulterated saffron at higher than 10% adulteration level successfully.
III. PROPOSED SOLUTION
[7]This model involves the technique of digital image processing. As of now this model is limited to detecting the adulteration in fruits like apples. The model is first trained using the microscopic image of the consumable apple, open CV and matplotlib generates and extracts the features from the image. Now, when it gets the microscopic image of the test apple that has to be checked for adulteration it extracts the features of the test apple and then compares it with the source. Depending upon the percentage of feature matching it displays the labels of whether the apple is consumable or not.
The implementation of this model can be achieved in these steps:
1. Training of the model using the digital image of the source(consumable apple)
2. Feature extraction of the source is done using matplotlib and open cv for image processing
3. The model is tested using a target (apple used for checking the adulteration)
4. The model extracts the features of the target using open cv and matplotlib
5. Features of the target and source are matched
6. Calculation of the percentage of feature matching
7. If more than 75% of features are matching then display the label of “consumable” or display the label of
“inconsumable” this can be well defined in a diagrammatic representation (fig. 1)
.
Fig 1. Flow of working of this model
Algorithm for differentiating adulterated and unadulterated images:
Necessitate: test image and match images
FEATURE EXTRACTION OF SOURCE
FEATURE EXTRACTION OF TARGET
FEATURE MACTCHING OF SOURCE AND TARGET
CALCULATION OF PERCENTAGE OF FEATURE MATCHING
IF FEATURE MATCHING>75%
CONSUMABLE UNCONSUMBABLE
International Journal of Applied Engineering Research ISSN 0973-4562 Volume 14, Number 5, 2019 (Special Issue) © Research India Publications. http://www.ripublication.com
Page 26 of 31
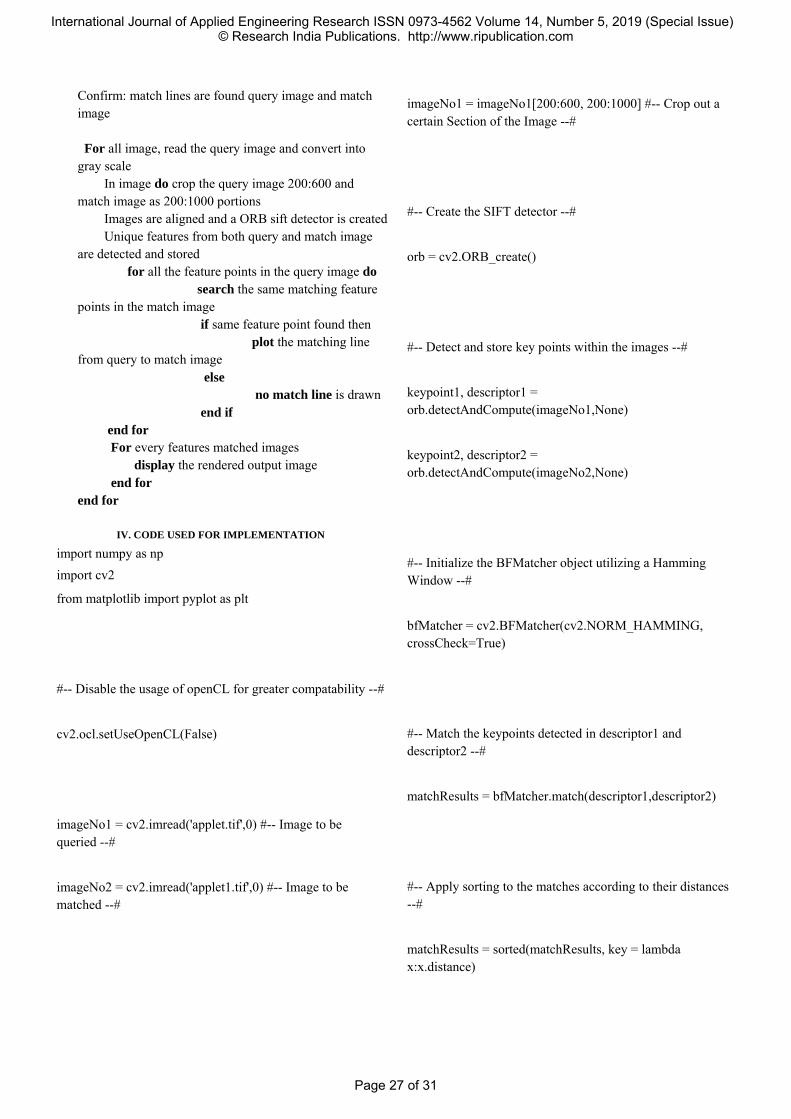
Confirm: match lines are found query image and match image
For all image, read the query image and convert into gray scale In image do crop the query image 200:600 and match image as 200:1000 portions Images are aligned and a ORB sift detector is created Unique features from both query and match image are detected and stored for all the feature points in the query image do search the same matching feature points in the match image if same feature point found then plot the matching line from query to match image else
no match line is drawn end if
end for
For every features matched images display the rendered output image end for
end for
IV. CODE USED FOR IMPLEMENTATION
import numpy as np import cv2
from matplotlib import pyplot as plt
#-- Disable the usage of openCL for greater compatability --#
cv2.ocl.setUseOpenCL(False)
imageNo1 = cv2.imread('applet.tif',0) #-- Image to be queried --#
imageNo2 = cv2.imread('applet1.tif',0) #-- Image to be matched --#
imageNo1 = imageNo1[200:600, 200:1000] #-- Crop out a certain Section of the Image --#
#-- Create the SIFT detector --#
orb = cv2.ORB_create()
#-- Detect and store key points within the images --#
keypoint1, descriptor1 = orb.detectAndCompute(imageNo1,None)
keypoint2, descriptor2 = orb.detectAndCompute(imageNo2,None)
#-- Initialize the BFMatcher object utilizing a Hamming Window --#
bfMatcher = cv2.BFMatcher(cv2.NORM_HAMMING, crossCheck=True)
#-- Match the keypoints detected in descriptor1 and descriptor2 --#
matchResults = bfMatcher.match(descriptor1,descriptor2)
#-- Apply sorting to the matches according to their distances --#
matchResults = sorted(matchResults, key = lambda x:x.distance)
International Journal of Applied Engineering Research ISSN 0973-4562 Volume 14, Number 5, 2019 (Special Issue) © Research India Publications. http://www.ripublication.com
Page 27 of 31

#-- Render the first 5 matches detected --#
resultImage = cv2.drawMatches(imageNo1,keypoint1,imageNo2,keypoint2,matchResults[:5], None, flags=2)
#-- Display the rendered image --# plt.imshow(resultImage),plt.show()
V. RESULT ANALYSIS
fig 2 - Applet1 – image to which it should be matched
Fig 3 - Applet – image to which is to be queried
Features matching:
Fig 4 – features matches apples
Same coding process repeated to detect a treated one gives lesser features getting matched out of only one feature line is drawn
International Journal of Applied Engineering Research ISSN 0973-4562 Volume 14, Number 5, 2019 (Special Issue) © Research India Publications. http://www.ripublication.com
Page 28 of 31

Fig 5 – Another set of apples
Features matching:
Fig 6 – less features matched apples
Based on the number of matching feature lines we can conclude the consumable food products The imported library functions for this model are numpy, opencv2 and pyplot from matplotlib. The general function of numpy is to deliver a high performance multidimensional array and also it contains basic tools to compute with and manipulate these arrays. For this paper numpy is required to store the distance between the source and destination of matching feature points as set of array elements in ascending order later and
while displaying the output, the least distance matched line is displayed first. [7]The next library is opencv, opencv is an open source library used in computer vision for image processing this library provides several high- level programming languages like python. In particular we here import opencv2 which has a library of Python bindings designed to solve computer vision problems. All the OpenCV array structures are converted to and from Numpy arrays,also the images which are to be read by the model are converted into grayscale with this package. This makes the model at ease to incorporate with other libraries that use Numpy such as SciPy and Matplotlib. [8]Matplotlib is a tool used for plotting purpose it can produce 2 dimensional graphs in various milieus (seaborn is used for 3 dimensional, as far as the scope of this paper we use pyplot in matplotlib). The main use of matplotlib is to explore through the data and come to well defined conclusions through précised graph models. Matplotlib can do different types of plots like line plots, scatter plots, bar plots, histogram and multiple plots. We use pyplot in matplotlib it is a collection of facility style functions. Each pyplot function makes certain transformation to a image or the figure like the instances of creating a figure, and plotting an area in a figure, plots some lines in a plotting area, embellishes the plot with markers, etc. here we use pyplot to draw match line plots for the feature matching between images. If we are asked to compare two images, we look for (or) we observe for a specific pattern which are unique and those which can be compared easily. But what if these images are to be compared or scanned through microscopes and impossible to comprehend by human eyes also it may seem imperceptible by humans, here comes open source computer vision to achieve this. Our goal is to compare a food product, analyze it and come to a conclusion that it is consumable or not, for that we have to look into minute presence of particles(like pesticides, fertilizers etc.,) so those detected particles are compared with a source image, this process of finding the features in an image is called as feature detection. [9]The OpenCL(open Computer Language) is disabled because the OpenCL kernel offload through the transparent API and its allocates memory simultaneously whenever possible, thus maintaining a backward compatibility with data structure. So inorder to increase compatibility we diasable OpenCL. Here the images are given as inputs, initially they are modified by numpy as arrays then it recreates the image as a graph now the comparison takes place testImage or the queryImage is compared with the trainImage we identify any common
International Journal of Applied Engineering Research ISSN 0973-4562 Volume 14, Number 5, 2019 (Special Issue) © Research India Publications. http://www.ripublication.com
Page 29 of 31

features and best matches using opencv. The trainImage and the testImage is read thoroughly and particular portion of the testImage is cut out then key points within those images are marked and computed using sift ORB (oriented and rotated BRIEF) Then BFMatcher comes into play to detect key points identify and match them. cv2.drawKeypoints is used for plotting key points and cv2.drawMatches to draw the match lines between the pictures as earlier discussed precise lines are drawn by matplotlib. If a test image matches with the original image many feature matching lines are found so we sort the lines based on the distance from source to destination using lambda function and first 5 least distancematch lines are shown by imshow() command. The other way of doing getting the match lines is through the k nearest neighbour command, cv2.drawMatchesKnn which draws all the k best matches. If k=2, it will draw two match-lines for each keypoint. Here we k = 5 to render first 5 best matches. Now if we set a condition that atleast 5 matches are to be there to find the object. Otherwise simply it shows a message saying not enough matches are present, as not enough matches are found we conclude that food product as inconsumable. When the apple to be queried (fig. 3) is compared with the apple to be matched with (fig. 2) and if the feature points are detected and plotted the result image (fig. 4) is obtained. Else the apple which is adulterated (fig. 5) or does not match with the already stored apple image (fig. 2) the less feature matching image (fig. 6) is obtained Here we employ machine learning because as we cannot conclude from single comparative image, we have to go through at least thousands of images and make the device familiarized with the all possible required features and to train this model completely to get a precision of 1 hence those voluminous data can be manipulated and analyzed by machine learning and opencv in a more efficient way.
VI. FUTURE ENHANCEMENT
At present due to the lack of the required data set only one single microscopic image is taken as source. At a later stage, with the improvement of more high resolution cameras, which can capture microscopic images of products, machine learning can be applied with the large data set and the prediction can be made with more accuracy. This model can be implemented into an application and the digital image processing can be done using cell phone camera with the required resolution. Hence,
consumers can shop safe and unadulterated fruits and vegetables. All that they have to do is scan the fruits and vegetables they are going to shop. See the percentage of its adulteration and shop accordingly. This can bring a transformation to the health of the society and decrease the number of pre mature deaths and deadly diseases due to unadulterated food.
VII. CONCLUSIONS
This paper ‘Detecting Food Adulterants using the concepts of Machine Learning’ which is based on the technology of digital image processing and open source computer vision, can definitely provide a permanent solution for the burning question of adulteration in fruits and vegetables with the help of enhanced researches, required data sets and experiments and relieve the consumers from the unnecessary intake of poisonous adulterants which will lead to many diseases and pre mature deaths. The precision of the results rendered by this model would be more accurate as it is developed with the latest technology ‘opencv2’ and modern tools and libraries like ‘numpy, pyplot’ As mentioned above this model when built into an application would serve every consumer and the dealers in their day to day routine checking of the goods they buy.
REFERENCES:
[1]"Food Adulteration - an overview | ScienceDirect Topics", Sciencedirect.com, 2018. [Online]. Available: https://www.sciencedirect.com/topics/food-science/food-adulteration. [Accessed: 14- Aug- 2018]. [2]"FOOD ADULTERATION PART-II FRUITS/VEGETABLES All that shines is not pure! | All India Exservicemen Joint Action Front (Sanjha Morcha)", Sanjhamorcha.com, 2018. [Online]. Available: http://www.sanjhamorcha.com/?p=4639. [Accessed: 14- Aug- 2018]. [3]"Adulteration and Harmful effects of Food Adulteration", India
Study Channel, 2018. [Online]. Available: http://www.indiastudychannel.com/resources/172754-Adulteration-and-Harmful-effects-of-Food-Adulteration.aspx. [Accessed: 14- Aug- 2018]. [4]"PressReader.com - Connecting People Through News", Pressreader.com, 2018. [Online]. Available: https://www.pressreader.com/india/consumer-voice/20180301/281728385031313. [Accessed: 14- Aug- 2018]. [5] Podstawka, E., Światłowska, M., Borowiec, E. and Proniewicz,
L. (2007). Food additives characterization by infrared, Raman,
and surface-enhanced Raman spectroscopies. Journal of Raman
Spectroscopy, 38(3), pp.356-363.
International Journal of Applied Engineering Research ISSN 0973-4562 Volume 14, Number 5, 2019 (Special Issue) © Research India Publications. http://www.ripublication.com
Page 30 of 31

[6] Hdl.handle.net. (2019). Food adulteration detection using neural
networks. [online] Available at: http://hdl.handle.net/1721.1/106015 [Accessed 17 Jan. 2019].
[7]J. Howse, P. Joshi and M. Beyeler, OpenCV. Birmingham: Packt Publishing, 2016.
[8]S. Tosi, Matplotlib for Python Developers. Birmingham: Packt Publishing, 2009.
[9]L. Bottou, "From machine learning to machine reasoning", Machine Learning, vol. 94, no. 2, pp. 133-149, 2013. Available: 10.1007/s10994-013-5335-x.
AUTHORS’ PROFILE:
ANJANA.M.P is pursuing B.Tech IT in Loyola ICAM College of Engineering and Technology currently living in Chennai. She has published a paper in the International Journal of Computer Sciences and Engineering. She is highly interested in the field of Artificial Intelligence and Machine Learning. She is highly energetic and has the ability to work under the stipulated time efficiently. She is a self- motivated person who does things in a very constructive and innovative manner. She aims to contribute her knowledge and findings for the welfare of the society. She is keen to find technical solutions for the challenges faced in the medical fields.
PRADEEPA K. is pursuing B.Tech IT in Loyola ICAM College of engineering and Technology currently living in Chennai who has published a paper in the International Journal of Computer Sciences and Engineering. She is interested in the domain of Machine Learning and Computer Vision. She is highly proactive and looks forward in contributing her knowledge for technological developments, looks everything in a different and productive way.
International Journal of Applied Engineering Research ISSN 0973-4562 Volume 14, Number 5, 2019 (Special Issue) © Research India Publications. http://www.ripublication.com
Page 31 of 31