detecting electromagnetic · pdf filewith antenna theory developing ... they simply failed to...
TRANSCRIPT
IntroductiontoAstrophysicalInstrumentation:RadioLab July25&26,2017
Page1
DetectingElectromagneticFields:
TheHeterodynePrincipleandSimpleAntennas
IntroductiontoAstrophysicalInstrumentation
DunlapInstitute,UniversityofToronto
Introduction:
RadioAstronomyisarelativelynewfieldofscience,havingexistedforlessthan100years.In 1864 (published in 1865), JamesClerkMaxwell unified the theories of electricity andmagnetism,andstatedthatlightwas,infact,anexampleofanelectromagnetic(EM)wave(also predicting the existence of other EMwaves, including radiowaves). A generationlater, in 1888,HeinrichHertz demonstrated the existence of radiowaveswith his tunedresonantspark-gapexperiment,whichinturnpavedthewayforwirelesscommunication,aschampionedbyKarlBraun,GuglielmoMarconi,andothers in the late1890sandearlythe next century. With antenna theory developing (Braun invented phased arrays ofantennastoimprovedirectionalityandgain),andevencontinuouswavetransmissionanddetection available in the early 1900s (Reginald Fessenden),whywas it that astronomyoverlookedthisnewwindowto theuniverse? Whydid it takeuntil1932 foraBellLabsradio engineer to notice signals fromouter space, and thenhalf a decadebefore anyoneelsepursuedthis?
In part, it was not that scientists overlooked the radio portion of the electromagneticspectrum;theysimplyfailedtofindanythingintheirmanyinitialattemptsneartheturnofthecentury,andthenconcluded,erroneously,thatthereshouldbenothingtoobserve.Theearly scientists made their mistake based on the theory that EM emissions from spaceshouldcomefromblackbodyradiationofstars,andshouldthusbeinsignificantintheradioband.Intheinterveningyearsthereweremanynewtechnologiesdevelopedandrefined,soitwaswhenKarlJanskywastaskedtodeterminethesourceofstaticplaguingwirelesstransmissions that extra-terrestrial sources of radiowaveswere discovered. This eventwasnotedwithsomeexcitementwhenitwaspublishedintheNewYorkTimesonMay5,1933,buttheradiohissfromoutsideofoursolarsystemwasnotaprojectthatBellLabswishedtopursuesoJanskymovedontootherprojects.HisdiscoveryalsooccurredduringtheGreatDepression(1929-1939),sofundingwaslow.GroteReber,anelectricalengineerandHAMradiooperator,wasinspiredbythearticleaboutradiohissfromthecentreofthegalaxy, and applied to work with Jansky at Bell Labs, but was unsuccessful in hisapplications.Insteadofbeingdiscouraged,hecontinuedhisjobandsimultaneouslybuiltaradio telescope with his own money and started to map out the universe in the radioportion of the EM spectrum, successfully detecting radio signals from theMilkyWay in
IntroductiontoAstrophysicalInstrumentation:RadioLab July25&26,2017
Page2
1938.WithReber’spublicationsinastronomicaljournalsstartingin1940,thefieldofradioastronomygrewquickly,andhasoftenbeenattheleadingedgeoftechnology.
Aswellassynchrotronradiationandthermalsources,the21cmHydrogenLine,causedbythe transitionof theprotonandelectronhavingparallel spins toanti-parallel spins, isofgreat importance to radio astronomers and cosmologists. Since hydrogen is the mostcommonelementintheuniverse,thisradiation,at1420.4MHz,canbeusedasaproxyformatter, and by observing red shifted hydrogen, we can build up matter density mapsthroughoutourcosmologicalhistory.
Thegoalsforthislaboratorysessionareto:
1) Understandthebasiccircuitchainintranslatingawaveintheskytoawaveinawaveguide(i.e.anelectricalsignalwecanmeasure)
2) Understandtheheterodyneprinciple,whichiskeyfordetectingsignals3) Usewaterfallplotstoshowsensitivityatdifferentwavelengths4) Create(drawwithconductiveink)aworking,tuneddipoleantennaforradiationat
1420MHza. Relategeometricshapetoresonantwavelengthsbeingdetectedb. Seetheeffectsoflinewidthonresonancelengths
5) Understandhowgainanddirectivityarerelated;seehowimportantanechoicchambersareforaccuratetesting
6) Seeavarietyofantennadesignsandcombinationpatternsandunderstandhowtheyareusefulindifferentcontexts
7) Observethesky
IntroductiontoAstrophysicalInstrumentation:RadioLab July25&26,2017
Page3
LabEquipment:
1AirSpyDevice
Laptopwiththeprogram‘gqrx’installed(onLinux)
CircuitScribeConductiveInkPen
Whiteeraser
1Edge-mountSMAconnector
1fiberglass(FR4)boardmodifiedwithacircularmountpointononeside
GlossyPhotoPrintingPaper
TapetomountthepapertoFR4
1rotatingtray(AKA‘LazySuzan’)withtubeantennastandattached
360oProtractor
AcrylicRuler
Multimeterwithprobes
1CoaxialCable(+1forconnectingwithanothergroup)
(1combinertojoinwithothergroups)
50OhmcoaxialcablewithSMAconnectors
IntroductiontoAstrophysicalInstrumentation:RadioLab July25&26,2017
Page4
TheAirSpy:
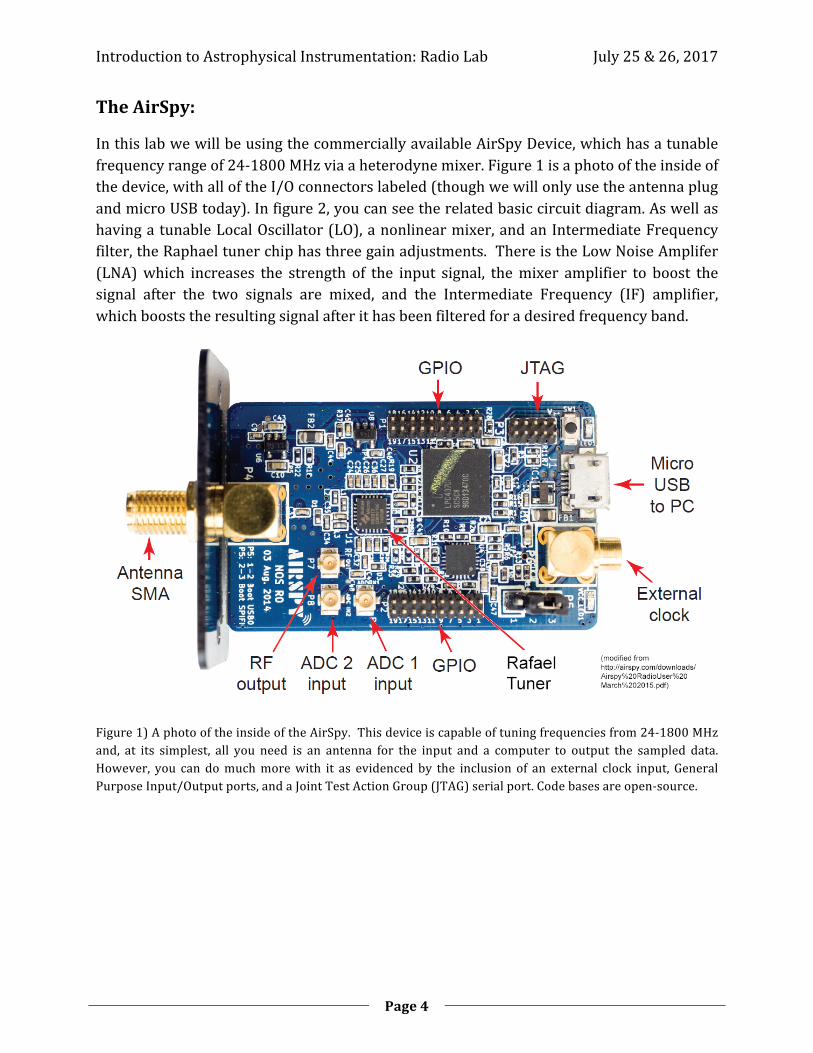
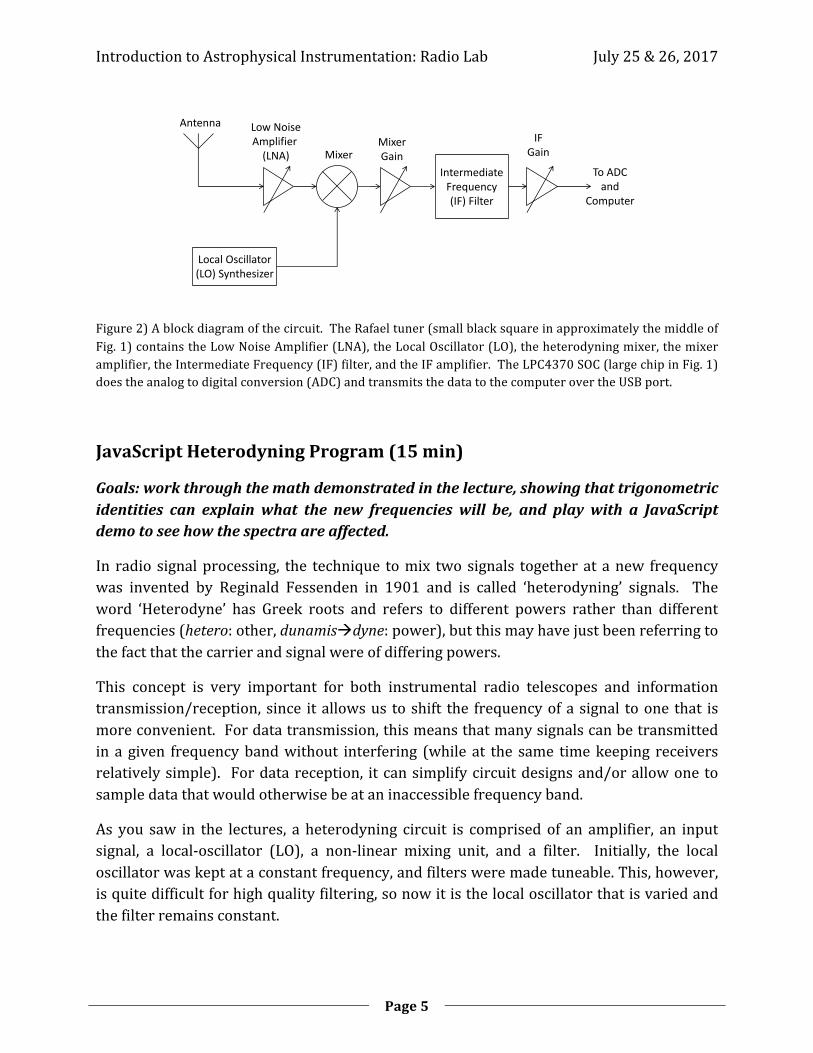
InthislabwewillbeusingthecommerciallyavailableAirSpyDevice,whichhasatunablefrequencyrangeof24-1800MHzviaaheterodynemixer.Figure1isaphotooftheinsideofthedevice,withalloftheI/Oconnectorslabeled(thoughwewillonlyusetheantennaplugandmicroUSBtoday).Infigure2,youcanseetherelatedbasiccircuitdiagram.AswellashavingatunableLocalOscillator(LO),anonlinearmixer,andanIntermediateFrequencyfilter,theRaphaeltunerchiphasthreegainadjustments.ThereistheLowNoiseAmplifer(LNA)which increases the strength of the input signal, themixer amplifier to boost thesignal after the two signals are mixed, and the Intermediate Frequency (IF) amplifier,whichbooststheresultingsignalafterithasbeenfilteredforadesiredfrequencyband.
Figure1)AphotooftheinsideoftheAirSpy.Thisdeviceiscapableoftuningfrequenciesfrom24-1800MHzand, at its simplest, all you need is an antenna for the input and a computer to output the sampled data.However, you candomuchmorewith it as evidencedby the inclusion of an external clock input, GeneralPurposeInput/Outputports,andaJointTestActionGroup(JTAG)serialport.Codebasesareopen-source.
IntroductiontoAstrophysicalInstrumentation:RadioLab July25&26,2017
Page5
LocalOscillator(LO)Synthesizer
IntermediateFrequency(IF)Filter
Antenna LowNoiseAmplifier(LNA) Mixer
ToADCand
Computer
MixerGain
IFGain
Figure2)Ablockdiagramofthecircuit.TheRafaeltuner(smallblacksquareinapproximatelythemiddleofFig.1)containstheLowNoiseAmplifier(LNA),theLocalOscillator(LO),theheterodyningmixer,themixeramplifier,theIntermediateFrequency(IF)filter,andtheIFamplifier.TheLPC4370SOC(largechipinFig.1)doestheanalogtodigitalconversion(ADC)andtransmitsthedatatothecomputerovertheUSBport.
JavaScriptHeterodyningProgram(15min)
Goals:workthroughthemathdemonstratedinthelecture,showingthattrigonometricidentities can explain what the new frequencies will be, and play with a JavaScriptdemotoseehowthespectraareaffected.
In radio signalprocessing, the technique tomix twosignals togetherat anew frequencywas invented by Reginald Fessenden in 1901 and is called ‘heterodyning’ signals. Theword ‘Heterodyne’ has Greek roots and refers to different powers rather than differentfrequencies(hetero:other,dunamisàdyne:power),butthismayhavejustbeenreferringtothefactthatthecarrierandsignalwereofdifferingpowers.
This concept is very important for both instrumental radio telescopes and informationtransmission/reception, since itallowsus toshift the frequencyofasignal toone that ismoreconvenient.Fordatatransmission,thismeansthatmanysignalscanbetransmittedin a given frequencybandwithout interfering (while at the same timekeeping receiversrelativelysimple). Fordatareception, itcansimplifycircuitdesignsand/orallowonetosampledatathatwouldotherwisebeataninaccessiblefrequencyband.
As you saw in the lectures, a heterodyning circuit is comprisedof an amplifier, an inputsignal, a local-oscillator (LO), a non-linear mixing unit, and a filter. Initially, the localoscillatorwaskeptataconstantfrequency,andfiltersweremadetuneable.This,however,isquitedifficultforhighqualityfiltering,sonowitisthelocaloscillatorthatisvariedandthefilterremainsconstant.
IntroductiontoAstrophysicalInstrumentation:RadioLab July25&26,2017
Page6
Inthisfirstsection,beforeusingtheAirSpywiththesoftwaredefinedradio(SDR)systemto receive electromagneticwaves, youwill use an interactive Javascript program to playwith the concepts described in the lecture. You will see the effects of varying the LOfrequencyonthepowerspectraand,forfun,willseehowsignalscanbetransmittedinafrequencybandcentredatadifferentcarrierfrequency.
Theresultofa linearmixerwillbeasignal that iscomprisedof theweightedsumof thetwo input signals, while the resulting signal from a nonlinearmixer will include higherorderpowersoftheirsum.Themathbehindanonlinearmixerisquitestraightforward,buttounderstandheterodynemixers,ithelpstoworkthroughitatleastonce.
Let S1=asin(2πf1t)And S2=bsin(2πf2t)
wherea,b,arescalingfactors,f1,andf2arefrequencies,andtrepresentstime.Theoutputofanon-linearmixerwillbe
Vout=α1(S1+S2)+α2(S1+S2)2+higherordertermsofdecreasingamplitude…
Vout=α1(S1+S2)+α2(S12+2S1S2+S22)+…
whereα1,andα2arealsoscalingfactors.Thetermthatmakestheheterodynemixerworkisα2(2S1S2).Theextratermswillbepresentinthesignal,butfilterstakecanbeusedtoremovetheireffects,mostofthetime.
Usingtrigonometricidentities,orEuler’sformula,showthat
S1S2=½ab[cos(2π|f1-f2|t)–cos(2π(f1+f2)t)]
whichexplainshowtheresultingsignalhasshiftedfrequencybands.Whatotherfrequencieswouldyouexpecttheretobepeaksat(inanunfilteredpost-heterodynemixersignal)?
IntroductiontoAstrophysicalInstrumentation:RadioLab July25&26,2017
Page7
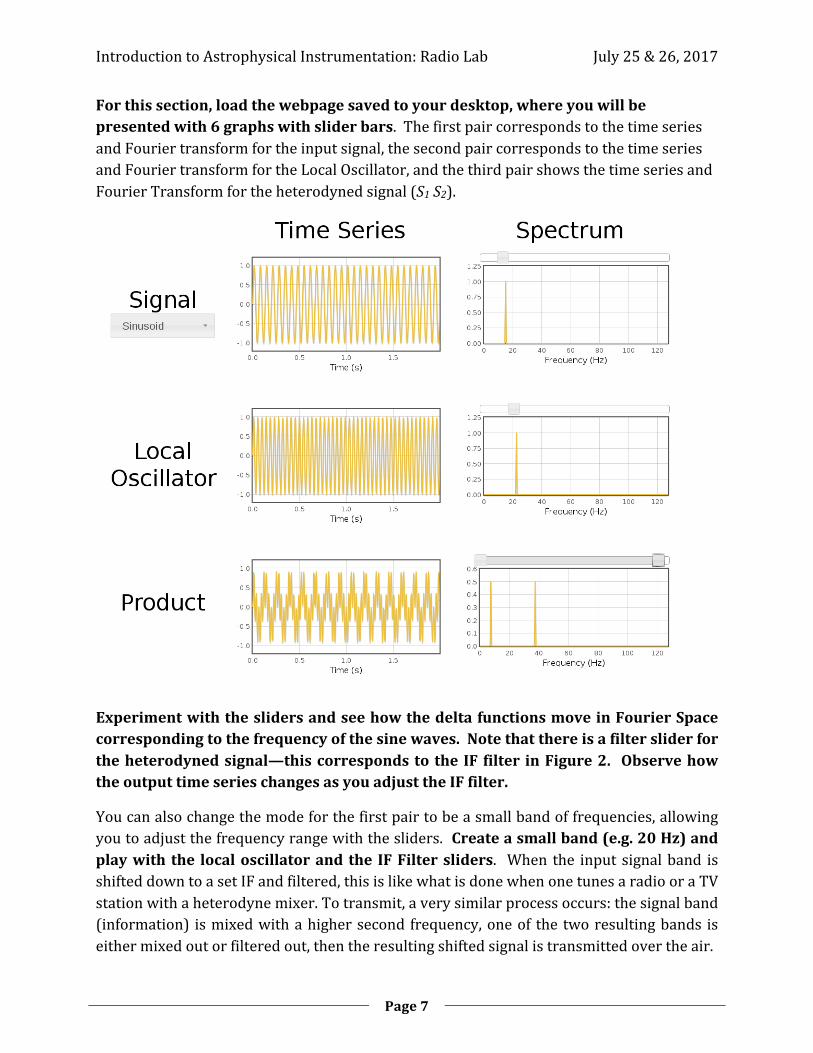
Forthissection,loadthewebpagesavedtoyourdesktop,whereyouwillbepresentedwith6graphswithsliderbars.ThefirstpaircorrespondstothetimeseriesandFouriertransformfortheinputsignal,thesecondpaircorrespondstothetimeseriesandFouriertransformfortheLocalOscillator,andthethirdpairshowsthetimeseriesandFourierTransformfortheheterodynedsignal(S1S2).
ExperimentwiththeslidersandseehowthedeltafunctionsmoveinFourierSpacecorrespondingtothefrequencyofthesinewaves.Notethatthereisafiltersliderfortheheterodynedsignal—thiscorrespondstotheIF filter inFigure2. ObservehowtheoutputtimeserieschangesasyouadjusttheIFfilter.
Youcanalsochangethemodeforthefirstpairtobeasmallbandoffrequencies,allowingyoutoadjustthefrequencyrangewiththesliders.Createasmallband(e.g.20Hz)andplaywith the localoscillatorand the IFFiltersliders. When the input signalband isshifteddowntoasetIFandfiltered,thisislikewhatisdonewhenonetunesaradiooraTVstationwithaheterodynemixer.Totransmit,averysimilarprocessoccurs:thesignalband(information) ismixedwithahighersecond frequency,oneof the tworesultingbands iseithermixedoutorfilteredout,thentheresultingshiftedsignalistransmittedovertheair.

IntroductiontoAstrophysicalInstrumentation:RadioLab July25&26,2017
Page8
AdditionalInformation:onFouriertransformsandaliasing
Notethatsomepuzzlingbehavioursthatcanbeobservedwhenadjustingthesliders…Forinstance, theamplitudeofthesinewavesareconstant,butwhenthefrequencyissettoohighcomparedtothesamplingrate,theresultingsinusoidwillnotbeplottedcorrectly;itwillappeartovaryinamplitude.
Fourier transformsarebasedon sinusoids, so there are repetitions that canoccurwhenfrequenciesshould lieoutsideof the frequencybandyouare interested in. This iscalledaliasing.Whenaportionofthefrequencybandgoesoutofrange,itmaywraparoundandcomebackintothecurrentfrequencyband.

IntroductiontoAstrophysicalInstrumentation:RadioLab July25&26,2017
Page9
FamiliarizationwiththeSoftwareDefinedRadio(SDR)program,‘gqrx’andTuningintoalocalFMRadioStation(15min):
Goals:gettheAirSpyunitworkingwithawholelineofcomponents,butwithno‘real’antenna yet. Learn what the settings names are and mean, change the variousamplificationsettings,andcontinuewithconceptsaboutheterodyningsignalswithoutworryingabouttheantennaitself,bytuningintoalocalradiostation.
OpentheSDRprogram,‘gqrx’and,withtheprocedurebelow,trytofindandtuneinlocalradiostations. Whileyoudon’thaveaproperlytunedantennabuiltyet, the leadsontheSMA connector will act as a very poor gain omni-directional antenna because the leadlengthsaremuchshorterthanhalfawavelength.BecausewearesoclosetotheCNtower,which acts as a transmitter for many stations, the fact that they are terrible antennasshouldnotmatter.You’llbebuildingarealantennasoon,tunedforaspecificfrequency.
Basic AirSpy Setup: Attach the edge-mount SMA connector to one end of the 50 OhmCoaxial cable and the other end to the SMA connector to the AirSpy unit. Connect theAirSpy to the computer via the USB cable and start up the ‘gqrx’ program in a terminalwindow(theterminalprogramcanbefoundunder‘favourites’inthemaindesktopmenu).
Computer_Name$>gqrx<enter>
a)IfasettingsmenuappearsthenfirstselecttheAirSpydeviceandthenmakesurethesamplingfrequencyissetto2500000(iftheAirSpyisn’tlisted,selectOther…andtype‘airspy’inthedevicestringlineandtypeinthesamplingfrequency,manually).

IntroductiontoAstrophysicalInstrumentation:RadioLab July25&26,2017
Page10
b)ClickOK,thenmaximizethesoftwaredefinedradio.Iftherightpanelslookdifferentonyourscreenyoucanmovethemaroundandselecttoviewmorepanelsunderthe‘View’toolbar.
IntroductiontoAstrophysicalInstrumentation:RadioLab July25&26,2017
Page11
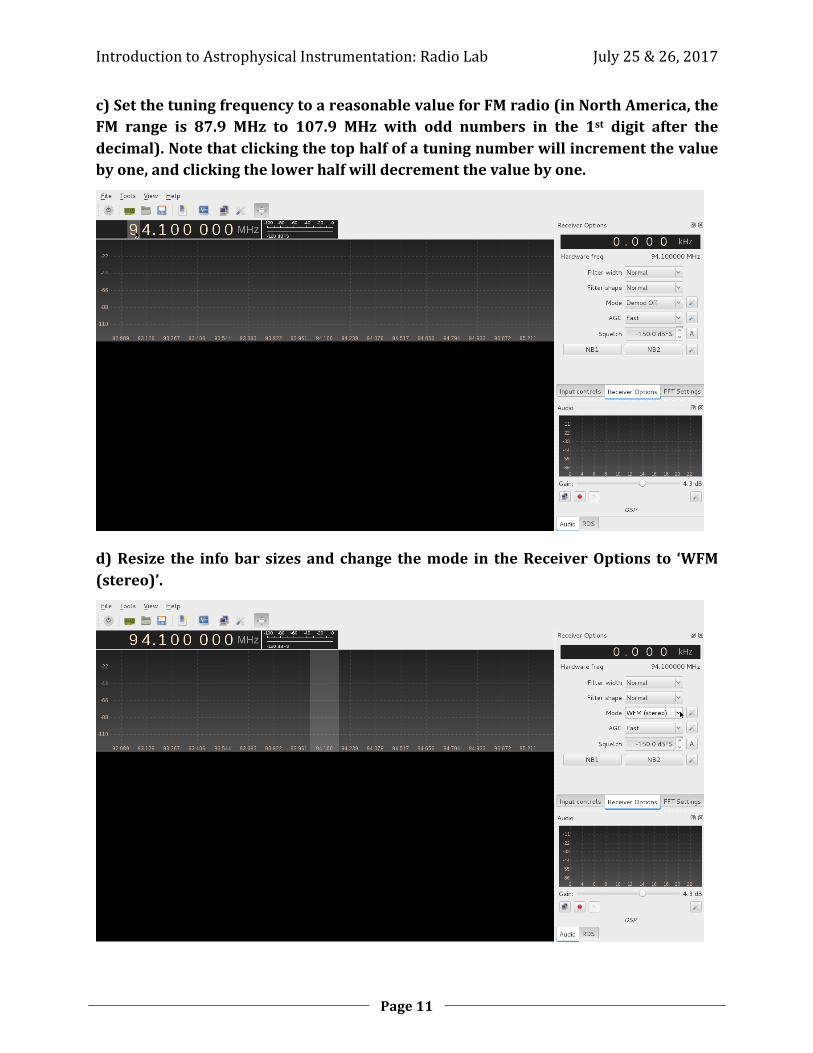
c)SetthetuningfrequencytoareasonablevalueforFMradio(inNorthAmerica,theFM range is 87.9 MHz to 107.9 MHz with odd numbers in the 1st digit after thedecimal).Notethatclickingthetophalfofatuningnumberwillincrementthevaluebyone,andclickingthelowerhalfwilldecrementthevaluebyone.
d)Resize the infobar sizesand change themode in theReceiverOptions to ‘WFM(stereo)’.
IntroductiontoAstrophysicalInstrumentation:RadioLab July25&26,2017
Page12
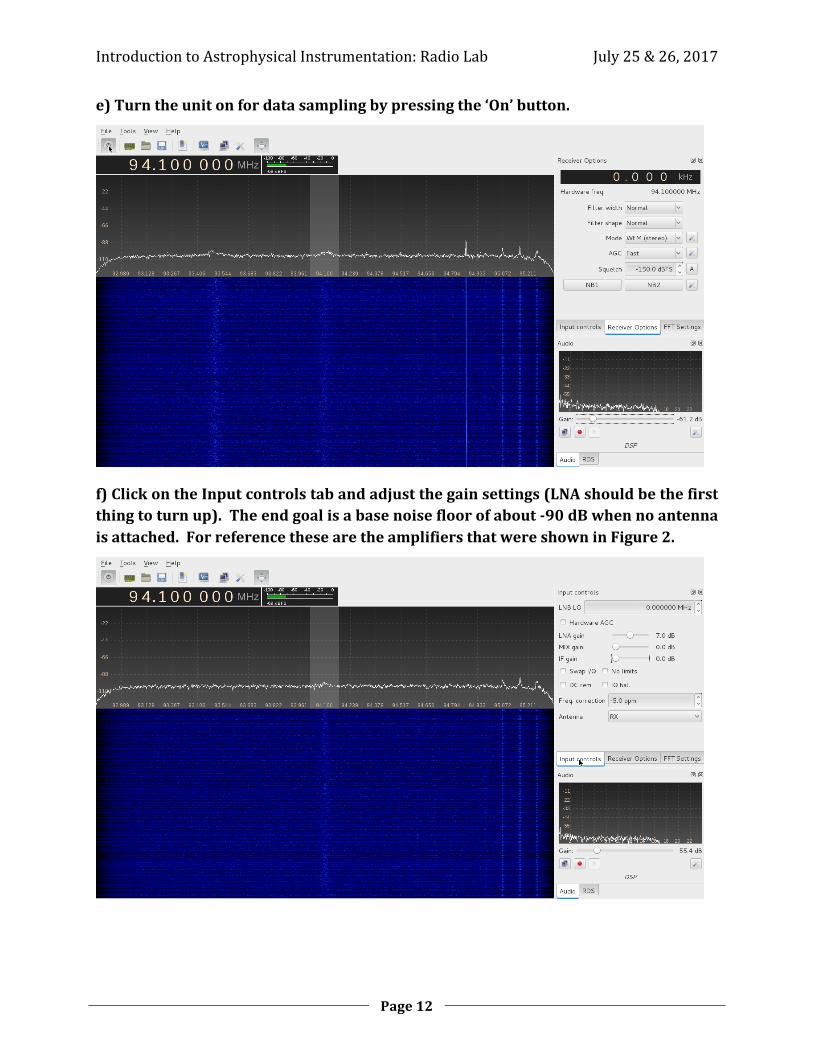
e)Turntheunitonfordatasamplingbypressingthe‘On’button.
f)ClickontheInputcontrolstabandadjustthegainsettings(LNAshouldbethefirstthingtoturnup).Theendgoalisabasenoisefloorofabout-90dBwhennoantennaisattached.ForreferencethesearetheamplifiersthatwereshowninFigure2.

IntroductiontoAstrophysicalInstrumentation:RadioLab July25&26,2017
Page13
g)Adjustthegain(essentiallythevolumecontrol)intheAudiotabsoyoucanlistentoyourradio
IntroductiontoAstrophysicalInstrumentation:RadioLab July25&26,2017
Page14
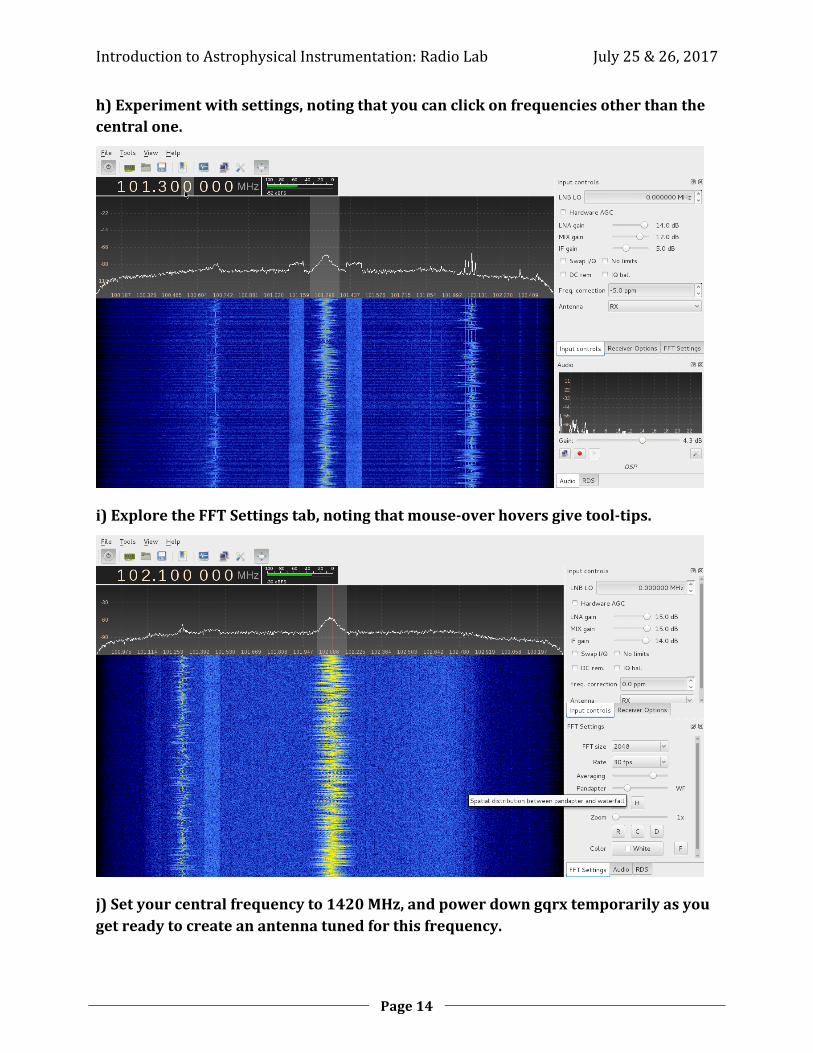
h)Experimentwithsettings,notingthatyoucanclickonfrequenciesotherthanthecentralone.
i)ExploretheFFTSettingstab,notingthatmouse-overhoversgivetool-tips.
j)Setyourcentralfrequencyto1420MHz,andpowerdowngqrxtemporarilyasyougetreadytocreateanantennatunedforthisfrequency.
IntroductiontoAstrophysicalInstrumentation:RadioLab July25&26,2017
Page15
TheCircuitScribe:ConductiveInkTesting(10-20min):
Goals:learnhowtousetheconductiveinkpen,andcharacterizetheresistancesbasedonlinewidth
TheCircuitScribepenwriteswithanon-toxic,odour-freesolutioncontainingsilver. Theconductivityisdependentonthematerialwrittenon,withglossyphoto-printingpaperforink-jetprintersyieldingthelowestresistances.Accordingtothemanufacturer’swebpage(www.electroninks.com),theresistancesaretypically2-10Ohmspercmofwritingwhenwriting with fine lines. For an antenna, we would like to have very low electricalresistancespercmlength,especiallysinceourantennaswillhavearmsontheorderof5cmormore. Toreduce theresistanceper length,wecan increase thewidthofourelectricaltracesand/ordepositmoreconductiveinkinthesameplace.
On a piece of glossy photo paper, experiment with drawing techniques (parallellines, tiny circles, drawing over the same area, etc.) and draw 2 cm long lines ofvaryingwidths (while staying less than ~0.5 cm thick). Note that if you draw toohard,youmaytearintothepapermakingitdifficulttoerase.
What are the resistances for each technique? Does the ink dry quickly? Does theresistancechangebasedonhowfreshtheinkis?Whichdrawingtechniquegivesthemost consistent and lowest resistance? Howwidedoes a trace need to be for theresistancetoapproachtheresistanceofyourleadsonthemultimeter?
IntroductiontoAstrophysicalInstrumentation:RadioLab July25&26,2017
Page16
TheDipoleAntenna:Drawingandbuildingatunedhalf-wavelengthantenna(30min)
Goals:Drawadipoleantennaand tune it tomaximize theamplitudeof the receivedsignal.
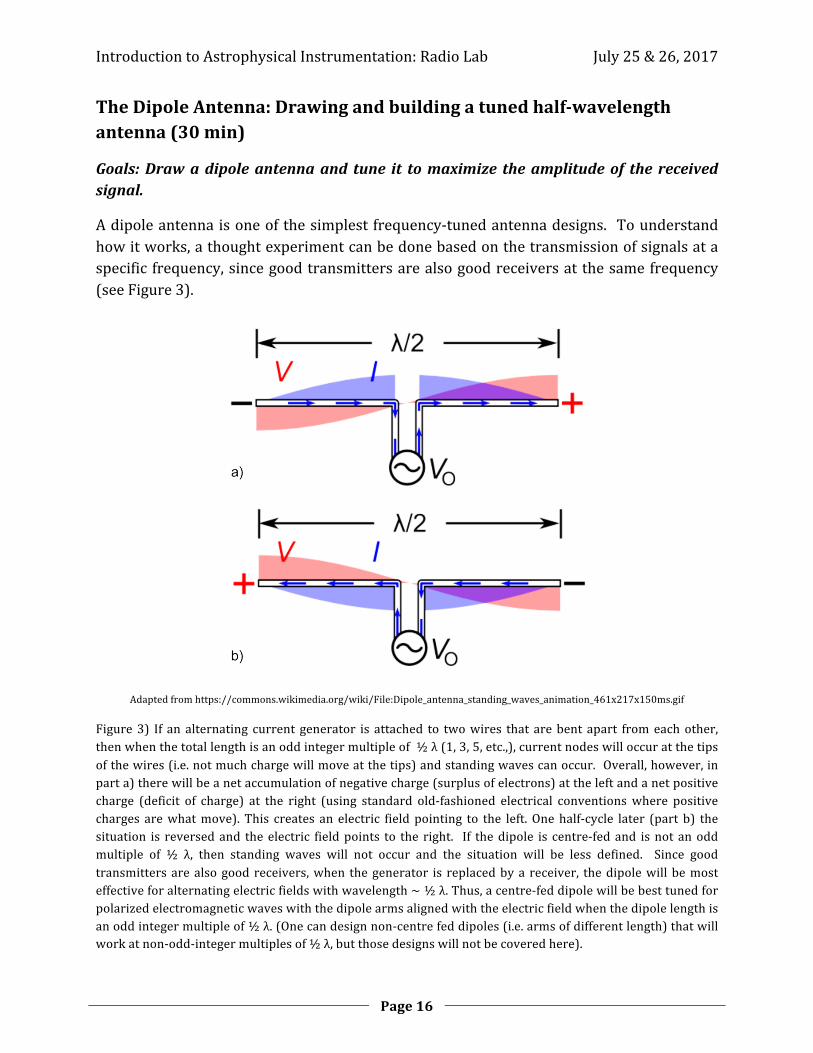
Adipoleantennaisoneofthesimplestfrequency-tunedantennadesigns. Tounderstandhowitworks,athoughtexperimentcanbedonebasedonthetransmissionofsignalsataspecific frequency,sincegoodtransmittersarealsogoodreceiversatthesamefrequency(seeFigure3).
Adaptedfromhttps://commons.wikimedia.org/wiki/File:Dipole_antenna_standing_waves_animation_461x217x150ms.gif
Figure3) If analternating current generator is attached to twowires that arebent apart fromeachother,thenwhenthetotallengthisanoddintegermultipleof½λ(1,3,5,etc.,),currentnodeswilloccuratthetipsofthewires(i.e.notmuchchargewillmoveatthetips)andstandingwavescanoccur.Overall,however,inparta)therewillbeanetaccumulationofnegativecharge(surplusofelectrons)attheleftandanetpositivecharge (deficit of charge) at the right (using standard old-fashioned electrical conventionswhere positivecharges arewhatmove). This creates an electric field pointing to the left.Onehalf-cycle later (part b) thesituation is reversedand theelectric fieldpoints to the right. If thedipole is centre-fedand isnot anoddmultiple of ½ λ, then standing waves will not occur and the situation will be less defined. Since goodtransmittersarealsogoodreceivers,when thegenerator is replacedbya receiver, thedipolewillbemosteffectiveforalternatingelectricfieldswithwavelength~½λ.Thus,acentre-feddipolewillbebesttunedforpolarizedelectromagneticwaveswiththedipolearmsalignedwiththeelectricfieldwhenthedipolelengthisanoddintegermultipleof½λ.(Onecandesignnon-centrefeddipoles(i.e.armsofdifferentlength)thatwillworkatnon-odd-integermultiplesof½λ,butthosedesignswillnotbecoveredhere).

IntroductiontoAstrophysicalInstrumentation:RadioLab July25&26,2017
Page17
DipoleCreationProcedure:
1) Notetheseparationofthethreeprongsinalineontheedge-mountSMAboardconnector. The edge-mount connector has a very tight fit when put on thefiberglass(FR4)boardwiththeglossyphotopaper,soinitialtracesmustbedrawnon the paper before attaching the connector to the board and paper.Draw twoleadsstartingfromtheedgeofthepaperandperpendiculartothepaperedgethatmatchthespacingofthecentrepinandoneofthesidepins. Makesuretheyarelongenoughtoclearthegrooveinthemountingtubewhentheboardismountedonthetube.
2) Aftergivingyourtracesashortperiodoftimetodryandcheckingtheirresistancewith themultimeter (they should be close to the resistance of the leads—depositmore conductive ink if they are not), hold the edge-mount SMA adapter to yourtracesonthepaper,andthen,bypushingthepaper+adaptergroupataslightanglewithrespecttotheFR4board,wedgetheSMAadapterandpaperontotheboard.
3) Measuretheresistancebetweenthepinsandtheleads—makesuretheyhavegoodconnections(verylowresistances).Ifitisclosetothesameresistanceaswhenyoutouchtheleadstogether,thensecureyoursheetofpapertotheboardwithtape.
4) Mount your FR4 board onto the support tube on the rotating tray (‘lazy Susan’)eitherintheverticalslotorbyusingtheattachmentonthebackoftheboard.
5) Draw an antenna, lengthening each arm incrementally and keeping thepositionandorientationoftheantennawithrespecttothetransmitterintheroom constant. Remember to step away from the antenna while observing thesignalamplitudeinthepowerspectra/waterfallplot(peoplewill interactwiththeEMwavesinsometimesnon-intuitiveways,asanyonewithaTVantennainsidetheplacethattheylivewillattestto).
6) Comparethelengthofyourdipoletunedtomaximizethereceptionofthegeneratedsignalwiththetheoreticallength.
Note:Thetracethatyouhavedrawnisnotquitesymmetrical...Sincewehavetracesthatarewideron thepaper than theyare thick, theywillnotquitehave the sameresonancebasedon theorientationof thepaper (seeFigure4). Trymounting theantenna in itssecondmounting orientation and compare (qualitatively) the power of the signal.Also,drawasecondantennawithwidertracesandqualitativelynotehowthewidthaffects the lengthneededto tune. Is thereasignificantdifference,or is itvirtuallyunchangedwithourlevelofsensitivityhere?
IntroductiontoAstrophysicalInstrumentation:RadioLab July25&26,2017
Page18
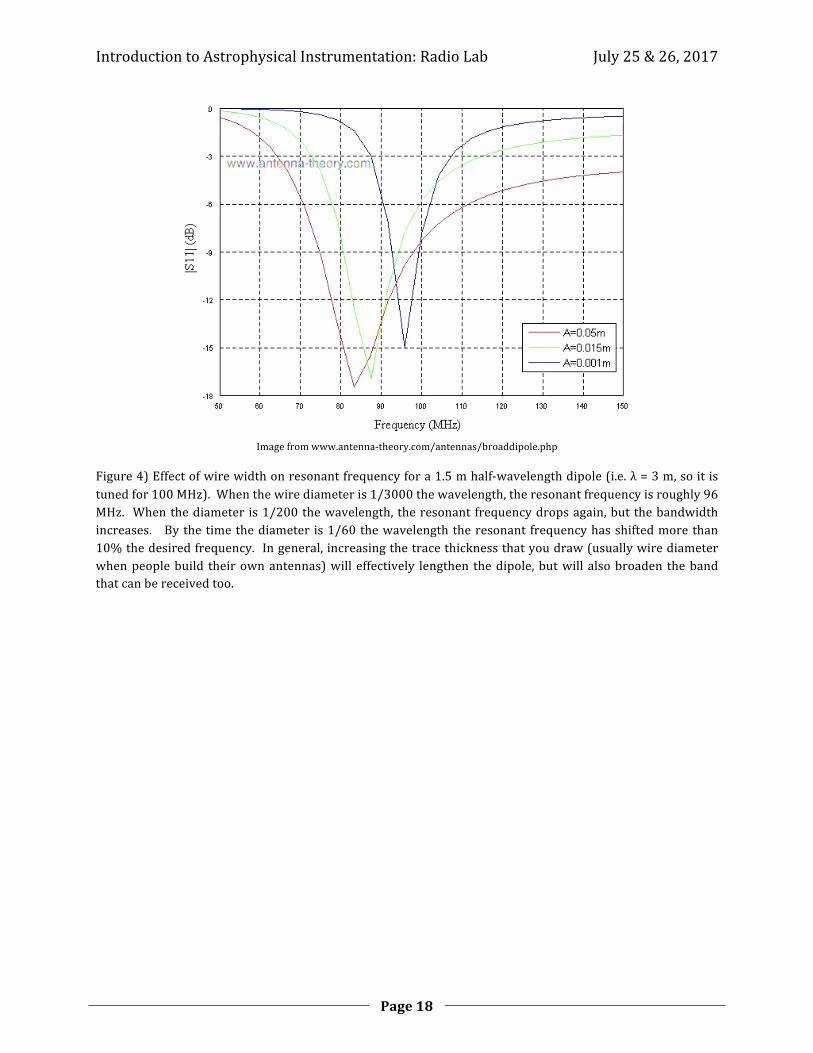
Imagefromwww.antenna-theory.com/antennas/broaddipole.php
Figure4)Effectofwirewidthonresonantfrequencyfora1.5mhalf-wavelengthdipole(i.e.λ=3m,soitistunedfor100MHz).Whenthewirediameteris1/3000thewavelength,theresonantfrequencyisroughly96MHz. Whenthediameter is1/200thewavelength, theresonant frequencydropsagain,butthebandwidthincreases. Bythetimethediameter is1/60thewavelengththeresonant frequencyhasshiftedmorethan10%thedesiredfrequency.Ingeneral,increasingthetracethicknessthatyoudraw(usuallywirediameterwhenpeoplebuild theirownantennas)will effectively lengthen thedipole,butwill alsobroaden thebandthatcanbereceivedtoo.
IntroductiontoAstrophysicalInstrumentation:RadioLab July25&26,2017
Page19
Characterizingtheantennabeamshape(30-45min)
Goals:with thedrawnantennas, rotate theantenna incrementallyandnotehow thegainchanges.Trytodrawaroughbeampatternfromthis.Thinkaboutsymmetryofthephysicaldeviceandseeifitisrelatedtotheshapeofbeampatternin3d.
Procedure:Withtheantennamountedinthenotchesonthetubeandtheprotractorbelowtheglassturntable,orientyourantennasothatthedrawnantennafacesthetransmitter. Lift the glass turntable (do not lift by the plastic tube) and rotate theprotractorsothatthe0°markpointstowardthetransmitter.
Nextrotatetheantenna360°andseeifthereisanyvariationinthepower(hopefullythereis—ifnot,calloneofthelabinstructorstotrytotroubleshootyoursetup).
Measured Power in dB = 10 log10 !"#$%&'()*+',!"#$%+'-'+'./'
, so 3 dB is a doubling in power. The
waterfallplotwillshowthepowerasacolourvariation,andtheplotaboveitwillallowyouto estimate the peak power—it gives values in Power (dBFS), so it’s reference is themaximum voltage (Full Scale, or FS) that the AirSpy can handle. Common units inastrophysicsandantennatheoryincludedBm(reference=1mW),dBW(reference=1W),anddBi(reference=isotropicantennagain).
At the top of the screen, there is a green bar with a power level in dBFS that shouldcorrespondwiththepeakpowershownonthepowerspectrum.Iftheyagree,youcanusethat tohelpmeasurethepoweratvariousangles. (Makesureyourtunedfrequency linematchesupwiththepeak).
Why is thesecondmountingorientation (i.e.using theringon thebackof theFR4boardtoconnecttothetube)non-idealforthissection?Whatisitsaxisofrotation?
IntroductiontoAstrophysicalInstrumentation:RadioLab July25&26,2017
Page20
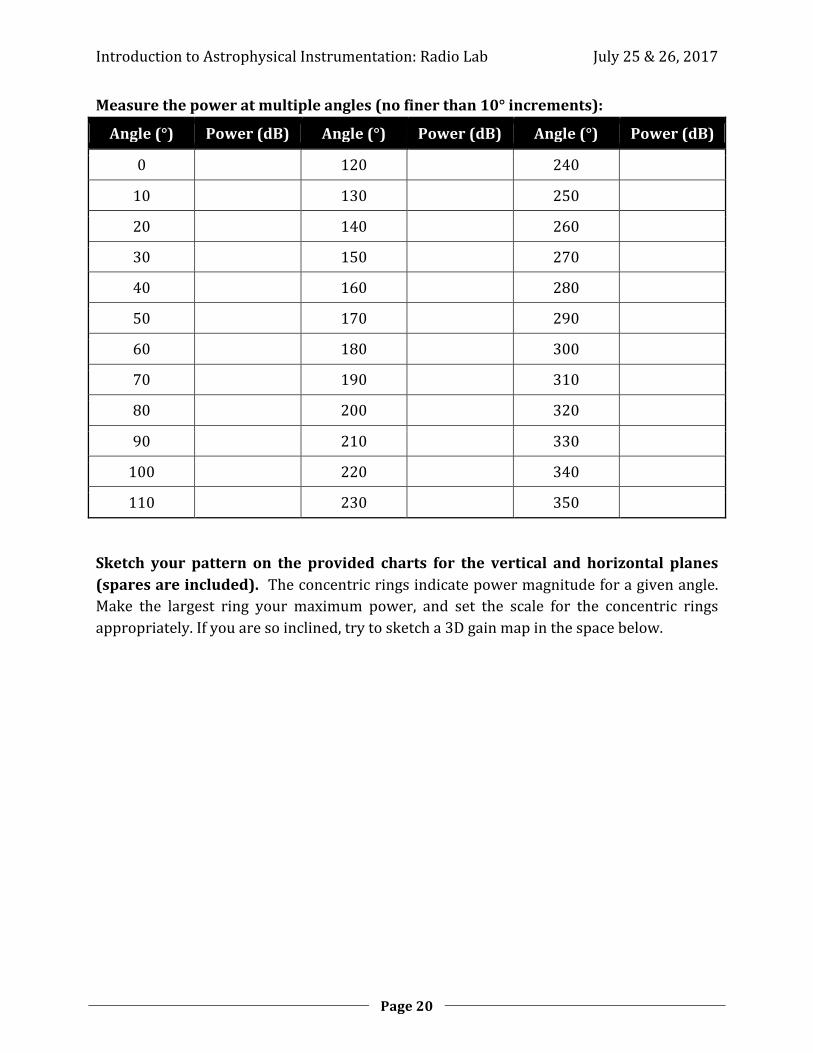
Measurethepoweratmultipleangles(nofinerthan10°increments):
Angle(°) Power(dB) Angle(°) Power(dB) Angle(°) Power(dB)
0 120 240
10 130 250
20 140 260
30 150 270
40 160 280
50 170 290
60 180 300
70 190 310
80 200 320
90 210 330
100 220 340
110 230 350
Sketch your pattern on the provided charts for the vertical and horizontal planes(sparesareincluded). Theconcentricringsindicatepowermagnitudeforagivenangle.Make the largest ring your maximum power, and set the scale for the concentric ringsappropriately.Ifyouaresoinclined,trytosketcha3Dgainmapinthespacebelow.
IntroductiontoAstrophysicalInstrumentation:RadioLab July25&26,2017
Page21
0°10°20°30°
40°50°
60°
70°
80°
90°
100°
110°
120°
130°140°
150°160° 170° 180° 190°
200°210°
220°230°
240°
250°
260°
270°
280°
290°
300°310°
320°330°
340°350° 0°10°20°30°
40°50°
60°
70°
80°
90°
100°
110°
120°
130°140°
150°160° 170° 180° 190°
200°210°
220°230°
240°
250°
260°
270°
280°
290°
300°310°
320°330°
340°350°
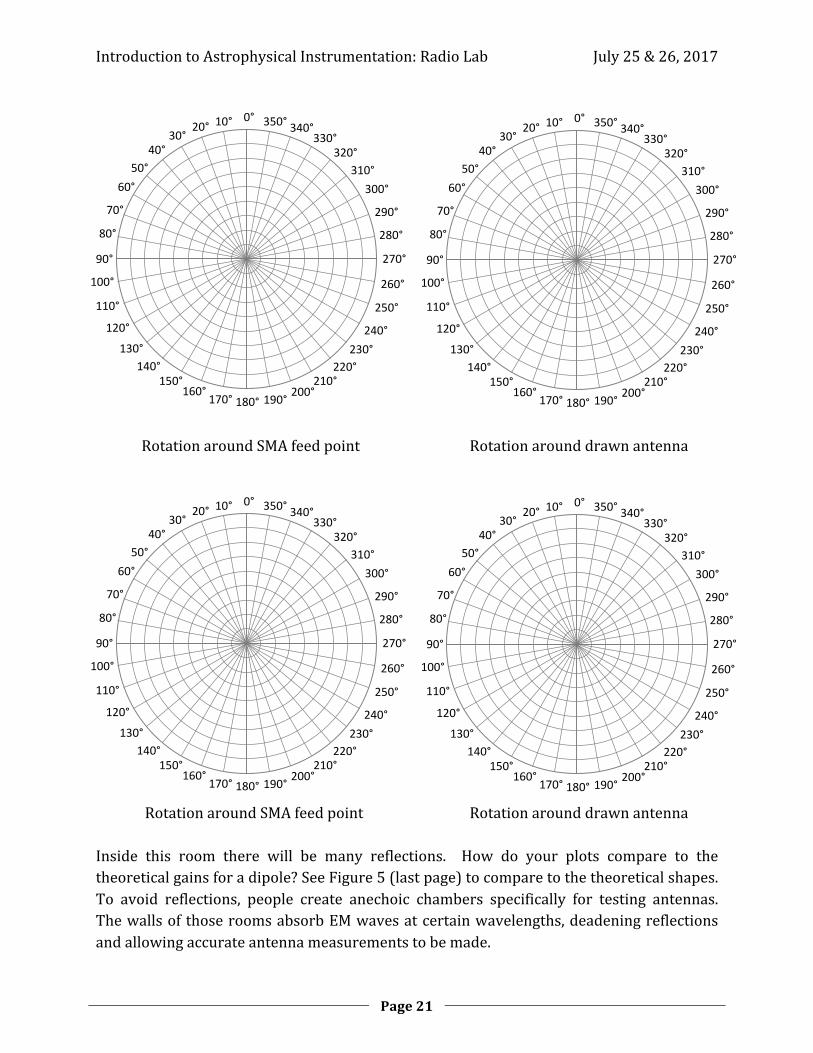
RotationaroundSMAfeedpoint Rotationarounddrawnantenna
0°10°20°30°
40°50°
60°
70°
80°
90°
100°
110°
120°
130°140°
150°160° 170° 180° 190°
200°210°
220°230°
240°
250°
260°
270°
280°
290°
300°310°
320°330°
340°350° 0°10°20°30°
40°50°
60°
70°
80°
90°
100°
110°
120°
130°140°
150°160° 170° 180° 190°
200°210°
220°230°
240°
250°
260°
270°
280°
290°
300°310°
320°330°
340°350°
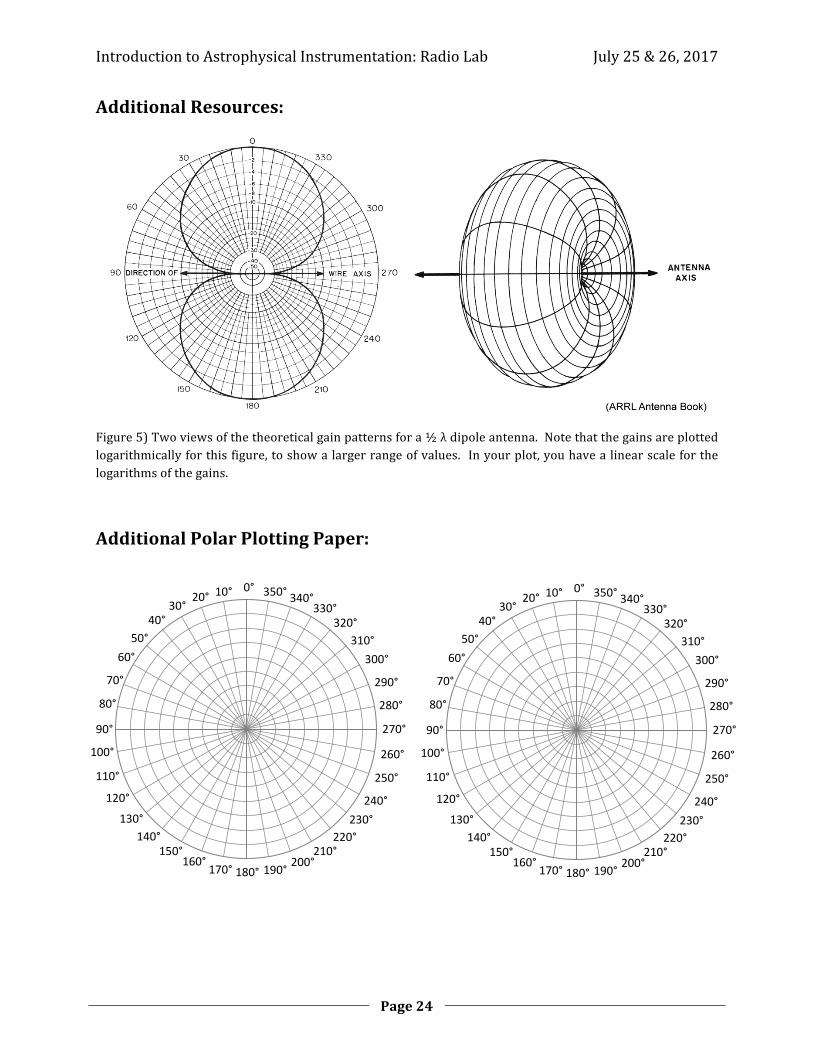
RotationaroundSMAfeedpoint RotationarounddrawnantennaInside this room there will be many reflections. How do your plots compare to thetheoreticalgainsforadipole?SeeFigure5(lastpage)tocomparetothetheoreticalshapes.To avoid reflections, people create anechoic chambers specifically for testing antennas.ThewallsofthoseroomsabsorbEMwavesatcertainwavelengths,deadeningreflectionsandallowingaccurateantennameasurementstobemade.

IntroductiontoAstrophysicalInstrumentation:RadioLab July25&26,2017
Page22
Investigatingalternateshapesandtheireffectsonbandwidthandgain/directivity(30min)
Goals: Create a Yagi-Uda 2 element design (no electrical connection point), combinetwo dipole antennas in two of the three possible configurations: vertically stacked(broadside),andonedipoleinfrontoftheotherpointedtowardthesource(end-fireorechelon). Think about how combining multiple dipoles in these differentconfigurations may (qualitatively) affect the beam shape and gain based oninterferencearguments.
Yagi-Uda
TheYagi-Udaantennausesconductiveelementstoconditionthewave in freespaceneartheantennatoincreasetheantennagain(theseconductors,arecalled‘parasitic’elements).Itconsistsofadipoleantennaand1ormoreelectricalconductorsneartheantennawhichmodify the incoming electromagneticwave, essentially focusing thewaves to the dipole.Therearetwo2elementvariationsfortheYagi-Udadesign:Onewithareflectorbehindthedipole,andonewitha ‘steeringelement’or ‘director’ infrontofthedipole. Thereflectorshouldbeatleast5%longerthanthedipoletominimizeendeffects,andshouldbe0.15to0.25λbehindit.Whyshouldareflector0.25λbehindthedipolehelp?
The ‘director’ should be 5% shorter than the dipole and 0.1 to 0.15 λ in front of it(http://www.ph.surrey.ac.uk/satellites/main/assets/schoolzone/project1/reflectors_directors.htm). The re-radiated wave will add with the wave naturally impinging on theantenna,increasingthegainintheforwarddirection.
StackedandEnd-FireArrays
Stackedandend-firearraysareessentiallythesameconfigurationindifferentorientations,butwithdifferentspacingbetweentheelectricallyjoinedidenticaldipoleelements.Whenthe elements are vertically stacked, they should be separated by½ λ for interference tocanceloutsignalsaboveandbelowthearray,andwhentheyareonein-frontoftheother(end-fire)theyshouldbeseparatedbyintegermultiplesofλ.
Buildat leastoneofthesetwoantennaarraysandtrytosee if theyworkasexpected(isgainincreasedintheforwarddirectionanddecreaseaboveandbelowthearray?).Shouldthere be a slight decrease in separation to account for the propagation speed in theconductor?
IntroductiontoAstrophysicalInstrumentation:RadioLab July25&26,2017
Page23
Observationsoftheskywithantennasat21cm(15-30min)
Goals:Gooutsideandfindthesun!
Withstarsactingasblack-bodyradiationastronomersdidnotbelievetherewouldbemuchto see astronomically, so didn’t actually look for anything after initial tests were notconclusive. ItwasaradioengineerforBellLaboratories,Karl Jansky,notanastronomer,who,whileworkingtodeterminewhytherewasinterferenceintelephonecalls,discoveredradio sources from the centre of our galaxy in1933 and accidentally started the field ofradio astronomy and cosmology. The radio band is one of two windows forelectromagneticradiation,andthelargerofthetwo(theotherbeingthevisiblelightband),buttechnologyandbadluckhadhelduppeoplefromobservingtheskyuntillessthan100yearsago.Observetheskywithyournewantenna(orantennaarray)andseeifyoucan observe any variations in the intensity as you point your antenna in differentdirections.
BonusStage:CollinearArrays
Connectyourantennawithanothergroups’antennamakingasmallphasedcollineararray(antennasareplacedsidebyside).Thisissimilartowhatyoudidinstage6,butrequiresacombiner circuit, new mounting tubes, and another group. Note that you will needessentiallyidenticaldipolesspacedcorrectlyforthistowork.Seeifyoucandetectfringeswhenpointingthenewantennaarraytowardsthesun(i.e.pointtheantennaarrayatthesunandthenrotateitandseeiftherearelowerintensitythenhigherintensityzonestothesidesofthehighestpowerdetection).
AdditionalReading,forthecurious:
ConstantineA.Balanis,AntennaTheory:AnalysisandDesign,Wiley-Interscience,2005.
GeneralReference:TheARRLAntennaBookby theAmericanRadioRelayLeague (manyeditions;mineisthe17thedition(apracticalguideforbuildingantennas))
www.antenna-theory.comforbasicsofantennas:agreatresourcewhenbeginning
NationalRadioAstronomyObservatory(NRAO):thesewebsitescoverboththehistoryandtheoryforradioastronomy:searchingwww.nrao.eduwillyieldalotofgreatinformation,andevenafewonlinecourses.
A.R. Thompson, J.M. Moran, and G.W. Swenson Jr, Interferometry and Synthesis in RadioAstronomy, Wiley-VCH, 2004. Not in the scope of this laboratory session, but a goodreferenceifyouareinterestedinthefield.
IntroductiontoAstrophysicalInstrumentation:RadioLab July25&26,2017
Page24
AdditionalResources:
Figure5)Twoviewsofthetheoreticalgainpatternsfora½λdipoleantenna.Notethatthegainsareplottedlogarithmicallyforthisfigure,toshowalargerrangeofvalues. Inyourplot,youhavealinearscaleforthelogarithmsofthegains.
AdditionalPolarPlottingPaper:
0°10°20°30°
40°50°
60°
70°
80°
90°
100°
110°
120°
130°140°
150°160° 170° 180° 190°
200°210°
220°230°
240°
250°
260°
270°
280°
290°
300°310°
320°330°
340°350° 0°10°20°30°
40°50°
60°
70°
80°
90°
100°
110°
120°
130°140°
150°160° 170° 180° 190°
200°210°
220°230°
240°
250°
260°
270°
280°
290°
300°310°
320°330°
340°350°