destinations edition...this information from social media. still, differences by age group are...
TRANSCRIPT
The Destinations Edition
The State of the American Traveler
TM
DESTINATIONS EDITION
Winter 2019 | Volume 31
be attaching somewhat less importance to leisure travel
spending this year. This report additionally takes a deep dive
into the destinations Americans are wanting to explore in
the upcoming year. If you should have questions or ideas for
future survey topics, we welcome you to message us:
@DA_Research.
THE DESTINATIONS EDITION of The State of the American
TravelerTM explores ideas and concepts around where and
why people travel. As always, we start with an examination
of the current leisure travel landscape, which features a
somewhat darkened traveler mood. Demand for leisure travel
will likely remain strong this year, but American expectations
for increased leisure travel in the next year has weakened.
When planning their budgets, Americans also appear to
Destination Analysts’
[email protected] @DA_Research
SPONSORED BY

01
THE STATE OF THE AMERICAN TRAVELER SURVEY is conducted quarterly by
Destination Analysts, Inc., a San Francisco-based tourism industry research company.
The survey is conducted online amongst a nationally representative sample of adult
Americans. From January 4th to the 12th, 2019, surveys were collected from a group
of respondents who were then screened by their leisure travel behavior. Only those
respondents who had traveled at least once in the past 12 months for purely leisure
or personal reasons were interviewed. This travel must have been of at least 50 miles
one-way — the standard distance threshold used in the tourism industry to signify that
a “trip” has been taken. In total, 2,000 leisure travelers completed the survey. With this
sample size, the top line data presented here can be considered to have a reliability of +/-
2.2%. This information is provided “as is” and intended for informational purposes only.
It should not be relied upon for operational, marketing, legal, technical, tax, financial
or other advice. Destination Analysts is not responsible for your use of the information
contained herein (including errors, omissions, inaccuracy or non-timeliness of any kind)
or any assumptions or conclusions you might draw from its use.
American Travel Expectations
Travel as a Budget Priority
How American Leisure Travel
Destination Brand Performance
The Top 20: Destination Hotlist
Destination Expectations, 2019
Climate Change and Travel
Methodology
Contents
02
03
04
05
07
08
10

02
THE NEW YEAR has started with undertones of
considerable uncertainty. While economic indicators
had remained strong for much of the past year, talk of
a slowdown now is in the wind. Sluggish growth, trade
wars, higher interest rates, inverted yield curves, political
gridlock and government shutdowns are all part of the
conversation. We are currently experiencing what may
be early signs of a pessimistic shift in the collective
traveler psyche, as our latest sentiment tracking
survey point toward a potential weakening of the
domestic leisure travel market. In our most recent
survey wave, the percent of travelers who said they
expect to travel more in the next 12 months decreased.
Only 33.4 percent said they would be taking more
trips, compared to 37.0 percent one year earlier.
This moderate degree of pessimism seen in trip
expectations also extends to future travel spending.
When asked if they expect to spend more in the
upcoming year on leisure travel, only 32.2 percent
of American leisure travelers said that they would
be beefing up their expenditures. This is down from
36.5 percent one year ago.
1 Travel Expectations & Travel Spending Expectations
Travel Expectations (Trips) Travel Expectations (Spending)
JAN 2019 58.0%
33.4%
8.7%
57.1%
32.2%
10.7%
expect moreTHE KEY: expect the same expect less
0 030 3010 1020 2040 4050 50 6060Percentage
JAN 2018
APR 2018
OCT 2017
55.6%
56.4%
37.0%
37.6%
7.4%
6.1%
54.6%
38.2%
7.2%
54.0%
55.3%
36.5%
37.1%
9.4%
7.6%
54.6%
35.8%
9.6%
OCT 2018 54.5%
37.5%
8.0%
53.1%
36.9%
10.1%
JULY 2018 57.4%
32.5%
10.1%
55.6%
31.7%
12.7%
Q: In the next 12 months, do you expect to
travel more or less for leisure than you did in
the most recent 12 month period?
Q: In the next 12 months, do you expect
to spend more or less for leisure travel than
you did in the most recent 12 month period?
03
2
0% 25% 30%10% 15%5% 20%
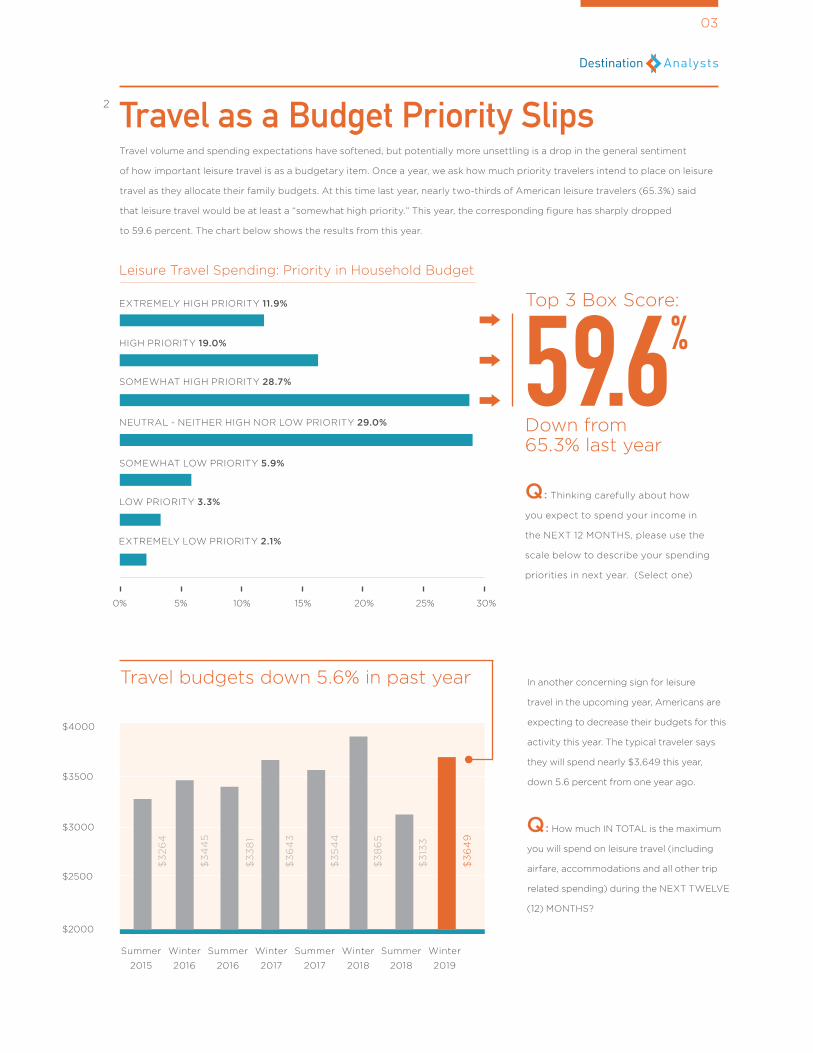
EXTREMELY HIGH PRIORITY 11.9%
SOMEWHAT LOW PRIORITY 5.9%
SOMEWHAT HIGH PRIORITY 28.7%
EXTREMELY LOW PRIORITY 2.1%
HIGH PRIORITY 19.0%
LOW PRIORITY 3.3%
NEUTRAL - NEITHER HIGH NOR LOW PRIORITY 29.0%
36
43
.26
13
Travel volume and spending expectations have softened, but potentially more unsettling is a drop in the general sentiment
of how important leisure travel is as a budgetary item. Once a year, we ask how much priority travelers intend to place on leisure
travel as they allocate their family budgets. At this time last year, nearly two-thirds of American leisure travelers (65.3%) said
that leisure travel would be at least a “somewhat high priority.” This year, the corresponding figure has sharply dropped
to 59.6 percent. The chart below shows the results from this year.
Q: How much IN TOTAL is the maximum
you will spend on leisure travel (including
airfare, accommodations and all other trip
related spending) during the NEXT TWELVE
(12) MONTHS?
In another concerning sign for leisure
travel in the upcoming year, Americans are
expecting to decrease their budgets for this
activity this year. The typical traveler says
they will spend nearly $3,649 this year,
down 5.6 percent from one year ago.
Travel budgets down 5.6% in past year
$3000
$2000
$3500
$2500
$4000
Summer
2015
Summer
2016
Summer
2017
Summer
2018
Winter
2018
Winter
2019
Winter
2016
Winter
2017
$3
64
3
$3
86
5
$3
54
4
$3
133
$3
64
9
$3
38
1
$3
44
5
$3
26
4
Travel as a Budget Priority Slips
Leisure Travel Spending: Priority in Household Budget
Q: Thinking carefully about how
you expect to spend your income in
the NEXT 12 MONTHS, please use the
scale below to describe your spending
priorities in next year. (Select one)
59.6%
Down from 65.3% last year
Top 3 Box Score:

04
3.1
In the past year, the average American leisure traveler took 4.02 trips (50 miles or more away from their home for purely leisure
reasons.) This is down by about one half a trip from one year earlier, when the typical leisure traveler reported taking 4.57 trips.
How Americans Travel for Leisure
45.6% DAY TRIPS(50 miles+ from home with no overnight stay)
31.0% VISITED A NATIONAL PARK OR MONUMENT
32.8% TRAVELED WITH OWN CHILDREN
30.4% VISITED A THEME OR AMUSEMENT PARK
33.4% VISITED A STATE OR
REGIONAL PARK
18.2% TRAVELEDTO ATTEND A
FESTIVAL OR SPECIAL EVENT
27.1% MULTIGENERATIONAL TRIPS
(3 or more generations traveling together)
82.1% ROAD TRIPS(Primarily by automobile)
58.7% REGIONAL TRIPS
(200 miles from home maximum)
54.1% PLANE TRIPS(Trip included air component)
24.6% INTERNATIONAL TRIPS
(Traveled outside the USA)
10.2% TRAIN TRIPS(Intercity trip)
13.1% CRUISE TRIPS
(One or more night on board)
3.32
3.31
2.23
2.091.70
1.67
1.77
AV
G #
OF
TR
IPS
(Am
on
g th
ose
takin
g
each
typ
e trip
)
2.22
Percent of Travelers Taking Each Trip Type
05
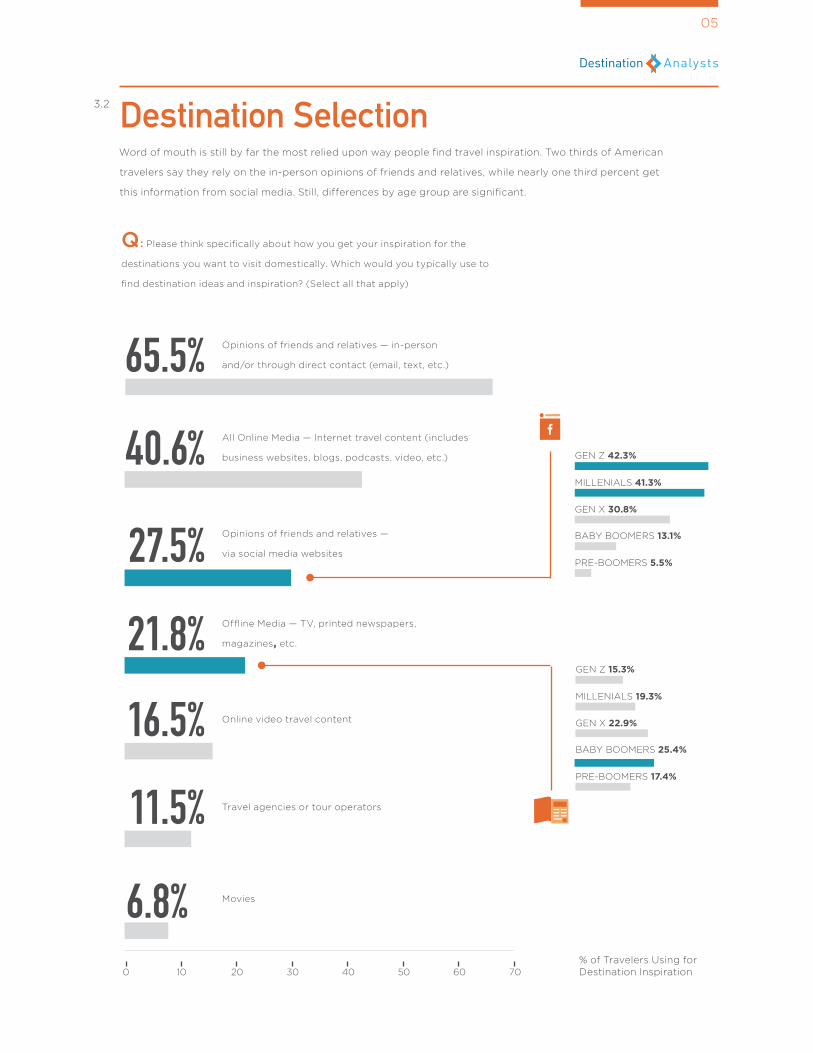
3.2 Destination SelectionWord of mouth is still by far the most relied upon way people find travel inspiration. Two thirds of American
travelers say they rely on the in-person opinions of friends and relatives, while nearly one third percent get
this information from social media. Still, differences by age group are significant.
Q: Please think specifically about how you get your inspiration for the
destinations you want to visit domestically. Which would you typically use to
find destination ideas and inspiration? (Select all that apply)
65.5%
21.8%
40.6%
27.5%
11.5%
6.8%
Opinions of friends and relatives — in-person
and/or through direct contact (email, text, etc.)
Offline Media — TV, printed newspapers,
magazines, etc.
All Online Media — Internet travel content (includes
business websites, blogs, podcasts, video, etc.)
Travel agencies or tour operators
Movies
0 3010 60 704020 50% of Travelers Using for Destination Inspiration
Opinions of friends and relatives —
via social media websites
GEN Z 42.3%
MILLENIALS 41.3%
GEN X 30.8%
BABY BOOMERS 13.1%
PRE-BOOMERS 5.5%
GEN Z 15.3%
MILLENIALS 19.3%
GEN X 22.9%
BABY BOOMERS 25.4%
PRE-BOOMERS 17.4%
16.5% Online video travel content
06
70%
60%
50%
40%
30%
20%
10%
0%
0% 5% 10% 15% 20% 25% 30% 35%
Likely to Visit (Next 3 Years)(% of American Leisure Travelers)
De
stin
ati
on
Rate
d “
Ap
pe
alin
g”
or
“Extr
em
ely
Ap
pe
alin
g”
(%
of
Am
eri
can
Leis
ure
Tra
vele
rs)
*Bubble placement is approximate
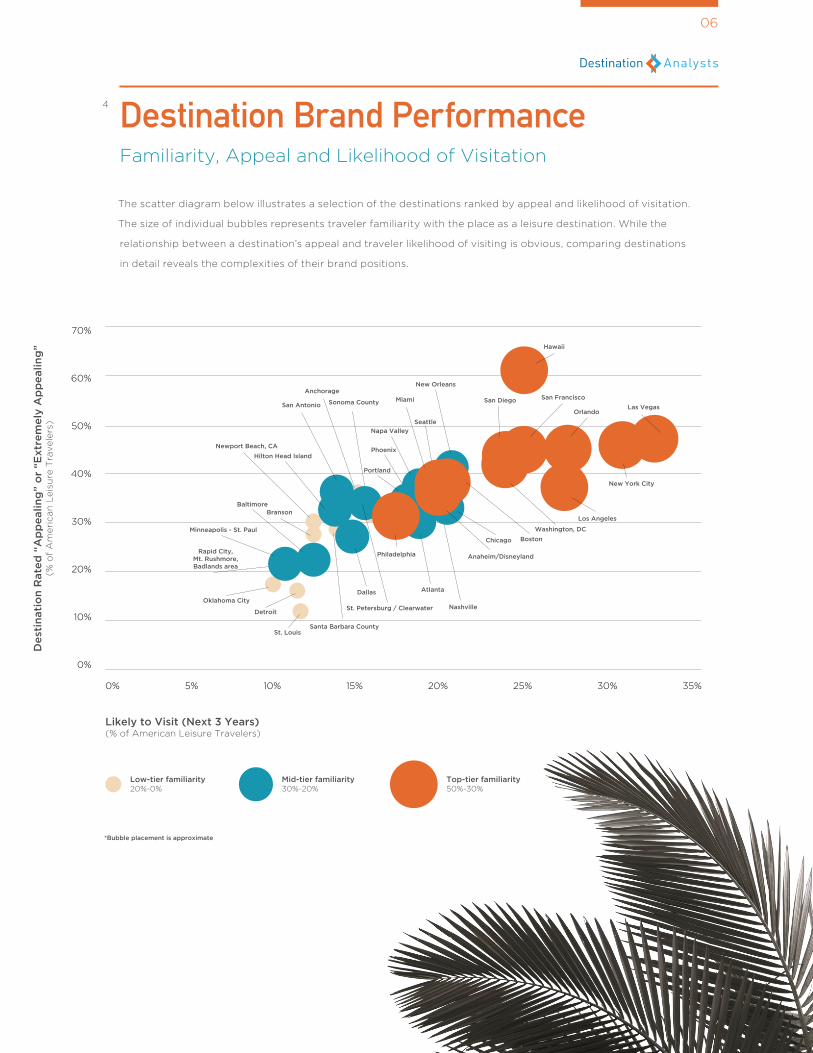
Low-tier familiarity20%-0%
Mid-tier familiarity30%-20%
Top-tier familiarity50%-30%
The scatter diagram below illustrates a selection of the destinations ranked by appeal and likelihood of visitation.
The size of individual bubbles represents traveler familiarity with the place as a leisure destination. While the
relationship between a destination’s appeal and traveler likelihood of visiting is obvious, comparing destinations
in detail reveals the complexities of their brand positions.
Destination Brand Performance4
Familiarity, Appeal and Likelihood of Visitation
Anchorage
Sonoma County
Newport Beach, CA
Santa Barbara County
Branson
Rapid City, Mt. Rushmore, Badlands area
Oklahoma City
Detroit
St. Louis
New Orleans
Seattle
Napa Valley
Nashville
San Antonio
Phoenix
Portland
St. Petersburg / Clearwater
Chicago
Hilton Head Island
AtlantaDallas
Baltimore
Minneapolis - St. Paul
OrlandoLas Vegas
Hawaii
New York City
Los Angeles
San FranciscoSan Diego
Washington, DC
Boston
Miami
Anaheim/DisneylandPhiladelphia

07
5 The Top 20: Destination Hotlist
When asked in an open-ended format, which destinations travelers most want to visit in the next year,
nearly one in four (17.4%) wrote in The Big Apple. Close behind was Las Vegas, at 15.8 percent. The popularity
of Europe with American travelers is also clear, with the top two foreign destinations being the United
Kingdom (13.5%) and France (12.7%)
New York City Tops the Domestic Charts
NEW YORK CITYLAS VEGAS
ORLANDO/DISNEY WORLD
FLORIDA
LOS ANGELES
HAWAII
WASHINGTON DC
CALIFORNIA
CHICAGO
MIAMI
SAN FRANCISCO
ATLANTA
SAN DIEGO
SEATTLE
NEW ORLEANS
YELLOWSTONE NP
GRAND CANYON NP
BOSTON
17.4%15.8%
10.1%
9.1%
7.1%
6.1%
5.7%
5.6%
5.5%
5.1%
4.9%
4.9%
4.3%
4.2%
3.7%
3.7%
3.7%
3.3%
13.5%12.7%
12.2%
11.2%
8.7%
6.7%
5.5%
5.5%
5.4%
5.1%
4.1%
3.8%
3.7%
2.4%
2.3%
2.2%
1.8%
1.0%
UNITED KINGDOMFRANCE
ITALY
CANADA
MEXICO
IRELAND
GERMANY
SPAIN
JAPAN
AUSTRALIA
JAMAICA
GREECE
CHINA
BAHAMAS
HOLLAND
BRAZIL
NEW ZEALAND
SWITZERLAND
Domestic Hotlist International Hotlist% of American Leisure Travelers % of American Leisure Travelers

0808
16 = WINTER 2016 17 = WINTER 2017 18 = WINTER 2018 19 = WINTER 2019
Q: In the next 12 months, HOW MANY TRIPS will you take that will include each of the following types of leisure destinations?
6.1 Destination Expectations, 2019
% Planning to visit on
leisure trip (next 12 Months)
Expected # of leisure trips (next 12 Months)
MOUNTAIN DESTINATION/RESORT
SMALL TOWNS, VILLAGES, OR RURAL DESTINATIONS/ATTRACTIONS
BEACH DESTINATION/RESORT
CITIES OR METROPOLITAN AREAS
0
40
20
60
10
50
30
70
80
0
1.00
0.50
0.25
1.25
0.75
1.75
2.00
2.25
1.50
% Change vs. 4 years ago
-6.7% 3.3%-12.2% 0.7%-18.4% 2.8%-11.9% 4.3%
Where are Americans planning to travel in the upcoming year, and how is this changing? For the past 4 years
we have asked what destination types were under consideration and how many trips to each would travelers take.
Cities and metropolitan areas continue top the list as the most visited destination type. However, in the past five
years, the percent of American leisure travelers saying at the start of the year that they expect to visit a city
or metro are has dropped significantly.
71.
6%
1.6
1.1
67.
0%
1.3
1.0
66
.1%
1.6
1.0
62
.9%
1.4
56
.0%
62
.0%
57.2
%
56
.4%
30.0
%
31.8
%
28.7
%
31.0
%
51.0
%
51.5
%
49
.4%
47.
7%
16 16 1616 18 18 1818 17 17 1717 19 19 1919
0.9
0.9
0.5
1.1
0.5
1.0
0.5
1.0
0.5

0909
16 = WINTER 2016 17 = WINTER 2017 18 = WINTER 2018 19 = WINTER 2019
6.2 Destination Expectations, 2019 Continued
0
40
20
60
10
50
30
70
80
0
1.00
0.50
0.25
1.25
0.75
1.75
2.00
2.25
1.50
% Change vs. 4 years ago
16 1817 19
STATE, COUNTY, OR REGIONAL PARKS OR RECREATION AREAS
31.8
%
38.8
%
31.9
%
33.3
%
4.7% -3.4%
16 1817 19
31.6
%
39.5
%
33.0
%
30.6
%
U.S. NATIONAL PARKS
-3.5% -2.4%
37.0
%
39.8
%
39.4
%
35.5
%
16 1817 19
THEME OR AMUSEMENT PARKS
-4.3% 3.0%
15.4
% 18.6
%
17.6
%
16.8
%
16 1817 19
DESERT DESTINATIONS/RESORTS
9.3% 2.4%
Q: In the next 12 months, HOW MANY TRIPS will you take that will include each of the following types of leisure destinations?
0.3
0.6
0.5
0.6
0.3
0.8
0.7
0.7
0.3
0.6
0.5
0.6
0.3
0.6
0.5
0.6
% Planning to visit on
leisure trip(next 12 Months)
Expected # of leisure trips(next 12 Months)
10
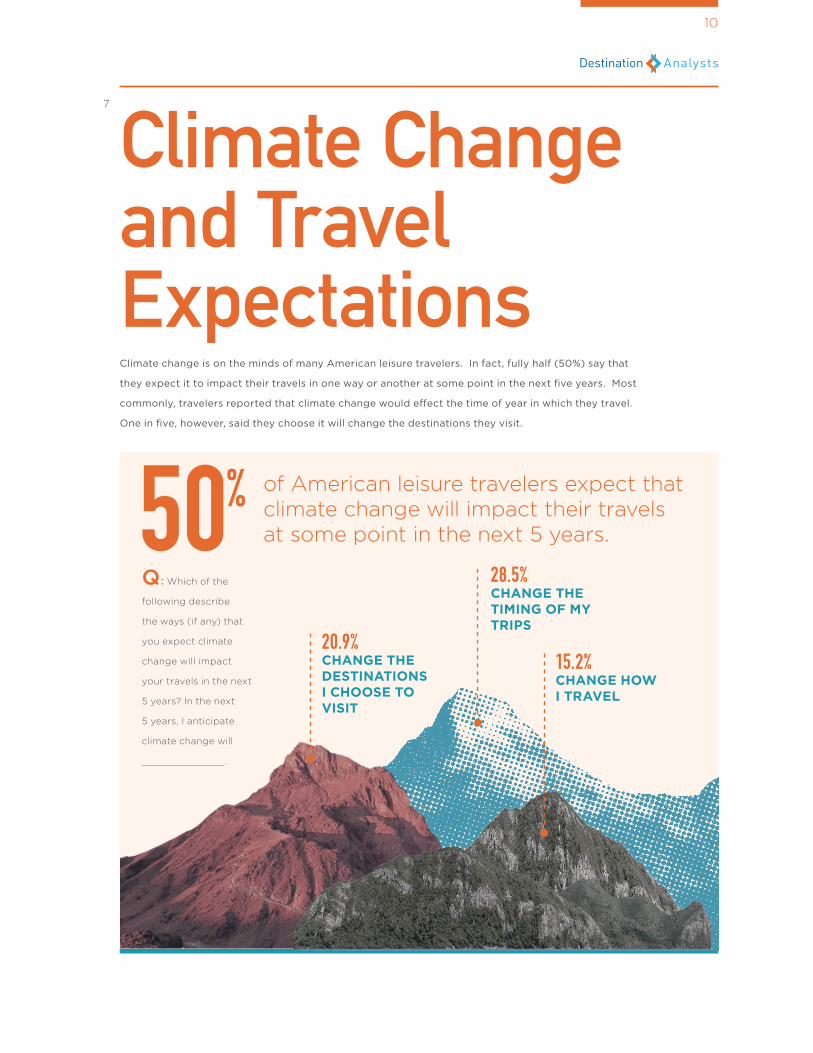
% of American leisure travelers expect that climate change will impact their travels at some point in the next 5 years.50
7
Climate Change and Travel ExpectationsClimate change is on the minds of many American leisure travelers. In fact, fully half (50%) say that
they expect it to impact their travels in one way or another at some point in the next five years. Most
commonly, travelers reported that climate change would effect the time of year in which they travel.
One in five, however, said they choose it will change the destinations they visit.
Q: Which of the
following describe
the ways (if any) that
you expect climate
change will impact
your travels in the next
5 years? In the next
5 years, I anticipate
climate change will
_______________ .
20.9% CHANGE THE DESTINATIONS I CHOOSE TO VISIT
15.2% CHANGE HOW I TRAVEL
28.5% CHANGE THE TIMING OF MY TRIPS