designs of experiments
TRANSCRIPT
7/27/2019 Designs of Experiments
http://slidepdf.com/reader/full/designs-of-experiments 1/59
Designs of ExperimentsDr Sanjoy Roy Chowdhury

7/27/2019 Designs of Experiments
http://slidepdf.com/reader/full/designs-of-experiments 2/59
Experiments
• Meaning: getting answer to questions in themind of the experimenter. e.g. deciding whichpain killer drug to give from the various
available in the market.

7/27/2019 Designs of Experiments
http://slidepdf.com/reader/full/designs-of-experiments 3/59
Treatment
• Different procedures or objects undercomparison in an experiment e.g. in a dietary ormedical experiment, the different diets or
medicines, etc., are the different treatments

7/27/2019 Designs of Experiments
http://slidepdf.com/reader/full/designs-of-experiments 4/59
Experimental Unit
• An experimental unit is the material to whichthe treatment is applied & on which the variableunder study is measured.
e.g. in human experiments in which the treatmentaffects the individual, the individual will be theexperimental unit.
7/27/2019 Designs of Experiments
http://slidepdf.com/reader/full/designs-of-experiments 5/59
Experimental Error
• Is a fundamental phenomenon in replicatedexperiments.
• It is the variation in the measurements made ondifferent experimental units even when they getthe same treatment.
• A part of this variation is systematic & can beexplained, whereas the remainder is taken asrandom type.
7/27/2019 Designs of Experiments
http://slidepdf.com/reader/full/designs-of-experiments 6/59
Experimental Errors (contd.)
• Include all type of extraneous variation due to:
i. Inherent variability in the experimental units,
ii. Errors associated with the measurements made
iii. Lack of representativeness of the sample to thepopulation under study.
• An estimate of the experimental error can only
be obtained by replication, and it is controlledby the principle of local control.

7/27/2019 Designs of Experiments
http://slidepdf.com/reader/full/designs-of-experiments 7/59
Principles of Design
• It means deciding how the observation ormeasurement should be taken in a valid, efficient& economical way.
• Design and analysis are inseparable, that is if experiment is properly designed, there will be anappropriate analysis of data.
• Badly designed experiment will give noconclusion.

7/27/2019 Designs of Experiments
http://slidepdf.com/reader/full/designs-of-experiments 8/59
• Three Basic principles of experimental designare:
i. Replication
ii. Randomizations
iii. Local Control
Principles of Design
7/27/2019 Designs of Experiments
http://slidepdf.com/reader/full/designs-of-experiments 9/59
Randomization
• The principle of randomization is essential for a valid estimate of the experimental error & alsoto minimize bias in the results.
• Randomization by itself is not sufficient for the validity of the experiment.

7/27/2019 Designs of Experiments
http://slidepdf.com/reader/full/designs-of-experiments 10/59
Randomization (contd.)
• e.g in an experiment for comparing two diets forchildren, suppose only two children are availablefor the experiment.
• If they are different in initial conditions, say intype of family, initial weight, etc., then even if the two diets are equally effective, the oneapplied to the child in abetter initial situation will give better result despite random allocationof the diets to the children.

7/27/2019 Designs of Experiments
http://slidepdf.com/reader/full/designs-of-experiments 11/59
Randomization (contd.)
• Randomization forms only a basis of a valid experiment .
• In order to ensure validity, it is necessary to have morethan one child of each type & then to make allocation of
diet at random.• So randomization and replication necessary for validity of
the experiment.
• Separate randomization for every replication andexperiment is necessary.

7/27/2019 Designs of Experiments
http://slidepdf.com/reader/full/designs-of-experiments 12/59
Replication
• Second essential feature of experiment
• In order to obtain more reliable estimate, atreatment is repeated a number of times.
• e.g if we have more than two children in theprevious example, we can plan the experimentso that no particular diet is favored ordisfavored, i.e. each diet is applied approximately equally often to all types of experimental units.

7/27/2019 Designs of Experiments
http://slidepdf.com/reader/full/designs-of-experiments 13/59
Replication (contd.)
• The error of experiment arises from thedifferences between experimental units getting the same treatment
• It does not arise due to difference between thereplicates.
• Replication is the only way to get an estimate of the error of experiment

7/27/2019 Designs of Experiments
http://slidepdf.com/reader/full/designs-of-experiments 14/59
Replication (contd.)
• Function of replication is two fold:
i. Along with randomization, it provides anestimate of the error to which comparisons aresubjected, and
ii. Along with local control, it reduces theexperimental error.
• The most effective way to increase theprecision of an experiment is to increase thenumber of replications

7/27/2019 Designs of Experiments
http://slidepdf.com/reader/full/designs-of-experiments 15/59
Local Control
• It is the third principle and a desirable one.
• Also called error control
• Replication is used with local control to reduceexperimental error.
• In a replicated experiment, the randomizationmay be restricted in such a manner that a
portion of the total variation, that is irrelevant inmaking comparison, may be eliminated from theerror.

7/27/2019 Designs of Experiments
http://slidepdf.com/reader/full/designs-of-experiments 16/59
Local Control (contd.)
• The experimental units are divided intohomogenous groups or blocks.
• Variation from these blocks is eliminated fromthe error to increase efficiency
• Random allocation of treatments to theexperimental units may be restricted in different ways to control experimental errors.

7/27/2019 Designs of Experiments
http://slidepdf.com/reader/full/designs-of-experiments 17/59
Other Principles
• There are some other general principles fordesigning an experiment, other than the abovethree.
• Selection of experimental site should be carefully done.
• Within-block variability should be reduced.

7/27/2019 Designs of Experiments
http://slidepdf.com/reader/full/designs-of-experiments 18/59
Completely Randomized Design
(CRD)
• Randomization may be carried by using a random numbertable
• To obtain a layout for a CRD with three treatments, thenumber of replication used being 5,4 and 3 respectively.
• The experimental units are numbered, in a convenient way,from 1 to 12(the total number of experimental units).
• A random permutation is obtained of the experimental units.
• To the first 5 units in the random permutations, treatment 1 is
applied; to the next 4 units treatment 2 is applied and to theremaining 3, treatment 3 is applied.

7/27/2019 Designs of Experiments
http://slidepdf.com/reader/full/designs-of-experiments 19/59
Advantages and Disadvantages
• CRD is useful in small preliminary experiments
• also in certain types of animal or laboratory experiments where experimental units are homogenous
• There is flexibility in the number of replications, whichmay vary from treatment to treatment.
• CRD provides maximum df for the estimation of experimental
error.
7/27/2019 Designs of Experiments
http://slidepdf.com/reader/full/designs-of-experiments 20/59
Randomized Block Design (RBD)
• CRD is seldom used when experimental unitsare not homogenous.
• The simplest design which uses all the threeprinciples, and which also takes care of the variability among units is called randomizedcomplete block design.
7/27/2019 Designs of Experiments
http://slidepdf.com/reader/full/designs-of-experiments 21/59
RBD consists of two steps:
i. First step is to divide the units into r (no. of replications) more or less homogenous groups. In eachgroup or block, as many units are taken as there aretreatments. so, number of blocks is equal toreplications (r). Same treatment applied to all units in ablock. Variation in techniques is mad between blocks.familiarity with the nature of the experimental units isnecessary for effective blocking of material.
ii. Second step is to assign the treatment at random to theunits of the block. Randomization needs to be doneafresh for each block. (difference between RBD &CRD, in RBD randomization is restricted within
homogenous block.)
Randomized Block Design (RBD)

7/27/2019 Designs of Experiments
http://slidepdf.com/reader/full/designs-of-experiments 22/59
Layout
• To obtain a layout of an RBD with 5 treatments, each replicated 3times, we need 15 units, which are grouped into 3 blocks of 5 plotseach
• We conveniently number the treatments and also units in a block.
• then, following any method of drawing a sample, we get a randompermutation of digits from 1 to 5, say, 4,3,1,5,2 for the units of block I.
• We apply treatment no. 1 to unit 4, treatment no. 2 to unit 3 and soon, finally treatment no. 5 to unit 2, of block I.
• We find another permutation for block II, and still another for block III.
7/27/2019 Designs of Experiments
http://slidepdf.com/reader/full/designs-of-experiments 23/59
Advantages and Disadvantages
• It is quite flexible.• Applicable to a moderate number of treatments.
• If extra replications are necessary for some treatments, these need tobe applied to more than one unit( but to the same no. of units) per
block • Variability among replicates can be eliminated from experimental
error, it is not necessary to use continuous blocks.
• Different techniques to different blocks can be used, though the
technique within the block should be the same.• Most popular design with experimenters in view of its simplicity,
flexibility and validity.

7/27/2019 Designs of Experiments
http://slidepdf.com/reader/full/designs-of-experiments 24/59
Latin Square Design
• The principle of local control was used in the RBD by grouping the units in one way, i.e. according to blocks.
• The grouping can be carried one step forward and the
units can be grouped in two ways, each way corresponding to a source of variation among the unitsto get the LSD.
• LSD eliminates the initial variability among the units inorthogonal directions.

7/27/2019 Designs of Experiments
http://slidepdf.com/reader/full/designs-of-experiments 25/59
LSD (contd.)
• The number of treatments equals the commonreplication number per treatment.
• Let m stand for the number of treatments as well as thenumber of replications for each treatment, the total
number of experimental units needed in this design is m x m.
• These m 2 units are arranged in m rows (one source of variation) and m columns (second source of variation).
Then the m treatments are allotted to these m 2
units atrandom,, subject to the condition that each treatmentoccurs once and only once in each row and each column.

7/27/2019 Designs of Experiments
http://slidepdf.com/reader/full/designs-of-experiments 26/59
• The arrangements of units and allocation of treatmentsto units make the m rows similar to m complete blocksof an RBD; the same is also true of the m columns.
• The LSD is actually an incomplete three- way layout, where all the three factors, viz, row, column andtreatment, are at the same number of levels (m). For acomplete three-way layout with each factor at m levels,m 3 experimental units are needed. But in LSDobservations are taken on only m 2 of these m 3 units.
LSD (contd.)
7/27/2019 Designs of Experiments
http://slidepdf.com/reader/full/designs-of-experiments 27/59
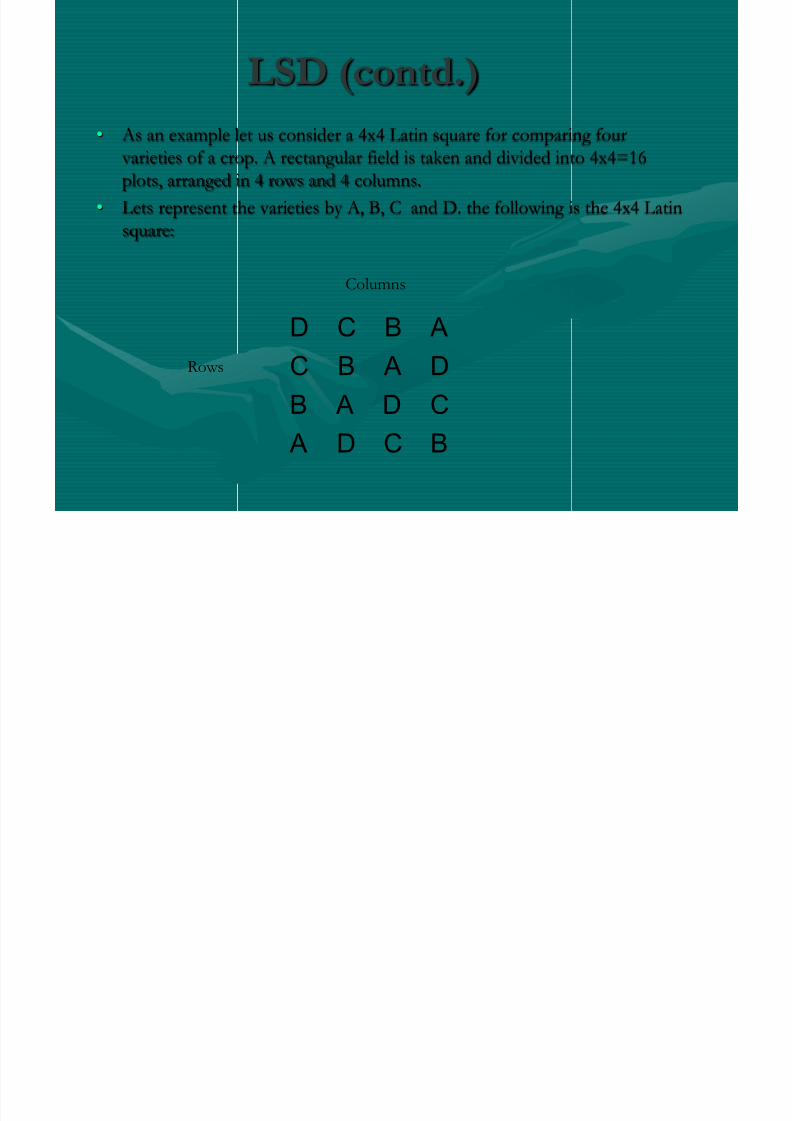
LSD (contd.)
• As an example let us consider a 4x4 Latin square for comparing four varieties of a crop. A rectangular field is taken and divided into 4x4=16plots, arranged in 4 rows and 4 columns.
• Lets represent the varieties by A, B, C and D. the following is the 4x4 Latinsquare:
D C B A
C B A D
B A D C
A D C B
Rows
Columns

7/27/2019 Designs of Experiments
http://slidepdf.com/reader/full/designs-of-experiments 28/59
Replicated Latin Square Design
• Small LSDs provide small error df. To increase theerror df it becomes necessary to replicate the LatinSquare.
• Firstly, we may decide to use the same rows and same
columns in all the n LSDs of size m x m each.• Secondly, we may use the same rows but use different
columns in the n LSDs. We may as well consider thesame columns and change rows in different replicates.
• Finally, we may use different rows and differentcolumns in the various replicates.

7/27/2019 Designs of Experiments
http://slidepdf.com/reader/full/designs-of-experiments 29/59
Advantages and Disadvantages
• The effect of grouping the units in two ways- according to rowsand according to columns- is to eliminate from the error twomajor sources of variation that are not relevant to thecomparisons (among different treatments) we are interested in.
• The LSD is an improvement over the RBD in controlling errorby planned grouping, just as RBD is an improvement over CRD.
• The LSD is an incomplete three-way layout. The advantage overthe corresponding complete three-way layout is that only 1/m of the m 3 observations are needed.
7/27/2019 Designs of Experiments
http://slidepdf.com/reader/full/designs-of-experiments 30/59
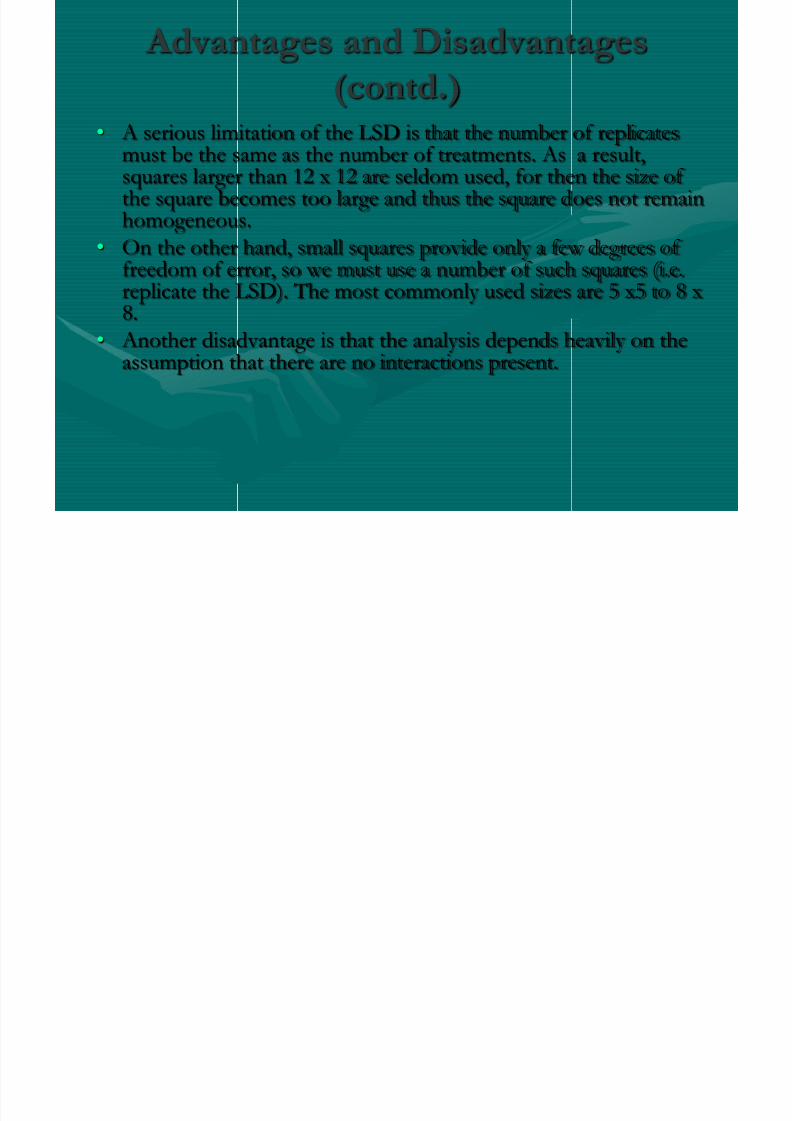
Advantages and Disadvantages
(contd.)• A serious limitation of the LSD is that the number of replicates
must be the same as the number of treatments. As a result,squares larger than 12 x 12 are seldom used, for then the size of the square becomes too large and thus the square does not remainhomogeneous.
• On the other hand, small squares provide only a few degrees of freedom of error, so we must use a number of such squares (i.e.replicate the LSD). The most commonly used sizes are 5 x5 to 8 x8.
• Another disadvantage is that the analysis depends heavily on the
assumption that there are no interactions present.

7/27/2019 Designs of Experiments
http://slidepdf.com/reader/full/designs-of-experiments 31/59
Graeco-Latin Square Design
• The other important name for pair of orthogonal Latin squares superimposed oneupon another, the treatments being represented
by Greek letters in one square and Latin in theother. In this arrangement, every Greek letter(Latin Letter) occurs once in each row and
once in each column and once with each Latinletter (Greek letter)

7/27/2019 Designs of Experiments
http://slidepdf.com/reader/full/designs-of-experiments 32/59
Graeco-Latin Square Design
(contd.)• An example of a 3 x 3 Graeco-Latin square is the
following:
Aδ Bβ Cα
Bα Cδ Aβ
Cβ Aα Bδ

7/27/2019 Designs of Experiments
http://slidepdf.com/reader/full/designs-of-experiments 33/59
Graeco-Latin Square Design (contd.)
• To obtain a random square, arrange the rows and thecolumns at random. Then assign the Latin letters andthe Greek letters at random.
• An m x m Graeco- Latin square is actually incompletefour-way layout with all the four factors at the samelevel ( m ), and observations are taken on only m 2
treatment combinations.• Graeco-Latin square exist for all m≥ 3 except m=6.

7/27/2019 Designs of Experiments
http://slidepdf.com/reader/full/designs-of-experiments 34/59
Analysis of Variance
1) One-way classification
2) Two-way classification
Technique that have been developedto test for difference in the means of several groups.

7/27/2019 Designs of Experiments
http://slidepdf.com/reader/full/designs-of-experiments 35/59
• Suppose that production manager at a plant wants to replace an old machine that directly affects output in the production process.
• Three competing suppliers have permitted theproduction manager to use their particularequipment on a trial basis and the prices and
service contract for the three brands of equipments are same.
One-Way Classification

7/27/2019 Designs of Experiments
http://slidepdf.com/reader/full/designs-of-experiments 36/59
• In order to make a purchasing decision, theproduction manager decided to conduct an
experiment to determine whether there are any significant difference among the three brands of machines in the average time it takes factory
workers using them to complete a productiontask.
• 15 factory workers of similar experience, ability
and age are randomly assigned to receivedtraining on one of the three brands of machinesin such a manner that there are 5 workers for
each machine

7/27/2019 Designs of Experiments
http://slidepdf.com/reader/full/designs-of-experiments 37/59
• The production manager measured the time (in seconds) it takesthe workers to complete a task using their respective equipments.
Observation Table (time in sec.)
Machines
I II III
25.40 23.40 20.00
26.31 21.80 22.20
24.10 23.50 19.75
23.74 22.75 20.60
25.10 21.60 20.40
Mean 24.93 22.61 20.59
Since there are three machines the Null and Alternativehypothesis would be:
Not all the machines have equal means

7/27/2019 Designs of Experiments
http://slidepdf.com/reader/full/designs-of-experiments 38/59
One-Way Classification
Suppose that n sample observations of a random variable X are
divided into k classes on the basis of some criterion or factor of
classification. Let the jth class consist of nj observations
(j=1,2,….,k)

7/27/2019 Designs of Experiments
http://slidepdf.com/reader/full/designs-of-experiments 39/59
Mathematical Model
• In one way classification, the linear mathematical model
will be:
1: 1, 2, ... ; 1, 2, ...
ij i j i X i k j n
Where,
i. Xij is the yield from th jth cow, (i=1,2,…ni) fed on the ith
ration (j=1,2,…k)

7/27/2019 Designs of Experiments
http://slidepdf.com/reader/full/designs-of-experiments 40/59
Null and Alternative Hypotheses
• If we want to test the equality of the population means, i.e., the
homogeneity of the different rations. The null hypothesis is givenby:
Ho:μ1= μ2=…= μλ = μ
Which reduces to:
Ho:α1= α 2=…= α k = 0
Alternative hypothesis :at least two of the means μ1, μ2,… μλ are
different

7/27/2019 Designs of Experiments
http://slidepdf.com/reader/full/designs-of-experiments 41/59
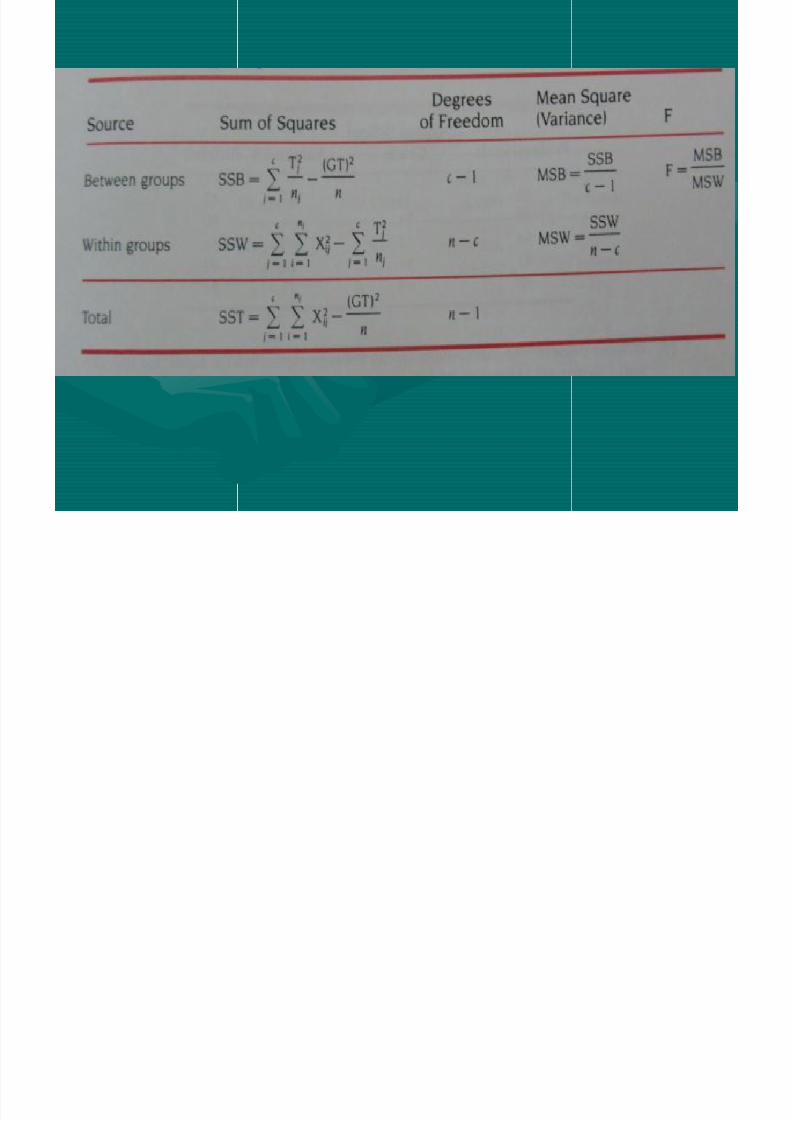
MEASURE OF VARIATION
The Total Variation in the observation1. Since under the null hypothesis the population means of the groups
are presumed equal, a measure of the total variation or sum of squares (SST) among all units can be obtained by summing up thesquared differences between each observation and an overall mean X based upon all the observations. The total variation is computed as:
Total Variation=Total Sum of Squares (TSS)=
Xij – ith observation in group j
n j= number of observations in group j
n=total number of observation
k=number of groups
is called the Grand Total

7/27/2019 Designs of Experiments
http://slidepdf.com/reader/full/designs-of-experiments 42/59
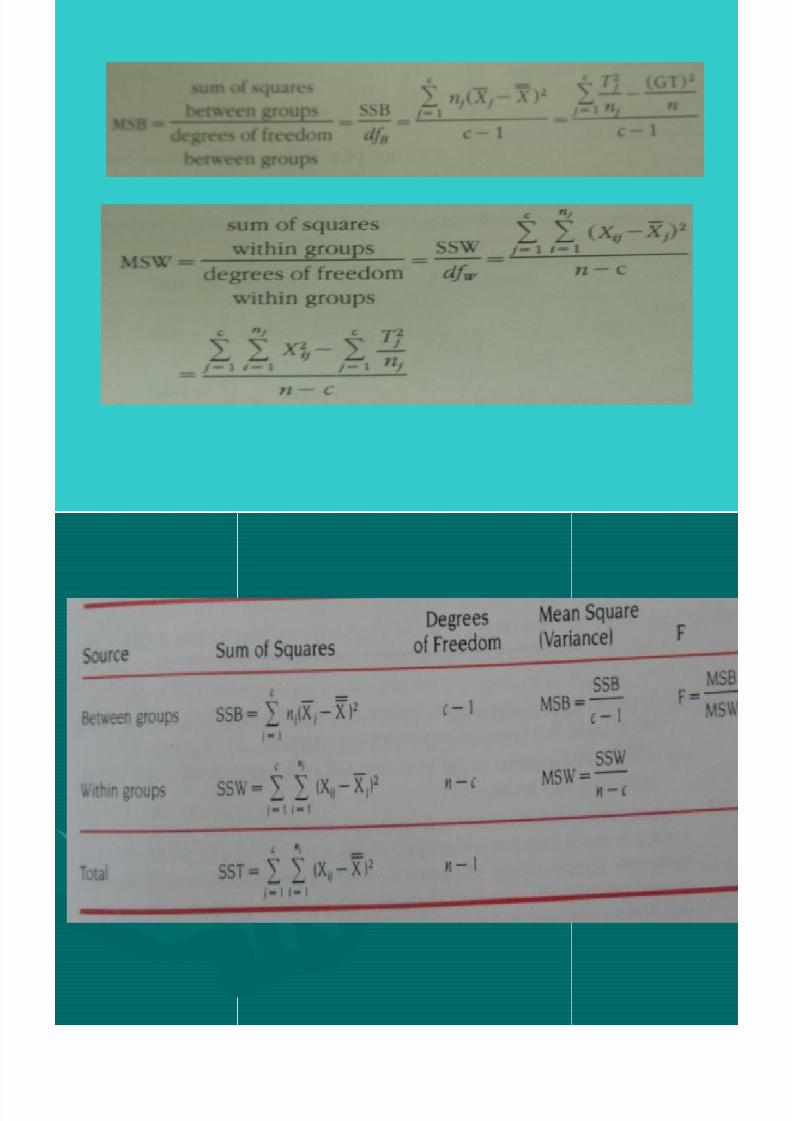
2 The variation between the classes or the variation due to
different bases of classification, called treatments (due toassignable causes, detected & controlled by humanendeavor)
3 The variation with in the classes, i.e. the inherent variation of random variables within the observation of aclass, called chance causes (are beyond human control)
Total variation (SST)=between-group variation (SSB)+ within-group variation (SSW).
7/27/2019 Designs of Experiments
http://slidepdf.com/reader/full/designs-of-experiments 43/59
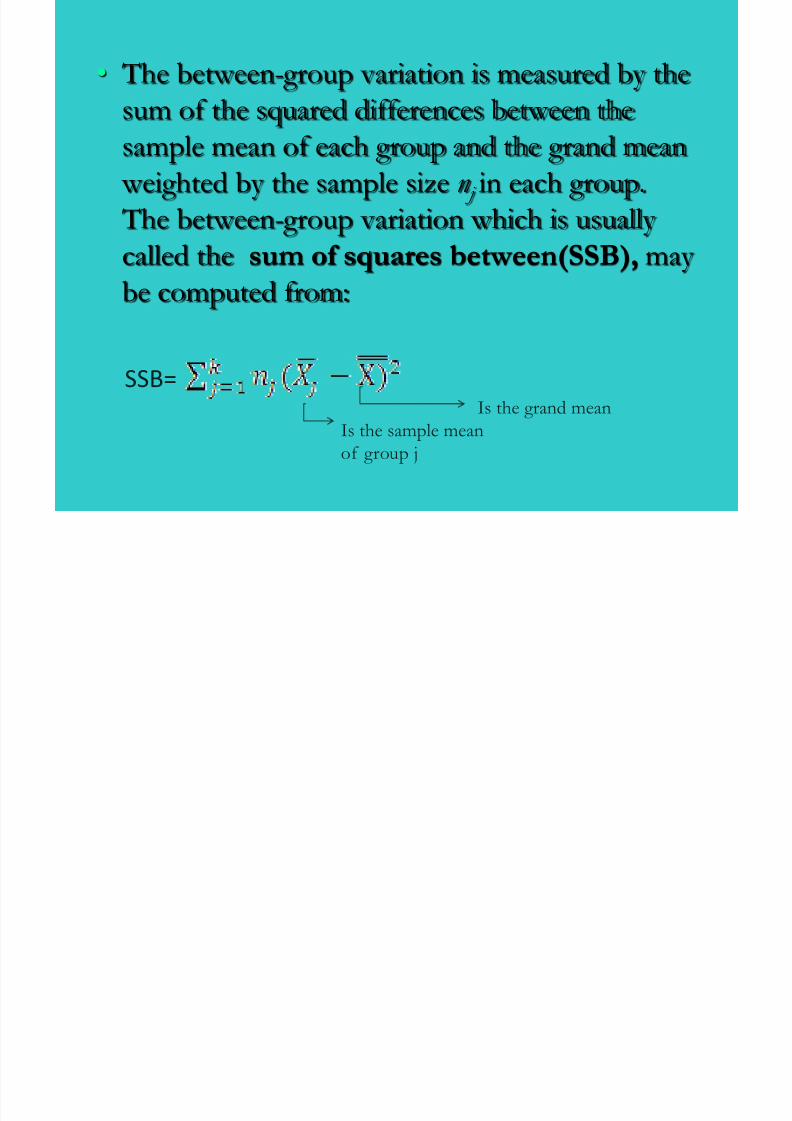
• The between-group variation is measured by the
sum of the squared differences between thesample mean of each group and the grand mean weighted by the sample size n j in each group. The between-group variation which is usually
called the sum of squares between(SSB), may be computed from:
SSB=
Is the sample meanof group j
Is the grand mean

7/27/2019 Designs of Experiments
http://slidepdf.com/reader/full/designs-of-experiments 44/59
• The within-group variation, usually called thesum of squares within(or SSW), measures the
difference between each value and the mean of its own group and cumulates the squares of these differences over all groups. The within
group variation may be computed as:
SSW=

7/27/2019 Designs of Experiments
http://slidepdf.com/reader/full/designs-of-experiments 45/59
Total variation= (variation between classes)+
(variation within classes)
Total variation= (variation due to treatments) +
(variation due to error)
M S Of S (M S S )
7/27/2019 Designs of Experiments
http://slidepdf.com/reader/full/designs-of-experiments 46/59
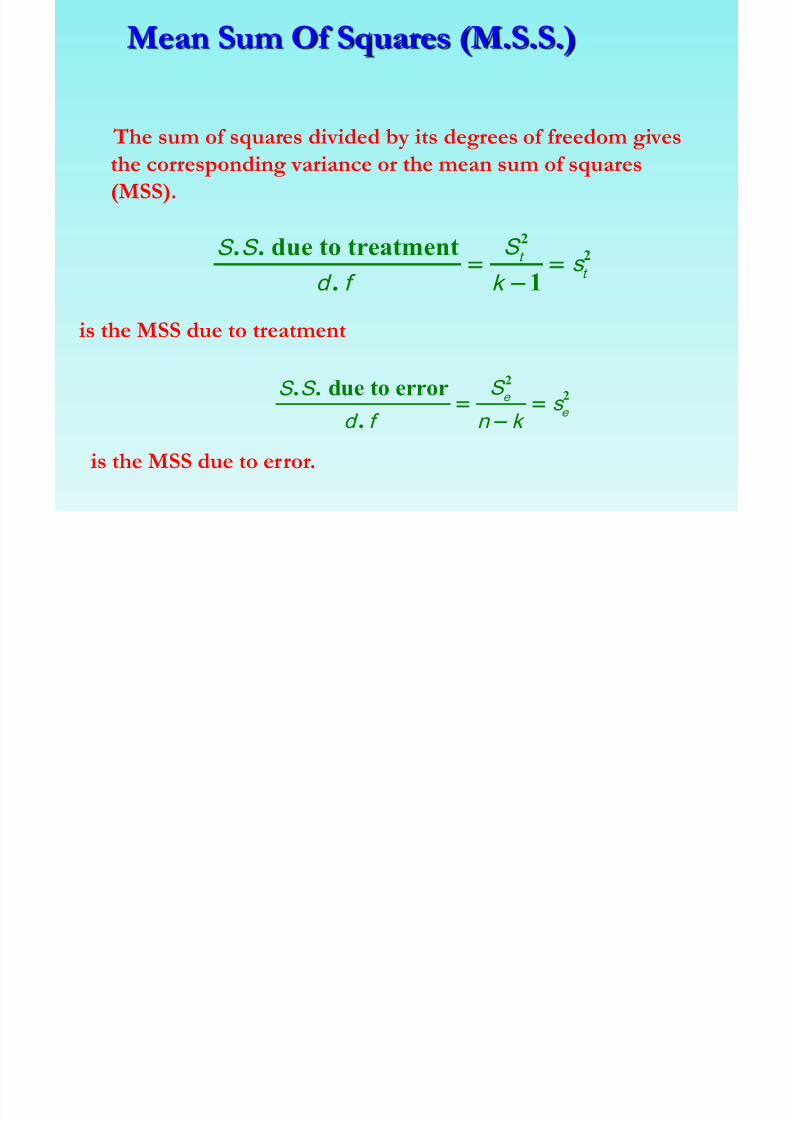
Mean Sum Of Squares (M.S.S.)
The sum of squares divided by its degrees of freedom gives
the corresponding variance or the mean sum of squares
(MSS).
2
2. . due to treatment
. 1
t
t
S S S s
d f k
is the MSS due to treatment
is the MSS due to error.
2
2. . due to error
.
e
e
S S S s
d f n k

7/27/2019 Designs of Experiments
http://slidepdf.com/reader/full/designs-of-experiments 47/59
Test Statistic
Under Ho, the test statistics is:
2
2t
e
s
s MSS due to treatment Between classes MSS
MSS due to Error Within Classes MSSF= =
F follows F-distribution with (v 1=k-1,v 2= n-k) d.f.
7/27/2019 Designs of Experiments
http://slidepdf.com/reader/full/designs-of-experiments 48/59
7/27/2019 Designs of Experiments
http://slidepdf.com/reader/full/designs-of-experiments 49/59

7/27/2019 Designs of Experiments
http://slidepdf.com/reader/full/designs-of-experiments 50/59
7/27/2019 Designs of Experiments
http://slidepdf.com/reader/full/designs-of-experiments 51/59
G t M [25 40+26 31+ +23 40+ +20 40] /15
7/27/2019 Designs of Experiments
http://slidepdf.com/reader/full/designs-of-experiments 52/59
• Grant Mean=[25.40+26.31+-+23.40+---+20.40] /15
= 22.71
• SST =[(25.40 - 22.71)2+ (26.31 - 22.71)2 + (24.10 -22.71)2 + (23.74 - 22.71)2 + (25.10 - 22.71)2 ] + […] +
[…] = 58.2172
• SSB=[(5)(24.93 - 22.71)2+ (5)(22.61 - 22.71)2
+(5)(20.59 - 22.71)2 + (5)(2.22)2 + (5)(-10)2 +(5) (-2.12)2 ] = 47.164
• SSW=[(25.40 - 24.93)2
+ (26.31 - 24.93)2
+ (24.10 -24.93)2 + (23.74 - 24.93)2 + (25.10 - 24.93)2 ] + […] +
[…] = 11.0532
• SST=SSB+SSW =58.2172=47.164+11.0532=58.2172

7/27/2019 Designs of Experiments
http://slidepdf.com/reader/full/designs-of-experiments 53/59
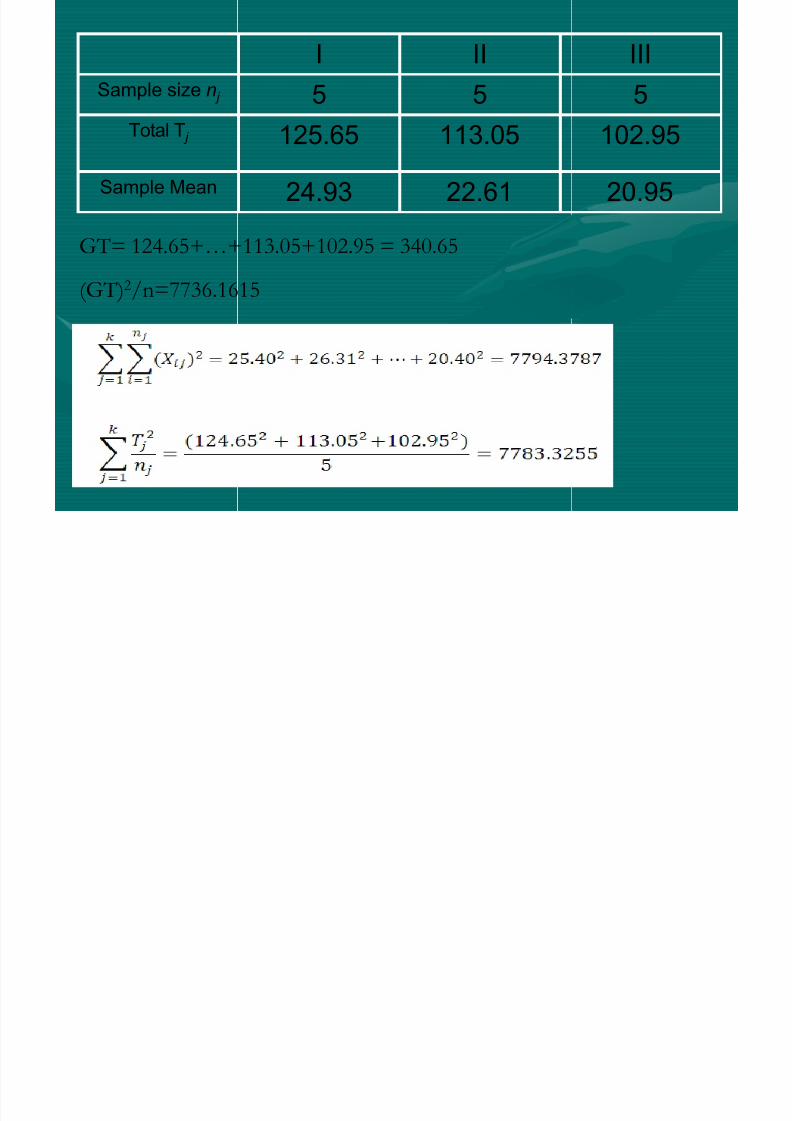
I II III
Sample size n j 5 5 5
Total T j 125.65 113.05 102.95
Sample Mean 24.93 22.61 20.95
GT= 124.65+…+113.05+102.95 = 340.65
(GT)2/n=7736.1615
7/27/2019 Designs of Experiments
http://slidepdf.com/reader/full/designs-of-experiments 54/59
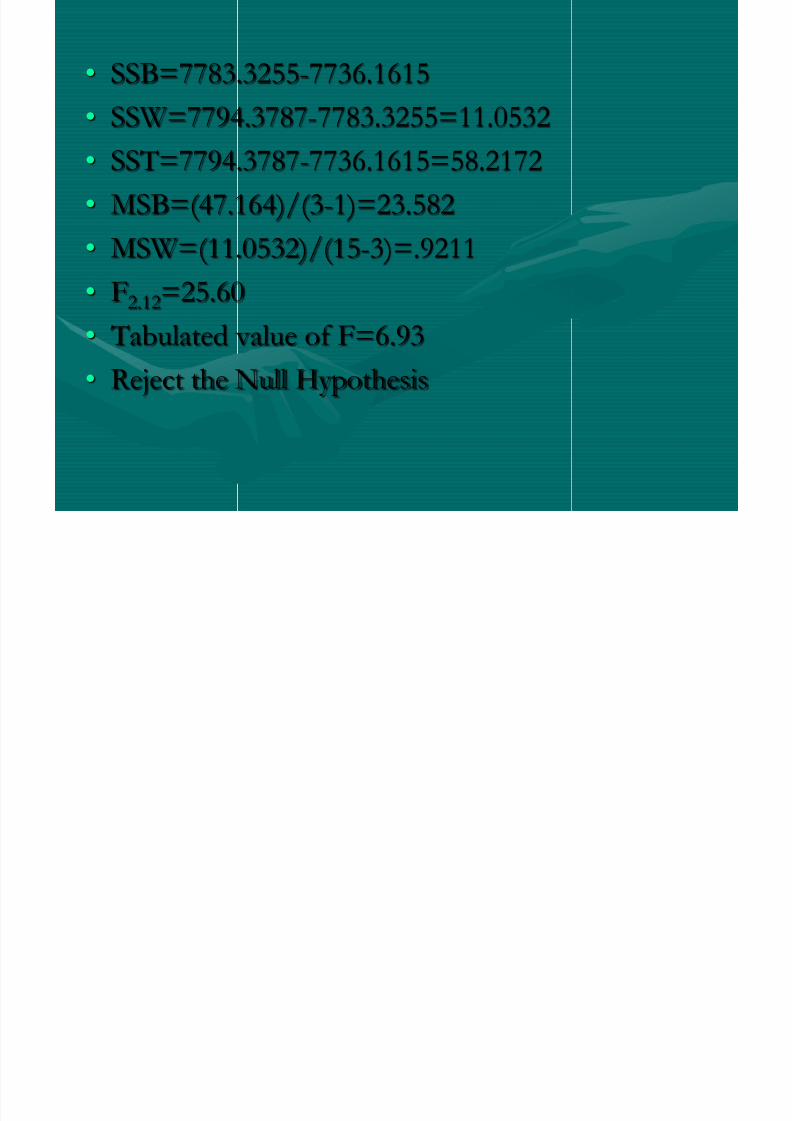
• SSB=7783.3255-7736.1615
• SSW=7794.3787-7783.3255=11.0532• SST=7794.3787-7736.1615=58.2172
• MSB=(47.164)/(3-1)=23.582
• MSW=(11.0532)/(15-3)=.9211• F2.12=25.60
• Tabulated value of F=6.93
• Reject the Null Hypothesis
7/27/2019 Designs of Experiments
http://slidepdf.com/reader/full/designs-of-experiments 55/59
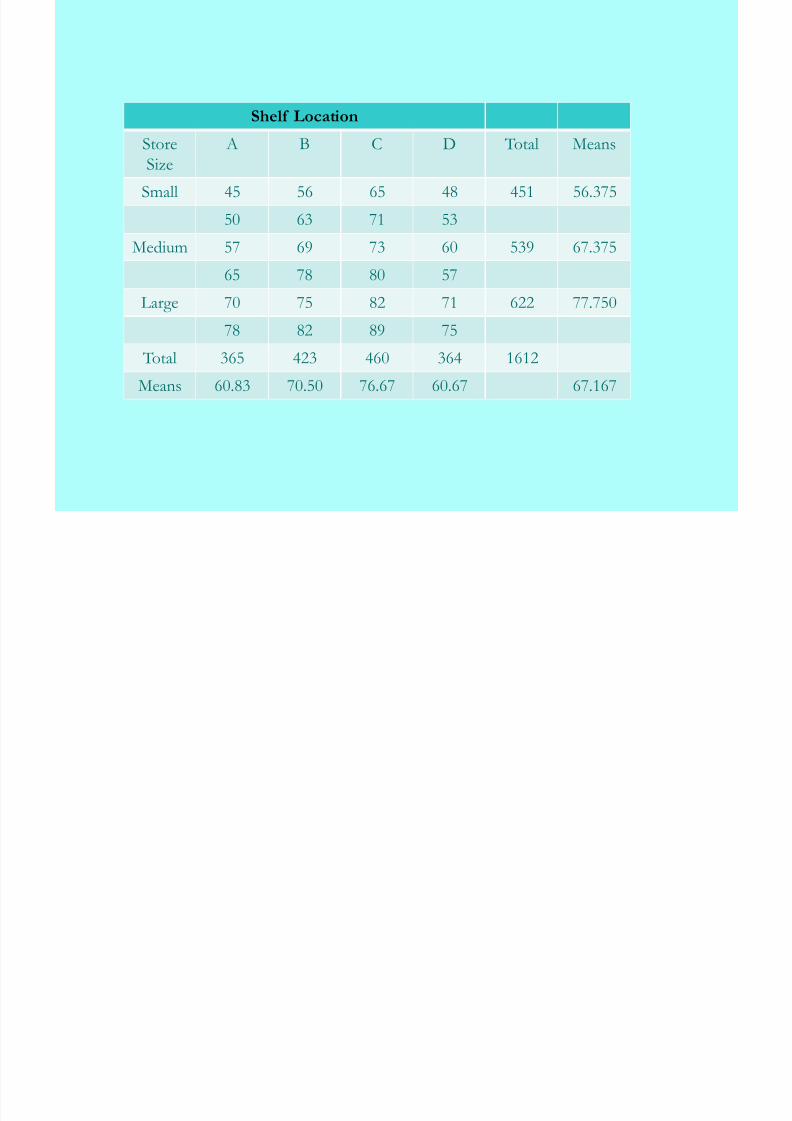
Two-Way Classification
• Consider a model in which two factors are of interest.• Suppose that the marketing research director for a
supermarket chain is interested in studying the effect of shelf location on sales of a product.
• Four different shelf locations were to be studied: normallocation (A), additional location in store (B), new locationonly and shelf talker (C) and normal location andribboning (D). Three different store sizes were to be
considered: small, medium and large. For each shelf location a random sample of two stores of each size isselected
• The weekly sales by stores size and shelf location is asfollows:

7/27/2019 Designs of Experiments
http://slidepdf.com/reader/full/designs-of-experiments 56/59
Shelf Location
StoreSize
A B C D Total Means
Small 45 56 65 48 451 56.375
50 63 71 53
Medium 57 69 73 60 539 67.37565 78 80 57
Large 70 75 82 71 622 77.750
78 82 89 75
Total 365 423 460 364 1612Means 60.83 70.50 76.67 60.67 67.167
T W Cl ifi i

7/27/2019 Designs of Experiments
http://slidepdf.com/reader/full/designs-of-experiments 57/59
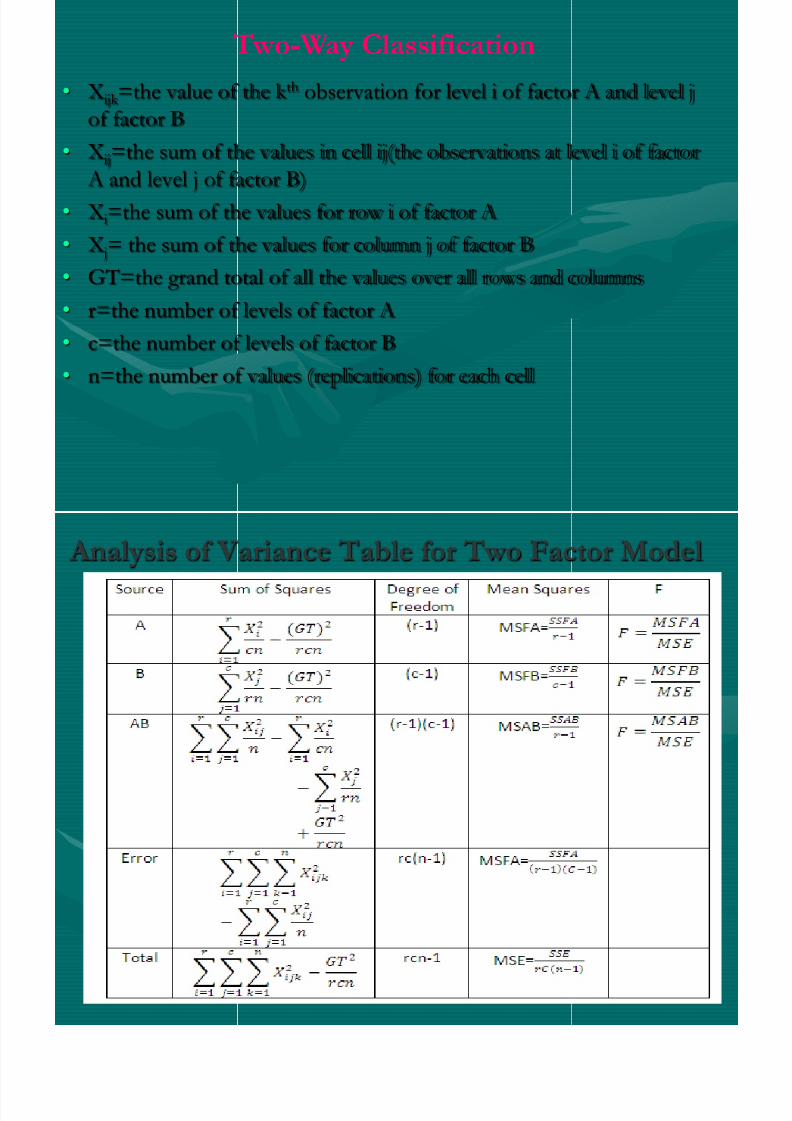
• X ijk =the value of the k th observation for level i of factor A and level j
of factor B• X ij=the sum of the values in cell ij(the observations at level i of factor
A and level j of factor B)
• X i=the sum of the values for row i of factor A
• X j= the sum of the values for column j of factor B• GT=the grand total of all the values over all rows and columns
• r=the number of levels of factor A
• c=the number of levels of factor B
• n=the number of values (replications) for each cell
Two-Way Classification
Analysis of Variance Table for Two Factor Model

7/27/2019 Designs of Experiments
http://slidepdf.com/reader/full/designs-of-experiments 58/59
Analysis of Variance Table for Two Factor Model

7/27/2019 Designs of Experiments
http://slidepdf.com/reader/full/designs-of-experiments 59/59