designing performance tests to predict user experience · - ensure your tests represent the fact...
TRANSCRIPT

www.PerfTestPlus.com
© 2006 PerfTestPlus All rights reserved.
Designing Performance Tests… Page 1
Designing Performance Tests to
Predict User Experience
Scott Barber
Chief Technology Officer
PerfTestPlus, Inc.
First Presented for:
PSQT/PSTT Conference
Washington, DC May, 2003

www.PerfTestPlus.com
© 2006 PerfTestPlus All rights reserved.
Designing Performance Tests… Page 2
Modeling Real Users
About “Real” Users
Identifying User Activities for Inclusion
Randomization/Conditional Logic
User Think Times
Model Visualization Technique
Where to go for more info
Load Generation Tools Overview
Realizing User Models using Tools
Where to go for more info
Examples/Exercises (time permitting)
Summary / Q&A

www.PerfTestPlus.com
© 2006 PerfTestPlus All rights reserved.
Designing Performance Tests… Page 3
About “Real” Users
What are they?- Any person or process that interacts with the system.
- Human Users
• Customers
• Employees
• Administrators
• Researchers
• Competitors
- System Users
• Nightly back-ups
• Automatic database synchronization
• Batch processing of data

www.PerfTestPlus.com
© 2006 PerfTestPlus All rights reserved.
Designing Performance Tests… Page 4
About “Real” Users
Why must they be accurately modeled?- Results from inaccurately modeled tests are nearly always
inaccurate, and often lead to incorrect decisions.
- The only way to predict actual user experience (end-to-end
response time) is to execute tests using realistic User Community
Model(s).
- Extrapolating expected performance based on incomplete models
doesn’t work.
"The one thing that matters the most is not how your site behaves under
theoretical or simulated conditions, but how well it works when you plug it
into the wall and let everyone come hit your box from all across the world"
— Serdar Yegulalp in "Website Stress-Testing"

www.PerfTestPlus.com
© 2006 PerfTestPlus All rights reserved.
Designing Performance Tests… Page 5
Identifying User Activities for Inclusion
80/20 rule- 20% of the possible activities will be performed 80% of the time.
Don’t waste time with rare activities unless they are…- high visibility activities
• Creating initial user profile.
• Updating payment information.
- high importance activities• Submitting stock trade.
• Paying bill on-line.
- performance intensive activities• Importing the monthly report from “the other system”.
• Requesting payment history.

www.PerfTestPlus.com
© 2006 PerfTestPlus All rights reserved.
Designing Performance Tests… Page 6
Randomization/Conditional Logic
Real Users
- React
- Have Unique Data
- Navigate Differently
- Connect at Different Rates
- Have Different Hardware
www.PerfTestPlus.com
© 2006 PerfTestPlus All rights reserved.
Designing Performance Tests… Page 7
Randomization/Conditional Logic
Real Users React- Ensure your tests represent the fact that real users react to the application.
Vary Data- Make sure that data being entered is unique for each simulated user.
- Make sure that each simulated users is unique (this may mean more than just separate IDs and Passwords).
Vary Navigation Paths- If there is more than one way for a user to accomplish a task in the application, your test must represent that.
- Different paths through the system often stress different parts of the system.

www.PerfTestPlus.com
© 2006 PerfTestPlus All rights reserved.
Designing Performance Tests… Page 8
Randomization/Conditional Logic
Vary Connection Rates- If users will be accessing the system via different connection rates, test those rates.
- Calculating the theoretical difference in performance based on connection speed gives a reasonable “best case” estimate, but isn’t generally accurate.
Vary Client Specific Issues- Sufficient processor/RAM
- Browser (i.e. is gzip compression accepted)
- Multi-media processing
- Accessibility options

www.PerfTestPlus.com
© 2006 PerfTestPlus All rights reserved.
Designing Performance Tests… Page 9
Randomization/Conditional Logic
Abandonment - If a page takes too long to display, users will eventually
abandon your site – thus lessening the load – changing
the overall performance.
- Not simulating abandonment makes your test un-
intentionally more stressful than real life.

www.PerfTestPlus.com
© 2006 PerfTestPlus All rights reserved.
Designing Performance Tests… Page 10
Randomization/Conditional Logic
Ensure that simulated users make decisions like real
users. - They make decisions about what page to click next
based on:
• Search results
• Item price
• Requested personal information
- This “intelligent surfing” must be
accounted for in your tests.

www.PerfTestPlus.com
© 2006 PerfTestPlus All rights reserved.
Designing Performance Tests… Page 11
User Think Times
Users Think… and Type - Guess what? They all do it at different speeds!
- Guess what else? It's your job to figure out how to model and script
those varying speeds.
Determine how long they think- Log files
- Industry research
- Observation
- Educated guess/Intuition
- Combinations are best

www.PerfTestPlus.com
© 2006 PerfTestPlus All rights reserved.
Designing Performance Tests… Page 12
User Think Times
Think Time Distributions
- Static distribution
• Waiting for exactly x seconds every time that page is called.
• Only useful in rare circumstances like timed redirection.
- Uniform (linear) distribution
• Waiting a random amount of time
between given min and max times
that average out to a consistent
distribution over many users.
• Most useful for pages that are
being ‘read’ or ‘scanned’ for the
next link.

www.PerfTestPlus.com
© 2006 PerfTestPlus All rights reserved.
Designing Performance Tests… Page 13
User Think Times
Think Time Distributions
- Ideal Normal (bell curve)
• Waiting is centered around a ‘normal’ value and tapers
off to either side at a rate based on a standard deviation.
• Normal curves are most mathematically representative of
most human interaction. When in doubt,
use a normal distribution.

www.PerfTestPlus.com
© 2006 PerfTestPlus All rights reserved.
Designing Performance Tests… Page 14
User Think Times
Think Time Distributions
- Negative Exponential Distributions
• ‘One-tailed’ curve. Waiting is usually close to a minimum
value, but sometimes takes longer.
• Represents activities such as clicking the link after
viewing a multimedia presentation.
www.PerfTestPlus.com
© 2006 PerfTestPlus All rights reserved.
Designing Performance Tests… Page 15
User Think Times
Think Time Distributions
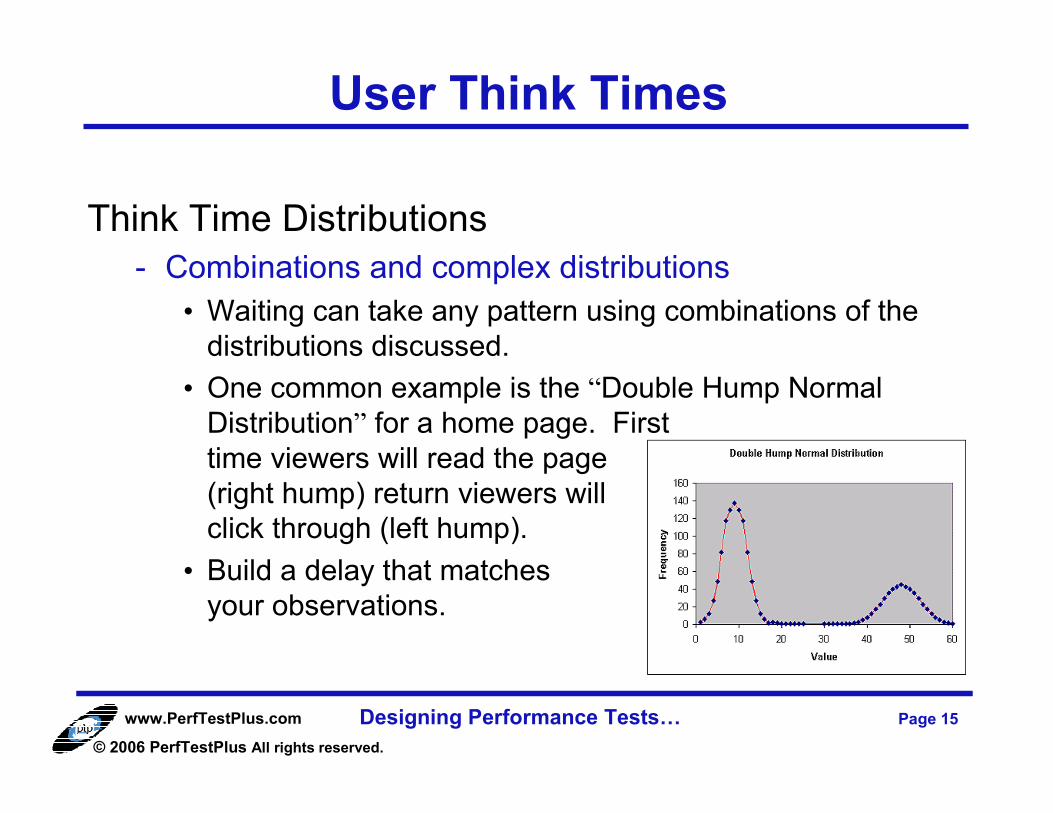
- Combinations and complex distributions
• Waiting can take any pattern using combinations of the
distributions discussed.
• One common example is the “Double Hump Normal
Distribution” for a home page. First
time viewers will read the page
(right hump) return viewers will
click through (left hump).
• Build a delay that matches
your observations.

www.PerfTestPlus.com
© 2006 PerfTestPlus All rights reserved.
Designing Performance Tests… Page 16
User Think Times
Incorporating into your model
- Every page has a think time – after you determine the
think time for that page, document it.
- These think times should cause your script to pace like
real users.
Event Type Event Name Type Min Max Std Req't Goal
Procedure name: Initial Navigation()
Timer name: tmr_home_page negexp 4 N/A N/A 8 5
Timer name: tmr_login normdist 2 18 4.5 8 5
Timer name: tmr_page1 linear 5 35 N/A 8 5
Timer name: tmr_data_entry negexp 8 N/A N/A 8 5
Timer name: tmr_page2 normdist 3 9 3 5 3
Timer name: tmr_submit_transaction linear 2 4 N/A 5 3
Timer name: tmr_signout N/A N/A N/A N/A 8 5

www.PerfTestPlus.com
© 2006 PerfTestPlus All rights reserved.
Designing Performance Tests… Page 17
Model Visualization Technique
User Community Modeling Language
- Method to visually represent the model
- Shows
• Activities
• Paths
• Distribution of users
• Areas where data is varied
• User decision points
- Documented in User Experience, not Metrics parts 3, 4
and 12 available at www.perftestplus.com

www.PerfTestPlus.com
© 2006 PerfTestPlus All rights reserved.
Designing Performance Tests… Page 18
Model Visualization Technique
Budgeting Module
Login
(100%)
Logout
(66%)
Home Page
Budget Work
Items
(95%)
Analysis Type(3%)
Report Type (2%)
Analysis (5%) Vary Options
Vary Options
Submit/Reject (2%)
Vary Options
Check Out
(93%)
Enter Data (84%)
Add Budget Entry/
Account (1%)
Analysis (5%)
Check
In
Budget Work
Items
New
Budget Center (94%)
New Report or Analysis (80%)
Export to Excel (3%)
Analysis
Preparation
New Activity (34%)
Eval Report

www.PerfTestPlus.com
© 2006 PerfTestPlus All rights reserved.
Designing Performance Tests… Page 19
Load Generation Tools Overview
Popular Tools
- Mercury (LoadRunner, Astra LoadTest)
- Rational Robot (previously Performance Studio)
- Segue SilkPerformer
- Empirix E-Test Suite
- Radview WebLoad
- Compuware QALoad
- OpenSTA
- Microsoft Web Application Stress Tool

www.PerfTestPlus.com
© 2006 PerfTestPlus All rights reserved.
Designing Performance Tests… Page 20
Load Generation Tools Overview
How They Work- Capture protocol level traffic.
- Use scripting language to replay that traffic.
- Do not interact with client system on playback.
- Do not actually invoke browsers on playback.
- Can simulate many users from many machines (IP Spoofing).
- Do not evaluate correctness of returned page, just codes and sizes.
- If done correctly, no application tier can tell the difference.

www.PerfTestPlus.com
© 2006 PerfTestPlus All rights reserved.
Designing Performance Tests… Page 21
Realizing User Models With Tools
Load generation tools…- do not interact with client side portions of the application.
- do not natively evaluate correctness of returned pages.
- often don’t handle conditional navigation.
- do not handle abandonment well.
Scripting concepts- Record – EDIT – playback
- Add data variance
- Add delays
- Add conditional logic
- Add code to evaluate correctness of key pages
- Add abandonment functions
Scripting is not as easy as the tool vendors would like you to believe!

www.PerfTestPlus.com
© 2006 PerfTestPlus All rights reserved.
Designing Performance Tests… Page 22
Realizing User Models With Tools
Full Path Scripting (1 script for every navigation path)Pros:
• Easy to record
• Easy to visualize
Cons:
• Many Scripts
• Difficult to maintain
• Much overhead / code duplication

www.PerfTestPlus.com
© 2006 PerfTestPlus All rights reserved.
Designing Performance Tests… Page 23
Realizing User Models With Tools
Path Segment Scripting (1 script for every horizontal
line in model)Pros:
• Easier to maintain
• Reduces recording time
• Less overhead / code duplication
Cons:
• Shared and/or persistent variables
• Still many scripts

www.PerfTestPlus.com
© 2006 PerfTestPlus All rights reserved.
Designing Performance Tests… Page 24
Realizing User Models With Tools
Smart Scripting (1 script for every logical segment)Pros:
• Easy to maintain
• Least code duplication
• No shared/persistent variables
• Minimum overhead / number of scripts
Cons:
• More difficult to script initially

www.PerfTestPlus.com
© 2006 PerfTestPlus All rights reserved.
Designing Performance Tests… Page 25
Where to go for more information
User Experience, not Metrics: Parts 2-4
Beyond Performance Testing: Part 4
http://www.PerfTestPlus.com (My site)
http://www.QAForums.com (Huge QA Forum)
http://www.loadtester.com (Good articles and links)
http://www.segue.com/html/s_solutions/papers/s_wp_info.htm (Good
articles and statistics)
http://www.keynote.com/resources/resource_library.html
(Good articles and statistics)

www.PerfTestPlus.com
© 2006 PerfTestPlus All rights reserved.
Designing Performance Tests… Page 26
Examples/Exercises
Determine User Abandonment Exercise
Determine User Think Time Exercises
www.PerfTestPlus.com
© 2006 PerfTestPlus All rights reserved.
Designing Performance Tests… Page 27
Demos

www.PerfTestPlus.com
© 2006 PerfTestPlus All rights reserved.
Designing Performance Tests… Page 28
Summary
We simulate real users to:
- Increase confidence in results.
- Improve our ability to make sound decisions.
- Ensure our application performs acceptably on go-live
day.
User Community Models are visual representations of
real users.
Never think about tool limitations when modeling.
Scripting real users isn’t always easy.

www.PerfTestPlus.com
© 2006 PerfTestPlus All rights reserved.
Designing Performance Tests… Page 29
Questions and Contact Information
Scott Barber
Chief Technology Officer
PerfTestPlus, Inc
E-mail:
Web Site:
www.PerfTestPlus.com