designing of hydraulically balanced water distribution...
TRANSCRIPT
(IJACSA) International Journal of Advanced Computer Science and Applications,
Vol. 7, No. 2, 2016
118 | P a g e
www.ijacsa.thesai.org
Designing of Hydraulically Balanced Water
Distribution Network Based on GIS and EPANET
RASOOLI Ahmadullah
Faculty of Engineering
Graduate University of The Ryukyus
Okinawa, Japan
KANG Dongshik
Information Engineering
Graduate University of The Ryukyus
Okinawa, Japan
Abstract—The main objectives of this paper are, designing
and balancing of Water Distribution Network (WDN) based on
loops hydraulically balanced method as well as using
Geographical Information System (GIS) methodology with the
contribution of EPANET. GIS methodology is used to ensure
WDN’s integrity and skeletonized a proper and functional WDN
by using Network Analyst utilizing the geometric network and
topology network by hierarchical geo-databases. The problem is
to make WDN hydraulically balanced by applying WDN
balancing method. For that reason, we have analyzed water flows
in each pipe and performed the iterations process on loops, in
order to make the algebraic summation of head loss“ ” around
any closed loop zero, in case, the summation of pipe flows must
be equal to the flow amount entering or leaving the system
through each node. At each iteration, reasonable changes
occurred at pipes flow until the head loss has become very small
or fixed zero as (optimizes correction) by using excel sheet solver.
Since this method is confirmed to be effective, simulations were
done by using GIS and EPANET water distribution platform. As
a result, we accomplished hydraulically balanced WDN. Finally,
we have analyzed and simulated hydraulics parameters for the
targeted area in Kabul city. Thus, we successfully determined the
hydraulics state of parameters around the network as a positive
result. It is worth mentioning that, Hardy-cross method is being
used for approaching more precise optimized correction and
consequences concerning hydraulically-balanced and optimal
WDN. This method can be done for complex loops WDN as well;
the advantage of the method is simple math and self-correction.
Managers and engineers who work in the field of water supply
this methodology has been recommended as the more
advantageous workflow in planning water distribution pattern.
Keywords—Geographical Information System (GIS); Water
Distribution Network (WDN); Hydraulics; EPANET
I. INTRODUCTION
To manage and control WDN we need to create Geo-database and knowledge-base in order to store water background data layers with features in ArcGIS and manage WDN. Therefore, GIS is comprehensive and multifunctional computer-based software being used in water transmission and distribution systems in modern and systematic water supply. However, it is the best application to manage, manipulate and maintain geospatial data and to develop and sustain asset management for today's water utilities in worldwide. Though for the targeted area there was no previous data available on water supply, no distribution lines, and service connection information as well as with no service population and sewerage system network the entire situation is unmapped.
We have produced three hierarchical Geo-databases separately [1]. The Geo-database structures indicate main, geometric network and topology Geo-databases consisted of feature data sets. Water supply background data (vector data and raster data) collected from various source that working for shoulder to shoulder for Kabul city water supply extension. We designed a proper WDN created in GIS then imported to EPANET to be analyzed and simulated in order to approach the objectives and successful consequences.
The commonly network has been contained of physical and non-physical components and features such as pipes, nodes and reservoirs with pumps and valves-types and non-physical describes the behavior and operational aspects of a distribution system. Since, GIS project scenarios imported to EPANET in (.inp) format in order to carry out simulation and find various WDN’s parameters state.
In this paper, we have considered two closed-loops of the network using two fundamental hydraulic principles such as continuity and energy conservation equations. The statement of this valuable method is first the sum of pipe flows into and out of a node equals the flow entering or leaving the system through each node applied to all pipes. And second, the algebraic sum of pressure drops around a closed loop must be zero we applied it to all the nodes. Some of the given parameters include water demand at each node, diameter of pipe and pipe length as well as pressure at the first node and pipe roughness. We need to find corrected water flows at pipes, this happens by reducing head loss around loops, finally we will also get the pressure at all nodes.
II. STUDY SITE
Water supply conditions in Kabul city are serious, and water availability will be the most critical constraint to the development of the city. There are lack and shortages of water not only for irrigation but also for domestic; the entire current water supply in Kabul depends exclusively on local ground-water resources. However, surface water transferring is needed to be extended and developed from Shatoot dam located on Maidan River and also Gulbahar dam located on Panjshir river through a proper treatment plant process in order to supply potable water to city's population. However, water supply is being extended and developed in the last decay in order to meet present-day population demand; water consumption is increased due to the rise of population and economic development in the city. Therefore, the local water resources are not sufficient for current demand to cover the
(IJACSA) International Journal of Advanced Computer Science and Applications,
Vol. 7, No. 2, 2016
119 | P a g e
www.ijacsa.thesai.org
whole users. Local groundwater needs to be recharged naturally or artificially.
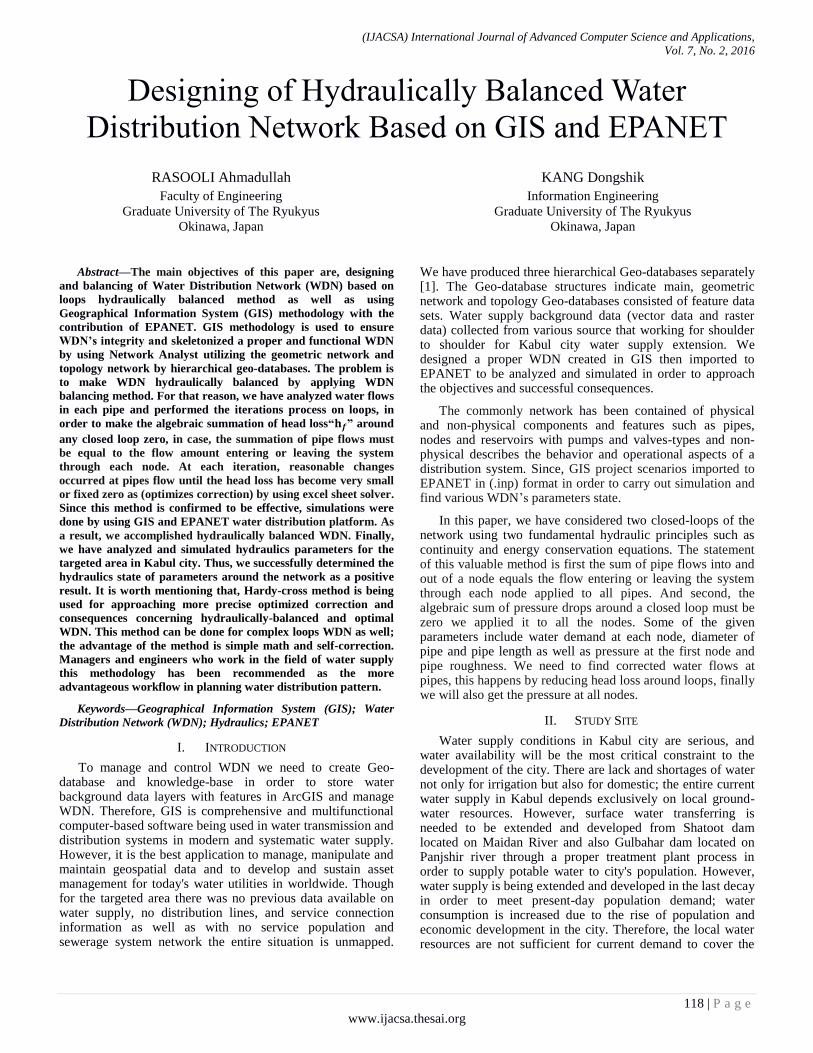
Population prediction is one of the necessary factors for designing water supply systems. Therefore, population should be estimated precisely to continuously supply increasing water demand for the community. Population projection and growth rate in percentage from 2002 until 2032 is shown in “Fig. 1”. The estimated potential of Kabul groundwater is approximately 44 million (m
3) per year according to the
current water study. The estimated groundwater potentials are as presented in “TABLE1”.
Fig. 1. Population projection and growth rate in percentage for
Kabul city based on upper, middle and lower range of statistics
data
TABLE I. AVAILABLE POTENTIAL OF GROUND-WATER OF KABUL CITY
Aquifers' name Water resources availability
Logar 24.64
Allaudin and upper Kabul 12.48
Afshar 3.65
Lower Kabul 3.65
Total 44.42
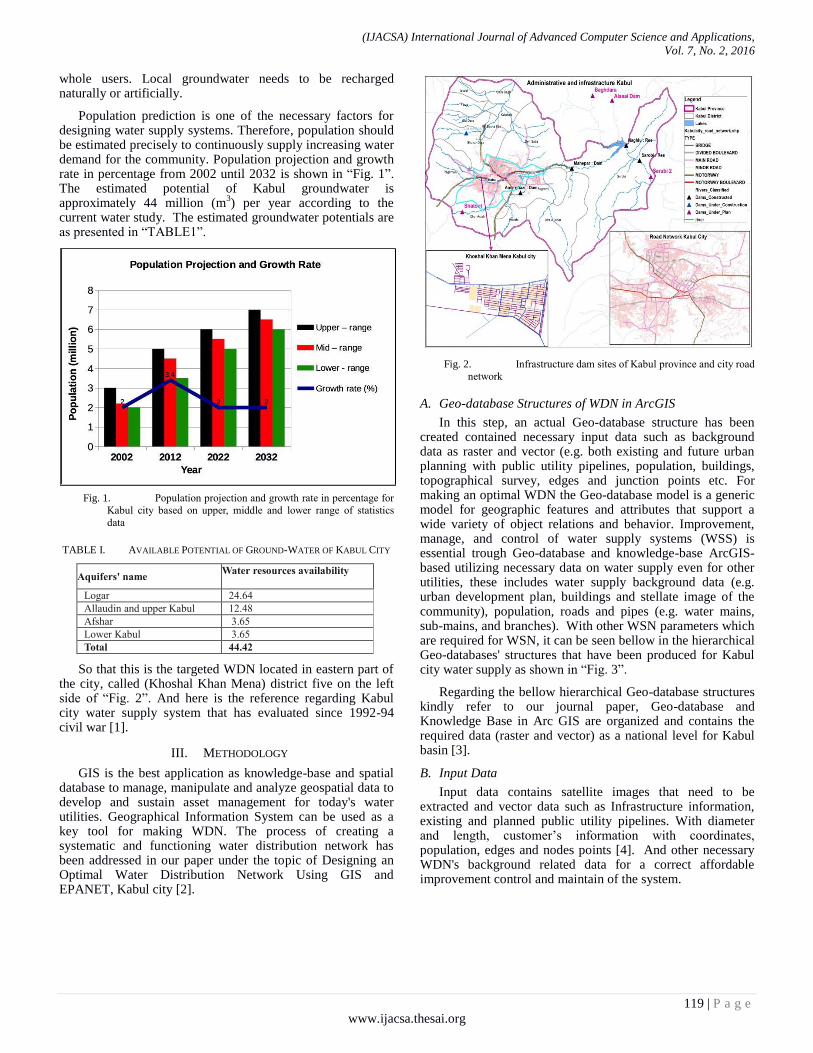
So that this is the targeted WDN located in eastern part of the city, called (Khoshal Khan Mena) district five on the left side of “Fig. 2”. And here is the reference regarding Kabul city water supply system that has evaluated since 1992-94 civil war [1].
III. METHODOLOGY
GIS is the best application as knowledge-base and spatial database to manage, manipulate and analyze geospatial data to develop and sustain asset management for today's water utilities. Geographical Information System can be used as a key tool for making WDN. The process of creating a systematic and functioning water distribution network has been addressed in our paper under the topic of Designing an Optimal Water Distribution Network Using GIS and EPANET, Kabul city [2].
Fig. 2. Infrastructure dam sites of Kabul province and city road
network
A. Geo-database Structures of WDN in ArcGIS
In this step, an actual Geo-database structure has been created contained necessary input data such as background data as raster and vector (e.g. both existing and future urban planning with public utility pipelines, population, buildings, topographical survey, edges and junction points etc. For making an optimal WDN the Geo-database model is a generic model for geographic features and attributes that support a wide variety of object relations and behavior. Improvement, manage, and control of water supply systems (WSS) is essential trough Geo-database and knowledge-base ArcGIS-based utilizing necessary data on water supply even for other utilities, these includes water supply background data (e.g. urban development plan, buildings and stellate image of the community), population, roads and pipes (e.g. water mains, sub-mains, and branches). With other WSN parameters which are required for WSN, it can be seen bellow in the hierarchical Geo-databases' structures that have been produced for Kabul city water supply as shown in “Fig. 3”.
Regarding the bellow hierarchical Geo-database structures kindly refer to our journal paper, Geo-database and Knowledge Base in Arc GIS are organized and contains the required data (raster and vector) as a national level for Kabul basin [3].
B. Input Data
Input data contains satellite images that need to be extracted and vector data such as Infrastructure information, existing and planned public utility pipelines. With diameter and length, customer’s information with coordinates, population, edges and nodes points [4]. And other necessary WDN's background related data for a correct affordable improvement control and maintain of the system.
(IJACSA) International Journal of Advanced Computer Science and Applications,
Vol. 7, No. 2, 2016
120 | P a g e
www.ijacsa.thesai.org
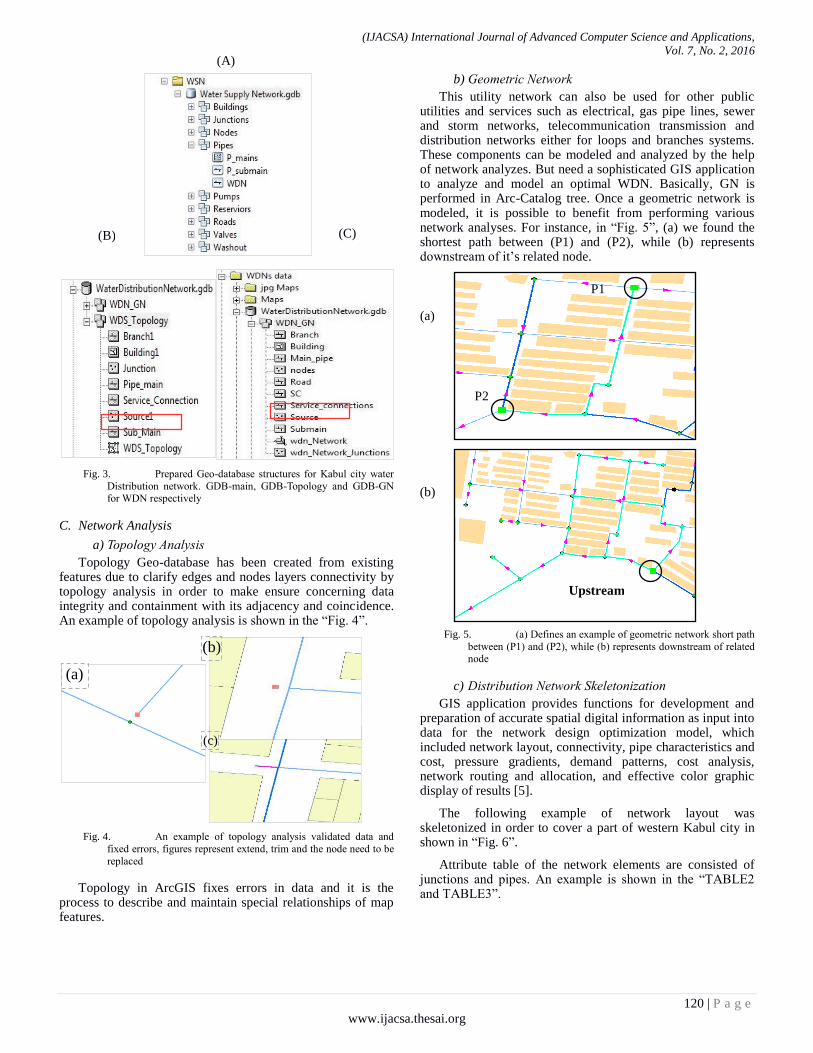
Fig. 3. Prepared Geo-database structures for Kabul city water
Distribution network. GDB-main, GDB-Topology and GDB-GN for WDN respectively
C. Network Analysis
a) Topology Analysis
Topology Geo-database has been created from existing features due to clarify edges and nodes layers connectivity by topology analysis in order to make ensure concerning data integrity and containment with its adjacency and coincidence. An example of topology analysis is shown in the “Fig. 4”.
Fig. 4. An example of topology analysis validated data and
fixed errors, figures represent extend, trim and the node need to be
replaced
Topology in ArcGIS fixes errors in data and it is the process to describe and maintain special relationships of map features.
b) Geometric Network
This utility network can also be used for other public utilities and services such as electrical, gas pipe lines, sewer and storm networks, telecommunication transmission and distribution networks either for loops and branches systems. These components can be modeled and analyzed by the help of network analyzes. But need a sophisticated GIS application to analyze and model an optimal WDN. Basically, GN is performed in Arc-Catalog tree. Once a geometric network is modeled, it is possible to benefit from performing various network analyses. For instance, in “Fig. 5”, (a) we found the shortest path between (P1) and (P2), while (b) represents downstream of it’s related node.
Fig. 5. (a) Defines an example of geometric network short path
between (P1) and (P2), while (b) represents downstream of related node
c) Distribution Network Skeletonization
GIS application provides functions for development and preparation of accurate spatial digital information as input into data for the network design optimization model, which included network layout, connectivity, pipe characteristics and cost, pressure gradients, demand patterns, cost analysis, network routing and allocation, and effective color graphic display of results [5].
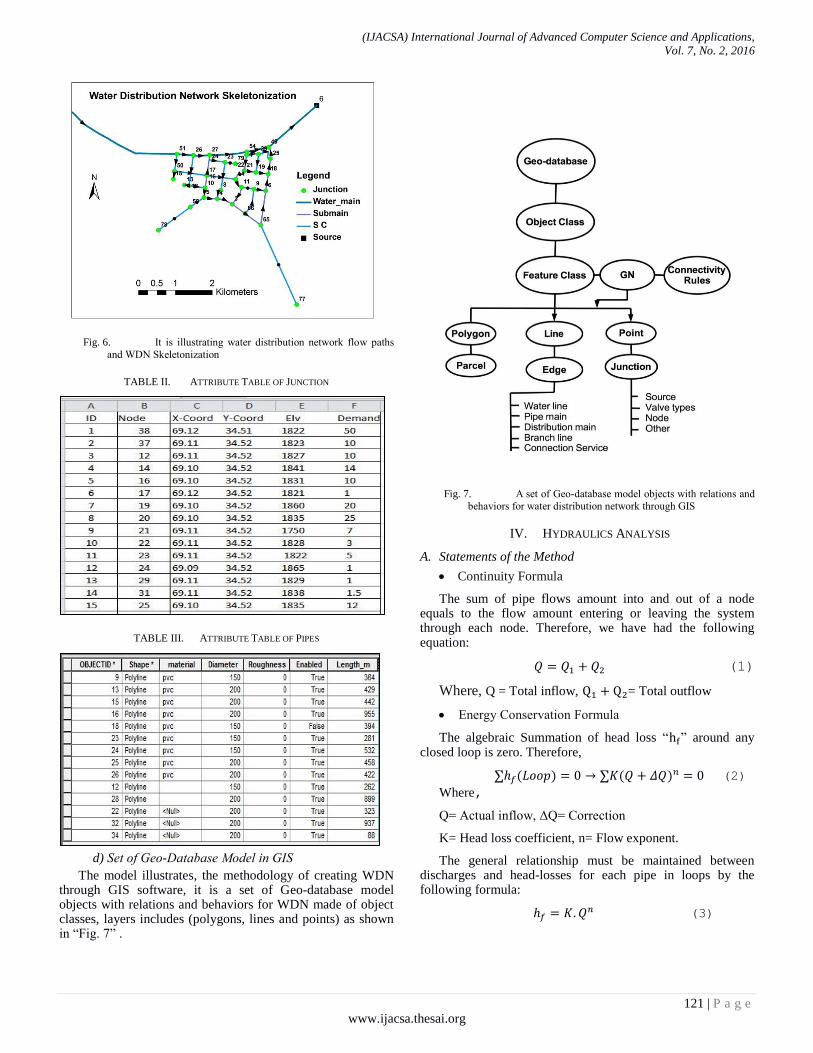
The following example of network layout was skeletonized in order to cover a part of western Kabul city in shown in “Fig. 6”.
Attribute table of the network elements are consisted of junctions and pipes. An example is shown in the “TABLE2 and TABLE3”.
(a)
(a)
(C)
(A)
(c)
(b)
Upstream
P1
P2
(b)
(B)
(IJACSA) International Journal of Advanced Computer Science and Applications,
Vol. 7, No. 2, 2016
121 | P a g e
www.ijacsa.thesai.org
Fig. 6. It is illustrating water distribution network flow paths
and WDN Skeletonization
TABLE II. ATTRIBUTE TABLE OF JUNCTION
TABLE III. ATTRIBUTE TABLE OF PIPES
d) Set of Geo-Database Model in GIS
The model illustrates, the methodology of creating WDN through GIS software, it is a set of Geo-database model objects with relations and behaviors for WDN made of object classes, layers includes (polygons, lines and points) as shown in “Fig. 7” .
Fig. 7. A set of Geo-database model objects with relations and
behaviors for water distribution network through GIS
IV. HYDRAULICS ANALYSIS
A. Statements of the Method
Continuity Formula
The sum of pipe flows amount into and out of a node equals to the flow amount entering or leaving the system through each node. Therefore, we have had the following equation:
𝑄 = 𝑄1 + 𝑄2 (1)
Where, Q = Total inflow, 1 + 2= Total outflow
Energy Conservation Formula
The algebraic Summation of head loss “ ” around any closed loop is zero. Therefore,
= 𝑄 + 𝑄 = (2)
Where,
Q= Actual inflow, ΔQ= Correction
K= Head loss coefficient, n= Flow exponent.
The general relationship must be maintained between discharges and head-losses for each pipe in loops by the following formula:
= 𝑄 (3)
(IJACSA) International Journal of Advanced Computer Science and Applications,
Vol. 7, No. 2, 2016
122 | P a g e
www.ijacsa.thesai.org
These pressure heads loss equations have commonly been using by EPANET hydraulic solutions.
Darcy-Weisbach Equation
=8 L
𝑔𝛱2𝐷5, n= 2 (4)
Exponential friction Equation (Hazen-William)
=10 67
𝐶1 85𝐷4 87, n= 1.85 (5)
𝑄 =− ℎ
2 ℎ 𝑄⁄ (6)
Where,
C= Equivalent resistance,
D= Internal pipe diameter
L= Pipe length,
g= Gravitational acceleration, f= Friction factor.
V. METHOD PROCEDURE AND APPROACH
D. Divided the network into loops (e.g. loop1, loop2, etc)
E. For each loops done the fallowing steps
1) Assumed flow, flow direction in pipes, flow direction
for loops whether positive (clockwise) or negative (counter-
clockwise) applying continuity equation at each node.
Estimated pipe flows are connected with iteration until head
losses in the clockwise direction are equal to the counter-
clockwise direction in each loop.
2) Need to calculate equivalent resistance "K” for each
pipe based on given parameters as demand at each node, pipe
diameter and pipe length, temperature with pipe material.
3) Calculate = 𝑄 for each pipe. Retain sign from
“(1)” and compute sum for loops “hf”.
4) Compute ∣ 𝑄⁄ ∣ for each pipe and sum for each
loop ∣ 𝑄⁄ ∣. 5) Calculate correction by the fallowing formula
𝑄 = − 𝑛∑ ∣ 𝑄⁄ ∣ ⁄
6) Applying correction to Qnew= Q+ΔQ
7) Repeat step” (3) to (6)” until Δ become very small.
8) Ultimately solve for pressure at each node using energy
method. The above method is known as Hardy-cross method in
hydraulics and this method is applicable to closed loop systems [6]. Hardy-Cross (1885-1951), who was a professor of civil engineering at the university of Illinois, Urbana-Champaign, presented in 1936 a method for the analysis of looped pipe network with specified inflow and outflows ( fair et al., 1981) [7], [8].
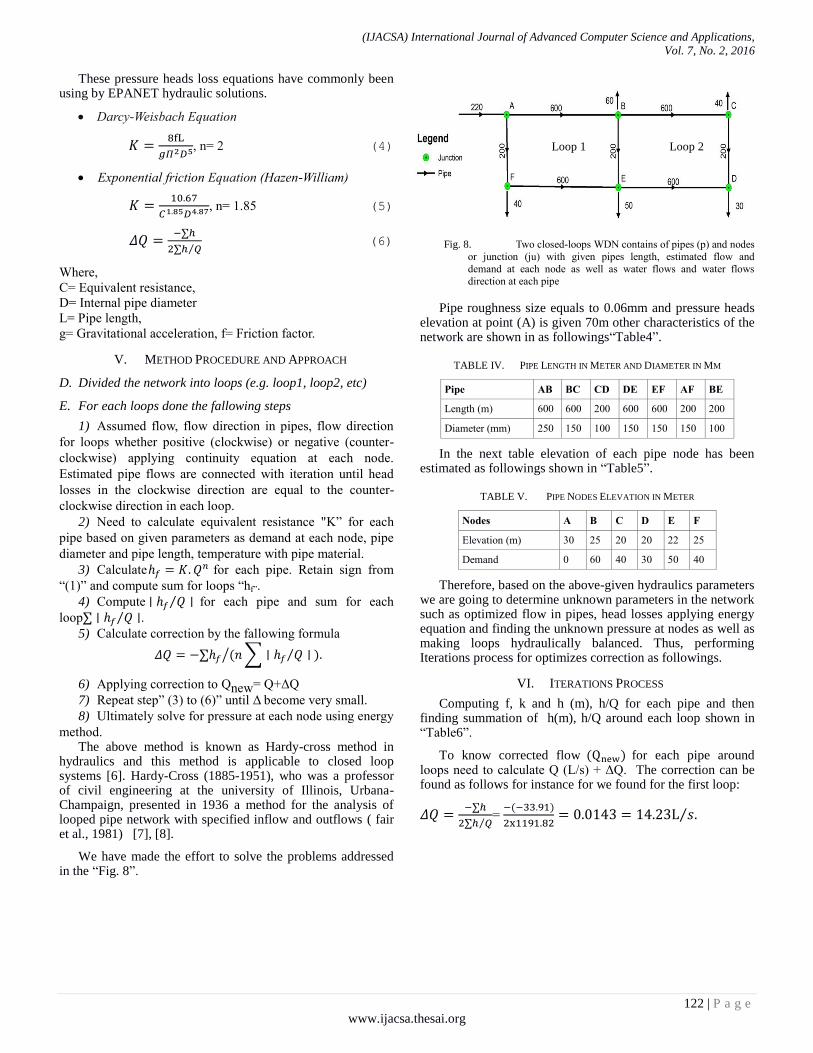
We have made the effort to solve the problems addressed in the “Fig. 8”.
Fig. 8. Two closed-loops WDN contains of pipes (p) and nodes
or junction (ju) with given pipes length, estimated flow and
demand at each node as well as water flows and water flows
direction at each pipe
Pipe roughness size equals to 0.06mm and pressure heads elevation at point (A) is given 70m other characteristics of the network are shown in as followings“Table4”.
TABLE IV. PIPE LENGTH IN METER AND DIAMETER IN MM
Pipe AB BC CD DE EF AF BE
Length (m) 600 600 200 600 600 200 200
Diameter (mm) 250 150 100 150 150 150 100
In the next table elevation of each pipe node has been estimated as followings shown in “Table5”.
TABLE V. PIPE NODES ELEVATION IN METER
Nodes A B C D E F
Elevation (m) 30 25 20 20 22 25
Demand 0 60 40 30 50 40
Therefore, based on the above-given hydraulics parameters we are going to determine unknown parameters in the network such as optimized flow in pipes, head losses applying energy equation and finding the unknown pressure at nodes as well as making loops hydraulically balanced. Thus, performing Iterations process for optimizes correction as followings.
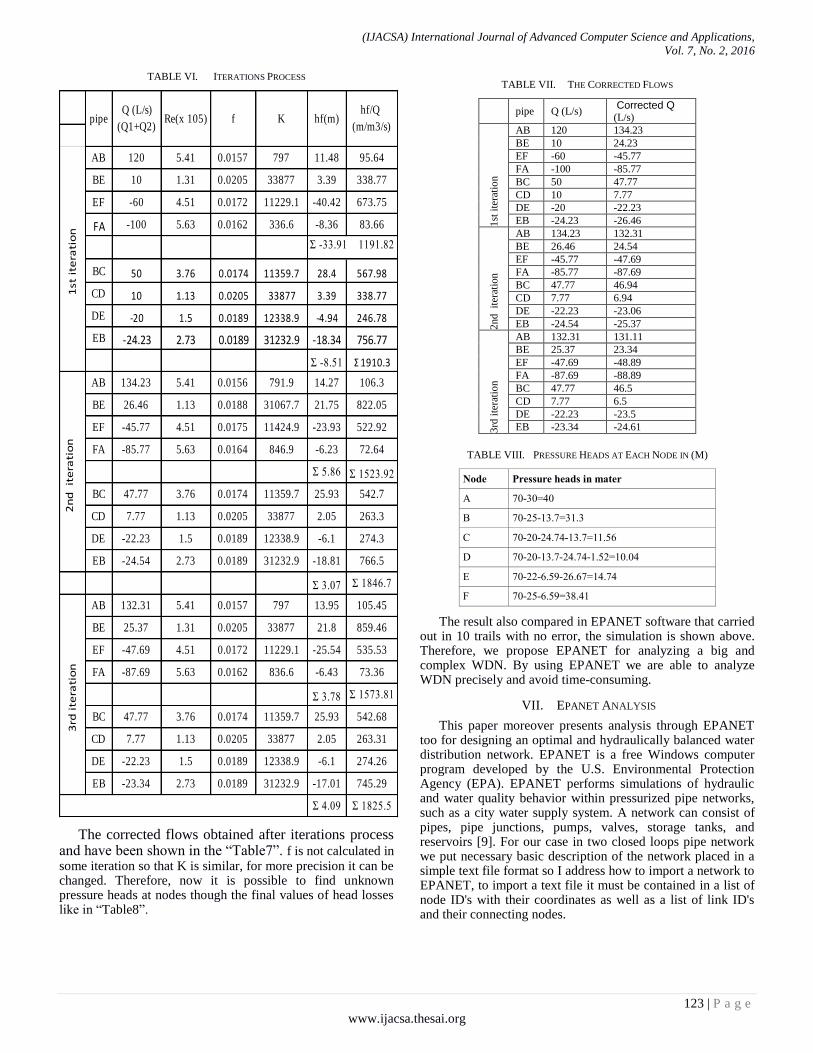
VI. ITERATIONS PROCESS
Computing f, k and h (m), h/Q for each pipe and then finding summation of h(m), h/Q around each loop shown in “Table6”.
To know corrected flow for each pipe around loops need to calculate Q (L/s) + ΔQ. The correction can be found as follows for instance for we found for the first loop:
𝑄 =− ℎ
2 ℎ 𝑄⁄=
− −33 91
2x1191 82= 143 = 14 23L 𝑠 ⁄
Loop 1 Loop 2
(IJACSA) International Journal of Advanced Computer Science and Applications,
Vol. 7, No. 2, 2016
123 | P a g e
www.ijacsa.thesai.org
TABLE VI. ITERATIONS PROCESS
The corrected flows obtained after iterations process and have been shown in the “Table7”. f is not calculated in some iteration so that K is similar, for more precision it can be changed. Therefore, now it is possible to find unknown pressure heads at nodes though the final values of head losses like in “Table8”.
TABLE VII. THE CORRECTED FLOWS
pipe Q (L/s) Corrected Q (L/s)
1st
ite
rati
on
AB 120 134.23
BE 10 24.23
EF -60 -45.77
FA -100 -85.77
BC 50 47.77
CD 10 7.77
DE -20 -22.23
EB -24.23 -26.46
2nd
it
erat
ion
AB 134.23 132.31
BE 26.46 24.54
EF -45.77 -47.69
FA -85.77 -87.69
BC 47.77 46.94
CD 7.77 6.94
DE -22.23 -23.06
EB -24.54 -25.37
3rd
ite
rati
on
AB 132.31 131.11
BE 25.37 23.34
EF -47.69 -48.89
FA -87.69 -88.89
BC 47.77 46.5
CD 7.77 6.5
DE -22.23 -23.5
EB -23.34 -24.61
TABLE VIII. PRESSURE HEADS AT EACH NODE IN (M)
Node Pressure heads in mater
A 70-30=40
B 70-25-13.7=31.3
C 70-20-24.74-13.7=11.56
D 70-20-13.7-24.74-1.52=10.04
E 70-22-6.59-26.67=14.74
F 70-25-6.59=38.41
The result also compared in EPANET software that carried out in 10 trails with no error, the simulation is shown above. Therefore, we propose EPANET for analyzing a big and complex WDN. By using EPANET we are able to analyze WDN precisely and avoid time-consuming.
VII. EPANET ANALYSIS
This paper moreover presents analysis through EPANET too for designing an optimal and hydraulically balanced water distribution network. EPANET is a free Windows computer program developed by the U.S. Environmental Protection Agency (EPA). EPANET performs simulations of hydraulic and water quality behavior within pressurized pipe networks, such as a city water supply system. A network can consist of pipes, pipe junctions, pumps, valves, storage tanks, and reservoirs [9]. For our case in two closed loops pipe network we put necessary basic description of the network placed in a simple text file format so I address how to import a network to EPANET, to import a text file it must be contained in a list of node ID's with their coordinates as well as a list of link ID's and their connecting nodes.
AB 120 5.41 0.0157 797 11.48 95.64
BE 10 1.31 0.0205 33877 3.39 338.77
EF -60 4.51 0.0172 11229.1 -40.42 673.75
FA -100 5.63 0.0162 336.6 -8.36 83.66
Σ -33.91 1191.82
BC 50 3.76 0.0174 11359.7 28.4 567.98
CD 10 1.13 0.0205 33877 3.39 338.77
DE -20 1.5 0.0189 12338.9 -4.94 246.78
EB -24.23 2.73 0.0189 31232.9 -18.34 756.77
Σ -8.51 Σ 1910.3
AB 134.23 5.41 0.0156 791.9 14.27 106.3
BE 26.46 1.13 0.0188 31067.7 21.75 822.05
EF -45.77 4.51 0.0175 11424.9 -23.93 522.92
FA -85.77 5.63 0.0164 846.9 -6.23 72.64
Σ 5.86 Σ 1523.92
BC 47.77 3.76 0.0174 11359.7 25.93 542.7
CD 7.77 1.13 0.0205 33877 2.05 263.3
DE -22.23 1.5 0.0189 12338.9 -6.1 274.3
EB -24.54 2.73 0.0189 31232.9 -18.81 766.5
Σ 3.07 Σ 1846.7
AB 132.31 5.41 0.0157 797 13.95 105.45
BE 25.37 1.31 0.0205 33877 21.8 859.46
EF -47.69 4.51 0.0172 11229.1 -25.54 535.53
FA -87.69 5.63 0.0162 836.6 -6.43 73.36
Σ 3.78 Σ 1573.81
BC 47.77 3.76 0.0174 11359.7 25.93 542.68
CD 7.77 1.13 0.0205 33877 2.05 263.31
DE -22.23 1.5 0.0189 12338.9 -6.1 274.26
EB -23.34 2.73 0.0189 31232.9 -17.01 745.29
Σ 4.09 Σ 1825.5
K hf(m)pipe
1st
ite
rati
on
2n
d
ite
rati
on
3rd
ite
rati
on
hf/Q
(m/m3/s)
Q (L/s)
(Q1+Q2)Re(x 105) f
(IJACSA) International Journal of Advanced Computer Science and Applications,
Vol. 7, No. 2, 2016
124 | P a g e
www.ijacsa.thesai.org
Note that only junctions and pipes are represented. Other network elements, such as reservoirs and pumps, can either be imported as junctions or pipes and converted later on or simply be added in later on. The user is responsible for transferring any data generated from a CAD or GIS package into a text file with the format shown below [9]. EPANET tracks the flow of water in each pipe, the pressure in each node, and the height of water in each tank or reservoir during a simulation period consisting of multiple time steps. Consequently, how to organize project's scenario looks like bellow:
[Junctions]
;id Elev. Demand ;--------------------------------
1 30 0
2 25 60
3 20 40
4 20 30
5 22 50 6 25 40
[Coordinates]
;id x-coord Y-coord
;---------------------------------------------
1 -11264937.393 5371052.628
2 -11264472.173 5371051.188
3 -11264011.274 5371052.628
4 -11264009.834 5370817.857
5 -11264470.747 5370818.241
6 -11264934.549 5370822.302
[Pipes]
;id Nodel1 Nodel2 Length Diam Roughness
;------------------------------------------------------------ 1 1 2 600 250 0.006
2 2 3 600 150 0.006
3 3 4 200 100 0.006 4 1 6 200 150 0.006
5 6 5 600 150 0.006
6 2 5 200 100 0.006 7 5 4 600 100 0.006
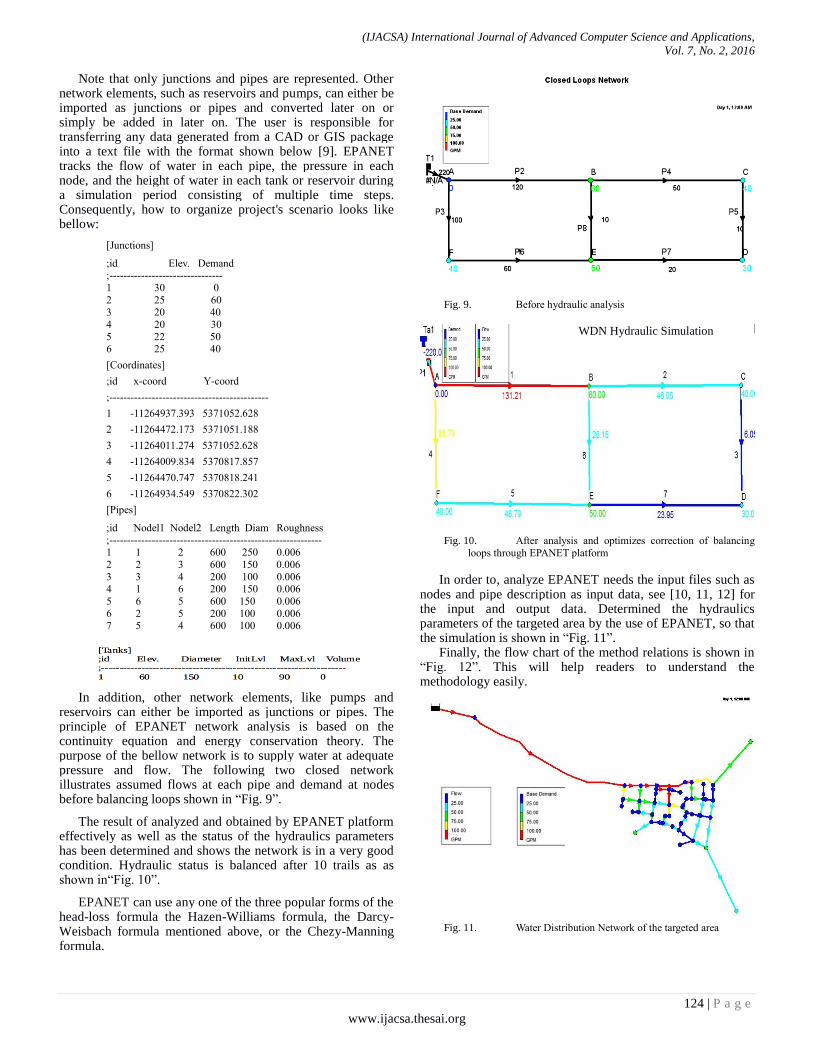
In addition, other network elements, like pumps and reservoirs can either be imported as junctions or pipes. The principle of EPANET network analysis is based on the continuity equation and energy conservation theory. The purpose of the bellow network is to supply water at adequate pressure and flow. The following two closed network illustrates assumed flows at each pipe and demand at nodes before balancing loops shown in “Fig. 9”.
The result of analyzed and obtained by EPANET platform effectively as well as the status of the hydraulics parameters has been determined and shows the network is in a very good condition. Hydraulic status is balanced after 10 trails as as shown in“Fig. 10”.
EPANET can use any one of the three popular forms of the head-loss formula the Hazen-Williams formula, the Darcy-Weisbach formula mentioned above, or the Chezy-Manning formula.
Fig. 9. Before hydraulic analysis
Fig. 10. After analysis and optimizes correction of balancing
loops through EPANET platform
In order to, analyze EPANET needs the input files such as nodes and pipe description as input data, see [10, 11, 12] for the input and output data. Determined the hydraulics parameters of the targeted area by the use of EPANET, so that the simulation is shown in “Fig. 11”.
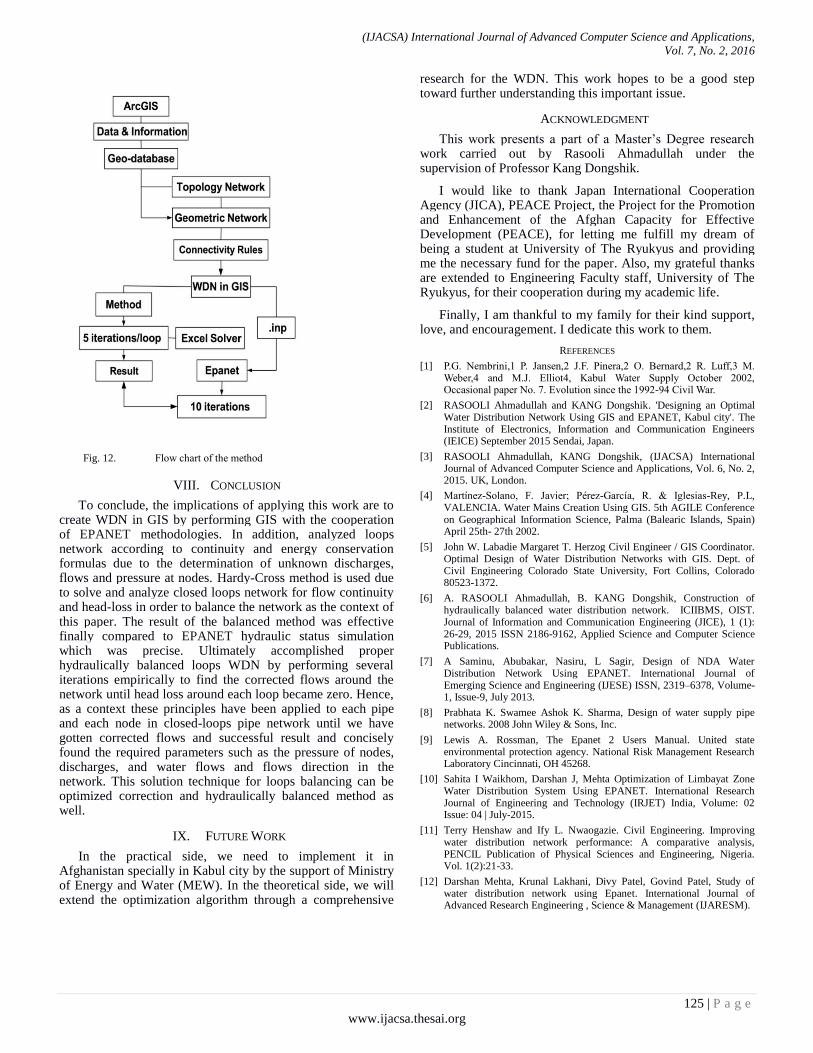
Finally, the flow chart of the method relations is shown in “Fig. 12”. This will help readers to understand the methodology easily.
Fig. 11. Water Distribution Network of the targeted area
WDN Hydraulic Simulation
(IJACSA) International Journal of Advanced Computer Science and Applications,
Vol. 7, No. 2, 2016
125 | P a g e
www.ijacsa.thesai.org
Fig. 12. Flow chart of the method
VIII. CONCLUSION
To conclude, the implications of applying this work are to create WDN in GIS by performing GIS with the cooperation of EPANET methodologies. In addition, analyzed loops network according to continuity and energy conservation formulas due to the determination of unknown discharges, flows and pressure at nodes. Hardy-Cross method is used due to solve and analyze closed loops network for flow continuity and head-loss in order to balance the network as the context of this paper. The result of the balanced method was effective finally compared to EPANET hydraulic status simulation which was precise. Ultimately accomplished proper hydraulically balanced loops WDN by performing several iterations empirically to find the corrected flows around the network until head loss around each loop became zero. Hence, as a context these principles have been applied to each pipe and each node in closed-loops pipe network until we have gotten corrected flows and successful result and concisely found the required parameters such as the pressure of nodes, discharges, and water flows and flows direction in the network. This solution technique for loops balancing can be optimized correction and hydraulically balanced method as well.
IX. FUTURE WORK
In the practical side, we need to implement it in Afghanistan specially in Kabul city by the support of Ministry of Energy and Water (MEW). In the theoretical side, we will extend the optimization algorithm through a comprehensive
research for the WDN. This work hopes to be a good step toward further understanding this important issue.
ACKNOWLEDGMENT
This work presents a part of a Master’s Degree research work carried out by Rasooli Ahmadullah under the supervision of Professor Kang Dongshik.
I would like to thank Japan International Cooperation Agency (JICA), PEACE Project, the Project for the Promotion and Enhancement of the Afghan Capacity for Effective Development (PEACE), for letting me fulfill my dream of being a student at University of The Ryukyus and providing me the necessary fund for the paper. Also, my grateful thanks are extended to Engineering Faculty staff, University of The Ryukyus, for their cooperation during my academic life.
Finally, I am thankful to my family for their kind support, love, and encouragement. I dedicate this work to them.
REFERENCES
[1] P.G. Nembrini,1 P. Jansen,2 J.F. Pinera,2 O. Bernard,2 R. Luff,3 M. Weber,4 and M.J. Elliot4, Kabul Water Supply October 2002, Occasional paper No. 7. Evolution since the 1992-94 Civil War.
[2] RASOOLI Ahmadullah and KANG Dongshik. 'Designing an Optimal Water Distribution Network Using GIS and EPANET, Kabul city'. The Institute of Electronics, Information and Communication Engineers (IEICE) September 2015 Sendai, Japan.
[3] RASOOLI Ahmadullah, KANG Dongshik, (IJACSA) International Journal of Advanced Computer Science and Applications, Vol. 6, No. 2, 2015. UK, London.
[4] Mart nez-Solano, F. Javier; P rez-Garc a, R. Iglesias-Rey, P.L, VALENCIA. Water Mains Creation Using GIS. 5th AGILE Conference on Geographical Information Science, Palma (Balearic Islands, Spain) April 25th- 27th 2002.
[5] John W. Labadie Margaret T. Herzog Civil Engineer / GIS Coordinator. Optimal Design of Water Distribution Networks with GIS. Dept. of Civil Engineering Colorado State University, Fort Collins, Colorado 80523-1372.
[6] A. RASOOLI Ahmadullah, B. KANG Dongshik, Construction of hydraulically balanced water distribution network. ICIIBMS, OIST. Journal of Information and Communication Engineering (JICE), 1 (1): 26-29, 2015 ISSN 2186-9162, Applied Science and Computer Science Publications.
[7] A Saminu, Abubakar, Nasiru, L Sagir, Design of NDA Water Distribution Network Using EPANET. International Journal of Emerging Science and Engineering (IJESE) ISSN, 2319–6378, Volume-1, Issue-9, July 2013.
[8] Prabhata K. Swamee Ashok K. Sharma, Design of water supply pipe networks. 2008 John Wiley & Sons, Inc.
[9] Lewis A. Rossman, The Epanet 2 Users Manual. United state environmental protection agency. National Risk Management Research Laboratory Cincinnati, OH 45268.
[10] Sahita I Waikhom, Darshan J, Mehta Optimization of Limbayat Zone Water Distribution System Using EPANET. International Research Journal of Engineering and Technology (IRJET) India, Volume: 02 Issue: 04 | July-2015.
[11] Terry Henshaw and Ify L. Nwaogazie. Civil Engineering. Improving water distribution network performance: A comparative analysis, PENCIL Publication of Physical Sciences and Engineering, Nigeria. Vol. 1(2):21-33.
[12] Darshan Mehta, Krunal Lakhani, Divy Patel, Govind Patel, Study of water distribution network using Epanet. International Journal of Advanced Research Engineering , Science & Management (IJARESM).